OREGON PLAN for THE. Salmon and Watersheds. Assessment of Western Oregon Adult Winter Steelhead and Lamprey Redd Surveys 2017
|
|
|
- Shannon Morrison
- 6 years ago
- Views:
Transcription


1 THE OREGON PLAN for Salmon and Watersheds Assessment of Western Oregon Adult Winter Steelhead and Lamprey Redd Surveys 2017 Report Number: OPSW-ODFW
2 The Oregon Department of Fish and Wildlife prohibits discrimination in all of its programs and services on the basis of race, color, national origin, age, sex or disability. If you believe that you have been discriminated against as described above in any program, activity, or facility, please contact the ADA Coordinator, 4034 Industrial Drive SE, Salem, OR 97302, This material will be furnished in alternate format for people with disabilities if needed. Please call (541) to request.
3 Assessment of Western Oregon Adult Winter Steelhead and Lamprey Redd Surveys 2017 Oregon Plan for Salmon and Watersheds Monitoring Report No. OPSW-ODFW December 2017 Eric Brown Ryan Jacobsen Jonathan Nott Matt Weeber Mark Lewis Oregon Adult Salmonid Inventory and Sampling Project Western Oregon Research and Monitoring Program Oregon Department of Fish and Wildlife Highway 34 Corvallis, OR Citation: Brown E, R Jacobsen, J. Nott, M. Weeber and M. Lewis Assessment of Western Oregon Adult Winter Steelhead and Lamprey Redd Surveys Monitoring Program Report Number OPSW- ODFW Oregon Department of Fish and Wildlife, Salem, Oregon.
4 Table of Contents Page SUMMARY... 1 INTRODUCTION AND METHODS... 1 RESULTS AND DISCUSSION... 3 Southwest Washington ESU... 5 Lower Columbia ESU... 7 Oregon Coast DPS Steelhead Escapement LAMPREY MONITORING Lower Columbia Pacific Lamprey Oregon Coast Pacific Lamprey REFERENCES APPENDIX i
5 List of Figures Figure 1. Geographic scope of steelhead spawner monitoring, Figure 2. Winter steelhead wild redd estimates in the Oregon portions of the LCR and SWW ESUs based on random surveys, 2004 to Figure 3. Winter steelhead wild redd estimates in the Clackamas and Sandy River populations based on random surveys, 2004 to Figure 4. Steelhead redd density (redds per mile) in random surveys in 2017 by population in the LCR and SWW ESU s...11 Figure 5. Percentage of hatchery steelhead found in random surveys in the LCR and SWW ESUs in Figure 6. Proportion of the maximum winter steelhead redd count in each of the Lower Columbia populations by week of the year in Figure 7. Estimated number of wild winter steelhead redds in the Oregon Coast DPS, 2003 to Figure 8. Steelhead redd density (redds per mile) in random surveys in 2017 by monitoring area in the Coastal and KMP DPS s...15 Figure 9. Percentage hatchery steelhead found in random surveys in each of the six Coastal and KMP monitoring areas in Figure 10. Proportions of the maximum winter steelhead redd count in each of the four Coastal areas by two-week period in Figure 11. Stream discharge at Alsea River near Tidewater during 2017, compared to mean discharge from 1940 to Figure 12. Lower Columbia Pacific Lamprey Peak Redd Density in Random Steelhead Spawning Surveys, Figure 13. Lower Columbia Pacific Lamprey spawn timing in random steelhead surveys in 2017 and average daily max water temperature in the Clackamas River...20 Figure 14. Oregon coast Pacific Lamprey peak redd density and percent of sites occupied in random steelhead spawning surveys, 2003 to Figure 15. Oregon coast Pacific Lamprey spawn timing in index surveys...21 List of Tables Table 1. Site status by monitoring area or population in Table 2. Oregon winter steelhead redd abundance estimates in Table 3. Oregon winter steelhead redd density and percent occupancy in Table 4. Number of known fin-mark status steelhead observed on spawning grounds, and resulting percent hatchery fish in Table 5. Oregon winter steelhead fish abundance estimates in ii
6 SUMMARY This report provides a summary of results from winter steelhead spawning ground surveys conducted in Lower Columbia (Oregon side) and Oregon Coast basins in Also included is a brief summary of lamprey data collected from the same monitoring efforts. Precision goals were met (95% C.I. ± 30% of point estimate) for the steelhead estimate in the Oregon Coast (OC) Distinct Population Segment (DPS), but precision goals were not met in the Southwest Washington (SWW) Evolutionarily Significant Unit (ESU) nor in the Lower Columbia River (LCR) ESU. Surveys were not conducted in the Klamath Mountains Province (KMP) DPS for Winter steelhead redd estimates for the 2017 spawning year were less than 50% of both the 5-year and 10-year averages for the Oregon Coast DPS. We do not have long-term data on winter steelhead redd abundance in the Lower Columbia, but 2017 estimates in the SWW ESU and LC ESU were lower than the five year average. Indices for Pacific Lamprey were lower in 2017 compared to recent years. Weather and stream flows made for challenging survey conditions throughout the 2017 season. Regional patterns are apparent for redd density, proportion of hatchery origin spawners and spawn timing. INTRODUCTION AND METHODS As part of the Oregon Plan for Salmon and Watersheds, the Oregon Department of Fish and Wildlife (ODFW) initiated a project to monitor spawning winter steelhead (Oncorhynchus mykiss) in coastal Oregon streams in 2003 under the Oregon Adult Salmonid Inventory and Sampling (OASIS) project. The project is designed to assess yearly status and trend in abundance, proportion of hatchery origin spawners (phos), and distribution of winter steelhead spawners in four Oregon ESU/DPS units (Figure 1). The Southwest Washington and Lower Columbia ESU s are currently monitored at the population scale, though funding limited efforts in 2017 to only the Clatskanie, Scappoose, Clackamas, and Sandy populations. No monitoring occurred in the Youngs Bay, Big Creek, Gorge, or Hood populations. In the Oregon Coast DPS, monitoring is evaluated at the monitoring area (MA) scale, and at the population scale in the Nestucca population. The KMP DPS was not monitored in A spatially balanced probabilistic sampling design (Stevens 2002) was used to randomly select survey sites across a stream network of winter steelhead spawning habitat. The selection frame was developed using professional knowledge from a variety of private and governmental biologists. Within the sampling frame there are/were dams or fish traps where counts of fish are available, including: River Mill (Clackamas River), Marmot (Sandy River), Winchester (North Umpqua River) and Gold Ray (Rogue River) dams, Bonnie Falls Trap (Scappoose River), and Big Creek Hatchery Weir. Counts of steelhead passed upstream are used for monitoring these areas rather than spawning surveys. This report provides results for surveys outside those areas. In accordance with prior work conducted by ODFW in coastal streams, monitoring of winter steelhead abundance is based on counts of redds, with rearing origin determined from live and dead fish (Susac and Jacobs 1999). Repeat visits to each site from at least February through May generate a total redd count for each survey. Sites are visited at least once every fourteen days (Susac and Jacobs 1999). Redds are marked with colored rocks and flagging to prevent recounting during subsequent surveys. Specific descriptions of project protocols can be found in the annual survey procedures manual (ODFW 2017). 1
, Dependent Population Segment (DPS), Monitoring Areas (MA), and")
7 Figure 1. Geographic scope of steelhead spawner monitoring, Monitoring scales include: Evolutionary Significant Unit (ESU), Dependent Population Segment (DPS), Monitoring Areas (MA), and population. Areas without color were not monitored in
8 The geographic scale of monitoring used in this report (Figure 1) is based on a variety of sources. Boundaries for the four ESU/DPS units are as determined by the National Oceanic and Atmospheric Administration (Busby et.al. 1996). Population boundaries are based on Myers et al. (2006) for the LCR ESU population structure and the 2005 Oregon Native Fish Status Report (ODFW 2005) for other populations. Monitoring area boundaries match those used for Coho salmon monitoring by the OASIS project (Lewis et. al. 2009). Sites adjacent to hatcheries and/or their acclimation areas tend to have a higher proportion of both hatchery fish and redd densities. This uneven distribution of hatchery fish can bias estimates of abundance and phos unless accounted for in sampling protocols. In order to reduce bias and increase accuracy within our winter steelhead estimates, we initiated the use of a stratified approach to sampling protocols for steelhead monitoring in These efforts differ slightly between the Lower Columbia ESU s and Oregon Coast DPS. In the SWW ESU stratification will be conducted in the Clatskanie population, but will be divided into two strata: Plympton Creek and the remaining Clatskanie basin. There are no hatchery steelhead releases in the Clatskanie population and hatchery fish are typically abundant only in Plympton Creek. In the LCR ESU, in each of the Sandy and Clackamas populations, strata will be defined as migration corridors, areas adjacent to hatchery releases, and the remaining portions of each population (i.e. areas outside of direct hatchery influence). All three strata will initially be calculated individually, but subsequently rolled up into the final population and ESU estimates. In the OC DPS, the ODFW Coastal Multi-Species Conservation and Management Plan (CMP) allows for higher maximum phos rates in areas adjacent to acclimated hatchery release sites (ODFW 2014). These areas are known as hatchery Hot-Spots. Stratification of Hot-Spots aids in reducing estimate bias associated with acclimated hatchery releases within the MA. It also allows ODFW to assess the management goals for both the MA and the Hot-Spots separately, as prescribed by the CMP. Implementation of this stratification will result in abundance and phos estimates for the areas of each MA that are outside of these Hot-Spots. Estimates within the Hot-Spots are presented in Appendix Table A-3 for those MA s where two or more sites are successfully surveyed. RESULTS AND DISCUSSION This report contains population level summaries for the SWW and LCR ESU s and a monitoring area level summary for the OC steelhead DPS. Counts of adult lamprey and lamprey redds are recorded during steelhead surveys and the results are included in a brief summary at the end of this report. A total of 223 sites were successfully surveyed in 2017, split between the three steelhead DPS/ESU areas monitored (Table 1). Successful surveys represent 47% of the 473 total sites selected for Sites were selected at a rate of 1/24 miles of habitat in the Oregon Coast DPS. Selection densities were greater in the two Lower Columbia ESU s (1/4 in the LCR, and 1/2 in the SWW). Twelve percent of sites in 2017 were not surveyed because of landowner access 3
9 restrictions. The proportion of sites that were surveyed, but were not used in final estimates due to turbidity and/or large gaps between survey dates averaged 25.5%, ranging from 0.9% in the North Coast MA to 43.3% in the Lower Columbia ESU. The percentage of sites that were outside of steelhead spawning habitat averaged 7% across the three DPS/ESU areas, ranging from 2.2% in the Lower Columbia ESU to 13.1% in the Oregon Coast DPS. Table 1. Site status by monitoring area or population in Target sites were within and nontarget sites were outside of steelhead spawning habitat. Response sites were successfully surveyed. Non-response sites couldn t be surveyed, or were not successfully surveyed. DPS/ESU Southwest Washington Lower Columbia River Oregon Coast b Klamath Mountains Province a Monitoring Area or Population Target Response Target Nonresponse Nontarget Youngs Bay a Big Cr a Clatskanie c Scappoose Total Clackamas c Sandy c Gorge a Total North Coast Nestucca d Mid Coast Mid South Coast Umpqua Total South Coast Rogue River Total a = Surveys in the Klamath Mountains Province DPS, and in the Youngs Bay, Big Cr and Gorge populations were not conducted in the 2017 season due to budget constraints. b = Oregon Coast DPS does not include sites that were within hatchery hotspots. c = Surveys in the Clatskanie, Clackamas and the Sandy River basin are shown here as the sum of all components. d = Estimate obtained for Nestucca population, which is included in the North Coast estimate. The target level of precision for steelhead redd estimates is a 95% confidence interval within ±30% of the point estimate. Steelhead spawning survey effort has been dramatically reduced on the Oregon Coast since 2008, resulting in not meeting precision goals at most spatial monitoring scales. In 2017, this goal was achieved only for the Oregon Coast DPS (Table 2). Precision goals were not met in the Clatskanie, Scappoose, Clackamas, Sandy and Nestucca 4
10 populations. The North Coast, Mid Coast, Mid-South Coast and Umpqua MA s also did not meet precision goals. Table 2. Oregon winter steelhead redd abundance estimates, Wild proportions are derived from fin-mark observation rates on live and dead steelhead. DPS/ESU Southwest Washington Lower Columbia River Oregon Coast c Klamath Mountains Province Winter Steelhead Redd Abundance Survey Effort Total Wild Monitoring Area or Number of 95% Confidence 95% Confidence Population Surveys Miles Estimate Interval Estimate Interval Youngs Bay Big Cr Clatskanie ab Scappoose b Total Clackamas a Sandy a , ,248 - Gorge Total ,107 1,027 2,090 1,024 North Coast ,296 3,894 10,720 3,395 Nestucca d , , Mid Coast ,796 3,614 5,522 2,560 Mid South Coast ,070 3,610 6,909 3,528 Umpqua ,982 2,288 5,982 2,288 Total ,144 6,840 29,133 5,980 South Coast Rogue River Total a = Estimates for these populations are derived from stratified samples. See intro/method section for stratification overview. b = Not Adequate Sample. No known-fin-clip-status (live or dead) fish were observed, therefore no wild estimate could be derived. c = Oregon Coast DPS does not include sites that were within hatchery hot-spots. d = Estimate obtained for Nestucca population, which is included in the North Coast estimate. * = Wild estimates in red are incomplete totals. See appendix for a full wild estimate. * =Wild estimates in green were derived from an alternate estimate method using an average of percent of hatchery origin spawners from previous years due to small 2017 sample sizes. Southwest Washington ESU The 2017 estimate of wild winter steelhead redds in the Oregon portion of the SWW ESU was 187, although this total includes estimates from only the Clatskanie and Scappoose populations due to a lack of funding for monitoring in the Youngs Bay and Big Cr. populations 5
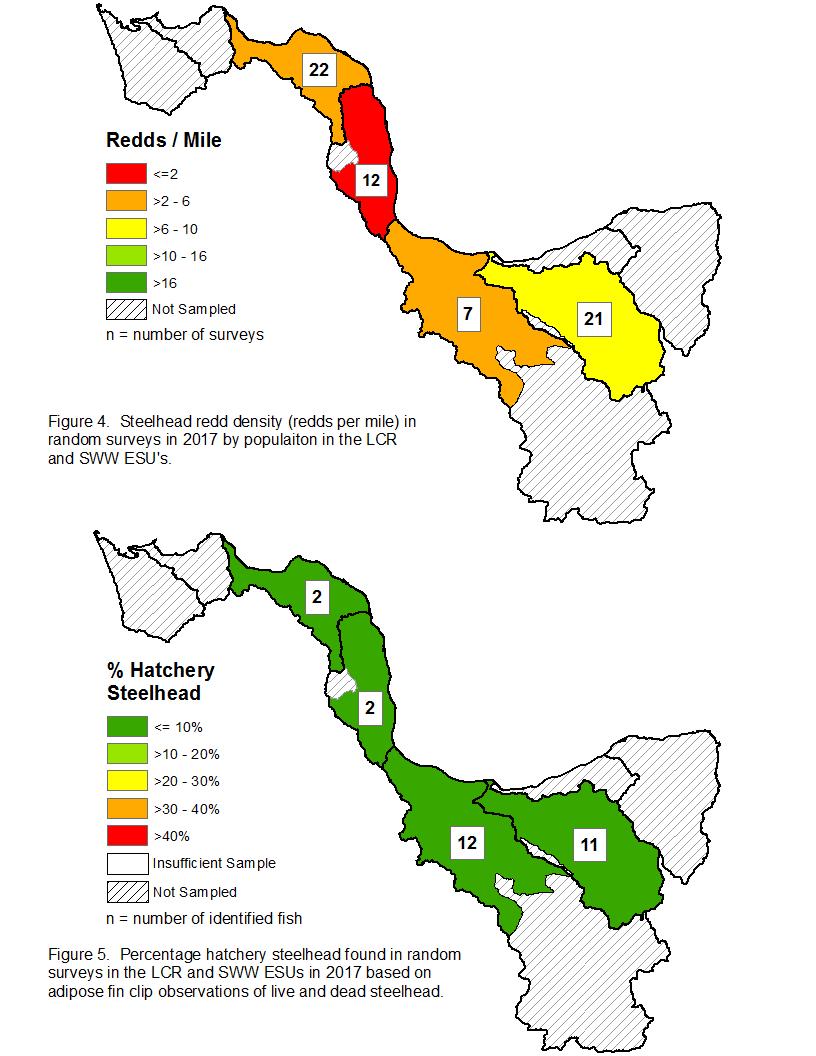
11 (Table 2). The redd estimates in the SWW ESU and both populations sampled in 2017 (Clatskanie and Scappoose) are the lowest in the six years of record (Figure 2 and Appendix Table A-2). Redd densities ranged from 0.3 redds per mile in the Scappoose population to 3.6 redds per mile in the Clatskanie population (Table 3 and Figure 4). Average density across the ESU was 2.0 redds per mile, which is well under the ESU average of 7.1 (Table 3). The percentage of sites with at least one redd observed ranged from 8% in the Scappoose population to 75% in the Clatskanie population. This is well below the average in the Scappoose population and slightly above the average in the Clatskanie population (Table 3) Southwest Washington ESU Lower Columbia ESU Estimated Wild Redds Spawning Year Figure 2. Winter steelhead wild redd estimates in the Oregon portions of the LCR and SWW ESUs based on random surveys, 2004 to Error bars represent 95% confidence intervals. Inclusion of survey data from specific populations and from above counting stations has varied across years, see Appendix Table A-2. Note that in 2017 error bars were not available given that estimates were calculated with alternative methods. On average the Scappoose population has only three steelhead observations with known fin-mark status, which was down slightly in 2017 with two observed (Table 4 and Figure 5). In contrast, the number of known fin-mark observations for calculating hatchery proportion in the Clatskanie population (2) is well below the average of 21 (Table 4). When phos sample size is less than 10 in a year, prior year s data is used. Surveying conditions were marginal across the region and likely contributed to low numbers of fish observations with known adipose fin clip 6
12 status for the ESU. The Clatskanie population had a 5% phos rate in 2017 (Table 4 and Figure 5). Spawn timing varied across the SWW ESU populations in 2017, with peak spawning being observed in late February in the Scappoose, and in late March in the Clatskanie (Figure 6). Table 3. Oregon winter steelhead redd density and percent occupancy in Monitoring Area or Redds / Mile % Sites With Redds DPS/ESU Population 2017 Average a 2017 Average a Young's Bay % Big Creek % Southwest Clatskanie % 68% Washington Scappoose % 42% Total % 59% Clackamas % 54% Lower Sandy % 65% Columbia River Gorge Total % 61% North Coast % 79% Mid Coast % 81% Oregon Coast Mid-South Coast % 89% Umpqua % 72% Total % 80% Klamath South Coast % Mountians Rogue River % Province Total % a = Average for period of monitoring: Oregon Coast is ; SWW and LCR is Lower Columbia ESU The Oregon portion of the Lower Columbia Steelhead ESU includes four populations. However, due to budgetary and logistical issues no surveys were conducted in the Lower Gorge or Hood River populations in Spawning ground survey effort was limited to the Sandy population, excluding the portion above Sandy Hatchery on Cedar Creek, and the Clackamas population located below River Mill Dam. The 2017 estimate of wild winter steelhead redds in the LCR ESU was 2,090 (Table 2). This is the fourth lowest LCR ESU redd estimate in the nine years of monitoring that include both the Sandy and Clackamas populations (Appendix Table A-2). However, trend analysis is not possible considering the lack of a continuous time series. The 2017 Clackamas estimate of 842 wild redds is the third lowest estimate in nine years of monitoring began (Figure 3). It should be noted that the 2004 estimate included the entire Clackamas population, and all 7
13 subsequent estimates are only for the area below River Mill Dam. For comparison, areas above the dam have provided an average of 43% of the estimated winter steelhead in the Clackamas basin during the seven years of record available for comparison. The 2017 Sandy population estimate of 1,248 wild redds is the lowest estimate observed since 2012 (Figure 3). However, the 2004 through 2007 estimates in the Sandy are only for the area below Marmot Dam, while all subsequent estimates are for the whole Sandy population. Survey conditions in 2017 for both the Clackamas and Sandy populations were challenging, which could have impacted redd estimates. Table 4. Number of known fin-mark status steelhead observed on spawning grounds, and resulting percent hatchery fish in Hatchery percentage based on adipose fin clip observations of live and dead steelhead in successfully conducted surveys. Monitoring Area Number Known Fish Percent Hatchery DPS/ESU or Population 2017 Average a 2017 Average a Young's Bay Big Cr Southwest Washington Lower Columbia River Oregon Coast b Klamath Mountains Province Clatskanie 2 21 c 5% 5% Plympton Scappoose 2 3 0% 0% Total 4 3 5% - Clackamas Population % 19% Clackamas 11-0% - Migration Corridor Eagle Creek 1-25% - Sandy Population % 5% Sandy 11-0% - Migration Corridor % - Cedar Creek Gorge Total 34-1% 4% North Coast % 11% Nestucca d 61-3% - Mid Coast % 21% Mid South Coast % 18% Umpqua % 5% Total % 14% South Coast % Rogue River % Total % a = Average for period of monitoring: Oregon Coast is ; SWW and LCR is b = Oregon Coast DPS does not include sites that were within hatchery hotspots. c = Average includes samples from whole population including Plympton Cr. d= Estimate obtained for Nestucca population, which is included in the North Coast estimate. 8
14 5000 Sandy and Clackamas Wild Redd Estimate ClackamasWild Redd SandyWild Redds Spawning Year Figure 3. Winter steelhead wild redd estimates in the Clackamas and Sandy River populations based on random surveys, 2004 to Error bars represent 95% confidence intervals. Note that in 2017 error bars were not available given that estimates were calculated with alternative methods. Survey frequency in the Sandy population for the 2013 through 2017 spawning survey seasons differed from all other populations reported. In these seasons surveys were conducted weekly, rather than the bi-weekly survey frequency in previous seasons. The more frequent survey rotation was done primarily to improve the sample size of known fin-marked adults in the basin, but also to maintain a higher number of successfully surveyed sites because of chronically high/turbid water issues. In the Sandy population, 62% of the sites surveyed in 2017 met protocols for inclusion in the estimate calculation. This site completion rate is relatively high given survey conditions, which were the most challenging since The increased rate of survey visits during the spawning season were a likely factor in the high proportion of valid surveys completed in Redd density for the LCR ESU was 7.1 redds per mile; ranging from 5.7 redds per mile in the Clackamas to 8.4 redds per mile in the Sandy (Table 3 and Figure 4). Both the Clackamas 9
15 and Sandy redd densities were below their respective averages (Table 3). The percentage of sites having at least one redd were similar within the two populations, with 71% of sites occupied in the Clackamas and 68% of sites occupied in the Sandy population (Table 3). Site occupancy was above average in both the Sandy and Clackamas populations in The proportion of naturally spawning hatchery steelhead in the LCR ESU was 1% in The 2017 phos rate of 1% in the Sandy population is below average. The sample size (11) for the 2017 estimate of phos in the Sandy is lower than the long term average (33), but relatively strong given the difficult survey conditions. The increased rate of survey visits in the Sandy population is likely to have contributed to achieving our sampling goals for In the Clackamas population the phos for the population estimate for areas below River Mill Dam is 2%, which is well below the average of 19% for this area (Table 4). It should be noted that the phos for the entire Clackamas population (including fish passed above River Mill Dam) is lower (1%). The Sandy and Clackamas Rivers contain hatchery summer steelhead programs. Differentiating summer and winter steelhead on the spawning grounds is difficult. The two runs differ somewhat in spawn timing, with most summer-run fish spawning from late December into February, and winter runs spawning February through May. Management plans for wild winter steelhead in the Sandy and Clackamas Rivers set different maximum allowable phos rates for the two steelhead runs. When the Sandy total hatchery steelhead phos rate is less than the lower of the two run specific phos limits, both are in compliance. If the total exceeds the lower limit (5% for summer steelhead), then a separate phos calculation is made for the period of spawning overlap between wild winter and hatchery summer steelhead runs. This calculation is based on redds and known fin clip status steelhead observed before March 1 st. The overall 1% estimated phos in the Sandy population for 2017 is lower than the goals for summer-run hatchery fish (5%) and winter-run hatchery fish (10%), and thus did not trigger the calculation of a separate summer steelhead phos. Peak spawn timing in the Clackamas population occurred in early April, which is typical of this population (Figure 6). Peak spawn timing in the Sandy population was also within that population s normal range, peaking in early April (Figure 6). Survey conditions were difficult throughout most of the 2017 spawning season in the LCR ESU, and timing signatures may have been altered as a result of challenges to surveying methods. 10
16 11
17 Proportion of Maximum redd Count Proportion of Maximum redd Count Jan 1 Jan 15 Jan 29 Clackamas Sandy Clatskanie Scappoose Feb 12 Feb 26 Mar 12 Mar 26 Apr 9 Apr 23 May 7 May 21 Jun Jan 1 Jan 15 Jan 29 Feb 12 Feb 26 Mar 12 Mar 26 Apr 9 Apr 23 May 7 May 21 Jun 4 Date Figure 6. Proportion of the maximum winter steelhead redd count in each of the Lower Columbia populations by week of the year in
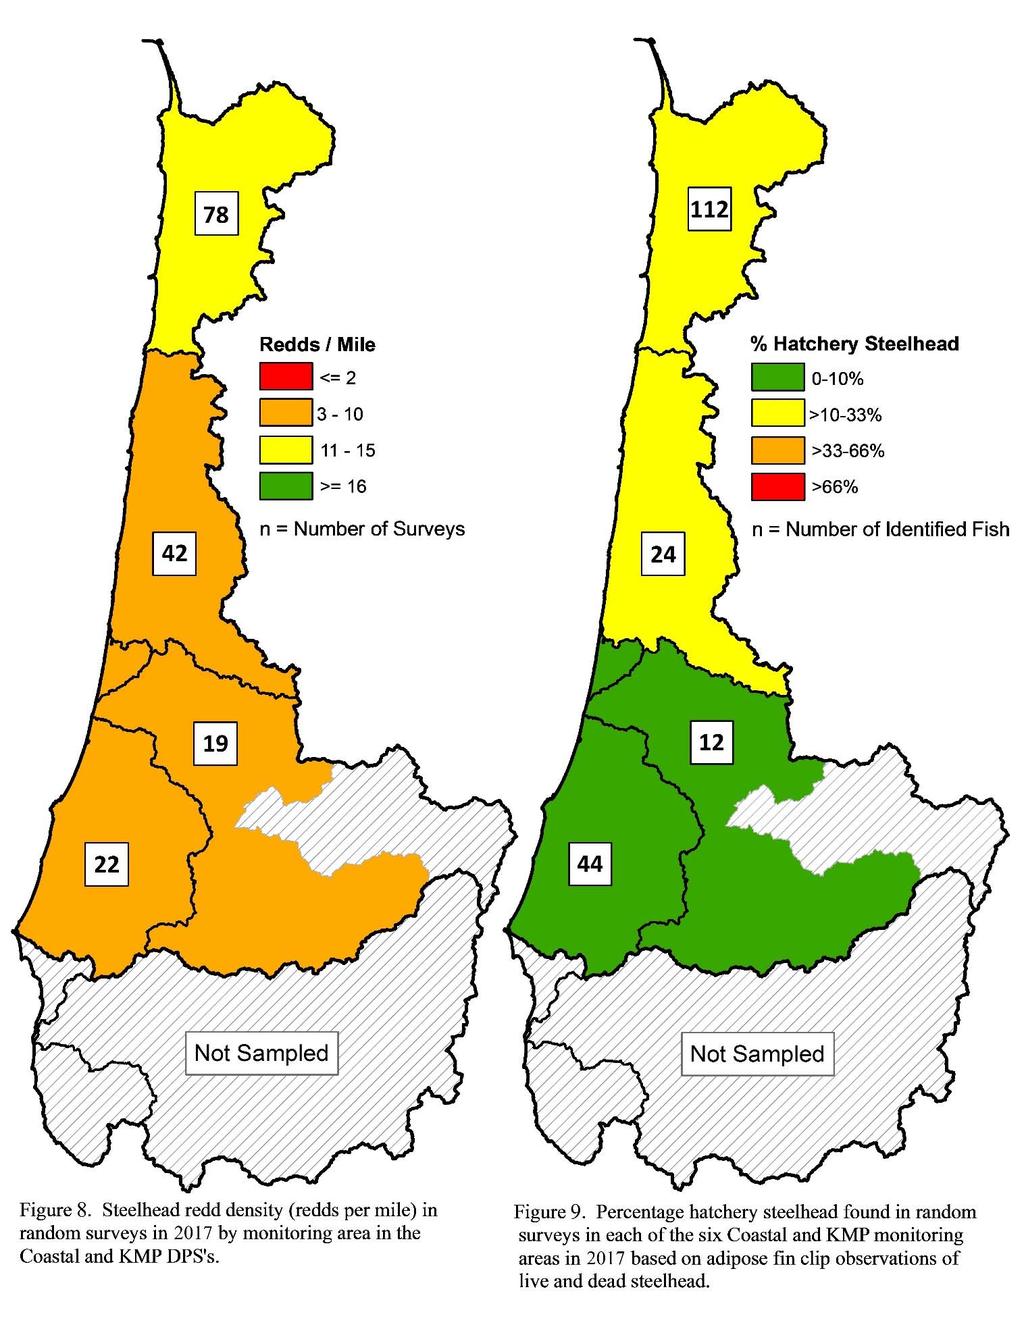
18 Oregon Coast DPS The 2017 estimate of 29,133 wild winter steelhead redds in the Oregon Coast DPS is the lowest estimate since this monitoring began in 2003 and 48% of average (Figure 7). Results in individual MA s are all similarly below average with the North Coast being 53% of the long term average, the Mid Coast (37%), Mid-South (49%) and Umpqua (47%) (Appendix Table A- 1). While the estimated abundance of wild steelhead redds in the Oregon Coast DPS has ranged from 29,133 to 94,616 across the 15 years of monitoring (2003 through 2017), there does not appear to be any clear trend in abundance over this time period. The relatively short time period of monitoring and the reduced effort in recent years (and thus generally larger 95% confidence intervals) currently limit the ability to detect long-term trends in abundance. Figure 7. Estimated number of wild winter steelhead redds in the Oregon Coast DPS, 2003 to Error bars represent 95% confidence intervals, and horizontal lines show the previous 14- year average. Density of redds (steelhead redds/mile of spawning habitat) also varied across monitoring areas, ranging from 3.5 redds/mile in the Umpqua MA to 10.6 redds/mile in the North Coast MA (Table 3 and Figure 8). Similar to the redd abundance estimates, redd densities were well below average, being only 51% of the previous 14-year average in the Oregon Coast DPS. 13
19 An occupied site is defined as having at least one steelhead redd recorded during the season. The proportion of occupied sites in 2017 in the Oregon Coast DPS was 61%, which is well below the 14 year average of 80% (Table 3). Occupancy in individual MA s ranged from 54% in the Mid Coast MA (28 percentage points less than average) to 67% in the Umpqua MA (five percentage points less than average). While there were plenty of moderate to high flow events across the majority of the steelhead migration and spawning season, which should enable steelhead to reach even the upper reaches of their spawning distribution, low abundance seems to have had an impact on the lower occupancy rates observed in The proportion of hatchery origin spawners in the naturally spawning steelhead population of the Oregon Coast DPS was 12% in 2017, which is near the average of 14% (Table 4). The proportion of hatchery origin spawners varied among the monitoring areas in 2017 (Figure 9), ranging from 0% in the Umpqua MA to nearly 29% in the Mid Coast MA. The Umpqua and Mid-South MA s had 2017 phos rates below their respective 14 year averages, with the Mid-South MA considerably lower at 2% than average of 18% (Table 4). In contract the North Coast and Mid-Coast had 2017 phos rates that were slightly higher than their previous 14 year age raves. Sample size for phos calculations in 2017 were above our 10 fish minimum in all four monitoring areas, ranging from 12 in the Umpqua MA to 112 in the North Coast MA (Figure 9). Oregon Coast DPS peak spawning time (defined as maximum number of new redds observed) occurred later as compared to previous years. This is likely a result of stream flows which were higher than typical for the first half of the season (Figure 10 and Figure 11). Over the 14 years of monitoring, typical peak spawning time for the four monitoring areas are: early April in the North Coast MA; a bi-modal peak in late February and early April in the Mid Coast MA; and late February for both the Mid-South Coast MA and Umpqua MA. This year in Mid- South and Umpqua MA s, peak spawn timing was 2-4 weeks later than average. In the Mid Coast the majority of spawning occurred during March and early April, with almost no activity recorded during February s normal first peak. North-Coast peak spawn timing was comparable to previous years, but spawning did not start until much later than normal and was consolidated to mid-march through mid-may (Figure 10). The pattern of recurrent high flow events present from early-february through March (Figure 11) may have either delayed spawning or inhibited/delayed our ability to detect redds during that time. If the later occurred, it would result in an underestimate of redd abundance in
20 15
21 Figure 10. Proportions of the maximum winter steelhead redd count in each of the four Coastal areas by two-week period in Figure 11. Stream discharge at Alsea River near Tidewater during 2017, compared to mean discharge from 1940 to (Flood stage = 19,500 CFS) 16
22 Steelhead Escapement In recent years there has been an increased emphasis on a redd-to-fish conversion so that estimates can be reported in terms of fish rather than redds. In 2013 a re-analysis of previous year s redd-to-fish regression efforts was conducted, based on four calibration sites over a fiveyear time span ( ). This re-analysis resulted in a conversion rate which is intended to be used across all of the monitoring areas and populations included in this report (ODFW 2013). Total steelhead = (1.70 * Redds) Estimates of winter steelhead escapement in 2017, derived from redd counts and then converted with the above equation are reported in Table 5. Starting in 2014, we began exploring additional calibration sites using similar methods and a mix of new and repeated calibration sites. However, those results are not yet reported nor used for conversions. These calibration efforts are intended to be an ongoing, annual component of these monitoring efforts. Some variation does exist between sites and between years, so the goal is to build on previous calibration work by exploring the feasibility of producing a redd-to-fish conversion on an annual basis. LAMPREY MONITORING Over the course of steelhead monitoring, ancillary data recorded on each survey include the counts of Pacific Lamprey (Entosphenus tridentatus) redds, as well as counts of observed live and dead lamprey. In addition, Western Brook Lamprey (Lampetra richardsoni) are observed and data recorded, but that data is not summarized in this report. While these data do provide information for lamprey coast-wide and in the Lower Columbia, it is worth noting that survey sites are selected from the known distribution of steelhead spawning habitat, which does not necessarily cover lamprey spawning distribution. Furthermore, while live lamprey are observed spawning on surveys, we do not survey often enough nor when lamprey are most active (at night) to use live lamprey counts for abundance estimates. As a result, lamprey density on spawning surveys is summarized in this report by peak redds per mile. The peak redd count is the highest number of lamprey redds visible during any one survey date within a given spawning season. Peak redd counts provide information on the distribution and timing of lamprey spawning activity, as well as some indication of relative density (and by proxy, relative abundance). Lamprey redd counts also provide occupancy information, though survey methods have not been precision tested. So, while a lamprey redd likely proves lamprey presence in a given survey, the lack of recorded redds does not necessarily mean lamprey were absent. Despite the many caveats, this lamprey data set has grown quite large, and contains some information that may begin to provide a method of tracking Pacific Lamprey trends and relative abundance. 17
23 Table 5. Oregon winter steelhead fish abundance estimates in Estimates do not include steelhead above counting stations and are thus not complete population estimates in all areas, see Appendix Tables A-1 and A-2. DPS/ESU Southwest Washington Lower Columbia River Oregon Coast c Klamath Mountains Province Monitoring Area or Population Winter Steelhead Abundance Total 95% Confidence Estimate Interval Wild 95% Confidence Estimate Interval Youngs Bay Big Cr Clatskanie a N.A.S. - Scappoose b N.A.S. - Total Clackamas a 1,462 1,047 1,357 1,038 Sandy a 2,127 1,401 2,108 1,400 Gorge Total 3,586 1,750 3,462 1,745 North Coast 20,907 6,624 18,228 5,775 Nestucca d 1, , Mid Coast 13,257 6,148 9,391 4,356 Mid South Coast 12,023 6,141 11,749 6,001 Umpqua 10,173 3,893 10,173 3,893 Total 56,349 11,632 49,530 10,170 South Coast Rogue River Total a = Estimates for these populations are derived from stratified samples. See intro/method section for b = Not Adequate Sample. No known-fin-clip-status (live or dead) fish were observed, therefore no wild c = Oregon Coast DPS does not include sites that were within hatchery hot-spots. d = Estimate obtained for Nestucca population, which is included in the North Coast estimate. Lower Columbia Pacific Lamprey The available time series for Pacific lamprey in the Lower Columbia is more limited than in the Oregon Coast, but many populations now have at least six consecutive years of effort available for analysis. Redd densities during the 2017 monitoring season were much lower compared to previous records in each of the monitored populations (Figure 12), and as such were also below previous five-year population averages. Pacific lamprey redds were identified in 27% of random steelhead surveys sampled in the Lower Columbia River ESU in Pacific lamprey redd occupancy varied in 2017 by population; 50% in the Clatskanie, 0% in the Scappoose, 43% in the Clackamas and 14% in the Sandy. All of these are below normal. 18
24 Figure 12. Lower Columbia Pacific Lamprey Peak Redd Density in Random Steelhead Spawning Surveys, Note that not all populations were monitored in all years. Pacific lamprey redds were first observed across the Lower Columbia in late March, which is slightly earlier than typical. Lamprey were not seen this year in the Scappoose population, which is concerning given the average peak density of 6.9 redds per mile in that population. A peak in lamprey activity was seen in the Clatskanie population in both early May and also in late June. The Clackamas population saw peak lamprey observations into late May, however, no surveys were conducted in the Clackamas after that date, so the full extent of Pacific lamprey spawn timing is not clear for Pacific Lamprey in this population for 2017 (Figure 13). Lamprey redd counts are conducted as peak counts, and thus these patterns may reflect observation of redds that are many weeks old, as opposed to counting new redds deposited at this late time of the spawning season. Oregon Coast Pacific Lamprey Over the past 15 years, Pacific Lamprey peak redd density on the Oregon Coast has fluctuated from 1 to 10 redds/mile in random steelhead surveys, averaging about 4.6 redds/mile (Figure 14). The proportion of sites occupied by Pacific Lamprey (sites with at least one Pacific Lamprey redd) has ranged from about 25% to 56% (mean = 39%); with increases and decreases in occupancy often tracking similar increases and decreases in peak redd density (Figure 14). 19
25 Figure 13. Lower Columbia Pacific Lamprey spawn timing in random steelhead surveys in 2017 and average daily max water temperature in the Clackamas River. Beginning in 2010, thirteen annual steelhead surveys across the Oregon Coast were selected to be index surveys for the monitoring of Pacific Lamprey through their full spawn timing. These index surveys were picked with consideration to the following: (a) consistent presence of lamprey spawning activity across years; (b) a mix of smaller and larger streams in each steelhead monitoring area; and (c) the feasibility of conducting these surveys with limited staff availability. Index surveys are visited during each steelhead spawning season (February- May), and while steelhead surveys are primarily discontinued by the end of May, lamprey index surveys continue through late June (some years even into early July) in an attempt to capture the full lamprey spawn timing. The average spawn timing among index sites over the past five years peaked in mid-may, with the earliest peak occurring in late April (2014), and the latest occurring in early-june (2011 & 2017) (Figure 15). Pacific Lamprey spawn timing in 2017 was later than average, and only the second season since 2010 to peak in June. In addition, Pacific Lamprey spawning in 2017 both, started later than normal and continued later than normal, with new redds observed through late June in some surveys. Peak redd density on index surveys was above average, which contradicts the density of redds across randomly selected steelhead surveys, which was slightly below average. Occupancy in Pacific Lamprey among Oregon Coast populations appears to relate to overall abundance of adult spawners, and occupancy was about average for 2017 across the ESU. 20
26 Figure 14. Oregon coast Pacific Lamprey peak redd density and percent of sites occupied in random steelhead spawning surveys, 2003 to Figure 15. Oregon coast Pacific Lamprey spawn timing in index surveys. 21
27 REFERENCES Busby, P.J., T.C. Wainwright, G.J. Bryant, L.J. Lierheimer, R.S. Waples, F.W. Waknitz and I.V. Lagomarsino Status review of West Coast steelhead from Washington, Idaho, Oregon and California. U.S. Department of Commerce, NOAA Technical Memorandum, NMFS-NWFSC-27. Lewis, M., E. Brown, B. Sounhein, M. Weeber, E. Suring, and H. Truemper Status of Oregon stocks of coho salmon, 2004 through Monitoring Program Report Number OPSW-ODFW , Oregon Department of Fish and Wildlife, Salem, Oregon. Myers, J., C. Busack, D. Rawding, A. Marshall, D. Teel, D.M. Van Doornik, and M.T. Maher Historical Population structure of Pacific salmonids in the Willamette River and lower Columbia River basins. U.S Dept. Commer., NOAA Tech Memo. NMFS- NWFSC-73, 311 p. ODFW Oregon native fish status report. Oregon Department of Fish and Wildlife, Salem, Oregon. Available: ODFW Winter Steelhead Redd to Fish Conversion, Spawning Ground Survey Data. Oregon Department of Fish and Wildlife, Salem, Oregon. Available: ODFW Coastal Multi-Species Conservation and Management Plan. Oregon Department of Fish and Wildlife, Salem, Oregon. Available: ODFW Coastal steelhead spawning surveys procedures manual Oregon Department of Fish and Wildlife, Salem, Oregon. Available: Stevens, D.L Sampling design and statistical analysis methods for integrated biological and physical monitoring of Oregon streams. OPSW-ODFW , Oregon Department of Fish and Wildlife, Salem, Oregon. Susac, G.L. and S.E. Jacobs Evaluation of spawning ground surveys for indexing the abundance of adult winter steelhead in Oregon coastal basins. Annual Progress Report, Oregon Department of Fish and Wildlife, Salem, Oregon. 22
28 APPENDIX Table A-1. Annual redd abundance estimates of naturally spawning wild steelhead by Monitoring Area (MA), in Oregon Coast Steelhead DPSs, run years 2003 to n.a. = not available. Highlighted cells do not include estimates for areas above counting stations. Oregon Coast DPS Klamath Mountains Province DPS Year North Coast Mid Coast Mid-South Umpqua South Coast Rogue River MA MA Coast MA MA MA MA ,726 18,092 11,853 26,044 4,852 7, ,599 14,043 10,195 11,922 9,093 n.a ,125 7,890 22,871 10,628 10,035 4, ,065 13,496 19,550 8,786 5,667 7, ,592 10,133 24,312 13,900 6,917 6, ,859 12,628 18,806 15,556 5,520 5, ,433 12,080 9,136 9,282 14,268 12, ,928 16,684 19,927 16,266 4,430 n.a ,961 19,347 9,504 11,394 1,808 n.a ,864 19,074 7,414 11,416 2,738 n.a ,371 27,927 15,423 21,895 8,961 n.a ,185 9,012 10,877 9,791 4,449 n.a ,641 15,443 11,548 10,975 1,682 n.a a 15,491 23,776 14,049 9,120 n.a. n.a a 10,720 5,522 6,909 5,982 n.a. n.a. a = Oregon Coast DPS does not include sites that were within hatchery hot-spots after
29 Table A-2. Annual redd abundance estimates of naturally spawning wild steelhead by Population, in Lower Columbia Steelhead ESUs, run years 2003 to n.a. = not available. Highlighted cells do not include estimates for areas above counting stations. Southwest Washington ESU Lower Columbia ESU Year Youngs Bay Big Creek Clatskanie Scappoose Clackamas Sandy 2003 n.a. n.a. n.a. n.a. n.a. n.a * 2, n.a. n.a. n.a. n.a. n.a. n.a n.a. n.a. n.a. n.a n.a. n.a. n.a. n.a n.a. n.a. n.a. n.a. n.a. n.a n.a. n.a. n.a. n.a. n.a. n.a n.a. n.a. n.a. n.a. n.a n.a. n.a. n.a. n.a. n.a , n.a. n.a. n.a. n.a. 1,265 1, n.a. n.a. 1, ,247 2, n.a. n.a ,076 3, n.a. n.a ,248 * = Random surveys were conducted in 2004, but population scale estimates have not been done Table A-3. Oregon winter steelhead redd abundance estimates within Oregon Coast Hotspot areas. Hotspots are areas located within 4 stream miles of acclimated hatchery release sites, and are not included within population, monitoring area, ESU estimates. Wild proportions are derived from fin-mark observation rates on live and dead steelhead. DPS/ESU Oregon Coast Monitoring Area or Population Survey Effort Total Wild Spawning Miles Miles within Hotspots Estimate 95% Confidence Interval Estimate Number of Surveys Winter Steelhead Redd Abundance 95% Confidence Interval North Coast Hotspots Mid Coast Hotspots , Mid South Coast Hotspots NA NA NA NA Umpqua Hotspots NA NA NA NA Total NA NA NA NA 24
30 Table A-4. Oregon winter steelhead redd abundance estimates within strata in Strata estimates are components of monitoring area and/or population estimates shown in Table 2. Wild proportions are derived from fin-mark observation rates on live and dead steelhead. Table A-4. Orgon Winter steelhead redd abundance estimates within stratified samples, DPS/ESU Southwest Washington Lower Columbia River Winter Steelhead Redd Abundance Survey Effort Total Wild Monitoring Area or Population Number of Surveys Miles Aproximate Spawning Miles Estimate 95% Confidence Interval Estimate 95% Confidence Interval Clatskanie Strata Plympton Cr.Strata Clatskanie Total Clackamas Strata Clackamas Migration Strata Eagle Cr. Hatchery Lower Clackamas Total Sandy Strata , , Sandy MigrationStrata Cedar Cr. HatcheryStrata Sandy Total , , Lower Columbia ESU Total ,303 1,028 2,034 1,022 25
31 4034 Fairview Industrial Drive SE Salem, OR 97302
THE OREGON. PLAN for. Salmon and Watersheds. Assessment of Western Oregon Adult Winter Steelhead Redd Surveys Report Number: OPSW-ODFW
 THE OREGON PLAN for Salmon and Watersheds Assessment of Western Oregon Adult Winter Steelhead Redd Surveys 2013 Report Number: OPSW-ODFW-2013-09 The Oregon Department of Fish and Wildlife prohibits discrimination
ASSESSMENT OF THE STATUS OF NESTUCCA RIVER WINTER STEELHEAD
 ASSESSMENT OF THE STATUS OF NESTUCCA RIVER WINTER STEELHEAD Gary Susac and Steve Jacobs Coastal Salmonid Inventory Project Oregon Department of Fish and Wildlife August 21, 2001 INTRODUCTION This report
Salmon and Steelhead Spawning Survey Methods Stratification of Estimates
 Salmon and Steelhead Spawning Survey Methods Stratification of Estimates Oregon Department of Fish and Wildlife Oregon Adult Salmonid Inventory and Sampling Project Corvallis Research Lab September 2016
Winter Steelhead Redd to Fish conversions, Spawning Ground Survey Data
 Winter Steelhead Redd to Fish conversions, Spawning Ground Survey Data Oregon Department of Fish and Wildlife (ODFW); Corvallis Research Office Oregon Adult Salmonid Inventory and Sampling Project (June
Rogue Winter Steelhead
 Rogue Winter Steelhead Existing Populations The Rogue Winter Steelhead SMU includes eight populations within the Klamath Mountains Province (KMP) in southwest Oregon (Table 93). None of the populations
THE OREGON PLAN for. Salmon and Watersheds. Smith River Steelhead and Coho Monitoring Verification Study, Report Number: OPSW-ODFW
 THE OREGON PLAN for Salmon and Watersheds Smith River Steelhead and Coho Monitoring Verification Study, 2007 Report Number: OPSW-ODFW-2009-11 The Oregon Department of Fish and Wildlife prohibits discrimination
for Salmon and Watersheds
 for Salmon and Watersheds Stock Assessment of Anadromous Salmonids, Report Number: OPSW-ODFW-3- The Oregon Department of Fish and Wildlife prohibits discrimination in all of its programs and services on
Stock Assessment of Anadromous Salmonids, 2003 Report Number: OPSW-ODFW
 THE OREGON PLAN for Salmon and Watersheds Stock Assessment of Anadromous Salmonids, 3 Report Number: OPSW-ODFW-- The Oregon Department of Fish and Wildlife prohibits discrimination in all of its programs
Coho. Oregon Native Fish Status Report 13
 12 Coho Coho salmon are widespread in small, low gradient streams of the coast and lower Columbia. They enter freshwater and spawn after fall rains raise river levels, typically from September through
THE OREGON. PLAN for Salmon and Watersheds. Stock Assessment of Anadromous Salmonids, Report Number: OPSW-ODFW
 THE OREGON PLAN for Salmon and Watersheds Stock Assessment of Anadromous Salmonids, Report Number: OPSW-ODFW-1- The Oregon Department of Fish and Wildlife prohibits discrimination in all of it s programs
THE OREGON. PLAN for Salmon and Watersheds. Juvenile Salmonid Monitoring In Coastal Oregon and Lower Columbia Streams, 2016
 THE OREGON PLAN for Salmon and Watersheds Juvenile Salmonid Monitoring In Coastal Oregon and Lower Columbia Streams, 216 Report Number: OPSW-ODFW-217-1 The Oregon Department of Fish and Wildlife prohibits
Southern Oregon Coastal Cutthroat Trout
 Species Management Unit Description Southern Oregon Coastal Cutthroat Trout The Southern Oregon Coastal Cutthroat Trout SMU includes all populations of cutthroat trout inhabiting ocean tributary streams
2013 WHITE SALMON CHINOOK SALMON VSP MONITORING. Jeremy Wilson Washington Department of Fish and Wildlife
 2013 WHITE SALMON CHINOOK SALMON VSP MONITORING Jeremy Wilson Washington Department of Fish and Wildlife Study Area Outline History of WDFW Chinook Monitoring in WS 2013 Objectives 2013 Study Design 2013
Preliminary survival estimates for the passage of spring-migrating juvenile salmonids through Snake and Columbia River dams and reservoirs, 2018
 UNITED STATES DEPARTMENT OF COMMERCE National Oceanic and Atmospheric Administration NATIONAL MARINE FISHERIES SERVICE Northwest Fisheries Science Center Fish Ecology Division 2725 Montlake Boulevard East
Calibration of Estimates of Coho Spawner Abundance in the Smith River Basin, 2001 Report Number: OPSW-ODFW
 for Salmon and Watersheds Calibration of Estimates of Coho Spawner Abundance in the Smith River Basin, 2001 Report Number: OPSW-ODFW-2002-06 Calibration of Estimates of Coho Spawner Abundance in the Smith
Estimating Summer Steelhead Escapement using Redd Surveys: What have we learned and where do we go? Jim Ruzycki Oregon Department of Fish & Wildlife
 Estimating Summer Steelhead Escapement using Redd Surveys: What have we learned and where do we go? Jim Ruzycki Oregon Department of Fish & Wildlife Spawner Abundance for the John Day Summer Steelhead
Preliminary Summary of Out-of-Basin Steelhead Strays in the John Day River Basin
 Preliminary Summary of Out-of-Basin Steelhead Strays in the John Day River Basin Prepared by: James R. Ruzycki and Richard W. Carmichael Oregon Department of Fish and Wildlife La Grande, Oregon Introduction
Preliminary survival estimates for the passage of spring-migrating juvenile salmonids through Snake and Columbia River dams and reservoirs, 2017
 UNITED STATES DEPARTMENT OF COMMERCE National Oceanic and Atmospheric Administration NATIONAL MARINE FISHERIES SERVICE Northwest Fisheries Science Center Fish Ecology Division 2725 Montlake Boulevard East
***Please Note*** April 3, Dear advisory committee members:
 April 3, 29 Dear advisory committee members: The fifth meeting of the CHF advisory committee will be held April 13 in Grants Pass from 6:-8:3 PM, and the purpose of this document is to help committee members
LIFE HISTORY DIVERSITY AND RESILIENCE
 LIFE HISTORY DIVERSITY AND RESILIENCE SPRING CHINOOK IN THE WILLAMETTE RIVER BASIN Kirk Schroeder Brian Cannon Luke Whitman Paul Olmsted Oregon Department of Fish and Wildlife Corvallis Research Lab Thanks
Abundance of Steelhead and Coho Salmon in the Lagunitas Creek Drainage, Marin County, California
 scanned for KRIS Abundance of Steelhead and Coho Salmon in the Lagunitas Creek Drainage, Marin County, California Prepared for: Marin Municipal Water District 220 Nellen Drive Corte Madera, California
Strategies for mitigating ecological effects of hatchery programs
 Strategies for mitigating ecological effects of hatchery programs Some case studies from the Pacific Northwest Kathryn Kostow Oregon Department of Fish and Wildlife Ecological risks occur when the presence
How Do We Know How Many Salmon Returned to Spawn? Implementing the California Coastal Salmonid Monitoring Plan in Mendocino County, California
 How Do We Know How Many Salmon Returned to Spawn? Implementing the California Coastal Salmonid Monitoring Plan in Mendocino County, California Sean P. Gallagher 1 and David W. Wright 2 Abstract California
Oregon Coast Coastal Cutthroat Trout
 Oregon Coast Coastal Cutthroat Trout Species Management Unit Description The Oregon Coast Coastal Cutthroat Trout Species Management Unit (SMU) includes all populations of cutthroat trout inhabiting ocean
Summary of HSRG Findings for Chum Populations in the Lower Columbia River and Gorge
 Summary of HSRG Findings for Chum Populations in the Lower Columbia River and Gorge The Congressionally-established Hatchery and Scientific Review Group (HSRG) developed a foundation of salmon hatchery
JOINT STAFF REPORT WINTER FACT SHEET NO. 9 Columbia River Compact March 18, 2004
 JOINT STAFF REPORT WINTER FACT SHEET NO. 9 Columbia River Compact March 18, 2004 Purpose: To review ongoing commercial fisheries and consider non-indian commercial fishing seasons for salmon, smelt and
29.0 CALIFORNIA CENTRAL VALLEY STEELHEAD ESU
 29.0 CALIFORNIA CENTRAL VALLEY STEELHEAD ESU 29.1 BACKGROUND 29.1.1 Description of the ESU The California Central Valley Steelhead (CCVS) ESU includes all naturally spawned populations of steelhead (and
Steelhead Overview and Catch Statistics
 Steelhead Overview and Catch Statistics Summer and Winter steelhead There are two main runs of steelhead in Oregon, a summer and a winter run. Some river systems have both types of runs while other streams
Attachment 2 PETITIONERS
 Attachment 2 PETITION TO TEMPORARILY MODIFY FRESHWATER FISHERY REGULATIONS ADOPTED UNDER THE CONSERVATION PLAN FOR NATURALLY PRODUCED SPRING CHINOOK SALMON IN THE ROGUE RIVER (submitted September 26, 2017)
THE CONFEDERATED TRIBES OF THE WARM SPRINGS RESERVATION OF OREGON
 THE CONFEDERATED TRIBES OF THE WARM SPRINGS RESERVATION OF OREGON To: Branch of Natural Resources P.0. Box C, Warm Springs, Oregon 97761 Phone (541) 553-2002/2003 Fax (541) 553-1994 The Independent Science
BOGUS CREEK SALMON STUDIES 2002
 BOGUS CREEK SALMON STUDIES 2002 BY: JEANNINE RICHEY California Department of Fish and Game KLAMATH RIVER PROJECT 303 SOUTH STREET YREKA, CALIFORNIA 96097 (530) 842-3109 California Department of Fish and
OREGON AND WASHINGTON DEPARTMENTS OF FISH AND WILDLIFE JOINT STAFF REPORT - WINTER FACT SHEET NO.
 OREGON AND WASHINGTON DEPARTMENTS OF FISH AND WILDLIFE JOINT STAFF REPORT - WINTER FACT SHEET NO. 3a Columbia River Compact/Joint State Hearing February 21, 2018 Fisheries under consideration: Mainstem
OREGON DEPARTMENT OF FISH AND WILDLIFE ROGUE FISH DISTRICT REPORT
 OREGON DEPARTMENT OF FISH AND WILDLIFE ROGUE FISH DISTRICT REPORT TITLE: Upper Rogue Smolt Trapping Project, 1999 STREAM: Big Butte, Little Butte, South Fork Big Butte, Slate and West Fork Evans Creeks
NATIVE FISH CONSERVATION PLAN FOR THE SPRING CHINOOK SALMON ROGUE SPECIES MANAGEMENT UNIT
 Attachment 4 NATIVE FISH CONSERVATION PLAN FOR THE SPRING CHINOOK SALMON ROGUE SPECIES MANAGEMENT UNIT Figures in Draft Plan of February 28, 27 Figure 1. Map of the Rogue River Basin. PASSAGE ESTIMATES
Preliminary survival estimates for the passage of spring-migrating juvenile salmonids through Snake and Columbia River dams and reservoirs, 2016
 UNITED STATES DEPARTMENT OF COMMERCE National Oceanic and Atmospheric Administration NATIONAL MARINE FISHERIES SERVICE Northwest Fisheries Science Center Fish Ecology Division 2725 Montlake Boulevard East
Patterns of migration and delay observed in Summer Steelhead from the Upper Columbia and Snake River Basins from PIT tag data
 West Coast Region Patterns of migration and delay observed in Summer Steelhead from the Upper Columbia and Snake River Basins from PIT tag data Blane Bellerud August, 2015 Columbia River Basin Columbia
Hood Canal Steelhead Project A conservation hatchery experiment. Joy Lee Waltermire
 Hood Canal Steelhead Project A conservation hatchery experiment Joy Lee Waltermire Cooperating Project Partners: NOAA: NWFSC Behavioral Ecology Team Long Live the Kings WA Department of Fish and Wildlife
California Steelhead: Management, Monitoring and Recovery Efforts
 California Steelhead: Management, Monitoring and Recovery Efforts Jonathan Nelson Steelhead Restoration & Management Program Oncorhynchus mykiss irideus California Steelhead Distinct Population Segments
Hatchery Scientific Review Group Review and Recommendations
 Hatchery Scientific Review Group Review and Recommendations Walla Walla River Summer Steelhead Population and Related Hatchery Programs January 31, 2009 Note: Spawning reaches likely vary from those depicted.
Catlow Valley Redband Trout
 Catlow Valley Redband Trout Existing Populations The Catlow Valley Redband Trout SMU is comprised of five populations (Table 1). Three exist in Home, Threemile, and Skull creeks, located on the east side
Old Document: Sandy River Coho Final HGMP 78 pages (1.18 MB) 12/10/2013 3:11:23 PM
 12/10/2013 3:11:23 PM") Summary 12/10/2013 3:11:56 PM Differences exist between documents. New Document: sandy_co_hgmp_11-6-13_final 76 pages (841 KB) 12/10/2013 3:11:23 PM Used to display results. Old Document: Sandy River Coho
Summary 12/10/2013 3:11:56 PM Differences exist between documents. New Document: sandy_co_hgmp_11-6-13_final 76 pages (841 KB) 12/10/2013 3:11:23 PM Used to display results. Old Document: Sandy River Coho
June 3, 2014 MEMORANDUM. Council Members. Stacy Horton, Policy Analyst, Washington. SUBJECT: Final 2012 Hatchery Fin Clip Report
 Bill Bradbury Chair Oregon Henry Lorenzen Oregon W. Bill Booth Idaho James A. Yost Idaho Jennifer Anders Vice Chair Montana Pat Smith Montana Tom Karier Washington Phil Rockefeller Washington June 3, 2014
Hatchery Scientific Review Group Review and Recommendations
 Hatchery Scientific Review Group Review and Recommendations Willamette McKenzie Spring Chinook Salmon Population and Related Hatchery Programs January 31, 2009 Columbia River Hatchery Reform Project -
Hatchery Scientific Review Group Review and Recommendations
 Hatchery Scientific Review Group Review and Recommendations Lochsa River Spring Chinook Population and Related Hatchery Programs January 31, 2009 Lochsa River Spring Chinook Population Report Page - 1
Joint Columbia River Management Staff
 2017 JOINT STAFF REPORT: STOCK STATUS AND FISHERIES FOR SPRING CHINOOK, SUMMER CHINOOK, SOCKEYE, STEELHEAD, AND OTHER SPECIES Joint Columbia River Management Staff Oregon Department of Fish & Wildlife
SONAR ESTIMATION OF ADULT STEELHEAD: VARIOUS METHODS TO ACCOUNT FOR KELTS IN DETERMINING TOTAL ESCAPEMENT
 SONAR ESTIMATION OF ADULT STEELHEAD: VARIOUS METHODS TO ACCOUNT FOR KELTS IN DETERMINING TOTAL ESCAPEMENT Michael D. Sparkman (CDFW) Fisheries Biologist North Coast Sonar Coordinator Coastal Steelhead
2012 JOINT STAFF REPORT: STOCK STATUS AND FISHERIES FOR FALL CHINOOK SALMON, COHO SALMON, CHUM SALMON, SUMMER STEELHEAD, AND WHITE STURGEON
 2012 JOINT STAFF REPORT: STOCK STATUS AND FISHERIES FOR FALL CHINOOK SALMON, COHO SALMON, CHUM SALMON, SUMMER STEELHEAD, AND WHITE STURGEON Joint Columbia River Management Staff Washington Department of
Confederated Tribes of the Warm Springs Reservation
 Confederated Tribes of the Warm Springs Reservation PACIFIC LAMPREY STUDIES Cyndi Baker Jen Graham Joel Santos Matt Fox Lamprey Program History 1997: Member of lamprey working group 2002: First lamprey
3. The qualification raised by the ISRP is addressed in #2 above and in the work area submittal and review by the ISRP as addressed in #1.
 Please find attached a response from The Confederated Tribes of the Warm Springs Reservation of Oregon (CTWSRO) for Project # 2008-301-00, Habitat Restoration Planning, Design and Implementation within
C R I TFC. Columbia River Inter-Tribal Fish Commission
 Columbia River Inter-Tribal Fish Commission 700 NE Multnomah, Suite 1200 503.238.0667 Portland, OR 97232 www.critfc.org C R I TFC T E CHNI C AL R E P O R T 13-07 Analyses for Effect of Survey Week and
 Informational Report 1 USFWS Mass Marking Update April 2005 Update on USFWS 2005 Mass Marking Initiative Background Under Section 138 of FY 2003 Omnibus Appropriations Act (PL 108-7), Congress directed
Sandy River Fisheries Management Update. Todd Alsbury District Fish Biologist (Cascade Unit)
") Sandy River Fisheries Management Update Todd Alsbury District Fish Biologist (Cascade Unit) Presenta(on Outline Remembering Marmot Dam Sandy River Popula(on Es(mates Sandy Spring Chinook Stray Control
Sandy River Fisheries Management Update Todd Alsbury District Fish Biologist (Cascade Unit) Presenta(on Outline Remembering Marmot Dam Sandy River Popula(on Es(mates Sandy Spring Chinook Stray Control
EVALUATION OF FALL CHINOOK AND CHUM SALMON SPAWNING BELOW BONNEVILLE DAM
 EVALUATION OF FALL CHINOOK AND CHUM SALMON SPAWNING BELOW BONNEVILLE DAM Annual Report 2002-2003 Prepared by Wayne van der Naald Roy Clark Robert Brooks And Cameron Duff Oregon Department of Fish and Wildlife
August 11 Snorkel SCC side channel network (SBA, SCC3) feet 707
 feet 707") Date Survey Type Habitat July 29 Snorkel (reconnaissance) Table 1. Fish use survey schedule 2004 Water temperature 1 (ºC) Estimated Mean visibility 2 discharge 3 (cfs) Mainstem (units #1 42) ND ND 814
Date Survey Type Habitat July 29 Snorkel (reconnaissance) Table 1. Fish use survey schedule 2004 Water temperature 1 (ºC) Estimated Mean visibility 2 discharge 3 (cfs) Mainstem (units #1 42) ND ND 814
MEMORANDUM Oregon Department of Fish and Wildlife
 Attachment 4 MEMORANDUM Oregon Department of Fish and Wildlife Date: July 19, 2007 To: From: Oregon Fish and Wildlife Commission Steve Williams, Assistant Fish Division Administrator Inland Fisheries Subject:
State of California The Resources Agency DEPARTMENT OF FISH AND GAME
 State of California The Resources Agency DEPARTMENT OF FISH AND GAME FINAL REPORT SHASTA AND SCOTT RIVER JUVENILE SALMONID OUTMIGRATION MONITORING PROJECT Prepared for the Pacific States Marine Fisheries
APPENDIX B. Final reports on chinook salmon spawning surveys - Sultan River, Washington Report
 APPENDX B Final reports on chinook salmon spawning surveys - Sultan River, Washington B-1. B-2. 1987 Report. 1988 Report APPENDX B-l Final report on 1987 chinook spawning survey - Sultan River, Snohomish
Brian Missildine Natural Resource Scientist Hatchery Evaluation and Assessment Team Lead Washington-British Columbia Annual General Meeting Kelowna,
 Brian Missildine Natural Resource Scientist Hatchery Evaluation and Assessment Team Lead Washington-British Columbia Annual General Meeting Kelowna, BC March 19-22 REFORMER REFORMED WA Dept. of Fish and
Monitoring of Downstream Fish Passage at Cougar Dam in the South Fork McKenzie River, Oregon February 8, By Greg A.
 Monitoring of Downstream Fish Passage at Cougar Dam in the South Fork McKenzie River, Oregon 1998- February 8, 2 By Greg A. Taylor Oregon Dept. of Fish & Wildlife 315 E. Main Street Springfield, OR 97478
CHAPTER 2 - THE COQUILLE FISHERY
 CHAPTER 2 - THE COQUILLE FISHERY TABLE OF CONTENTS A. INTRODUCTION... 2-1 FIGURE 2-1 Life Histories of Anadromous Salmonids in the Coquille River... 2-2 1. Coho Salmon... 2-2 FIGURE 2-2 Coho Packed or
The following language describing the performance standards was taken from the Reasonable and Prudent Alternative Table of Actions in the 2008 BIOP:
 FISH PASSAGE CENTER 1827 NE 44 th Ave., Suite 240, Portland, OR 97213 Phone: (503) 230-4099 Fax: (503) 230-7559 http://www.fpc.org/ e-mail us at fpcstaff@fpc.org MEMORANDUM TO: FROM: Michele DeHart Margaret
California Steelhead: Management, Monitoring and Recovery Efforts
 California Steelhead: Management, Monitoring and Recovery Efforts Jonathan Nelson Steelhead Management, Research and Restoration Program Oncorhynchus mykiss irideus California Steelhead - Hot Topics Implementation
Sub-watershed Summaries
 Project Description The Salmon Drift Creek Watershed Council (SDCWC) has focused their efforts in the Salmon River estuary for the past few years. The multifaceted partnership effort is nearing completion
Juvenile chum migration patterns in the lower Columbia River and estuary
 Juvenile chum migration patterns in the lower Columbia River and estuary Curtis Roegner Dan Bottom Kristen Homel Thanks to the many NOAA and CE colleagues! * Columbia River Estuary Workshop 214 * Collapse
Minnesota Department of Natural Resources Fisheries Division, Lake Superior Area
 Minnesota F-9-R(P)- Study 4 Job 616 Minnesota Department of Natural Resources Fisheries Division, Lake Superior Area Coaster Brook Trout Status in Minnesota-Lake Superior Tributaries Following Regulation
Klamath Lake Bull Trout
 Klamath Lake Bull Trout Existing Populations The Klamath Lake Bull Trout SMU is comprised of seven existing populations and four populations classified as extinct or functionally extinct (Table 189). Populations
Agenda Item Summary BACKGROUND. Public Involvement ISSUE ANALYSIS. Attachment 1
 Agenda Item Summary Attachment BACKGROUND Between 996 and 03 white sturgeon fisheries in the Columbia River downstream from Bonneville Dam were managed under a series of management accords between the
Conditions affecting the 2011 and 2012 Fall Chinook Adult Returns to Spring Creek National Fish Hatchery.
 FISH PASSAGE CENTER 1827 NE 44 th Ave., Suite 240, Portland, OR 97213 Phone: (503) 230-4099 Fax: (503) 230-7559 http://www.fpc.org/ e-mail us at fpcstaff@fpc.org MEMORANDUM TO: Liz Hamilton, NSIA FROM:
MEMORANDUM Oregon Department of Fish and Wildlife
 Attachment 3 MEMORANDUM Oregon Department of Fish and Wildlife Date: July 23, 2009 To: From: Oregon Fish and Wildlife Commission Bruce McIntosh, Assistant Fish Division Administrator Inland Fisheries Subject:
Backgrounder and Frequently Asked Questions
 Backgrounder and Frequently Asked Questions Who Sent the Letter? The 60-day Notice of Intent to File Suit was sent by Conservation Angler, Wild Fish Conservancy, Snake River Waterkeeper, Friends of the
Job 1. Title: Estimate abundance of juvenile trout and salmon.
 STUDY PERFORMANCE REPORT State: Michigan Project No.: F-53-R-13 Study No.: 461 Title: Population dynamics of juvenile rainbow trout and coho salmon in Lake Superior tributaries Period Covered: April 1,
Addressing Critical Uncertainties in the Reintroduction of Chum Salmon to Oregon Tributaries of the Columbia River. Kris Homel
 Addressing Critical Uncertainties in the Reintroduction of Chum Salmon to Oregon Tributaries of the Columbia River Kris Homel NW Fish Culture Concepts Wilsonville, OR 2015 Historic distribution and abundance
Reducing Impacts of Hatchery Steelhead Programs. Robert B. Lindsay Ken R. Kenaston R. Kirk Schroeder
 Reducing Impacts of Hatchery Steelhead Programs Robert B. Lindsay Ken R. Kenaston R. Kirk Schroeder Oregon Department of Fish and Wildlife 2501 S.W. First Street P.O. Box 59 Portland, Oregon 97207 January
Appendix M. Gas Bubble Trauma Monitoring and Data Reporting for 2007
 Appendix M Gas Bubble Trauma Monitoring and Data Reporting for 2007 FISH PASSAGE CENTER 1827 NE 44 th Ave., Suite 240, Portland, OR 97213 Phone: (503) 230-4099 Fax: (503) 230-7559 http://www.fpc.org e-mail
Joint Columbia River Management Staff
 2009 JOINT STAFF REPORT: STOCK STATUS AND FISHERIES FOR SPRING CHINOOK, SUMMER CHINOOK, SOCKEYE, STEELHEAD, AND OTHER SPECIES, AND MISCELLANEOUS REGULATIONS Joint Columbia River Management Staff Oregon
PLA~or. Salmon and Watershed s. Klamath Mountains Province Steelhead Project, Annual Report. Report Number: OPSW-ODFW
 DOCUM4ENT OR FW.3K66 2001-02 THIS PIRJ~T,1 PLA~or Salmon and Watershed s Klamath Mountains Province Steelhead Project, 2001-02 Annual Report Report Number: OPSW-ODFW-2004-08 Klamath Mountains Province
FINAL HATCHERY AND GENETIC MANAGEMENT PLAN (HGMP)
") FINAL HATCHERY AND GENETIC MANAGEMENT PLAN (HGMP) Hatchery Program: Sandy Hatchery Spring Chinook Species or Hatchery Stock: Sandy River Spring Chinook (Stock 11) Agency/Operator: Oregon Department of
FINAL HATCHERY AND GENETIC MANAGEMENT PLAN (HGMP) Hatchery Program: Sandy Hatchery Spring Chinook Species or Hatchery Stock: Sandy River Spring Chinook (Stock 11) Agency/Operator: Oregon Department of
Proposed 2018 Fisheries Management Measures to Support Recovery of Interior Fraser River Steelhead
 Proposed 2018 Fisheries Management Measures to Support Recovery of Interior Fraser River Steelhead 22-March-2018 Spawning escapements of two Interior Fraser River steelhead stocks, Thompson and Chilcotin
Exhibit C. Mike Gauvin -Recreational Fisheries Program Manager. September 14 th 2018
 2019 Sport Fishing Regulations Exhibit C Mike Gauvin -Recreational Fisheries Program Manager September 14 th 2018 1 Topics for Consideration Public involvement in 2019 regulation process Issue 1: OAR s,
Early Marine Migrations. General geography Four general patterns Influence of genetics
 Early Marine Migrations General geography Four general patterns Influence of genetics Coastal range of anadromous Pacific salmon and trout Techniques employed to study salmon at sea Recently developed
Adult Sockeye survival in the Bonneville to McNary Dam Reach
 FISH PASSAGE CENTER 1827 NE 44 th Ave., Suite 240, Portland, OR 97213 Phone: (503) 230-4099 Fax: (503) 230-7559 http://www.fpc.org/ e-mail us at fpcstaff@fpc.org MEMORANDUM TO: Stuart Ellis (CRITFC) FROM:
Data Report : Russian River Basin Steelhead and Coho Salmon Monitoring Program Pilot Study
 Data Report 1999-1: Russian River Basin Steelhead and Coho Salmon Monitoring Program Pilot Study Sonoma County Water Agency 215 West College Avenue Santa Rosa, California 951 Prepared by David Cook Senior
Job Performance Report, Project F-73-R-9 Subproject II: SALMON AND STEELHEAD INVESTIGATIONS Study I: Salmon Spawning Ground Surveys
 FEDERAL AID IN FISH RESTORATION Job Performance Report, Project F-73-R-9 Subproject II: SALMON AND STEELHEAD INVESTIGATIONS Study I: Salmon Spawning Ground Surveys By Judy Hall-Griswold, Fishery Technician
UC Coho Salmon and Steelhead Monitoring Report: Summer 2016
 UC Coho Salmon and Steelhead Monitoring Report: Summer 2016 Prepared by: Mariska Obedzinski, Nick Bauer, Andrew Bartshire, and Andrew McClary California Sea Grant at University of California January 2017,
EXHIBIT ARWA-700 TESTIMONY OF PAUL BRATOVICH
 EXHIBIT ARWA-700 TESTIMONY OF PAUL BRATOVICH 1. I am a fisheries biologist employed by the firm of HDR, Inc. I hold a Bachelor of Science degree in Fisheries from the University of Washington, located
August 3, To: Rob Jones NOAA Fisheries 1201 NE Lloyd Blvd, Suite 1100 Portland, Oregon Dear Mr. Jones,
 August 3, 2010 To: Rob Jones NOAA Fisheries 1201 NE Lloyd Blvd, Suite 1100 Portland, Oregon 97232 Dear Mr. Jones, Public Utility District No.1 of Chelan County (Chelan) respectfully submits the 2009 Wenatchee
Warner Lakes Redband Trout
 Warner Lakes Redband Trout Existing Populations Warner Valley is an endorheic basin that contains a complex series of interconnected lakes, marshes, sloughs, and potholes, all of which are remnants of
Applied population biology: pacific Salmon
 Applied population biology: pacific Salmon Applied population biology: pacific Salmon Topics relevant to salmon conservation Environmental stochasticity Selection vs. Drift Maladaptation Competition Gene
Kirt Hughes Washington Department of Fish and Wildlife Region 6 - Fish Program Manager
 Kirt Hughes Region 6 - Fish Program Manager Habitat Hatcheries Harvest Clean Water Act Shorelines Harvest Hydro Habitat Forest Practices Non-regulatory Programs Water Supply & Conservation Growth Management
Stock Assessment of Elk River Fall Chinook Salmon for Exploitation Rate Analysis
 Stock Assessment of Elk River Fall Chinook Salmon for Exploitation Rate Analysis Prepared by: Ron Williams Oregon Department of Fish and Wildlife 3406 Cherry Avenue Salem, Oregon 97302 March 2004 This
Burns Paiute Tribe Fisheries Department. Evaluate The Life History Of Native Salmonids Within The Malheur Subbasin Project #
 Burns Paiute Tribe Fisheries Department Evaluate The Life History Of Native Salmonids Within The Malheur Subbasin Project # 199701900 Prior to 1990 Technical and/or scientific background Malheur population,
Salmon age and size at maturity: Patterns and processes
 Salmon age and size at maturity: Patterns and processes 1. Age Designation 2. Variation among populations 1. Latitude 2. Within regions 3. Within watersheds 3. Variation within populations 1. Smolt size
INFORMATION REPORTS. Number FISH DIVISION. Oregon Department of Fish and Wildlife
 INFORMATION REPORTS Number 2001-07 FISH DIVISION Oregon Department of Fish and Wildlife Estimating Run Size and Spawner Escapement of Chinook Salmon in Elk River, CurryCounty, for use as an Exploitation
FINAL HATCHERY AND GENETIC MANAGEMENT PLAN (HGMP)
") FINAL HATCHERY AND GENETIC MANAGEMENT PLAN (HGMP) Hatchery Program: Sandy River Coho Salmon Program Species or Hatchery Stock: Coho Salmon (Stock 11) Agency/Operator: Oregon Department of Fish and Wildlife
FINAL HATCHERY AND GENETIC MANAGEMENT PLAN (HGMP) Hatchery Program: Sandy River Coho Salmon Program Species or Hatchery Stock: Coho Salmon (Stock 11) Agency/Operator: Oregon Department of Fish and Wildlife
Deschutes Bull Trout
 Deschutes Bull Trout Existing Populations The Deschutes Bull Trout SMU is comprised of eight populations, three of which are classified as extinct (Table 1). Populations are identified according to those
Executive Summary. Map 1. The Santa Clara River watershed with topography.
 Santa Clara River Steelhead Trout: Assessment and Recovery Opportunities December 2005 Prepared By: Matt Stoecker and Elise Kelley, Ph.D. University of California, Santa Barbara Prepared For: The Santa
Appendix A Recommended EPA Temperature Thresholds for use in Establishing Thermal Potential and Species Life Stage Numeric Criteria
 Appendix A Recommended EPA Temperature Thresholds for use in Establishing Thermal Potential and Species Life Stage Numeric Criteria 1. Temperature Limits Recommended to Protect Salmonid Guilds In this
UC Coho Salmon and Steelhead Monitoring Report: Summer 2017
 UC Coho Salmon and Steelhead Monitoring Report: Summer 2017 Prepared by: Andrew McClary, Nick Bauer, Andrew Bartshire, and Mariska Obedzinski California Sea Grant at University of California February 2018,
ANNUAL PROGRESS REPORT FISH RESEARCH PROJECT OREGON. PROJECT TITLE: Spring Chinook Salmon in the Willamette and Sandy Rivers
 ANNUAL PROGRESS REPORT FISH RESEARCH PROJECT OREGON PROJECT TITLE: Spring Chinook Salmon in the Willamette and Sandy Rivers PROJECT NUMBER: F-163-R-09 PROJECT PERIOD: October 2003 through September 2004
Modeling Salmon Behavior on the Umpqua River. By Scott Jordan 6/2/2015
 Modeling Salmon Behavior on the Umpqua River By Scott Jordan 6/2/2015 1 Importance of Salmon Delicious Recreation 631,000 people in Oregon went fishing in 2008 spent $264.6 Million on fishing trips Commercial