2002 Post Season Fishing and Hunting Report. Report to the Point No Point Treaty Council
|
|
|
- Christina Bridges
- 5 years ago
- Views:
Transcription
1 2002 Post Season Fishing and Hunting Report Report to the Point No Point Treaty Council May, 2003
2
3 Table of Contents INTRODUCTION SALMON FISHERIES... 3 Overview... 3 Pre-terminal Area Fisheries Troll Fishery Fraser Sockeye Chinook Salmon Coho Salmon Chum Salmon Terminal Area Fisheries Strait of Juan de Fuca Chinook Salmon Coho Salmon Steelhead Hood Canal Chinook Salmon Coho Salmon Chum Salmon HALIBUT FISHERIES Overview Unrestricted Fishery Restricted Fishery Mop-Up Fishery PNPTC Tribes 2002 Halibut Fishery HATCHERY PRODUCTION Overview Lower Elwha Hatchery Little Boston Hatchery / Port Gamble Net Pens Enetai Hatchery / Quilcene Bay Net Pens Historical Production from Tribal Facilities SHELLFISHERIES Clams and Oysters Shrimp Dungeness Crab Geoduck Clams Sea Urchins and Sea Cucumbers HUNTING Overview Harvest Data... 65
4 List of Tables Table Puget Sound Commercial Salmon Harvest... 3 Table Point No Point Treaty Tribes Commercial Salmon Harvest... 3 Table Point No Point Treaty Tribes Commercial Salmon Harvest by Species and Tribe... 5 Table 4. Treaty Commercial Fisheries for Pacific Halibut Table Annual Hatchery Production Summary Table 6. Historical Lower Elwha Hatchery Production in Numbers and Pounds Table 7. Historical Little Boston Hatchery Production in Numbers and Pounds Table 8. Historical Enetai Hatchery Production in Numbers and Pounds Table 9. Historical Port Gamble and Quilcene Bay Pens Coho Production in Numbers and Pounds Table 10. PNPTC Tribes 2002 Sharing of Hood Canal Clams Table 11. PNPTC Tribes Clam Harvest for the 2002 Season Table 12. PNPTC Tribal Oyster Harvest for the 2001 Season Table Clam Allocation vs. PNPTC Tribal Clam Harvest Table 14. PNPTC Tribal Spot Shrimp Harvest for the 2001 Season Table 15. PNPTC Tribal Crab Harvest for the 2001 Season Table 16. PNPTC Tribal Geoduck Harvest for the 2002 Season Table PNPTC Tribal Geoduck Shares with Suquamish/S Klallam Share Exchange Table 18. PNPTC Tribal and Makah Tribe Sea Urchin Harvest for the Season Table 19. Combined Point No Point Treaty Tribes Harvest for the Hunting Season*... 65
5 List of Figures Figure 1. Historical Trends of the PNPTC Tribes' Chinook, Coho, Sockeye and Chum Salmon Catch... 4 Figure 2. PNPTC Tribes' Proportion Trends and 2002 Distribution of Chinook Salmon Treaty Catch... 6 Figure 3. PNPTC Tribes' Proportion Trends and 2002 Distribution of Coho Salmon Treaty Catch... 7 Figure 4. PNPTC Tribes' Proportion Trends and 2002 Distribution of Sockeye Salmon Treaty Catch... 8 Figure 5. PNPTC Tribes' Proportion Trends and 2002 Distribution of Chum Salmon Treaty Catch... 9 Figure 6. PNPTC Fisheries Participants ( ) Figure 7. PNPTC Commercial Fishing Vessels ( ) Figure 8. Western Strait of Juan de Fuca Sockeye Salmon Catch and Distribution Figure 9. Western Strait of Juan de Fuca Sockeye Salmon Share Trends Figure 10. Western Strait of Juan de Fuca Coho Salmon Catch and Distribution Figure 11. Western Strait of Juan de Fuca Chum Salmon Catch Figure 12. Quilcene Area Coho Salmon Harvest Figure 13. Lower Elwha Hatchery Production Figure 14. Little Boston Hatchery Production Figure 15. Enetai Hatchery Production Figure 16. Port Gamble and Quilcene Bay Pens Production Figure 17. Bangor Tidelands Clam Density Surveys Figure Clam Harvest by Tribe Figure Oyster Harvest by Tribe Figure 20. Historical Clam and Oyster Harvest of the PNPTC Tribes Figure Spot Shrimp Harvest by Tribe Figure 22. Historical Spot Shrimp Harvest of the PNPTC Tribes Figure Crab Harvest by Tribe Figure 24. Historical Crab Harvest of the PNPTC Tribes Figure 25. CPUE Trends in the In-Common Hood Canal Crab Fishery Figure Geoduck Harvest by Tribe Figure 27. Historical Geoduck Harvest of the PNPTC Tribes Figure 28. Red Sea Urchin and Sea Cucumber Harvest Figure 29. PNPTC Tribes' Deer and Elk Harvest Trends Figure 30. PNPTC Tribes' Deer and Elk Harvest, Compared to NonTreaty Figure 31. Treaty / Non-Treaty Elk Harvest Figure 32. PNPTC Tribes Elk Harvest by Sex... 69
6
7 INTRODUCTION In 2002, the Point No Point Treaty Council member tribes participated in traditional fishing, shellfishing and hunting activities. The Point No Point Treaty Area fisheries in 2002, were governed by several intertribal and Tribal-State agreements. These included the 2002 State-Tribal Preseason Agreed-to Salmon Fisheries Document, the sockeye tribes fishing plan, the PNPTC Revised Off-Reservation Fisheries Management Compact, the Summer Chum Salmon Conservation Initiative, the Puget Sound Comprehensive Chinook Management Plan, the Tribal/Navy Indian Island Clam Harvest Plan, and several State-Tribal annual shellfish management plans. All fisheries in the Point No Point Treaty Area were managed within the confines of these agreements, and included protective measures for recently listed Hood Canal - Strait of Juan de Fuca summer chum and Puget Sound chinook salmon. The Tribal-State salmon agreements, incorporated in the Preseason Fisheries Document, grew out of the negotiations held during Pacific Fishery Management Council (PFMC) preseason meetings. The preseason agreements included measures to limit impacts to wild coho, summer chum and chinook salmon in the Strait of Juan de Fuca recreational fisheries, while allowing recreational fisheries some opportunity to harvest hatchery reared salmon, through the use of mark selective retention. Non-treaty recreational fisheries in inner Puget Sound areas were generally managed through time-area restrictions. Non-treaty commercial fisheries in Hood Canal were restricted to a skiff gear fishery, for coho in the Quilcene and Port Gamble areas, and fall chum fisheries in north and central Hood Canal. A number of measures were also designed to protect Strait of Juan de Fuca wild coho which included harvest management based on exploitation rate limits, as agreed with with the WDFW and the Makah Tribe. Additional management measures were taken to give ESA listed Hood Canal summer chum and Puget Sound chinook salmon stocks the protection required. Fisheries were designed to limit impacts on these stocks through closures and gear restrictions. Selective fishery practices were also established to reduce impacts on non-target species needing protection. The Puget Sound Intertribal Allocation Agreements, adopted in 1996, expired in In 2002 Treaty Area fisheries were governed by the PNPTC Compact and ad-hoc agreements to regulate sockeye at directed coho harvests in the Strait of Juan de Fuca. Management of shellfish species both inside and outside Hood Canal, with the usual and accustomed fishing area of the Point No Point Treaty Tribes, followed jointly agreed management plans for each species between the Point No Point Tribes and the State of Washington. The 2002 plans for each commercially important shellfish species closely mirrored 2001 plan provision. The Puget Sound Treaty Tribes and the Washington Department of Fish and Wildlife agreed to a new process for developing annual shellfish management plans, beginning with the 2002 season. Management plans will now be developed to cover a term of 2 years, with intermediate years used to produce plan amendments stipulating projected changes in the total allowable catch and other minor management modifications. For 2002, the Puget Sound crab and shrimp plans were scheduled for full development. The 2001 Puget Sound geoduck, bivalve, sea cucumber and sea urchin plans underwent minor modifications to cover 2002 fisheries, and will undergo full development in The PNPTC Revised Off-Reservation Fisheries Management Compact was scheduled for a 2-year review and possible modification prior to the start of the 2002 shellfish season. The PNPTC Board of Directors established a working subcommittee, composed of Tribal representatives and Central Office staff, to identify proposed Compact modifications and compose settlement options for the Board s consideration. The modified Compact was to form the basis for tribal shellfish management strategies for the 2002 season. 1
8 Unfortunately, the review / modification process was not completed. Disagreement among the four PNPTC Tribes over the level of support each Tribe would contribute to the PNPTC Central Office programs prevented the Board from focusing on the Compact review process. While the existing Compact continued to provide management guidance for most shellfish species, it was inadequate to provide a management framework for PNPTC crab fisheries. As a result, temporary intertribal management plans for Hood Canal and the Strait of Juan de Fuca were developed to address PNPTC crab fisheries in The Point No Point Treaty tribes opened their traditional hunting areas in all or part of 12 Game Management Units (GMUs) covering most of the north, east, and south sides of the Olympic Peninsula during the hunting season. This report contains data from the Port Gamble S Klallam, Jamestown S Klallam, Lower Elwha Klallam, and Skokomish tribes. Harvest data were not yet available from the WDFW, and other tribes when this report was prepared. Elk harvest was 65 in , which is down about 10% from the previous year, due to lower harvest in the Olympic GMU. Elk harvest in was about the same as in 1999 and Deer harvest totaled 185 in and was up over 15% from , but still less than the 218 harvested in 1997 and The Point No Point Treaty tribes percentage of the overall big game harvest on the Olympic Peninsula has been about the same for the last 5 years. Of the total harvest, the PNPTC tribes took about 30% of the elk and about 5% of the deer in the 12 GMUs opened by the tribes. 2
9 2002 SALMON FISHERIES Overview During 2002, the catches of salmon, except chinook and chum salmon, by the Point No Point Treaty Council (PNPTC) tribes fishers were similar or decreased from 2001, and were generally lower than the recent years mean (Figure 1). The reasons for this are somewhat mixed. This is because in some fisheries participation was very low, compared to historical levels, while in other fisheries, the low catch is part of an overall set of fishery restrictions throughout Puget Sound. A better way to look at this may be to compare the PNPTC tribes share of each species catch to past shares. Those would show that as a percentage share of the total treaty harvest in Puget Sound, over the past 15 years, 2002 was below the average for coho and sockeye salmon, but above the mean for chinook and chum salmon (Figures 2-5). Commercial harvests for the 2002 season are also summarized in Tables 1-3. The 2002 percentage of chinook salmon catch was higher than in prior years (similar to levels reached in the late 1980's) was due to fishery openings in Area 12C which target Hoodsport Hatchery and George Adams returns. The Point No Point tribes together took approximately 43% of the treaty chum catch and 33% of the treaty chinook salmon catch. In Puget Sound, the PNPTC tribal harvest of coho only amounted to 6% (compared to a 15 year average of 8%) and the sockeye salmon catch amounted to less than 0.5% (compared to a 15 year average of 5%) (Table 3; Figures 2-5). The overall number of licensed tribal fishers in the Point No Point Treaty Area has remained steady over the last several years (Figure 6). In 2002, there were 426 licensed fishers, representing a slight decrease from the 442 licensed in Given the current status of the salmon fishery, a large proportion of these fishers were occupied in shellfisheries. With salmon prices remaining at very low levels, interest in shellfishing opportunity remained quite high. The size of the PNPTC fleet slightly increased, from 57 registered larger fishing vessels (over 20 feet) in 2001, to 61 in The majority of the licensed vessels however are small skiffs, numbering over150. Port Gamble and Lower Elwha accounted for 2/3 of the larger vessels. The remainder was divided almost evenly between the Skokomish and Jamestown S Klallam. (Figure 7). Table Puget Sound Commercial Salmon Harvest Chinook Chum Coho Sockeye Treaty 67, , , ,910 NonTreaty 17,413 1,117,194 24, ,456 Total 84,859 1,433, , ,366 Table Point No Point Treaty Tribes Commercial Salmon Harvest Chinook Chum Coho Sockeye Total Harvest 22, ,544 14,415 1,395 % of Total Treaty 33.33% 42.84% 5.97% 0.43% % of T+NT 26.49% 9.45% 5.42% 0.30% 3
10 Figure 1. Historical Trends of the PNPTC Tribes' Chinook, Coho, Sockeye and Chum Salmon Catch 4
11 Table Point No Point Treaty Tribes Commercial Salmon Harvest by Species and Tribe Species Lower Elwha Jamestown Port Gamble Skokomish Number % Number % Number % Number % Total Chinook % 0 0.0% % 22, % 22,480 Chum 1 0.0% % 0 0.0% 135, % 135,544 Coho 3, % 2, % % 8, % 14,415 Sockeye % 0 0.0% % 0 0.0% 1,395 Total 3,612 2,894 1, , ,834 5

12 Figure 2. PNPTC Tribes' Proportion Trends and 2002 Distribution of Chinook Salmon Treaty Catch 6
13 Figure 3. PNPTC Tribes' Proportion Trends and 2002 Distribution of Coho Salmon Treaty Catch 7
14 Figure 4. PNPTC Tribes' Proportion Trends and 2002 Distribution of Sockeye Salmon Treaty Catch 8

15 Figure 5. PNPTC Tribes' Proportion Trends and 2002 Distribution of Chum Salmon Treaty Catch 9

16 Figure 6. PNPTC Fisheries Participants ( ) 10


17 Figure 7. PNPTC Commercial Fishing Vessels ( ) 11
18 Pre-terminal Area Fisheries Troll Fishery In 2002, the treaty ocean troll was limited to a chinook salmon only season of May 01-June 30 (total quota 30,000 chinook) with no coho retention and an July 01 Sept 15 season, for chinook and coho salmon with subquotas of 30,000 chinook or 60,000 coho salmon. These were the largest quotas for the treaty troll salmon season and the first time the all-species fishery opened in July of No participation occurred in the ocean troll fishery by PNPTC tribes. Given extremely low prices being offered to fishers, neither quota was fully harvested. The total harvest of chinook was 39,115 and that of coho was 17,493. The majority of treaty troll catch was taken in by the Makah who landed 38,918 chinook and 16,412 coho salmon. Fraser Sockeye For sockeye salmon, the new Pacific Salmon Treaty (PST) agreement relies on an initial reduction of the U.S. share (compared to prior years), with additional reductions phased in, through a nontreaty license buyback program through The final effect is that despite significant reductions in the U.S. annual share of sockeye salmon, the treaty harvest was somewhat protected by agreeing that the nontreaty reduction shall not affect the tribes share, effectively deviating from the sharing rule for the duration of the PST annex. The annex also specifies a fixed annual share of the TAC (total allowable catch) for the U.S. and the treaty fishery. Intertribal sharing agreements which expired in the year 2000, were not renewed. For 2002, an ad-hoc agreement was made to secure a minimum opportunity to harvest 12.5% of the treaty TAC, in the Strait of Juan de Fuca fishery. The 2002 Fraser sockeye salmon run management was dominated by concerns over the potential mortality of early migrating late runs. This was particularly important, in view of the fact that the dominant run in 2002 was Adams River, which is classified as a late run. The pre-season forecasted share of the U.S. was approximately 986,000. However, during the season, the overlap between the summer runs and the late runs appeared to increase, thus reducing harvest opportunities in areas where both were present. This resulted in significant restrictions to the U.S. fishery. At the end of the season, it became apparent that much of the anticipated mortality of late run sockeye did not occur, resulting in record spawning escapements, particularly for the Adams River run. The U.S. share, near the end of the season, stood at 980,00, including reductions for paybacks. The harvest in U.S. waters however was approximately 466,000. The Strait of Juan de Fuca treaty fishery had a minimum opportunity share of approximately 80,000, but early closures restricted the harvest to such an extent that it could not be made up in the latter part of the season. The sockeye catch in the Strait was approximately 45,500 sockeye. Of that, only 1,400 were taken by Klallams, due to very low participation. 12

19 Figure 8. Western Strait of Juan de Fuca Sockeye Salmon Catch and Distribution 13
20 Figure 9. Western Strait of Juan de Fuca Sockeye Salmon Share Trends 14
21 Chinook Salmon There was some harvest of chinook in pre-terminal Strait of Juan de Fuca fisheries. The annual catch (net and troll - summer and winter combined) totaled 4,264. Of that, the S Klallam fishers harvested only 26 and the rest were taken by Makah. Coho Salmon For 2002, a Treaty gillnet fishery for coho salmon was operated in the Strait of Juan de Fuca. This fishery had been initially designed to run for two days/week for five weeks, from the end of Fraser Panel control, on September 8 through the second week of October. This fishery was adjusted to take into account the numbers of coho taken in the sockeye/pink fishery. After the initial opening, low effort participation resulted in weekly opening expansions from two, to four days per week, until the end of the fishery. Less than 700 coho were reported from this fishery, due toe extremely low effort. No PNPTC fishers participated and all landings were made by Makah. Incidental coho catches by treaty fishers during the Strait sockeye fisheries, as well as during the fall chum fishery amounted to approximately an additional 5,300 fish. Of these additional fish, the S Klallam fishers harvesting only 211 fish and the Makah harvested the remainder, primarily as drift gillnet bycatch. Chum Salmon The 2002 fall chum treaty fishery in the Strait began the week of October 13 and ended November 9. Effort was very limited due to the low prices offered for chum salmon. The total chum catch was only 1,303 fish in the Strait fishery. S Klallam fishers did not participate in this fishery, with Makah accounting for the entire catch. In the San Juans (Areas 7 and 7A), Treaty fisheries took place over the period from October 15, through November 1. The treaty harvest target in this fishery was 60,000, and the estimated catch was 61,316. PNPTC fishers did not participate in this fishery. 15

22 Figure 10. Western Strait of Juan de Fuca Coho Salmon Catch and Distribution 16
23 Figure 11. Western Strait of Juan de Fuca Chum Salmon Catch 17
24 Terminal Area Fisheries Strait of Juan de Fuca Chinook Salmon In 2002, the terminal area fisheries in the Strait were focused on the Elwha and Dungeness rivers coho runs. The chinook season was closed because of the need for protective measures for the conservation of ESA listed stocks, expected to return at levels below those needed to meet escapement requirements. The 2002 forecasted return of chinook to the Elwha River was 2,358, with an additional expected prespawning mortality of 45 and a total escapement requirement of 2,900. The actual total escapement was 2,416, minus 40 pre-spawning mortalities. Chinook escapement to the Dungeness River was, in relative terms, exceptional at 630 fish. These were the result of the supplementation program for this stock. No fishery directed at chinook salmon took place in the Elwha or Dungeness terminal areas. Coho Salmon The 2002 forecasted return of coho salmon (as estimated by preseason model simulations) to the Elwha River was approximately 3,988 fish. The expected escapement to the river and the hatchery facilities was 2,119. Since no reliable inseason updating method has been found for the Elwha run, the fishery was again paced, according to the plan established by PNPTC and the Lower Elwha Tribe a number of years past, for the purpose of ensuring that adequate escapements to the Elwha Hatchery were met. The run was somewhat higher than predicted, as evidenced by the fact that in-river harvest was 2,765 coho (1,442 predicted). Escapement estimates are currently unavailable, but it is expected that they were at or near the forecasted level. Coho fisheries in Dungeness Bay operated similar to previous years with fisheries beginning the week of 9/22 and extending through November 2. Release of chum and chinook was required through 10/10. A treaty harvest of and non-treaty harvest of 3,708 coho salmon occurred in area 6D during the 2002 season. An inseason update relating terminal run size to total (treaty and non-treaty) catch and landings of abundance was performed for coho entering area 6D. It was found that catch, cumulative catch and CPUE were within the historical range, and the fishery was allowed to operate an additional week to harvest available coho salmon, with chum release. Observations indicated that relatively high abundance of coho escaped to the hatchery and river spawning areas, however estimation of the natural escapement, as a function of the hatchery, may be hampered by the implementation of an in-river nontreaty mark-selective recreational fishery.. Given the usually low return of fall chum salmon to Strait of Juan de Fuca rivers, no fisheries for fall chum were planned or implemented in terminal areas in Steelhead In 2002, PNPTC fishers exercised their treaty right to fish steelhead commercially in the Elwha River. The commercial catch of steelhead catch was very low, due to extremely low participation in 2001/2002. The eggtake and escapement goal of 150 fish at the Elwha hatchery were met. 18
25 Hood Canal The 2002 Hood Canal fisheries were characterized by a coho fishery with a somewhat lower than forecasted return of adults; an improved summer/fall chinook salmon run; and a above average return of fall chum salmon. Chinook Salmon The forecast for the chinook salmon terminal run size was approximately 24,000. The actual terminal area run exceeded 37,000. Chinook salmon appear to have recovered and are improving from the low survival effects of the early 1990's. Area and time restrictions were necessary for the protection of summer chum salmon and mid-hood Canal wild chinook salmon. In 2002, marine fisheries in Hood Canal were also managed in accordance with the Tribal-State Summer Chum Salmon Conservation Initiative. In order to avoid, to the greatest extent possible, incidental interceptions of summer chum salmon returning during the chinook season, fisheries in Areas 12 and 12B were closed (the same restrictions were also necessary to protect wild chinook returning to mid-canal rivers). Chinook salmon fisheries in Area 12C required the use of large mesh nets in August, and the fishery was closed the last week in August. In order to increase opportunity to harvest the returning hatchery chinook, additional emphasis was placed to fisheries in the Hoodsport zone (Area 12H) where hatchery surpluses may be harvested with little or no impact to wild stocks. For chinook salmon, with the prospect to harvest a significant return of hatchery fish, the fishery configuration was modified to provide opportunity in Area 12C, and in Area 12H, targeting the Hoodsport returns in the hatchery zone and providing opportunity in the Skokomish River. An estimated total of 19,834 chinook (4 in 12A, 480 in 12C and 19,350 in 12H) were harvested in Hood Canal marine treaty commercial fisheries. The great majority of the fish were by Skokomish fishers in Area 12H. We estimated that there were an additional 2,620 chinook harvested by treaty nets in the Skokomish River (Area 82G) fishery during There was a total hatchery escapement of 12,880 chinook in 2002, which was above the expected level of over-escapement and well above the goal of 4,100. In 2002, the naturally spawning component of the population was estimated at 1,480 in the Skokomish River, 90% of the full escapement goal. Coho Salmon The preseason anticipated return (from preseason simulation model runs) of coho salmon to the Hood Canal terminal areas was approximately 44,700 (22,300 wild). During the season however, it became apparent that the abundance of coho salmon, returning to all Puget Sound terminal areas, was lower, as evidenced by decreased catch per effort. In Hood Canal marine areas, extensive closures and gear restrictions had already been enacted in order to limit the bycatch of commingled summer chum and chinook salmon during the early part of September. Fisheries in Areas 12, 12B and 12C were open to beach seines the third week of September, with gill net closures until the month of October. These fisheries required the releases of all chinook and chum salmon. Therefore, the harvesting opportunity was limited to late-season fisheries in the Hood Canal mainstem and in the extreme terminal areas of Port Gamble, Quilcene (using selective gear), and the Skokomish River. The highest volume of reported catch was in Area 12C, which used primarily beach seine gear and had reported landings of 4,318 coho salmon. In the adjacent areas (12D and 12H) an additional 2,200 coho were reported. The Skokomish River fishery reported a total of 957 coho salmon in In the Quilcene Bay area (12A), the fishery was terminated early, because of significant impacts to summer chum salmon, from beach seine fishers. Also, given the lack of markets, many fishers chose to process and sell their own catch. Therefore, we believe that these estimates are biased low to some unknown extent. 19
26 At Quilcene Hatchery, the opportunity to harvest surplus hatchery coho salmon was limited from upstream of the US Highway 101, to 30 feet below the hatchery rack. Two openings were implemented after enforcement and access issues were resolved. Fishers from the Skokomish and Jamestown S Klallam Tribe participated, but no harvest reports are available. The Quilcene River coho salmon fishery was fished only by the Jamestown S Klallam Tribe and their harvest totaled 97 fish. During the season, the number of summer chum salmon escaping into the Quilcene River was sufficient to permit additional use of gillnet gear, however a decision was made not to increase the time allotted for this gear type because of low participation. Generally, the timing and extent of the regulatory measures in Hood Canal species-specific directed fisheries were effective conservation tools. Only a small number of summer chum salmon were observed in Area 12, in the last two days of the accounting period, at the start of coho fisheries. Also, few fish of other species were harvested incidentally during coho and chinook directed fisheries. Finally, the extensive use of selective fishing gear allowed for the release any non-target species encountered during directed fisheries. Chum Salmon The Point No Point tribes had a relatively good fall chum fishery in Hood Canal during Of the PNPTC tribes, Skokomish fishers were the only ones who used available opportunity in the Hood Canal fall chum fishery. The greatest effort occurred in Areas 12C and 12H, where expense is lowest for commercial fishing. A side effect of the low prices was a significant shift to harvesting chum salmon for their eggs as in prior years, which often creates a carcass disposal problem. The Skokomish Tribe reported a harvest of 134,000 chum salmon in areas 12C and 12H during the 2001 season. A beach seine fishery took place, primarily in the region adjacent to the Hoodsport Hatchery at Finch Creek. There was also a catch of 1,473 chum in Area 82G (Skokomish R.). While the reported catch may be somewhat lower than the actual, the nontreaty harvest in Hood Canal greatly outpaced the treaty, having a reported catch of over 289,000 chum salmon. Natural escapement estimates for 2002 fall chum are not yet available but initial observations indicated returns to the spawning grounds at levels significantly higher than in recent years. All marine chum fisheries were closed at the end of the season in accordance with the deadlines established in the Hood Canal Salmon Management Plan. The intertribal sharing of chum salmon within Hood Canal (75% Skokomish; 25% S Klallam; ±5%) was not formally implemented in 2002 because of our inability to obtain timely inseason information concerning the catches (the soft data system which provides inseason catch information, was not supported by WDFW) and consequently the run abundance (updates). However, at the end of the year, the harvest balance stood at 100% Skokomish. 20
27 Figure 12. Quilcene Area Coho Salmon Harvest 21
28 22
29 2002 HALIBUT FISHERIES Overview In 2002, treaty fisheries of any significance, for groundfish species, in the PNPTC area, were limited to Pacific Halibut. These fisheries were subject to an overall treaty quota, determined by the Pacific Fishery Management Council (PFMC) from a total continental U.S. quota, determined by the International Pacific Halibut Commission (IPHC). That quota has varied over the years, however the treaty portion of it was increased in 2002, as a result of a payback settlement, reached with the States of Oregon and Washington, for past shortages of the treaty share. The PNPTC and its member tribes have initiated discussions with WDFW over harvest and conservation plan development for various other species. For 2002, groundfish regulations were modified to provide some additional opportunity. In December of 1993, a series of federal rulings in Federal Court issued by Magistrate Weinberg and Judge Rothstein affirmed the treaty reserved rights of the three S Klallam Tribes, the Skokomish Tribe and the Makah Tribe to harvest halibut. The right to fish for halibut was further found to be the same as the right to fish for salmon. That is, a treaty halibut tribe has the right to harvest 50% of the harvestable surplus which passes through their usual and accustomed (U+A) fishing grounds.... These rulings further determined that actions taken in past fisheries by the Secretary of Commerce which allowed other tribes to fish for halibut were to be continued unless it was shown in court that said tribes did not have halibut fishing rights. Finally, it was determined that unless better information became available regarding the extent of the harvestable surplus in the tribes collective U+A s, the tribes were to be assigned a harvest share equal to 35 % of the TAC in Area 2A (Washington, Oregon and California). Prior to the season, a 2002 management plan was reviewed by all halibut tribes and was agreed-to by the affected tribes. The objective of this management plan was to fully harvest, but not exceed the 2002 Tribal Commercial TAC, while providing, at a minimum, a 30 day fishing opportunity, beginning March 18, 2002, with a mix of unrestricted and restricted landing openings. There was eventually a 0.7% overage in the commercial fishery. The 2002 treaty allocation for halibut was 483,500 pounds (lbs.). The tribes set aside 16,000 lbs. of the tribal TAC for a year-around restricted Subsistence and Ceremonial fishery, with the remaining 467,500 lbs. to be taken in the unrestricted and restricted (restricted by a 500 lbs. per day trip limit) portions of the commercial fishery. Unrestricted Fishery The first unrestricted fishery began on March 18 th and ended March 20 th. A total of 80,867 lbs., in 33 landings were taken during this opening. Given the low catches, due to poor weather, a second unrestricted landing opening was authorized, for 24 hours. A total of additional 106,064 lbs. was taken in 34 landings. Restricted Fishery The restricted fishery opened on March 20 th, closed on April 19 th, and took 69,105 lbs., in 196 landings. Mop-Up Fishery Since the first restricted and unrestricted landing fishery openings took only 54.8% of the commercial allocation, a 36-hour mop-up fishery occurred on April 30 th. This fishery took an additional 202,862 lbs., 23
30 in 41 landings. The tribes agreed that the remainder of the TAC would be taken in a restricted fishery with the same 500 lbs./vessel/day trip limit as the first restricted opening. This second restricted fishery lasted four days and 11,746 lbs. were taken in 33 landings. PNPTC Tribes 2002 Halibut Fishery The duration of the unrestricted and restricted fishery openings provided opportunity for Point No Point Treaty tribal fishers in the 2002 halibut fishery. However, no fishers from the PNPTC member tribes chose to participate. The Makah (294,618 lbs.), Quileute (67,290 lbs.), and Quinault (104,191 lbs.) harvested the great majority of the 2002 quota. The Hoh tribe landed 68 lbs.. Of the inside tribes, the Lummi harvested 3,930 lbs., and the Swinomish 547 lbs. (Table 4). The majority of the restricted landing halibut harvest occurred concurrent with the sablefish (blackcod) fishery and was taken by the coastal tribes. The ceremonial and subsistence allocation remained available to tribal fishers after the commercial season ended. Table 4. Treaty Commercial Fisheries for Pacific Halibut Year Treaty TAC (lbs) Coastal Tribes Puget Sound Tribes Total Harvest ,000 16, , ,000 32,409 26,137 58, ,000 81,778 14,806 96, , ,815 26, , , ,749 5, , , ,882 4, , , , , , , , , ,922 1, , , ,632 7, , , ,022 1, , , ,682 19, , , ,094 14, , , ,261 7, , , ,186 24, , , ,258 10, , , ,167 4, ,644 24
31 HATCHERY PRODUCTION Overview The 2002 annual production of the Point No Point Treaty Tribes hatcheries and net pen facilities is summarized in Table 5. The following is a brief discussion of the 2002 fish production at each tribal operation followed by the production history of the tribal facilities. Lower Elwha Hatchery A total of approximately 683,200 coho salmon smolts were released into the Elwha River this year, about 67,000 less than the production goal of 750,000 smolts. This total release included close to 532,500 coho smolts reared in the hatchery s conventional rearing ponds and approximately 127,300 coho smolts reared in the hatchery s NATURES pond. The latter group is the subject of a study where the coho are reared at low densities under more natural conditions. Both of the above groups were coded wire tagged, so that potential differences in survival attributable to the different rearing conditions may be evaluated. A total of 151,700 winter steelhead smolts were released into the Elwha River in This number was 31,700 higher than the release goal of 120,000 smolts. The winter steelhead used to be reared at the Elwha hatchery but because of the hatchery s water shortage problem, the Tribe currently has an agreement with WDFW, where WDFW initially rears winter steelhead at Hurd Creek Hatchery on the Dungeness River, then transfers the fish to Elwha Channel for final rearing and release. The Tribe pays for food to rear the steelhead and also provides, at Lower Elwha Hatchery, for the incubation and early rearing of up to half a million chinook. These chinook fry are transferred from Lower Elwha Hatchery to the Elwha Channel in February, where they are reared until release in June. A total of 336,100 chinook fry were transferred from Lower Elwha Hatchery to Elwha Channel in Supplementation of in-river fall chum production was revived since river conditions allowed for the successful collection of brood stock this year. Eggs were placed in incubator boxes and planted (buried) in river side-channels. Survival was good in four of the five planting locations with an estimated emigration of approximately 35,200 fry. Little Boston Hatchery / Port Gamble Net Pens Production of fall chum was estimated at approximately 725,000 fed-fry this year, a little more than 75% of the 950,000 goal. The lower production is due to lower adult returns. Efforts to build a fall chum brood stock at the Port Gamble Hatchery continue to be relatively successful over the last several years. The plan, over the long term, is to meet the egg production goal in the majority of years. Approximately 432,300 coho smolts were released from the Port Gamble net pens, exceeding the production goal of 400,000. Rearing and release of the coho occurred without incident. The coho salmon were double index tagged (i.e., two tag groups, one with adipose fin clips and one without). Also, all the remaining fish released were mass-marked by adipose fin clip. Enetai Hatchery / Quilcene Bay Net Pens This year, a total of 2.1 million fed chum fry were released at Enetai hatchery, about 40% higher than the production goal of 1.5 million fed fry. This is the first time since 1999 that the production goal has been 25
32 met or exceeded. The production goal was achieved this year because, unlike the two previous years, sufficient numbers of spawners returned to the hatchery to meet the egg take goal. Just over 210,000 coho smolts were released from the Quilcene netpen in 2002, exceeding the 200,000 release goal. This was a positive bounce back from the problems encountered last year when an unknown but large number of fish died with no known cause. Historical Production from Tribal Facilities Tables 5 through 9, with the accompanying Figures 13 through 16, describe the historical record of smolt production at the Point No Point Treaty Tribes salmon production facilities from 1977 through It should be noted that any non-smolt releases from tribal facilities (on- or off-station) and all off-station Lower Elwha Klallam experimental release groups, associated with studies of upriver salmonid restoration or dam impacts, are not included in these tables and figures. Also not shown, are the experimental chinook releases in the mid 1990s from the Little Boston Hatchery. 26
33 Table Annual Hatchery Production Summary Fish Release/ Tribe Species/ Brood Rearing Number Pounds per Release Transfer Brood Year Stock Site Released Released Pound Site Date P. Gamble F. Chum/01 L. Boston P.G. Hat. 725,000 1, On Station 5/15 Coho/00 Quilcene P.G. Bay 432,161 /a 36, P.G. Bay 4/24 L. Elwha Coho/00 Elwha L. Elwha Hat. 532,540 /b 34, On Station 4/18-5/26 127,691 /c 9, On Station 4/18-5/22 663,231 43,431 W.Stlhd./01 Elwha L.Elwha Hat. 151,700 27,089 6 Elwha Ch. /d 5/2-510 Chinook/01 Elwha L. Elwha Hat Transferred /e 2/14 F. Chum/01 Elwha L. Elwha Hat. 35, ,400 In-river /f April Skokomish F. Chum/01 Enetai Enetai Hat. 2,138,098 5, On Station 4/29-5/13 Coho/00 Quilcene Quilcene Bay 210,627 /g 19, Quil. Bay 5/29 /a Double index, coded wire tagged group of fish. All fish except those in one of the double index tagged groups (approx. 46,000 fish) were adipose fin-clipped. /b Double index, coded wire tagged group of fish released from conventional rearing ponds. /c Coded wire tagged (not double index) group of fish released from NATURES pond. /d Fish are initially reared at Hurd Creek and finally at Elwha Channel where they are released. The steelhead are not currently reared at Lower Elwha hatchery because of its limited water supply. /e Chinook were incubated and initially reared at Lower Elwha Hatchery, then transferred to WDFW s Elwha Channel for final rearing and release in June. /f Eyed eggs were planted in river channels. Release number was estimated as number of eggs planted less dead eggs recovered after fry departed. Fry are assumed to have emigrated in April. /g Fish were double index, coded wire tagged. Non-tagged fish were not adipose fin-clipped. 27
34 Table 6. Historical Lower Elwha Hatchery Production in Numbers and Pounds Year Chinook Coho Chum Steelhead Number Lbs. Number Lbs. Number Lbs. Number Lbs ,205,780 4, ,751,050 6,268 30,244 2, ,250 17,180 2,856,894 7,738 30,365 5, ,000 38, ,132 1,223 43,000 6, ,332 54,958 1,241,728 3,057 36,300 6, ,800 35, ,684 2,235 37,590 7, ,000 2, ,798 35, , ,950 10, ,850 2, ,837 39,172 99, ,670 11, ,435 2, ,000 41, ,400 1,184 89,950 14, ,000 1, ,000 52, , ,300 16, ,900 1, ,500 36,425 63,943 12, ,500 3, ,700 14,181 34,100 5, ,600 5, ,500 31,806 59,500 5, ,600 2, ,600 54,900 46,000 5, ,893 6, ,646 45,606 90,997 11, ,738 9, ,621 50,713 3, ,000 48, ,146 18, ,718 55,726 92,436 12, ,368 1, ,000 55,242 82,500 15, ,221 48,149 37, ,055 22, ,227 43,531 39, ,145 17, ,739 52,273 17, ,216 20, ,643 35,847 45, ,615 19, ,799 45, ,640 20, ,980 49, ,603 18, ,231 43,431 35, ,700 27,089 28


35 Figure 13. Lower Elwha Hatchery Production 29
36 Table 7. Historical Little Boston Hatchery Production in Numbers and Pounds (Includes both On-Station and Port Gamble Pen releases of chum salmon) Year Chum Pink Number Lbs. Number Lbs ,580,981 2, ,101 3, , ,097,611 4, ,424,530 6,133 47, ,789,617 6, ,824,164 5, ,955,000 7, , ,441,668 3, ,538,921 3, ,660,710 3, ,700,000 2, ,200 1, ,302,700 3, ,103,100 1, , ,414 3, ,398,500 3, ,953,000 2, ,764,000 1, ,130, ,000 1, , ,050, , , ,000 1, , , ,000 1,444 30


37 Figure 14. Little Boston Hatchery Production 31
38 Table 8. Historical Enetai Hatchery Production in Numbers and Pounds Year Chinook Chum Number Lbs. Number Lbs ,900,000 3, ,827,397 5, ,229,730 6, ,128,190 2, ,800 1,904 1,126,868 3, ,119 4,022 2,858,596 4, ,234 3,678 2,368,546 6, ,010 3, ,593 2, ,550 4,404 3,118,600 5, ,558 3,715 2,959,000 5, ,800 3,562 2,900,000 5, ,000 5,965 2,229,000 4, ,900 6,494 2,422,000 4, ,200 6,208 2,057,600 4, ,684 6,067 1,288,888 3, ,000 6,300 1,389,600 2, ,556 5,129 1,436,000 2, ,782,278 4, ,636,759 6, ,816 5,507 1,943,779 3, ,855 5,220 1,054,284 2, ,604 4,831 1,938,078 4, ,155 3,631 1,547,163 3, ,153 1, , ,138,098 5,321 32

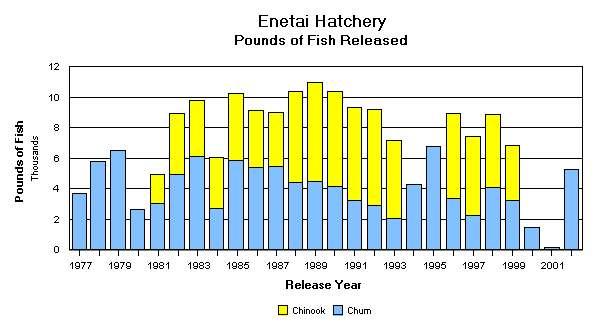
39 Figure 15. Enetai Hatchery Production 33
40 Table 9. Historical Port Gamble and Quilcene Bay Pens Coho Production in Numbers and Pounds Year Port Gamble Bay Pens Quilcene Bay Pens Number Lbs. Number Lbs ,916 27, ,000 41, ,000 36, ,000 39, ,400 41, ,406 26, ,221 14, ,933 13,955 85,575 4, ,100 37, ,500 14, ,500 31, ,500 7, ,600 32, ,300 28, ,944 22, ,193 21, ,600 40, ,263 20, ,419 33, ,800 14, ,513 26, ,187 15, ,844 39, ,737 16, ,686 36, ,828 42, ,000 12, ,656 44, ,269 16, ,482 25, ,951 14, ,765 43, ,000 14, ,847 43,285 Unknown ,161 36, ,627 19,150 34


41 Figure 16. Port Gamble and Quilcene Bay Pens Production 35
42 36
43 SHELLFISHERIES Clams and Oysters The clam and oyster management period for all intertidal regions extends from January 1 through December 31, with the exception of the Naval Magazine Indian Island clam fishery, which is managed from June 1 through May 31 of the following year. The 2002 intertidal season proved to be another difficult one for clam harvesters. The overall abundance of clams was down again this season, and was exacerbated by a manila clam mortality within Hood Canal. The mortality claimed up to 50% of the harvestable biomass on several important Hood Canal beaches, and was apparently caused by high stress levels resulting from a combination of low salinities and freezing conditions during the spring. The PNPTC Tribal clam harvest for the 2002 season, including Indian Island harvests, totaled 94,311 pounds. Of this total, 70,210 pounds were harvested south of the Hood Canal Bridge. The seasonal oyster harvest was not affected by the adverse environmental conditions in the spring, and the total PNPTC Tribal oyster harvest increased somewhat from 2001 levels. The 2002 oyster harvest totaled 2,083,966 singles, with 1,844,988 singles harvested south of the Hood Canal Bridge. As was the case in 2001, the S Klallam Tribes and the Skokomish Tribe again agreed to divide the clam harvest on several important individual Hood Canal beaches according to the aggregate percentage dictated by the Revised Fisheries Management Compact. Based on Compact provisions and the estimated Hood Canal clam abundances for 2002, Skokomish was entitled to 52.9% of the clam harvest south of the Hood Canal Bridge and north of Ayock Point, and the S Klallam Tribes were entitled to 47.1% of the clam harvest. These percentages were therefore applied to the total target harvest amounts on the Dosewallips Certified and Restricted beaches, the Bangor beach, and the Duckabush beach. The percentages were also applied to the combined harvest amounts on the Dabob Broadspit and Dabob East beaches. S Klallam and Skokomish fishing opportunity was controlled by the PNPTC Central Office in order for both parties to remain within the prescribed percentages on each beach. Table 10 illustrates this agreement and the outcome of specific clam fisheries for both parties. Notably absent from Table 10 was any significant clam harvest on Bangor. Tribal interest in Bangor harvests has declined in recent years, probably due to reduced manila clam abundance there. While the overall clam abundance on Bangor has declined since 1996, the abundance of manila clams has declined to a greater extent than the littleneck clam abundance. For 2002, the initial harvestable clam abundance on Bangor was projected at 20,640 pounds, with manila clams comprising 5,600 pounds of that total. The Bangor beach survey conducted in late May, to establish the 2003 harvestable amount, produced a revised harvestable abundance of 11,300 pounds of littleneck clams and 2,800 pounds of manila clams. Figure 17 illustrates the overall trend in clam abundance on Bangor since After reviewing this trend, PNPTC fishery managers decided to leave Bangor closed for the remainder of the season in an effort to rebuild the stock. Of the total harvest of clams in Hood Canal, south of the Hood Canal Bridge, Skokomish fishers harvested 59.8% and S Klallam fishers harvested 40.2%. The harvest from the major beaches was split 52.8% to Skokomish fishers and 47.2% to S Klallam fishers. The Tribal oyster harvest proceeded without incident, with the total catch south of the Bridge split 87.7% to Skokomish and 12.3% to S Klallams. Outside of Hood Canal, the Indian Island clam fishery deviated significantly from preseason expectations. After reviewing historical trends in clam abundance on Indian Island beaches, the PNPTC fishery managers agreed to reduce the overall harvest rate from 25% to 20% in an effort to accelerate rebuilding of the stocks. The combined estimated harvest for Indian Island beaches under this reduced harvest rate was 67,800 pounds. Indian Island Beach # 6.0 was opened in early October to begin the Tribal fishery, but on October 9, elevated psp levels resulted in the closure of the fishery. PSP concentrations remained at elevated levels until early February. Shortly after psp levels returned to acceptable levels, the United States went to war with Iraq, and heightened security surrounding the Naval facilities at Indian Island and Bangor 37
44 precluded any tribal harvest opportunity. Security levels were finally reduced in early May, thereby allowing up to four tribal harvests per month on Indian Island. However, the PNPTC Central Office staff decided to delay any harvest until new abundance surveys could be conducted on each of the beaches. The total PNPTC Tribal harvest on Indian Island for the 2002 season amounted to 4,147 pounds. Tables 11 and 12 illustrate the beach-specific harvest of clams and oysters respectively, by Tribe, both inside and outside Hood Canal, while Figures 18 and 19 show the percentage of the total clam and oyster harvests taken by each Tribe cumulatively, and south of the Hood Canal Bridge. Table 13 compares the total harvestable amount on a beach by beach basis versus the actual seasonal harvest for Figure 22 and Figure 20 shows the historical harvest trends by PNPTC Tribes, for clams and oysters respectively, in all areas. The declining trend in the aggregate clam harvest that began in 1998 continued through Low levels of clam recruitment combined with minimal harvests on Bangor and Indian Island likely contributed to this trend. Table 10. PNPTC Tribes 2002 Sharing of Hood Canal Clams 2002 Sharing Targets Total Expected harvest, S. of Hood Canal Bridge 112,306 Skokomish Share 60.0% 67,384 S. of Ayock 16,869 N. of Ayock 50,515 Klallam Share 40.0% 44,922 Total Expected Harvest N. of Ayock 95,437 Skokomish Share N. of Ayock 52.9% Klallam Share N. of Ayock 47.1% 2002 Beach Specific Harvest Sharing Outcome Beach Total Share Skokomish Klallam Share Harvest Share Harvest Dosewallips SP - Cert. 8,141 4,309 3,575 3,832 3,900 Dosewallips SP - Rest. 3,038 1, , Bangor 20,640 10, , Duckabush 44,234 23,413 23,034 20,821 19,389 Dabob Combined 12,180 6,447 3,960 5,733 4,275 All Other Beaches 7,205 3, ,
45 Figure 17. Bangor Tidelands Clam Density Surveys 39
46 Table 11. PNPTC Tribes Clam Harvest for the 2002 Season TRIBE BEACH NAME POUNDS ALL BEACHES S. OF H.C. BRIDGE Jamestown Bangor Brown Pt. DNR 5 80 Dabob Broadspit 1,170 Dabob East 555 Dosewallips SP Cert 1,070 Dosewallips SP Rest 122 Duckabush 2,028 Grays Marsh 214 Indian Island CP S 1,025 Irondale 125 Quilcene Bay 82 Sequim Bay SP 325 Shine Tidelands SP Eh 76 South End/Blyn 123 Sequim Bay SP North 280 Triton Cove 43 Wolfe Property SP 239 Indian Island 1,582 9,259 2,247 Lower Elwha Dosewallips SP Rest 42 Wolfe Property SP Port Gamble Brown Pt. DNR 5 30 Dabob Broadspit 2,450 Dabob East 100 Dosewallips SP Cert 2,830 Duckabush 17,361 Indian Island CP S 3,232 Quilcene Bay Sequim Bay SP 1,120 40
47 Table 11. Continued Port Gamble Sequim Bay SP North 893 Shine Tidelands SP 3,697 Wolfe Property SP 7,253 Indian Island 2,565 41,723 22,911 Skokomish Dabob Broadspit 3,680 Dabob East 280 Dosewallips SP Cert 3,575 Dosewallips SP Rest 660 Duckabush 23,034 Potlatch DNR 1,391 Potlatch East 2,010 Potlatch SP 2,360 Triton Cove 295 Twanoh SP 4,702 Wolfe Property SP 1,342 Indian Island 0 43,329 41,987 Suquamish Indian Island
48 Figure Clam Harvest by Tribe 42
49 Table 12. PNPTC Tribal Oyster Harvest for the 2001 Season TRIBE BEACH NAME BIDN TOTAL OYSTERS TOTAL S. OF H.C. BRIDGE Lower Elwha Wolfe Property SP Jamestown Bangor ,644 72,644 Dabob Broadspit ,260 17,260 Dabob East ,500 1,500 Quilcene Bay Dosewallips SP Cert ,700 2,700 Duckabush ,930 41,930 Triton Cove Oyster Farm South End/Blyn Tekiu PT S DNR ,628 2,628 Toandos Pen SP ,160 2,628 Zelatched PT South ,440 1,440 Sequim Bay SP Wolfe Property SP ,220 Port Gamble Bangor ,156 42,156 Dabob Broadspit ,000 3,000 East Port Gamble Bay ,240 Duckabush ,100 29,100 Dosewallips SP Cert ,400 2,400 PG Gravel Plot ,760 Quilcene Bay Triton Cove Oyster Farm ,400 2,400 Wolfe Property SP ,696 Skokomish Bangor , ,540 Duckabush , ,356 DNR 44A W. Dewatto ,792 75,792 Lilliwaup SP ,180 15,180 Eagle Creek , ,850 Potlatch East Potlatch SP , ,281 Rendsland Crk , ,588 Triton Cove Oyster Farm ,982 51,982 Twanoh SP , ,620 Wolfe Property SP ,760 43
50 Figure Oyster Harvest by Tribe 44


51 Figure 20. Historical Clam and Oyster Harvest of the PNPTC Tribes 45
52 Table Clam Allocation vs. PNPTC Tribal Clam Harvest Tidelands South of Hood Canal Bridge North of Ayock Annual Share BIDN Beach Name Total Harvest Remaining Dosewallips SP - APP 8,141 7, Dosewallips SP - REST 3, , DNR 57-B Brown Point 1, , Point Whitney Point Whitney Lagoon Kitsap Memorial SP Triton Cove Tidelands Bangor 20, , Quilcene Bay - 1 1, , Quilcene Bay - 2 1, , Quilcene Bay Quilcene Bay Quilcene Bay Quilcene Bay Quilcene Bay Quilcene Bay Dabob Broadspit 8,296 7, E Dabob 3, , Duckabush 44,234 42,423 1,811 Total 95,440 59,747 35,693 South of Ayock Eagle Creek DNR 44-A W Dewatto Potlatch SP 5,157 2,360 2, Potlatch - DNR 4,102 1,391 2, Potlatch East SP 4,135 2,010 2, Twanoh SP 2,415 4,702-2, Rendsland Creek Rec Total 16,869 10,467 6,402 Total South of HC Bridge 120,765 80,610 40,155 Hood Canal Tidelands North of Hood Canal Bridge BIDN Beach Name Total Harvest Remaining Wolfe Property SP 8,493 8, Shine Tidelands SP 4,845 3,773 1,072 Total 13,338 12, Tidelands Outside Hood Canal BIDN Beach Name Total Harvest Remaining Fort Flagler SP 12, , Oak Bay CP 1, , Indian Is CP South 6,200 4,257 1, Sequim Bay SP 4,343 1,445 2, Sequim Bay SP North 4,750 1,173 3,577 Pt. Twnsnd Ship Canal E S. Pitship Pt. 1,024 1,024 Total 31,142 6,875 24,267 46
53 Shrimp Up until this season, the shrimp management agreements within Puget Sound were contained in two management plans, one addressing the management needs of Hood Canal and one addressing the management needs of the remaining areas of Puget Sound. In preparation for the 2001 shrimp season, Puget Sound managers retained this management plan format but included in the Puget Sound Plan specific shrimp regional sections that detailed regional harvest amounts and associated harvest restrictions. For the 2002 season, managers agreed to develop separate management plans for each shrimp region, including Hood Canal. Thus, management plans were developed for the Strait of Juan de Fuca, Northern Puget Sound, North Central Puget Sound (Whidbey Basin), Hood Canal, and Central Puget Sound. The management period for each of the regions was changed to extend from February 1 through January 31 of the following year, with the exception of the Hood Canal region, which remained at April 1 through March 31 of the following year. However, the explicit period during which target fisheries for spot shrimp were allowed in each region, designated as the harvest season, continued between April 16 and October 15 in the Strait and Northern Puget Sound Regions, while the ending date for North Central Puget Sound and Central Puget Sound was shortened to September 15. In Hood Canal, the spot shrimp harvest season was modified slightly to extend from April 22 through August 31. All plans included a provision that spot shrimp fisheries could open prior to the harvest season if test fishing indicated that less than 3% of harvestable shrimp were ovigerous. The non-spot shrimp harvest season extended from May 1 through October 15 in all areas, except Hood Canal, which does not have a not-spot shrimp season. Following the preseason management agreement between the PNPTC Tribes and the WDFW, the Hood Canal fishery was designed to harvest approximately ½ of the Treaty quota (36,750 pounds) prior to the start of the non-treaty recreational fishery in mid-may, and the remainder of the share after the recreational fishery closed in early June. In addition, the tribal fishery was managed so as not to exceed a total harvest of 55% of the Treaty quota, or 40,425 pounds, in Area 27A. Finally, by prior agreement of the PNPTC Tribes, the early fishery schedule was manipulated so that the harvest split between Skokomish and S Klallam fishers was approximately 50/50. The early fishery consisted of three separate openings. The first opening, beginning on April 23, consisted of a total of two fishing days for S Klallam fishers and three fishing days for Skokomish fishers. The second opening was for two fishing days for Skokomish fishers only. The third opening was also for two fishing days, but for S Klallam fishers only. The total spot shrimp harvest during this early fishery was 46,656 pounds, with Skokomish fishers harvesting 44.9% of the total and S Klallam fishers harvesting 55.1% of the total. After completion of the State recreational fishery, the S Klallam fishery re-opened on June 18 for two days, and again on August 28 and September 7 for one day each. The fisheries scheduled for the latter part of August and early September were promoted by buyers who promised a higher price for the shrimp if the tribes would wait until the last part of the season to harvest their remaining share. The final S Klallam harvest totaled 35,766 pounds, as compared to the S Klallam share of 36,750 pounds. Two hundred pounds out of the S Klallam total were taken in ceremonial fisheries. The Skokomish fishery re-opened on June 21 for two days, and again on July 18 for three days. The final Skokomish fishery opened on August 23 for two days. The Skokomish harvest totaled 36,379 pounds, including 703 pounds taken in ceremonial fisheries. Skokomish ended up with 50.4% of the total tribal harvest and the S Klallam Tribes took 49.6% of the total. A total of 1,355 pounds remained un-harvested in the Treaty quota. Additionally, a total of 35,983 pounds were harvested in Area 27A. PNPTC Tribal fishing effort for spot shrimp outside Hood Canal has been very sporadic in the past. No spot shrimp harvest outside Hood Canal was recorded last season (2001), and only small harvests of less than 1000 pounds were recorded for each of the 1999 and 2000 seasons. However, tribal interest in these outside fisheries, and in particular the Strait spot shrimp fishery, grew in The District 1 (Discovery Bay, S. Protection Is.) fishery opened on April 16, and had to be closed by April 21 because the Treaty quota for that area had been taken. Similarly, the Area 25A fishery, outside District 1, opened on April 16 47
54 and closed on April 27 after the Treaty quota was exhausted. Tribal effort in the western Strait areas of 23C, 23D and 23A South was somewhat more variable, and although these areas opened on April 16 as well, they remained open until October 3, when the incidence of shrimp ovigery in the catch began to increase. The PNPTC Tribal harvest in District 1 totaled 2,283 pounds, as compared to the District 1 quota of 1,500 pounds. The total tribal harvest in Area 25A, outside District 1 was 7,981 pounds (compared to the quota of 7,500 pounds), of which the PNPTC Tribes harvested 2,052 pounds. PNPTC Tribal harvests in the western Strait areas totaled 4,548 pounds, but was short of the combined Treaty quota of 9,000 pounds for these areas. Overall, the PNPTC Tribal spot shrimp harvest for all areas outside Hood Canal totaled 9,253 pounds. No non-spot shrimp harvest was reported by the PNPTC Tribes in Table 14 displays the shrimp harvest by Tribe for the 2002 season, and Figure 21 depicts the percentage breakdown of the shrimp harvest between PNPTC Tribes. Figure 22 shows the historical harvest trends for spot shrimp since Table 14. PNPTC Tribal Spot Shrimp Harvest for the 2001 Season TRIBE CATCH POUNDS ALL AREAS HOOD CANAL Jamestown 20B A South 1,903 23C 1,547 23D A A 2, ,077 Lower Elwha 23D A B 70 25E Dist 1 1,255 27A 5,910 8,165 5,910 Port Gamble 25A 1,204 25A Dist E Dist A 26,891 27B ,011 27,779 Skokomish 27A 1,105 27B 26,394 27C 8,880 36,379 36,379 48
55 Figure Spot Shrimp Harvest by Tribe 49

56 Figure 22. Historical Spot Shrimp Harvest of the PNPTC Tribes 50
57 Dungeness Crab The crab season was one that presented many challenges for PNPTC Tribal fishery managers, as well as the PNPTC Central Office staff. The management approach for Hood Canal was complicated by the fact that the Revised Fisheries Management Compact was up for revision, and potential changes to the Hood Canal crab sharing provisions of the Compact were being suggested by certain PNPTC Tribes. This situation was further complicated by the size of the Suquamish Tribal harvest in Hood Canal in Suquamish harvested 19% of the Treaty allocation (54,000 pounds) of crab from Hood Canal in 2001, and the expectation for the 2002 season was for a greater Suquamish percentage of the total. An expanding Suquamish harvest in Hood Canal could jeopardize any management or sharing plan developed by the PNPTC within the Compact. Discomfort was also growing among the S Klallam Tribes over the recent level of harvest taken by the Port Gamble Tribe in the Strait of Juan de Fuca, as well as over a perceived lack of fishing opportunity afforded to certain S Klallam Tribes in the Hood Canal fishery. As the 2002 season approached, it became apparent that necessary revisions to the Compact to address the aforementioned issues would not be accomplished in time to guide the 2002 management process. The PNPTC Board of Directors therefore directed the tribal fishery managers, working with the PNPTC Central Office staff, to develop an interim crab management approach for the 2002 season. Early in this development process, it became obvious to the fishery managers that the management approach for Hood Canal would depend on whether or not the Suquamish Tribe agreed to specific limits on their harvest. Therefore, the managers developed two separate Hood Canal plans, one that would be implemented if agreement with Suquamish was reached regarding the extent of their participation, and one that would be implemented if no agreement with Suquamish was realized. Several proposals were developed to address each contingency, with the overriding goal of maintaining a management approach that would approximate status quo conditions among the PNPTC Tribes for one year until the long-term impact from the Suquamish fishery could be determined with more certainty. The Hood Canal management plan initially proposed to Suquamish subdivided the total Treaty allocation into two parts, with 40% of the total reserved for fisheries north of the Hood Canal Bridge, and 60% reserved for fisheries south of the Bridge. Two sharing alternatives for the fishery north of the Bridge was presented to Suquamish, as follows: 1. The Treaty fishery north of the Bridge would be scheduled as an in-common fishery in which all Tribes fished the same schedule, using the same crab pot limits. The fishing schedule and pot limits would be negotiated and agreed to by all five Tribes. This approach was based on the predominant tribal fishing pattern within Puget Sound for catch areas shared by more than one Tribe, or 2. The Treaty fishery north of the Bridge would be divided equally between the five Tribes. The PNPTC Tribes would negotiate and agree on a fishing schedule and pot limit to govern PNPTC fisheries in this sub-region, based on their sub-quotas, and the Suquamish Tribe would determine a fishing schedule and pot limit separately to govern Suquamish fisheries in this sub-region, based on their sub-quota. The five Tribes would negotiate and agree on other fishery restrictions and enforcement coordination necessary to promote a safe fishery. The Suquamish rejected these proposals, and presented the PNPTC Tribes two possible counter-proposals, as follows: 1. Suquamish would fish the same schedule as Skokomish in the Canal, with no other limitation on the Suquamish harvest and no subdivision of the Treaty allocation north and south of the Bridge, or 2. Suquamish would settle for 1/3 of the total Treaty allocation in Hood Canal. 51
58 Neither of these proposals was acceptable to the PNPTC Tribes. Although negotiations continued on both direct and indirect quotas to be applied to the Suquamish harvest, it became obvious that the gap between the PNPTC position and the Suquamish position was too wide to develop a sharing plan that both parties could agree on. In the end, the parties could only agree to prosecute a concurrent fishery in Area 25C, with limits on the length of open periods and on total pots per vessel, to maintain some control on the harvest rate and to protect the integrity of the update fishery. The remaining management details of the PNPTC fishery were developed after the 25C fishery was set. These details were summarized in draft form in the PNPTC Intertribal Crab Management Principles for the Crab Season (Intertribal Plan). This draft Intertribal Plan was developed under the assumption that the season would be a transitional year for PNPTC crab fisheries. As such, the management principles did not follow the previously established guidelines of the Compact. Rather, the management goals of the Intertribal Plan were designed: 1) to provide a harvest opportunity to Skokomish in excess of their total harvest last season (a maximum of 38% of the total Treaty allocation for Hood Canal); 2) to reduce the Suquamish portion of the total harvest in Hood Canal from their harvest level last season (by constraining the S Klallam fishery to Area 25C, to be in direct competition with the Suquamish fishery, after update fisheries were concluded); 3) to limit significant shifts in tribal effort that may occur between S Klallam fleets in Hood Canal and the Strait of Juan de Fuca (by limiting the Port Gamble harvest in sub-area 3-2 to no more than 27% of the total tribal quota); and 4) to protect the integrity of the in-season abundance update fishery in Hood Canal (by preserving enough of the Treaty allocation to accommodate the update fisheries, and by allowing a buildup of crab prior to each update fishery). The intent of the PNPTC Tribes was that these management principles, established for the season only, would not be used as a precedent for future negotiations on crab sharing provisions contained within the Compact, but could form a basis, in part, for establishing long-term crab management principles between the PNPTC Tribes for the future. Unfortunately, the Intertribal Plan was never formally adopted by the PNPTC, due to disagreements between the four PNPTC Tribes over the level of support each Tribe should provide to the operation of the PNPTC Central Office. Never the less, the management principles contained in the Plan were used to guide PNPTC crab fisheries in Hood Canal and the Strait during the summer period. The crab management period begins on June 1 and extends to May 31 of the following year. Fishing began in Hood Canal and Admiralty Inlet the second week of June. The tribal fisheries in the Strait began June 21 in sub-area 3-1 (West Beach off of Whidbey Island) and sub-area 3-3 (western Strait of Juan de Fuca). The tribal fishery in Strait sub-area 3-2 (Dungeness/Discovery Bay) was delayed 2 weeks, by agreement of the PNPTC fishery managers to give the recreational fishery in that sub-area a 2- week head start, and began on July 6. Crab abundance in all areas was initially very high, and tribal harvests reflected this. Catches during the first month in the Strait and Admiralty Inlet approached the tribal summer quotas for both areas, with the July harvest in sub-area 3-2 equal to 130,000 pounds, and the June harvest in Region 2 West equal to 69,000 pounds. As a result, the Strait fishery in sub-area 3-2 closed within 30 days of the opening, and the Admiralty Inlet fishery closed 50 days after the initial opening. While there was no summer quota for the Hood Canal fishery, the tribes were restricted to a total harvest of 250,000 pounds before the in-season update was completed. Although the PNPTC Tribes initially agreed with Suquamish that the June fishery in Area 25C would be constrained to a 2 week opening with a maximum of 25 pots per vessel, Suquamish unilaterally modified this agreement after the fishery commenced by allowing 25 pots per fisher. Several Suquamish vessels entered the fishery with 50 pots, and a few had more than 70 pots. This modification of the pot limit, coupled with unusually high crab abundance, accelerated the Hood Canal harvest. It became apparent after the first week that a full 2- week fishery opening would likely jeopardize completion of the update by not allowing enough tribal quota to remain for the July and August update fishery. The PNPTC fishery managers therefore lobbied Suquamish to close the fishery early, and all parties did agree to close after the fishery had proceeded for 10 days. The total tribal harvest during this first opening exceeded 173,000 pounds. Two fishing days were scheduled in July and August to complete the in-season update, 52
59 but no additional fishing opportunity was allowed. At the end of August, the total treaty harvest in Hood Canal approached 292,000 pounds. Due to the unusually high crab abundance evident in both the Strait and in Admiralty Inlet during the summer period, the PNPTC Central Office staff prepared abundance update models for both areas and presented these to WDFW staff in September. Although the models used historical tribal commercial catch and effort statistics correlated to the total seasonal abundance, trends in the nontreaty recreational fishery were also used to support model results. The models projected a total seasonal harvest for the Strait of 870,000 pounds (a 22% increase from the preseason quota), and a total seasonal harvest for Admiralty Inlet of 435,000 pounds (a 64% increase from the preseason quota). WDFW did not agree to implement these updates because they wanted to see supportive harvest data from the nontreaty commercial fleet, which was not scheduled to open until October. Eventually, WDFW did agree to increase the quotas in both areas, but by a lesser amount than the models predicted. The final quota for the Strait was 790,000 pounds (a 11.3% increase, for sub-area 3-1 only) and the final quota for Admiralty Inlet was 350,000 pounds (a 32% increase). The remaining tribal fishery in the Strait sub-area 3-2 proceeded at a slower pace after the summer period, due to the intense fishing effort by the nontreaty fleet, but still closed in early December when the tribal quota was reached. The total PNPTC harvest in sub-area 3-2 was 203,339 pounds. The tribal fishery in Admiralty Inlet started up again in mid-september, and harvested the remaining tribal quota, including the quota increase, by early December as well. The PNPTC harvest in Admiralty Inlet totaled 99,079 pounds. For Hood Canal, the initial in-season update projected a total harvest of 680,000 pounds, or a 36% increase from the preseason quota. Unfortunately, the catch estimate from the recreational fishery through mid-july did not support this. The recreational catch estimate actually declined 16% from the same time period in A seasonal expansion of the recreational catch based on this initial estimate produced a total projected harvest of only 428,000 pounds. There were several possible reasons for the divergence between the tribal commercial catch statistics and the recreational catch statistics, but the discrepancy prevented WDFW from endorsing the update model as originally designed. As a result, the PNPTC Central Office staff investigated several revisions to the update model. WDFW staff also investigated the use of the WDFW crab shell condition test fishery in the Canal as another possible source of abundance information. The result of this effort was an agreement between the PNPTC fishery managers and the WDFW managers to adopt one of the modified update procedures developed by the Central Office staff, but still based on the tribal commercial catch during the summer period. The modified update put the total projected harvest at 602,200 pounds, leaving a total of 301,100 pounds each in the Treaty and nontreaty quotas. Since the tribal fishery through the end of August had harvested 292,000 pounds, a fishery was designed to harvest the remaining 9,000 pounds. Using expected effort projections for each tribe, harvest scenarios were developed for openings of 24 hours, 12 hours, 8 hours and 6 hours. A 6-hour opening was chosen as the most likely to harvest the remaining quota, but the actual harvest was still much higher than expected. The final tribal harvest in Hood Canal topped 310,000 pounds. Table 15 shows the PNPTC crab harvest by tribe in each crab management region, and summarizes the total PNPTC harvest within Hood Canal as well as the total harvest in all management areas combined. Figure 23 displays the proportion of the 2002 harvest, taken by each PNPTC tribe. Figure 24 illustrates the historical trend in crab harvest from 1995 to the present for S Klallam and Skokomish fishers. One of the goals of the draft Intertribal Plan for Hood Canal was the reduction in the Suquamish harvest from their 2001 level. This was to be accomplished by forcing the S Klallam fleet into Area 25C to compete directly with the Suquamish fleet, after each monthly update fishery was complete. A principle assumption for this strategy was that Area 25C held a finite number of crab, and that the harvest there would eventually be exhausted. Historical crab catches in Hood Canal indicated that Area 25C produced an average of 25% of the total Treaty/nontreaty harvest during the period, and that the percentage caught in 25C during 2001 approached 33%. The PNPTC fishery managers therefore planned 53
60 that as much as 50% of the initial Treaty quota, or 125,000 pounds, could be taken in Area 25C. If this harvest level was reached in Area 25C before the area was exhausted of crab, the managers planned to reconvene and discuss additional management measures for the area. Based on an examination of the historical decline in the tribal commercial catch per unit effort (CPUE) for Area 25C, the managers felt that this strategy would work. However, the initial crab abundance for Area 25C was extremely high, and although tribal CPUE declined in 25C at a somewhat quicker rate than in previous years, the initial CPUE was too high to exhaust the apparent crab abundance before the 25C catch began to impact the remaining quota reserved for the update fisheries. By the end of the season, the estimated Treaty and nontreaty harvest in Area 25C equaled 268,800 pounds, or 44.8% of the total Treaty/nontreaty harvest. Figure 25 illustrates the historical crab CPUE trend in Area 25C as compared to the CPUE trend in Table 15. PNPTC Tribal Crab Harvest for the 2001 Season TRIBE REGION CATCH AREA POUNDS ALL AREAS HOOD CANAL Jamestown 2 25B 14,836 25D 3,138 26A C D 5,406 25A 47,132 25E 2, A 1,477 75,478 1,477 Lower Elwha 2 25B 1,287 25D 2, C D 1,452 25A 92,775 25E 2, C 2, ,334 2,229 Port Gamble 1 22A B 19,799 25D 51,657 26A 5, C 1,520 25A 48, , C 139,137 27A 40, , ,324 Skokomish 5 27A 67,397 27B 1,224 27C 1,102 69,723 69,723 54

61 Figure Crab Harvest by Tribe 55


62 Figure 24. Historical Crab Harvest of the PNPTC Tribes 56
63 Figure 25. CPUE Trends in the In-Common Hood Canal Crab Fishery 57
64 Geoduck Clams PNPTC tribal geoduck fisheries during the season proceeded relatively smoothly. Prior to the start of the season, the S Klallam Tribes discussed the desire to again exchange shares between the Strait of Juan de Fuca and Hood Canal. In past years, the Jamestown and Lower Elwha Tribes traded a portion of their geoduck shares in Hood Canal to Port Gamble in exchange for all of Port Gamble s geoduck share in the Strait. While this arrangement was convenient for all three Tribes, in recent years Jamestown and Lower Elwha fishers found it more and more difficult to harvest their expanded shares in the Strait due to extended paralytic shellfish poisoning (psp) conditions that occurred in the Strait during the summer and fall periods. This season, the three Tribes decided to forego share exchanges between the two Regions. This decision reduced the Jamestown and Lower Elwha shares in the Strait, and provided Port Gamble fishers an opportunity to harvest their Strait geoduck share for the first time. The S Klallam Tribes did continue to trade their collective geoduck shares in Central Puget Sound with the Suquamish Tribe in exchange for most of the Suquamish geoduck share in Hood Canal. The geoduck clam management period begins April 1 and extends to March 31 of the following year. PNPTC Tribal fisheries in both the Strait and in Hood Canal began on April 1. Jamestown and Lower Elwha fishers began fishing in the Strait, while Port Gamble fishers started in Hood Canal, along with Skokomish fishers. Concerns over an early closure of the Strait fishery due to psp contamination prompted Port Gamble fishers to begin fishing the Strait in early June, while Jamestown and Lower Elwha fishers began fishing Hood Canal in early July. Although the psp conditions in the Strait approached the closure criteria several times during the summer, the Strait was not actually closed to psp contamination until mid- September. With the exception of a short opening in late November, the Strait remained closed due to psp contamination from mid-september through early February. When the Strait did reopen, both Port Gamble and Lower Elwha had significant geoduck shares remaining to be harvested. The PNPTC Central Office assisted in maximizing harvest opportunity for both Tribes by first opening the Siebert Creek Tract, in addition to the Jamestown 1 and Protection Island Tracts, to allow harvest to continue in case both the Jamestown and Protection Island Tracts were closed due to elevated psp levels. In early March, the weekly fishing time was expanded for both Tribes by allowing an additional hour for harvest each day, and by allowing harvest on the weekends. These liberalized harvest schedules, coupled with aggressive fishing by both Tribes, resulted in both Tribes harvesting the remainder of their respective shares. From February 10 through March 31, Lower Elwha fishers harvested 19,354 pounds, and Port Gamble fishers harvested 50,348 pounds. The final PNPTC Tribal harvest in the Strait totaled 308,812 pounds, as compared to the Treaty quota of 310,938 pounds. The PNPTC Tribal harvest in Hood Canal totaled 516,537 pounds, as compared to the Treaty quota of 519,564 pounds. The Suquamish Tribe recorded a total harvest of 3,802 pounds in the Port Gamble Outside Tract (# 20000) as compared to their agreed allocation of 4,087 pounds. Of the total Hood Canal harvest, 38.6% was harvested south of the Hood Canal Bridge. Table 16 displays the total geoduck harvest by PNPTC Tribe and area for the season. Table 17 shows the final geoduck shares by tribe for Hood Canal, the Strait of Juan de Fuca, and Central Puget Sound. These shares are the result of initial shares within Hood Canal calculated according to the Revised Fisheries Management Compact, and initial shares for the Strait divided equally between the three S Klallam Tribes. The initial shares for Central Puget Sound were based on the 2002 Central Puget Sound Intertribal Geoduck Harvest Sharing Plan. Initial shares were then subject to share trades between the S Klallam Tribes and the Suquamish Tribe (Central Sound shares only) to arrive at final shares for the season. Figure 26 depicts the proportion of the total PNPTC Tribal geoduck harvest taken by each PNPTC Tribe, and Figure 27 illustrates historical geoduck harvest trends between S Klallams and Skokomish. 58
65 Table 16. PNPTC Tribal Geoduck Harvest for the 2002 Season TRIBE TRACT POUNDS ALL AREAS HOOD CANAL S. OF BRIDGE Jamestown , , , , ,878 0 Lower Elwha , , , , ,250 0 Port Gamble , , , , , Skokomish , , , , ,837 Table PNPTC Tribal Geoduck Shares with Suquamish/S Klallam Share Exchange Area Treaty Share Skokomish Port Gamble Jamestown Lower Elwha Suquamish 25C 284,350 56,870 56,870 56,870 56,870 56,870 25C Calculated w/ Suquamish Trade 284,350 56,870 74,464 74,464 74,464 4,087 27A,27B,27C Calculated 244, ,730 32,607 32,607 32,607 25C, 27A, 27B, 27C Calculated 528, , , , ,071 4,087 SJF Calculated 314, , , ,693 Central Sound Calculated 123,160 17,594 17,594 17,594 17,594 27A,27B,27C Adjusted 201, C Adjusted 0 106, , ,000 4,087 SJF Adjusted 0 103, , ,646 25C, 27A, 27B, 27C Adjusted 201, , , ,000 Total Hood Canal Plus SJF 830, , , , ,646 0 Total Central Sound Grand Total 201, , , ,646 74,464 59
66 Figure Geoduck Harvest by Tribe 60


67 Figure 27. Historical Geoduck Harvest of the PNPTC Tribes 61
68 Sea Urchins and Sea Cucumbers To date, virtually all of the PNPTC Tribal red sea urchin and sea cucumber harvest has occurred in the Strait of Juan de Fuca. The tribal red urchin harvest in the Strait has been managed according to an intertribal agreement between the PNPTC Tribes and the Makah Tribe since The agreement stipulates the target harvest of red urchins by urchin district and the agreed beginning date of the fishery in each district. For the season, the target urchin quotas for each district were as follows: 1) District 3 East (Tongue Point to Port Angeles) = 41,695 pounds (45% of District 3); 2) District 3 West (Low Point to Tongue Point) = 50,960 pounds (55% of District 3); 3) District 4 (Tongue Point to Rasmussen Creek) = 42,839 pounds (tribal share minus 6,100 pounds over harvest from last season). The agreed beginning date of the fishery in District 3 East was October 15, while the agreed beginning date of the fishery in both District 3 West and District 4 was November 18. The management period for sea urchins in all urchin districts extends from September 1 through August 31 of the following year. The tribal fishery in District 3 East was opened on November 7, and allowed for fishing 7 days per week. However, actual fishing did not begin in District 3 East until the second week of December, after District 3 West and District 4 had closed. Tribal effort in District 3 East was intermittent from mid-december to the end of January, and only two additional landings occurred between the end of January and the end of March, when fishing ceased. The total red urchin harvest in District 3 East to date is 36,013 pounds. Nearly the entire harvest (96.4%) was harvested by Lower Elwha fishers. The tribal fishery in District 3 West and District 4 opened on November 18, and also allowed for fishing 7 days per week. However, unlike the District 3 East fishery, this fishery attracted significant interest from Makah as well as Lower Elwha and Jamestown. Harvest rates were again high in both Districts, necessitating a closure of both Districts on December 5. The total red urchin harvest for District 3 West reached 45,963 pounds, and the total harvest for District 4 was 59,131 pounds. The over harvest in District 4 equaled 16,292 pounds. This is the second consecutive year that the tribal harvest has exceeded the tribal quota for District 4. The Jamestown Tribal share of the District 3 West and District 4 harvest was 15.9% and 32.6% respectively, while Lower Elwha Tribal fishers harvested 38.3% of the District 3 West harvest and 26.5% of the District 4 harvest. The Makah Tribal share of the District 3 West and District 4 harvest totaled 45.8% and 40.8% respectively. The harvest breakdown between the PNPTC Tribes and the Makah Tribe is shown in Table 18, and the proportional breakdown by tribe is illustrated in Figure 28. No harvest of green sea urchins was recorded by PNPTC Tribes during the season. The management period for sea cucumbers begins on April 1 and normally extends through March 31 of the following year. However, this season WDFW proposed an extension to the management period to allow fishing through April 30. WDFW also proposed a modification to the cucumber management period for next season, by starting on May 1 and extending through April 30 of the following year. They suggested this change to tribal fishery managers to better accommodate the needs of the fishery. Tribal managers agreed with the modification. PNPTC Tribal interest in sea cucumbers has been indifferent. Lower Elwha fishers engaged in limited sea cucumber fishing during 1999 and again in 2000, but did not fish in During the 2002 season, both Lower Elwha and Jamestown fishers participated in the fishery in a limited fashion, reporting a total of 6,941 pounds between both Tribes. Figure 28 also depicts the historical trend in both red sea urchin and sea cucumber harvests for the PNPTC Tribes since
69 Table 18. PNPTC Tribal and Makah Tribe Sea Urchin Harvest for the Season TRIBE AREA POUNDS ALL AREAS Makah District 3 West 21,049 Makah District 4 24,154 45,203 Elwha District Elwha District 3 West 17,612 Elwha District 3 East 34,717 Elwha District 4 15,678 68,727 Jamestown District 3 West 7,302 Jamestown District 3 East 1,296 Jamestown District 4 19,299 27,897 District 3 West Subtotal 45,963 District 3 East Subtotal 36,013 District 3 Total 81,976 District 4 Total 59,131 Grand Total 141,107 63
70 Figure 28. Red Sea Urchin and Sea Cucumber Harvest 64
71 2002 HUNTING Overview The Point No Point Treaty tribes opened their traditional hunting areas in all or part of 12 Game Management Units (GMUs) covering most of the north, east, and south sides of the Olympic Peninsula during the hunting season. The Buchanan ruling continued to affect the PNPTC tribes hunting opportunities and resulted in treaty hunters voluntarily limiting their hunting in peripheral areas and concentrating their effort closer to reservation areas. Overall, the number of hunters and their harvest level were similar to recent years. Deer seasons were opened in all 12 GMUs. Elk seasons were opened in 10 GMUs. One GMU, Skokomish, has been closed to elk hunting since 1997, for management purposes, and the Kitsap GMU does not have an elk population Harvest Data This report contains data from the Port Gamble S Klallam, Jamestown S Klallam, Lower Elwha Klallam and Skokomish tribes. The Port Gamble S Klallam Tribe issued 439 tags to 79 hunters. Tag return was 94%, with 49 deer and 11 elk reported. The Jamestown S Klallam Tribe issued 97 tags to 38 hunters. Tag return was 100%, and reported harvest included 23 deer and 7 elk. The Lower Elwha Klallam Tribe issued permits to 68 hunters with 14 deer and 11 elk reported. The Skokomish Tribe reports a total harvest of 99 deer and 36 elk, but harvest location data are not yet available. The combined harvest numbers for the Port Gamble S Klallam, Jamestown S Klallam, and Lower Elwha Klallam tribes and the areas in which they were reported are shown in Table 19. Table 19. Combined Point No Point Treaty Tribes Harvest for the Hunting Season*. GMU Deer Elk Buck Doe Unknown Bull Cow Bear Harbor Seal 601 Hoko Dickey Pysht Sol Duc Olympic Coyle Kitsap Mason Skokomish Quinault Wynoochee Satsop Unk Area Subtotals Species Total Note: The data in Table 18 is based only on Klallam harvests. Skokomish data were not available at this time. 65
72 The 185 deer harvested in the season was up about 5% over last year. The harvest is about 15% lower than the 1997 and 1998 deer harvest levels (Figure 28). Non-treaty harvest data are not available for the 2002 hunting season. Non-treaty harvest in 2001 was about 20 % greater than the harvest reported in the three previous years. Most of this increase is believed to be a result of improved reporting by non-treaty hunters through the WDFW mandatory reporting system. The PNPTC tribes harvest of deer is a small percentage of the overall harvest, amounting to only 5% of the harvest in the 12 GMUs opened by the tribes (Figure 30). The 65 elk harvested in by the Point No Point Treaty tribes is about 10% less than the previous year (Figure 29). The PNPTC tribes elk harvest was 30% of the overall elk harvest in the 10 GMUs open to elk in 2001, the last year for which data are available from WDFW and other tribes. The PNPTC tribes elk harvest was 23% of total harvest in 1998 and 37% of the total harvest in Non-treaty hunters harvested 174 elk and PNPTC hunters harvested 70 elk in the 10 GMUs in 2001 (Figure 30). In the same GMUs in 2001, other tribes harvested 58 elk making the overall tribal harvest approximately 42 % of the total elk harvest (Figure 31). The PNPTC tribes issued 20 permits for cow elk in the Dungeness herd and 20 in the Dosewallips / Duckabush area in Only 4 cow elk were harvested in the Olympic GMU this year compared to 16 in Harvest data are not yet available from other tribes for the hunting season. The Wildlife Program staff calculated maximum allowable cow harvest for each GMU on the Peninsula. The recommend harvest level is 50% of the maximum in order to allow recovery of depressed populations. Keeping cow harvest at or below the recommended level would allow both harvest opportunity and population growth. Cow harvest has been closed in the Hoko GMU since 2000 to allow this herd to increase. Cow harvest in the Pysht in 1999 was at the maximum harvest level, which triggered a one-year closure in One cow was harvested in the Pysht GMU during each of the last two hunting seasons All elk harvest in the Olympic GMU has been regulated by a permit system through the end of the hunting season. The PNPTC tribes issued permits, by lottery, which were drainage and sex specific, in order to prevent over harvest of these herds. The elk herds in the Dungeness, Dosewallips and Duckabush drainages are increasing which will allow different elk harvest options in the hunting season. 66
73 Figure 29. PNPTC Tribes' Deer and Elk Harvest Trends 67


74 Figure 30. PNPTC Tribes' Deer and Elk Harvest, Compared to NonTreaty 68


75 Figure 31. Treaty / Non-Treaty Elk Harvest Figure 32. PNPTC Tribes Elk Harvest by Sex 69
2004 MANAGEMENT FRAMEWORK PLAN AND SALMON RUNS' STATUS FOR THE HOOD CANAL REGION
 2004 MANAGEMENT FRAMEWORK PLAN AND SALMON RUNS' STATUS FOR THE HOOD CANAL REGION Joint Report by: Point No Point Treaty Council (for the Port Gamble, and Jamestown S'Klallam Tribes) Washington Department
Attachment 1. Agenda Item Summary BACKGROUND
 Attachment 1 Agenda Item Summary BACKGROUND Spring Chinook Salmon: Prior to the late 1970s, non-treaty spring Chinook fisheries in the mainstem Columbia River occurred from February through May and harvested
2017 PACIFIC HALIBUT CATCH SHARING PLAN FOR AREA 2A
 (a) FRAMEWORK 2017 PACIFIC HALIBUT CATCH SHARING PLAN FOR AREA 2A This Plan constitutes a framework that shall be applied to the annual Area 2A total allowable catch (TAC) approved by the International
ESTIMATED RETURNS AND HARVEST OF COLUMBIA RIVER FALL CHINOOK 2000 TO BY JOHN McKERN FISH PASSAGE SOLUTIONS
 ESTIMATED RETURNS AND HARVEST OF COLUMBIA RIVER FALL CHINOOK 2000 TO 2007 BY JOHN McKERN FISH PASSAGE SOLUTIONS ESTIMATED RETURNS AND HARVEST OF COLUMBIA RIVER FALL CHINOOK 2000 TO 2007 This analysis of
PRE-SEASON PLANNING FOR FRASER SALMON and STOCKS OF CONCERN. Forum on Conservation and Harvest Planning for Fraser Salmon January 22, 2010
 PRE-SEASON PLANNING FOR FRASER SALMON and STOCKS OF CONCERN Forum on Conservation and Harvest Planning for Fraser Salmon January 22, 2010 2 Outline South Coast Chinook Status Management Actions Recovery
NATIONAL MARINE FISHERIES SERVICE REPORT ON PACIFIC HALIBUT CATCH SHARING PLAN CHANGES FOR 2015
 Agenda Item G.1.b Supplemental NMFS Report 1 November 2014 NATIONAL MARINE FISHERIES SERVICE REPORT ON PACIFIC HALIBUT CATCH SHARING PLAN CHANGES FOR 2015 Table of Contents Purpose of the document... 2
Perspectives of a State Director Selective fisheries as a tool in fisheries management and salmon recovery
 Perspectives of a State Director Selective fisheries as a tool in fisheries management and salmon recovery Jeffrey P. Koenings, PhD. Washington Department of Fish and Wildlife American Fisheries Society
OREGON AND WASHINGTON DEPARTMENTS OF FISH AND WILDLIFE JOINT STAFF REPORT: SUMMER FACT SHEET NO. 1 Columbia River Compact June 13, 2012
 OREGON AND WASHINGTON DEPARTMENTS OF FISH AND WILDLIFE JOINT STAFF REPORT: SUMMER FACT SHEET NO. 1 Columbia River Compact June 13, 2012 Fisheries under consideration: Non-Indian commercial salmon Treaty
OREGON AND WASHINGTON DEPARTMENTS OF FISH AND WILDLIFE JOINT STAFF REPORT SUMMER FACT SHEET NO. 1 June 10, 2010
 OREGON AND WASHINGTON DEPARTMENTS OF FISH AND WILDLIFE JOINT STAFF REPORT SUMMER FACT SHEET NO. 1 June 10, 2010 Fisheries under consideration: Non-Indian commercial salmon STOCK STATUS Upper Columbia Summer
TESTIMONY OF THE COLUMBIA RIVER TREATY TRIBES BEFORE PACIFIC FISHERIES MANAGEMENT COUNCIL April 12, 2010 Portland, OR
 Agenda Item H.1.f Supplemental Tribal Report 2 April 2010 TESTIMONY OF THE COLUMBIA RIVER TREATY TRIBES BEFORE PACIFIC FISHERIES MANAGEMENT COUNCIL April 12, 2010 Portland, OR Good day Mr. Chairman and
2016 PACIFIC HALIBUT CATCH SHARING PLAN FOR AREA 2A
 (a) FRAMEWORK 2016 PACIFIC HALIBUT CATCH SHARING PLAN FOR AREA 2A This Plan constitutes a framework that shall be applied to the annual Area 2A total allowable catch (TAC) approved by the International
Management Strategies for Columbia River Recreational and Commercial Fisheries: 2013 and Beyond
 Management Strategies for Columbia River Recreational and Commercial Fisheries: 2013 and Beyond Recommendation of the Columbia River Fishery Management Workgroup to the Fish and Wildlife Commissions of
2017 Non-Treaty Columbia River Summer/Fall Fishery Allocation Agreement June 15, 2017
 2017 Non-Treaty Columbia River Summer/Fall Fishery Allocation Agreement June 15, 2017 Management Intent and Expectations for Summer Chinook and Sockeye Fisheries The preseason forecast for upper Columbia
OREGON AND WASHINGTON DEPARTMENTS OF FISH AND WILDLIFE JOINT STAFF REPORT SUMMER FACT SHEET NO.
 OREGON AND WASHINGTON DEPARTMENTS OF FISH AND WILDLIFE JOINT STAFF REPORT SUMMER FACT SHEET NO. 1 Columbia River Compact/Joint State Hearing June 28, 2018 Fisheries under consideration: Treaty commercial
2002 MANAGEMENT FRAMEWORK PLAN AND SALMON RUNS' STATUS FOR THE STRAIT OF JUAN DE FUCA REGION
 2002 MANAGEMENT FRAMEWORK PLAN AND SALMON RUNS' STATUS FOR THE STRAIT OF JUAN DE FUCA REGION Prepared by: Point No Point Treaty Council (for the Port Gamble, Lower Elwha and Jamestown S'Klallam Tribes)
OREGON AND WASHINGTON DEPARTMENTS OF FISH AND WILDLIFE JOINT STAFF REPORT - SPRING FACT SHEET NO.
 OREGON AND WASHINGTON DEPARTMENTS OF FISH AND WILDLIFE JOINT STAFF REPORT - SPRING FACT SHEET NO. 2a Columbia River Compact/Joint State Hearing June 5, 2018 Fisheries under consideration: Mainstem recreational
OREGON AND WASHINGTON DEPARTMENTS OF FISH AND WILDLIFE JOINT STAFF REPORT - WINTER FACT SHEET NO.
 OREGON AND WASHINGTON DEPARTMENTS OF FISH AND WILDLIFE JOINT STAFF REPORT - WINTER FACT SHEET NO. 3a Columbia River Compact/Joint State Hearing February 21, 2018 Fisheries under consideration: Mainstem
Recreational Sturgeon Commercial Shad MANAGEMENT GUIDELINES
 OREGON AND WASHINGTON DEPARTMENTS OF FISH AND WILDLIFE JOINT STAFF REPORT - SUMMER FACT SHEET NO. 2 Columbia River Compact/Joint State Hearing June 28, 2005 Fisheries under consideration: Recreational
FALL FACT SHEET NO. 2 Columbia River Compact August 13, 2004 MANAGEMENT GUIDELINES
 FALL FACT SHEET NO. 2 Columbia River Compact August 13, 2004 Fisheries Under Consideration: Non-Indian commercial mainstem MANAGEMENT GUIDELINES Salmon A Management Agreement for upper Columbia River fall
Harvest Mgmt. & Fishery Regulations 2017 KATHRYN KONOSKI, FISHERIES BIOLOGIST STILLAGUAMISH TRIBE OF INDIANS
 Harvest Mgmt. & Fishery Regulations 2017 KATHRYN KONOSKI, FISHERIES BIOLOGIST STILLAGUAMISH TRIBE OF INDIANS Harvest Management Annual Cycle Egg Alevin Post Season Pre-Season Spawn Adult In-Season Fishery
OREGON AND WASHINGTON DEPARTMENTS OF FISH AND WILDLIFE JOINT STAFF REPORT - FALL FACT SHEET NO.
 OREGON AND WASHINGTON DEPARTMENTS OF FISH AND WILDLIFE JOINT STAFF REPORT - FALL FACT SHEET NO. 3 Columbia River Compact/Joint State Hearing August 28, 2018 Fisheries under consideration: Non-treaty mainstem
 Informational Report 1 USFWS Mass Marking Update April 2005 Update on USFWS 2005 Mass Marking Initiative Background Under Section 138 of FY 2003 Omnibus Appropriations Act (PL 108-7), Congress directed
REPORT ON THE 2017 PACIFIC HALIBUT FISHERIES IN AREA 2A
 Agenda Item E.1.a NMFS Report 1 November 2017 REPORT ON THE 2017 PACIFIC HALIBUT FISHERIES IN AREA 2A The 2017 Area 2A Pacific halibut (halibut) total allowable catch (TAC) of 1,330,000 pounds (lbs.),
18 March 2016 Oregon Department of Fish and Wildlife
 18 March 2016 Oregon Department of Fish and Wildlife Background Joint OR/WA policy adoption 2012 OR re-adoption of rules 6/13 Transition period (2013-2016) Phased allocation shift Mainstem gillnets allowed
Jamestown S'Klallam Tribe Natural Resources Department Report to General Council September 13, by Scott Chitwood
 Jamestown S'Klallam Tribe Natural Resources Department Report to General Council September 13, 2008 by Scott Chitwood As the Jamestown S'Klallam Tribe s Natural Resources Director it is my pleasure to
Strategies for mitigating ecological effects of hatchery programs
 Strategies for mitigating ecological effects of hatchery programs Some case studies from the Pacific Northwest Kathryn Kostow Oregon Department of Fish and Wildlife Ecological risks occur when the presence
2019 Policies and Regulations Commissioners and staff reviewed Narrative Descriptions of each options, no changes were proposed.
 Joint-State Columbia River Fishery Policy Review Committee February 26, 2019 9am to 5pm Location: ODFW Headquarters Office, Salem OR Meeting Summary Notes and Decisions ATTENDANCE: Holly Akenson ODFW Commissioner
REPORT ON THE 2018 PACIFIC HALIBUT FISHERIES IN AREA 2A (10/5/2018)
") Agenda Item F.1.a NMFS Report 1 November 2018 REPORT ON THE 2018 PACIFIC HALIBUT FISHERIES IN AREA 2A (10/5/2018) The 2018 Area 2A Pacific halibut (halibut) total allowable catch (TAC) of 1,190,000 pounds
Agenda Item F.1.a NMFS Report 1 November 2018 REPORT ON THE 2018 PACIFIC HALIBUT FISHERIES IN AREA 2A (10/5/2018) The 2018 Area 2A Pacific halibut (halibut) total allowable catch (TAC) of 1,190,000 pounds
Tuesday, April 10, 2018, 5:08 PM
 TABLE 2. 2018 Recreational management measures for non-indian ocean salmon fisheries - Council adopted. (Page 1 of 5) North of Cape Falcon Supplemental Management Information 1. Overall non-indian TAC:
Ned Currence, Nooksack Indian Tribe
 Ned Currence, Nooksack Indian Tribe Problem Status Distribution Habitat Hatcheries Harvest 25000 20000 Natural-Origin Spawners 15000 10000 22500 5000 0 Historic catch Spawners (2011-2015) Problem Status
JOINT STAFF REPORT WINTER FACT SHEET NO. 9 Columbia River Compact March 18, 2004
 JOINT STAFF REPORT WINTER FACT SHEET NO. 9 Columbia River Compact March 18, 2004 Purpose: To review ongoing commercial fisheries and consider non-indian commercial fishing seasons for salmon, smelt and
WEST COAST FISHERIES AND MANAGEMENT
 WEST COAST FISHERIES AND MANAGEMENT Olympic Coast National Marine Sanctuary Advisory Council May 20, 2016 Heather Reed - WDFW Jessi Doerpinghaus - WDFW FISHING IS KEY TO WASHINGTON S ECONOMY Washington
FALL FACT SHEET NO. 1 Columbia River Compact July 29, Non-Indian Select Areas
 FALL FACT SHEET NO. 1 Columbia River Compact July 29, 2004 Fisheries Under Consideration: Non-Indian commercial mainstem Non-Indian Select Areas MANAGEMENT GUIDELINES Salmon A Management Agreement for
2016 Fraser River Chinook Key Information for Management. FN Forum March 8-10 Nanaimo, BC
 2016 Fraser River Chinook Key Information for Management FN Forum March 8-10 Nanaimo, BC 1 Outline Provide background information, management objectives and fisheries management approach for: Fraser Spring
2016 Fraser River Stock Assessment and Fishery Summary Chinook, Coho and Chum
 2016 Fraser River Stock Assessment and Fishery Summary Chinook, Coho and Chum 1 Background and Stock Assessment 2 Fraser River Chinook - Background Diverse group of populations exhibit a wide range of
CHAPTER II CHINOOK SALMON MANAGEMENT CENTRAL VALLEY CHINOOK STOCKS. Management Objectives. Regulations to Achieve Objectives.
 CHAPTER II CHINOOK SALMON MANAGEMENT CENTRAL VALLEY CHINOOK STOCKS Central Valley Chinook stocks include fall, late-fall, winter, and spring stocks of the Sacramento and San Joaquin rivers and their tributaries.
IPHC Regulatory Area 2A Directed Commercial Pacific Halibut Fishery Sample Vessel Fishing Period Limit Options for Longer Fishing Periods
 Agenda Item G.1.a IPHC Report 1 September 2017 IPHC Report September 2017 IPHC Regulatory Area 2A Directed Commercial Pacific Halibut Fishery Sample Vessel Fishing Period Limit Options for Longer Fishing
2017 Fall Zone 4-5 Gillnet Fishery WDFW and ODFW Observation Study Sampling Plan
 2017 Fall Zone 4-5 Gillnet Fishery WDFW and ODFW Observation Study Sampling Plan Introduction Columbia River fisheries generate millions of dollars in economic value annually, and are an integral part
2018 Fraser River Fishery Summary to Accompany December 2018 Presentation for FORUM
 2018 Fraser River Fishery Summary to Accompany December 2018 Presentation for FORUM Chinook... 1 Coho... 3 Chum... 4 Sockeye... 5 Pink... 6 Chinook FSC Chinook directed fisheries were open year round Below
GROUNDFISH MANAGEMENT TEAM REPORT ON CONSIDERATION OF INSEASON ADJUSTMENTS, INCLUDING CARRYOVER. Annual Vessel Limit (15.4%)
") Agenda Item I.3.a Supplemental GMT Report 2 March 2017 GROUNDFISH MANAGEMENT TEAM REPORT ON CONSIDERATION OF INSEASON ADJUSTMENTS, INCLUDING CARRYOVER The Groundfish Management Team (GMT) reviewed the
Agenda Item I.3.a Supplemental GMT Report 2 March 2017 GROUNDFISH MANAGEMENT TEAM REPORT ON CONSIDERATION OF INSEASON ADJUSTMENTS, INCLUDING CARRYOVER The Groundfish Management Team (GMT) reviewed the
NATIVE FISH CONSERVATION PLAN FOR THE SPRING CHINOOK SALMON ROGUE SPECIES MANAGEMENT UNIT
 Attachment 4 NATIVE FISH CONSERVATION PLAN FOR THE SPRING CHINOOK SALMON ROGUE SPECIES MANAGEMENT UNIT Figures in Draft Plan of February 28, 27 Figure 1. Map of the Rogue River Basin. PASSAGE ESTIMATES
California Department of Fish and Wildlife Report to the International Pacific Halibut Commission on 2017 California Fisheries
 IPHC-2018-AM094-AR08 Received: 22 December 2017 California Department of Fish and Wildlife Report to the International Pacific Halibut Commission on 2017 California Fisheries California Department of Fish
MEMORANDUM. Joan Dukes, NPCC. Michele DeHart. DATE: August 5, Data Request
 FISH PASSAGE CENTER 1827 NE 44 th Ave., Suite 240, Portland, OR 97213 Phone: (503) 230-4099 Fax: (503) 230-7559 http://www.fpc.org/ e-mail us at fpcstaff@fpc.org MEMORANDUM TO: Joan Dukes, NPCC FROM: Michele
Pacific Salmon Treaty (PST)- Fraser River Sockeye & Pink Salmon Chapter Renewal. February 26, 2013 First Nations Consultations Saanichton, BC
- Fraser River Sockeye & Pink Salmon Chapter Renewal. February 26, 2013 First Nations Consultations Saanichton, BC") Pacific Salmon Treaty (PST)- Fraser River Sockeye & Pink Salmon Chapter Renewal February 26, 2013 First Nations Consultations Saanichton, BC 1 Renewal Context Annex IV, Chapter 4 (Fraser River Sockeye
Pacific Salmon Treaty (PST)- Fraser River Sockeye & Pink Salmon Chapter Renewal February 26, 2013 First Nations Consultations Saanichton, BC 1 Renewal Context Annex IV, Chapter 4 (Fraser River Sockeye
Proposed 2018 Fisheries Management Measures to Support Recovery of Interior Fraser River Steelhead
 Proposed 2018 Fisheries Management Measures to Support Recovery of Interior Fraser River Steelhead 22-March-2018 Spawning escapements of two Interior Fraser River steelhead stocks, Thompson and Chilcotin
TABLE 1. Commercial troll management measures adopted by the Council for non-indian ocean salmon fisheries, 2016.
 (Page 1 of 5) North of Cape Falcon Supplemental Management Information 1. Overall non-indian TAC: 70,000 Chinook and 18,900 coho marked with a healed adipose fin clip (marked). 2. Non-Indian commercial
2012 JOINT STAFF REPORT: STOCK STATUS AND FISHERIES FOR FALL CHINOOK SALMON, COHO SALMON, CHUM SALMON, SUMMER STEELHEAD, AND WHITE STURGEON
 2012 JOINT STAFF REPORT: STOCK STATUS AND FISHERIES FOR FALL CHINOOK SALMON, COHO SALMON, CHUM SALMON, SUMMER STEELHEAD, AND WHITE STURGEON Joint Columbia River Management Staff Washington Department of
2007 Adult Returns and 2008 Expectations Columbia River
 2007 Adult Returns and 2008 Expectations Columbia River Preliminary Draft December 11, 2007 (updated ) Adult Returns Willamette Spring Upriver Spring Upriver Summer Sockeye Upriver Summer Steelhead Bright
Tuesday, April 10, 2018, 5:04 PM
 TABLE 1. 2018 Commercial troll management measures for non-indian ocean salmon fisheries - Council adopted. (Page 1 of 6) A. SEASON DESCRIPTIONS North of Cape Falcon Supplemental Management Information
Commercial Anchovy Fishery Public Meeting
 Commercial Anchovy Fishery Public Meeting February 15, 2017 Astoria, Oregon Cyreis Schmitt Troy Buell Maggie Sommer 1 Northern Anchovy Anchovy Ecology and Life History Federal and State Anchovy Management
***Please Note*** April 3, Dear advisory committee members:
 April 3, 29 Dear advisory committee members: The fifth meeting of the CHF advisory committee will be held April 13 in Grants Pass from 6:-8:3 PM, and the purpose of this document is to help committee members
Press Release New Bilateral Agreement May 22, 2008
 Informational Report 3 June 2008 Press Release New Bilateral Agreement May 22, 2008 The Pacific Salmon Commission is pleased to announce that it has recommended a new bilateral agreement for the conservation
Columbia River Salmon Harvest Sport and Commercial Sharing Facts and Relationships
 Columbia River Salmon Harvest Sport and Commercial Sharing Facts and Relationships Prepared by Robert Sudar Commercial Advisor Columbia River Fisheries Management Work Group Economic Value of Fish & Wildlife
ALASKA DEPARTMENT OF FISH AND GAME DIVISION OF COMMERCIAL FISHERIES NEWS RELEASE
 ALASKA DEPARTMENT OF FISH AND GAME DIVISION OF COMMERCIAL FISHERIES NEWS RELEASE Sam Cotten, Commissioner Scott Kelley, Director Contact: Pat Shields, Area Management Biologist or Phone: (907) 262-9368
Hood Canal Steelhead Project A conservation hatchery experiment. Joy Lee Waltermire
 Hood Canal Steelhead Project A conservation hatchery experiment Joy Lee Waltermire Cooperating Project Partners: NOAA: NWFSC Behavioral Ecology Team Long Live the Kings WA Department of Fish and Wildlife
2016 Ocean Salmon and Terminal Area Fishery Regulations
 2016 Ocean Salmon and Terminal Area Fishery Regulations 2016 Ocean Salmon Regulations On May 1 ocean salmon regulations for federal waters (3-200 miles) began based on the seasons adopted by PFMC on April
2 Report of the Fraser River Panel to the Pacific Salmon Commission on the 2002 Fraser River Sockeye Salmon Fishing Season
 2 0 0 2 Report of the Fraser River Panel to the Pacific Salmon Commission on the 2002 Fraser River Sockeye Salmon Fishing Season Prepared by the Pacific Salmon Commission June, 2005 Pacific Salmon Commission
Nez Perce Treaty of 1855
 2007 Nez Perce Tribal Steelhead Fishery Proposal A Harvest Recovery Strategy Presented by Joseph Oatman NPT Harvest Biologist FISH 510 -- Advanced Fish Management Nez Perce Treaty of 1855 The exclusive
2018 NASS RIVER SALMON STOCK ASSESSMENT UPDATE MONDAY, 9 JULY
 218 NASS RIVER SALMON STOCK ASSESSMENT UPDATE MONDAY, 9 JULY The following is the fourth general public update for 218 of Nass River salmon and summer run steelhead stock assessments from the Nisga a Lisims
ELWHA FISHERIES OFFICE
 ELWHA FISHERIES OFFICE 760 Stratton Rd (360) 457-4012 Port Angeles, WA 98363 FAX: (360) 452-4848 June 7, 2018 LOWER ELWHA KLALLAM TRIBE Commercial and Subsistence Dungeness Crab Fishery Regulations S18-035
COLUMBIA RIVER SALMON AND STEELHEAD HARVEST 1980 TO by John McKern for The Columbia-Snake River Irrigators Association
 COLUMBIA RIVER SALMON AND STEELHEAD HARVEST 198 TO 26 by John McKern for The Columbia-Snake River Irrigators Association COLUMBIA RIVER SALMON AND STEELHEAD HARVEST 198 THROUGH 26 By John McKern FISH PASSAGE
Hatchery Scientific Review Group Review and Recommendations
 Hatchery Scientific Review Group Review and Recommendations Lochsa River Spring Chinook Population and Related Hatchery Programs January 31, 2009 Lochsa River Spring Chinook Population Report Page - 1
Interior Fraser River Coho Management Post-season update and 2016 Fisheries Planning FN FORUM Meeting March 9, 2016 Draft 5
 Interior Fraser Coho Management 2015 Post-season update and 2016 Fisheries Planning FN FORUM Meeting March 9, 2016 Draft 5 1 Interior Fraser Coho Background In response to significant stock declines through
2009 JOINT STAFF REPORT CONCERNING STOCK STATUS AND FISHERIES FOR STURGEON AND SMELT
 2009 JOINT STAFF REPORT CONCERNING STOCK STATUS AND FISHERIES FOR STURGEON AND SMELT Joint Columbia River Management Staff Oregon Department of Fish and Wildlife Washington Department of Fish and Wildlife
Salmon Technical Team Preseason Report III Tables
 Attachment 4 Oregon Fish and Wildlife Commission Date: April 20, 2012 EXHIBIT C Salmon Technical Team Preseason Report III Tables Salmon Management Measures Adopted by the Council for 2012-April 2013 Ocean
Skokomish Indian Tribe Fisheries Department N. 541 Tribal Center Road 98584
 Skokomish Indian Tribe Fisheries Department N. 541 Tribal Center Road 98584 2018-2019 SKOKOMISH TRIBE ANNUAL INTERTIDAL CLAM AND OYSTER REGULATION ANN-S#l8-0l The following regulations are promulgated
Columbia River Sturgeon in Decline. Recommendation for Harvest Reform
 Columbia River Sturgeon in Decline Recommendation for Harvest Reform Significant Recent Declines The lower Columbia River (LCR) white sturgeon population has declined significantly in recent years. Estimated
Fisheries Off West Coast States; Coastal Pelagic Species Fisheries; Annual. AGENCY: National Marine Fisheries Service (NMFS), National Oceanic and
, National Oceanic and") This document is scheduled to be published in the Federal Register on 06/30/2017 and available online at https://federalregister.gov/d/2017-13685, and on FDsys.gov Billing Code 3510-22-P DEPARTMENT OF
This document is scheduled to be published in the Federal Register on 06/30/2017 and available online at https://federalregister.gov/d/2017-13685, and on FDsys.gov Billing Code 3510-22-P DEPARTMENT OF
PRESEASON REPORT III COUNCIL ADOPTED MANAGEMENT MEASURES
 PRESEASON REPORT III COUNCIL ADOPTED MANAGEMENT MEASURES AND ENVIRONMENTAL ASSESSMENT PART 3 FOR 2018 OCEAN SALMON FISHERY REGULATIONS REGULATION IDENTIFIER NUMBER 0648-BH22 Pacific Fishery Management
A Method for Utilizing Recent Coded Wire Tag Recovery Data to Adjust FRAM Base Period Exploitation Rates
 Agenda Item F.2.a Attachment 4 November 2014 2014 Salmon Methodology Review A Method for Utilizing Recent Coded Wire Tag Recovery Data to Adjust FRAM Base Period Exploitation Rates Galen A. Johnson, Northwest
Point No Point Treaty Council
 Point No Point Treaty Council Port Gamble S'Kiallam Jamestown S'Kiallam 2016-2017 Point No Point Treaty Council In-Common Commercial and Subsistence Dungeness Crab Fishery Regulations #S16-052 The following
2018 NASS RIVER SALMON STOCK ASSESSMENT UPDATE MONDAY, 20 AUGUST
 218 NASS RIVER SALMON STOCK ASSESSMENT UPDATE MONDAY, 2 AUGUST The following is the tenth general public update for 218 of Nass River salmon and summer run steelhead stock assessments from the Nisga a
PACIFIC REGION 1996 SALMON NET MANAGEMENT PLAN AREAS B, D, AND E SOUTH COAST AND FRASER RIVER
 , " PACIFIC REGION 1996 SALMON NET MANAGEMENT PLAN AREAS B, D, AND E SOUTH COAST AND FRASER RIVER This Salmon Net Management Plan is intended for general purposes only. Where there is a discrepancy between
Olympic National Park Fishing and Shellfish Regulations
 Olympic National Park Fishing and Shellfish Regulations Effective May 1, 2008 through April 30, 2009 Olympic National Park is managed as a natural area. The primary objectives of the fisheries management
In the area between the U.S./Canada border and the Queets River, the landing and possession limit is 50
 TABLE 1. 2019 Commercial troll management Alternatives for non-indian ocean salmon fisheries - Council Adopted. (Page 1 of 11) North of Cape Falcon North of Cape Falcon North of Cape Falcon Supplemental
2016 Groundfish Fisheries After reviewing the latest information, the GMT is not recommending any inseason actions for the remainder of 2016.
 Agenda Item F.3.a Supplemental GMT Report November 2016 GROUNDFISH MANAGEMENT TEAM REPORT ON INSEASON ADJUSTMENTS The Groundfish Management Team (GMT) considered the most recent information on the status
ADDENDUM I TO AMENDMENT 3 OF THE INTERSTATE FISHERY MANAGEMENT PLAN FOR WEAKFISH
 ATLANTIC STATES MARINE FISHERIES COMMISSION ADDENDUM I TO AMENDMENT 3 OF THE INTERSTATE FISHERY MANAGEMENT PLAN FOR WEAKFISH Prepared by the Weakfish Plan Review Team Approved October 18, 2000 TABLE OF
Agenda Item Summary BACKGROUND. Public Involvement ISSUE ANALYSIS. Attachment 1
 Agenda Item Summary Attachment BACKGROUND Between 996 and 03 white sturgeon fisheries in the Columbia River downstream from Bonneville Dam were managed under a series of management accords between the
Wild Steelhead Coalition Richard Burge Conservation VP September 11, 2006
 Wild Steelhead Coalition Richard Burge Conservation VP September 11, 2006 The following are talking points for the WDFW SEPA Scoping Meetings regarding the preparation of the State-wide and the Puget Sound
Stock Assessment of Anadromous Salmonids, 2003 Report Number: OPSW-ODFW
 THE OREGON PLAN for Salmon and Watersheds Stock Assessment of Anadromous Salmonids, 3 Report Number: OPSW-ODFW-- The Oregon Department of Fish and Wildlife prohibits discrimination in all of its programs
Dauphin Lake Fishery. Status of Walleye Stocks and Conservation Measures
 Dauphin Lake Fishery Status of Walleye Stocks and Conservation Measures Date: December, 21 Dauphin Lake Fishery Status of Walleye Stocks and Conservation Measures Background: Walleye stocks in Dauphin
Status Determination Criteria for Willapa Bay Natural Coho. Salmon Technical Team and Washington Department of Fish and Wildlife
 Agenda Item C.2.a Attachment 6 November 2013 Status Determination Criteria for Willapa Bay Natural Coho Salmon Technical Team and Washington Department of Fish and Wildlife Prepared by: Robert Kope Northwest
2017/2018 Salmon Fishery Planning
 2017/2018 Salmon Fishery Planning Sockeye and Pink Salmon Key Management Issues for 2017 FN Forum Meeting March 7-9 th, 2017 1. 2017 Management Issues Outline Fraser Sockeye and Pink Forecasts Environmental
Juan de Fuca Recreational Chinook Fishery Proposal. Forum on Conservation & Harvest Planning for Fraser Salmon April 13, 2015
 Juan de Fuca Recreational Chinook Fishery Proposal Forum on Conservation & Harvest Planning for Fraser Salmon April 13, 2015 1 Outline Origin of proposal What is the rationale for the proposal? What is
"Recommended Improvements for the Next Pacific Salmon Treaty"
 "Recommended Improvements for the Next Pacific Salmon Treaty" Randall M. Peterman School of Resource and Environmental Management Simon Fraser University Burnaby, British Columbia, Canada Web site: http://www.rem.sfu.ca/fishgrp/
Salmon Technical Team Report on Western Strait Juan de Fuca Coho Overfishing Assessment
 Agenda Item G.3.b STT Report 2 March 2010 Salmon Technical Team Report on Western Strait Juan de Fuca Coho Overfishing Assessment Executive Summary In 2005, 2006, 2007, and 2008 the Western Strait of Juan
Public Meetings to Discuss the Pacific Halibut Catch Sharing Plan for Portland July 31 North Bend August 6 Newport August 7
 Public Meetings to Discuss the Pacific Halibut Catch Sharing Plan for 2013 Portland July 31 North Bend August 6 Newport August 7 1 Meeting Outline Background on overall halibut management 2A Catch Sharing
COLLATION OF PRELIMINARY SALMON MANAGEMENT ALTERNATIVES FOR 2018 OCEAN FISHERIES
 Agenda Item E.4.a Supplemental STT Report 1 March 2018 SALMON TECHNICAL TEAM COLLATION OF PRELIMINARY SALMON MANAGEMENT ALTERNATIVES FOR 2018 OCEAN FISHERIES March 11, 2018 TABLE 1. 2018 Commercial troll
Bering Sea Salmon Bycatch Update North Pacific Fishery Management Council, July 2017
 Bering Sea Salmon Bycatch Update North Pacific Fishery Management Council, July 2017 Salmon are caught incidentally in the Bering Sea and Aleutian Islands (BSAI) offshore trawl fisheries, especially in
Submitted by the Alaska Department of Fish and Game at the request of Alaska Board of Fisheries. January 23, 2018
 Submitted by the Alaska Department of Fish and Game at the request of Alaska Board of Fisheries. January 23, 2018 Alaska Board of Fisheries recommendations on Unuk, Chilkat, and King Salmon rivers king
Joint Columbia River Management Staff
 2017 JOINT STAFF REPORT: STOCK STATUS AND FISHERIES FOR SPRING CHINOOK, SUMMER CHINOOK, SOCKEYE, STEELHEAD, AND OTHER SPECIES Joint Columbia River Management Staff Oregon Department of Fish & Wildlife
Magnuson-Stevens Act Provisions; Fisheries Off West Coast States; Tribal Usual and
 This document is scheduled to be published in the Federal Register on 06/08/2016 and available online at http://federalregister.gov/a/2016-13469, and on FDsys.gov Billing Code: 3510-22-P DEPARTMENT OF
PRESEASON REPORT III COUNCIL ADOPTED MANAGEMENT MEASURES
 PRESEASON REPORT III COUNCIL ADOPTED MANAGEMENT MEASURES AND ENVIRONMENTAL ASSESSMENT PART 3 FOR 2017 OCEAN SALMON FISHERY REGULATIONS REGULATION IDENTIFIER NUMBER 0648-BG59 Pacific Fishery Management
Columbia River Fishery Notice
 Columbia River Fishery Notice Oregon Department of Fish and Wildlife January 29, 2014 Compact Action The Columbia River Compact agencies of Oregon and Washington met today and took the following actions:
Kirt Hughes Washington Department of Fish and Wildlife Region 6 - Fish Program Manager
 Kirt Hughes Region 6 - Fish Program Manager Habitat Hatcheries Harvest Clean Water Act Shorelines Harvest Hydro Habitat Forest Practices Non-regulatory Programs Water Supply & Conservation Growth Management
COMPREHENSIVE MANAGEMENT PLAN FOR PUGET SOUND CHINOOK: HARVEST MANAGEMENT COMPONENT. Puget Sound Indian Tribes. And
 COMPREHENSIVE MANAGEMENT PLAN FOR PUGET SOUND CHINOOK: HARVEST MANAGEMENT COMPONENT Puget Sound Indian Tribes And The Washington Department of Fish and Wildlife March 1, 2004 i Table of Contents Executive
Council CNL(15)26. Annual Progress Report on Actions Taken Under Implementation Plans for the Calendar Year EU Spain (Navarra)
26. Annual Progress Report on Actions Taken Under Implementation Plans for the Calendar Year EU Spain (Navarra)") Agenda Item 5.1 For Information Council CNL(15)26 Annual Progress Report on s Taken Under Implementation Plans for the Calendar Year 2014 EU Spain (Navarra) CNL(15)26 Annual Progress Report on s taken
Agenda Item 5.1 For Information Council CNL(15)26 Annual Progress Report on s Taken Under Implementation Plans for the Calendar Year 2014 EU Spain (Navarra) CNL(15)26 Annual Progress Report on s taken
March 6, SUBJECT: Briefing on Columbia River Basin salmon and steelhead returns for 2017 and run forecasts for 2018
 James Yost Chair Idaho W. Bill Booth Idaho Guy Norman Washington Tom Karier Washington Jennifer Anders Vice Chair Montana Tim Baker Montana Ted Ferrioli Oregon Richard Devlin Oregon March 6, 2018 MEMORANDUM
We recommend that whenever possible you use the following guidelines for choosing the most sustainable options in 2010.
 Ocean Wise Seasonal salmon report 2010 NOTE: THE FOLLOWING RECOMMENDATIONS ARE BASED ON EARLY TEST FISHERY RESULTS. ACTUAL IN-SEASON RUN STRENGTH CAN CHANGE AND WILL BE UPDATED AS NECESSARY. Returns of
for Salmon and Watersheds
 for Salmon and Watersheds Stock Assessment of Anadromous Salmonids, Report Number: OPSW-ODFW-3- The Oregon Department of Fish and Wildlife prohibits discrimination in all of its programs and services on