Economic Impact of British Racing
|
|
|
- Frederica Hampton
- 5 years ago
- Views:
Transcription

1 Economic Impact of British Racing 2009

2 Contents Foreword 2 Executive summary 4 Introduction 8 Section 1: Overall economic impact Overall economic impact 10 Racing s cash flow 12 Section 2: Economic factors Employment 14 Capital investment 16 Racing s tax contribution 18 Section 3: Racing s participants and customers Racecourses 21 Attendances and racegoers 24 Owners 27 Trainers 30 Breeders 32 Betting 34 Broadcasting 37 Section 4: International comparisons International comparisons 38 Section 5: Sporting, leisure and rural context Rural context 40 Local aspects 43 Racing s position within the sports market in Britain 44 Leisure comparisons 46 Report preparation, methodology 48 and limitations Glossary 49 Feature articles Ffos Las 17 Haydock Park 23 Lambourn and the North Wessex Downs 31 Point-to-Point 41 This Report has been written in general terms and therefore cannot be relied upon to cover specific situations; application of the principles set out will depend upon the particular circumstances involved and we recommend that you obtain professional advice before acting or refraining from action on any of the contents of this publication. Deloitte LLP would be pleased to advise readers on how to apply the principles set out in this publication to their specific circumstances. Deloitte LLP accepts no duty of care or liability for any loss occasioned to any person acting or refraining from actions as a result of any material in this Report. Further details covering the scope and limitations of our report, its use and our legal responsibilities are set out on page 48. Deloitte LLP. All rights reserved. Graphic Design: Photography: Dan Abraham; Trevor Jones; Trevor Jones Thoroughbred Photography britishhorseracing.com
3 ECONOMIC IMPACT OF BRITISH RACING 5.7m Attendance at 1,423 fixtures 3.4bn Total direct and indirect expenditure of British Racing Perth Musselburgh Hamilton Park Kelso Ayr 18,600 FTE employees of the core British Racing industry 15, m+ Net expenditure of owners on training fees and horse purchases. 5.5bn+ Gross win generated by British betting operators from British Racing in the last five years 100,000+ Direct, indirect and associated employment of British Racing Exeter Newton Abbot Taunton Newcastle Hexham Carlisle Sedgefield Cartmel Catterick Middleham Ripon Wetherby Redcar Thirsk 706m Average number of horses in training during the year Malton York Beverley Windsor Newbury Kempton Park Bath Folkestone Ascot Epsom Downs Wincanton Sandown Park Lingfield Park Plumpton Goodwood Brighton Salisbury Fontwell 325m Pontefract Tax contributed by Aintree Doncaster British Racing Haydock Park Market Rasen Bangor-on-Dee Chester Uttoxeter Southwell Nottingham Great Yarmouth Wolverhampton Leicester Fakenham Ludlow Warwick Huntingdon Towcester Worcester Stratford-on-Avon Newmarket Hereford Ffos Las Cheltenham Chepstow Lambourn Great Leighs Five year capital expenditure of British Racing Racecourses 1.05bn Direct expenditure of core British Racing Training centres Note: All figures refer to 2008, unless otherwise stated 1


4 Foreword Nic Coward Chief Executive, British Horseracing Authority One of the British Horseracing Authority s many roles is to measure and thereby demonstrate the sport s importance to as wide an audience as possible. A key measure is the contribution we make to the British economy: the hard facts that lie behind a sport unrivalled in reputation around the world, with a rich heritage, iconic events and year round entertainment for many millions. Racing is part of the country s social fabric, and makes an enormous contribution to a wide variety of communities. This report seeks to quantify that impact, and to draw some conclusions for the future. The last Economic Impact report, published in summer 2006, has proved an invaluable tool in making Racing s case. It showed for the first time in a decade just how much the sport generates for the economy. However, things change, and the pace of change is particularly fast in some of the dynamic sectors of the economy in which we operate leisure, betting, the media and luxury markets. The findings of this report are striking. Racing remains, by a clear margin, the country s second biggest sport after the modern commercial and social phenomenon that is football, with core industry expenditure now exceeding 1 billion per annum and a total economic impact of 3.4 billion. The tax revenue from Racing amounts to some 1.5 billion over the last five years, with capital investment of over 700m in the same period. We have seen a compound annual growth rate of 6.3%, a rate in excess of UK economic growth. This report has again focused on the national metrics, but also emphasises the local impact of our sport: the benefits of Ffos Las racecourse are being enjoyed by a new rural racing community in West Wales, while a course such as Haydock Park in the urban North West is a significant contributor to its very different region. The report also touches on trends that are not so favourable. The challenge to hold our place in a highly competitive environment is brought more sharply into focus by the current recession. One factor that emerges clearly throughout these pages is the role of racehorse owners as the biggest investors in the sport. Their expenditure on training fees and related spend is largely going directly into the rural economy. When you look at comparisons with other countries, those with a system based on pool betting, this expenditure is also operating as a cross-subsidy, measured in the tens of millions of pounds, to the owners of the commercial businesses that operate around the sport. This report shows that we have diverse revenue streams and significantly less reliance on betting income than other nations, but this does not alter our continuing view that our return from betting operators has failed to reflect our true value. More than this though, it is vital that we get this relationship between Racing and Betting right, so the sport can properly plan for the future. Britain remains the leading stage for the thoroughbred racehorse. These figures show apparent strength, and there are a great many enduring success stories behind the statistics. Understandably, the recession is having an effect on British Racing. The first half of 2009 has seen indications that there are areas that need close attention. These include declines in the numbers of horses in training and owners, certain racecourse revenues under strain, and the bloodstock market facing a challenging period. It is likely that things will get worse before they get better. It is therefore essential that all the constituents of British Racing work closely together to find innovative ways of mitigating the recession s impact on the sport. These developments also highlight the need for joined-up planning and implementation right across the sport. My thanks go to all of those that have contributed to this study, and to the project team behind it for their diligence. I hope you will find it useful and informative, and, most importantly, proof of both the importance of British Racing, and the need for constant vigilance to ensure that it stays that way. 2


5 ECONOMIC IMPACT OF BRITISH RACING Dan Jones Partner in Charge, Sports Business Group at Deloitte We were delighted when the British Horseracing Authority asked us to update the results of our 2005 Economic Impact of British Racing Report. Our Report focuses on the period up to and including 2008, but we also comment on 2009 developments where appropriate. Even before our 2005 report, the Sports Business Group at Deloitte had sought whenever possible to tell Racing s story namely being the nation s biggest sport after the dominant sport that is football. Furthermore we have tried to communicate Racing s unique combination of pure sport, the close inter-relationship with the betting industry, deep links into the rural economy and the wider leisure offering that influence the decision to go racing. This Report provides a fuller narrative behind the headlines of that story. Our Report describes a sport that has seen the benefits of its substantial investment in improving facilities for racegoers, participants and horses. In particular racecourses investment of over 550m in five years has been a key factor in their strong revenue growth. Other sectors such as trainers and breeders have also invested and Britain now has some of the very best equine facilities in the world. The Report illustrates both the scale and diversity of employment in British Racing. In total there are over 100,000 jobs that are directly in, indirectly supported by or associated with, British Racing. Many of these are located in rural areas. This Report clearly illustrates the wide variety of British Racing from the hugely popular grass roots racing that is Point-to- Point, to the hosting of many of the world s top races and festivals. Our work in the Sports Business Group at Deloitte has exposed us to the consequences of the global economic downturn on many sports. While sport is certainly not immune from its effects we have seen an encouraging resilience across many sports. An intrinsic advantage sport has, and which Racing has more than most, is the passion and commitment of its core followers and participants. The decision not to renew a season ticket/membership or sports channel subscription, or to withdraw from racehorse ownership is not taken lightly. There are of course areas of particular vulnerability, with pressure on corporate hospitality and sponsorship apparent in Racing, as it is in all other sports. One impact of the recession is that we have seen a flight to quality with consumers increasing focusing on the country s, and respective sports, top events although this is arguably just an extension of a trend which was already well underway. Racing has the advantage that is has a number of such events, with attendances at the top festivals in 2009 generally holding up well. However, a key challenge will be for Racing to find ways of increasing the profile of the next tier of fixtures a challenge the extensive rebranding of Racing project run by Racing Enterprises will take up. Many of the metrics we discuss in the Report for 2008 are likely to experience declines in 2009, but we are confident that the sport has the ability to bounce back once economic conditions improve. It will be important that Racing does so in a way that it becomes stronger, notably by finding ways of attracting and engaging new participants whether they are racegoers, new racehorse owners or commercial partners. Away from the hard facts, our consultations have found the sport to be more unified, and one increasingly able to speak with one public voice. The continuation of this attitude will be critical as the challenges brought about by the recession and wider social, economic and technological changes are faced. During the course of our research we have consulted with individuals from over 20 organisations drawn from every sector of the industry. We would like to thank everyone involved for their time, information, responsiveness and, most of all, their candour. Our consultations were conducted in a spirit of openness and involved no little debate the perfect conditions for those of us who love to talk racing! We hope you enjoy reading the report and that it proves a valuable tool. Alan Switzer Director, Sports Business Group at Deloitte 3
6 Executive summary This report examines the economic impact of British Racing. Key participants in Racing are owners, racecourses, trainers, breeders, jockeys, stable staff, racing organisations, media and racing consumers such as racegoers, punters and sponsors. In addition to assessing its own economic impact this report positions British Racing in the context of the British sports, betting, leisure and rural economies. The report considers primarily the period up to 2008 but given the challenging economic climate that developed in late 2008, also discusses, where appropriate, developments in 2009 to date. Figure A sets out several key measures of British Racing. Each is discussed below and in the body of the report. Figure A: Key measures of Racing 2008 Total economic impact of British Racing Core British Racing industry expenditure Source: Deloitte analysis bn 1.05bn British Racing s capital 106m expenditure British Racing s tax contribution 325m Core industry employment (FTE) 18,600 British betting industry s gross win on British Racing 1.05bn Average no. of horses in training 15,349 Number of owners 9,539 Total racecourse attendances 5.7m Economic impact British Racing generated an estimated 3.39 billion in direct, indirect and induced expenditure in 2008 (up from 2.86 billion in 2005). In addition Racing s estimated 106m of capital expenditure generated further secondary expenditure of 211m, resulting in a cumulative impact of 317m. The breakdown of this expenditure is shown in Figure B below. Figure B: Summary of economic impact of British Racing 2008 and m m Core industry expenditure Racecourses Media Levy Owners Breeding Total core 870 1,046 Off-course racing expenditure Secondary expenditure Business to business 851 1,002 Consumer 955 1,123 Total secondary 1,806 2,125 Total Economic Impact 2,856 3,393 of British Racing 1 Capital expenditure Overall Economic Impact of 3,421 3,710 British Racing inc capex Note 1: Excluding capital expenditure. Source: Deloitte analysis. The core Expenditure comprises 1,046m by the core Racing industry, 222m off-course expenditure by racegoers, and 2,125m of secondary expenditure as the initial expenditure of the core industry filters through the economy. The impact of the core industry can be summarised as follows: Racecourses generated expenditure of 361m by racegoers, corporate customers and sponsors. 99m was generated from horseracing s punters by the statutory 10% Levy applied to the profits of British betting operators, and betting exchanges paid to the Levy Board. Over 100m was generated from media channels primarily broadcasting through terrestrial services, Racing s two dedicated horseracing TV channels and picture sales to Licensed Betting Offices. Owners incurred direct gross expenditure of 367m whilst receiving income of 92m through prize money and sponsorship. This resulted in net expenditure of 275m (excluding horse purchases). The expenditure of the breeding industry, primarily the 300 full time stud farms, was estimated as being 207m. The Racing industry s core expenditure (excluding capital expenditure) has increased by 176m since 2005, and represents a Compound Annual Growth Rate of 6.3%. Growth has primarily been driven by higher owner contributions due to increased volumes of horses and cost inflation, and racecourses and media companies successfully growing revenues. Employment Figure C shows employee numbers in the core industry, betting industry and secondary areas created as a result of Racing activity, including those directly related to Racing and within construction reflecting the very significant level of capital expenditure. The 18,600 full time equivalent (FTE) jobs created by the core industry are made up of over 14,000 full time, 8,000 part time and 2,500 FTEs from raceday activities.
7 ECONOMIC IMPACT OF BRITISH RACING Figure C: Direct, indirect and associated employment of British Racing Figure D: Racing industry capital expenditure five years to 2008 Figure E: Total tax contribution by type , ,800 18,600 Total 100,100 60m 8% 40m 6% 50m 7% Total 706m 42m 13% 59m 18% 0.5m 1% 155m 48% Total 325m 52, m 79% 68m 21% Core industry Construction Betting Directly related horseracing employment Secondary employment Note: Secondary employment is calculated by dividing total secondary expenditure generated within the economy as a result of racing activity by the national average productivity (revenue) per employee. Source: Deloitte analysis. The largest proportion of employees are involved in the production and training of racehorses, with over 9,500 full-time and around 7,400 part-time employees involved in this activity, predominantly in rural areas. Racecourses and their direct service providers, notably caterers, are the next largest employers. Further activity within the economy as a result of the Racing industry sustains another 29,500 jobs, of which 2,800 are in activities directly related to the racing industry such as vets and farriers. There are an estimated 52,000 FTE jobs in the onshore betting industry, the large majority in Licensed Betting Offices ( LBOs ) in Britain. Employment levels have increased markedly since 2005 owing to an increased number of LBOs and longer LBO opening hours. The considerable proportion of gross win provided by Racing indicates that a significant proportion of these jobs are supported by the sport. Racecourses Trainers Breeders Others Note: Capital expenditure by other bodies includes spending by Weatherbys, Racetech and Tattersalls. Source: Deloitte analysis. Capital expenditure Racing s capital expenditure is estimated at 706m over the five years to After football, this is the highest expenditure by any sport in Britain. Racecourse expenditure on facilities accounted for around 80% of total expenditure during this period. The expenditure was primarily directed at improving racegoer, participant and equine facilities at existing racecourses. In addition, two new racecourses Great Leighs and Ffos Las opened in 2008 and Britain boasts some of the best racecourses in the world to match the quality of its racing. The other major spenders on facilities within the industry are trainers and breeders, with estimated combined expenditure of 110m over the period. Taxation British Racing business contributed at least 325m in tax in 2008 and over 1.5 billion in the last five years. Betting on Racing s provides the largest proportion of tax generated for Government, Gross profit on betting VAT PAYE Source: Deloitte analysis. National insurance Corporation tax with an estimated 155m payable by British betting operators on gross win in 2008 (over 800m in the last five years). Other major tax contributors are the racecourses and racecourse caterers, who contribute significantly to the total VAT payment of 42m and pay employment taxes of 30m. The employment tax contribution made by the breeding and training sectors, whilst relatively modest per employee, is still significant in aggregate at an estimated 68m. Racecourses Revenues for the 60 racecourses open in 2008 totalled 456m. Overall revenues for racecourses are a combination of central distributions from the Levy Board and internally generated revenues from raceday admissions, media rights, sponsorship, and other commercial activities. Betting revenues received by racecourses, either directly (through on-course betting and SIS and Turf TV media payments) or indirectly (through the Levy), totalled approximately 150m. 5
8 EXECUTIVE SUMMARY Figure F: Racecourse revenues Note: See page 21 for details of preparation m m Controllable revenue Admissions Catering (raceday) On-course betting 11 9 Media Sponsorship Other commercial Total controllable Levy distributions Total revenue Source: BHA; Racecourse financial statements and BHA returns; Deloitte estimates. However, racecourses still generated over 300m from non betting activities in 2008, an increase of around 50m (20%) since The 120m in admission revenue equates to an average 25 (including VAT) paid by the c.5.7m racegoers. This average masks a broad range of prices from higher priced iconic fixtures and corporate tickets, to free entrance at Towcester and for all children under the age of 16 to the vast majority of meetings at all racecourses. The sheer scale of catering operations at racecourses is illustrated by the partnership between Jockey Club Racecourses and the Compass Group announced in March 2009, which is projected to generate 500m in revenue over the next ten years. The 60 racecourses aggregate revenue was more than 90m greater than the next largest sport, after football, in Britain Rugby Union. Racing has, like all other major sports, been unable to keep pace with football s stellar growth rates but growth rates of racecourses controllable revenue are similar or higher than most of its other sporting rivals. Given the large and varied inventory available to sponsors there is scope for racecourses to increase their existing 20m sponsorship revenue by broadening the sponsorship base including tapping into those economic sectors such as telecoms, alcoholic beverages and the financial sector that are active in the sports sponsorship market. Attendances British Racing has a diverse and busy fixture list, with 5.7m people attending meetings staged across all but three days during 2008 (an average of 4,029 per fixture). Attendances have dipped marginally since their 6m high in However, while mid week attendances have declined, more people than ever in the modern era attend weekend (including Friday) fixtures. Racing is increasingly combining entertainment with the core racing product. Over 250,000 people attended fixtures with a significant music element in 2008, and Ladies days are extremely popular at both a national and more local level. The top ten race meetings in 2008 attracted 1.1m attendees and provided four of the top ten best attended sporting events in Britain. Owners Racehorse owners are the single biggest contributors to the funding of British Racing through both their purchase of horses from breeders and ongoing training and racing expenditure paid to trainers and jockeys and supporting industries such as vets, farriers and horse transport companies. In 2008 there were a near record 9,539 owners, of which 6,994 engaged in some sort of shared ownership arrangements to reduce costs including partnerships and racing clubs. Around 40,000 individuals are estimated to have an involvement in horse ownership in some way. There was an average of 15,349 horses in training in 2008, up 16% from 2002 (up 5% from 2005). The majority (c.80% in 2008) of owners are involved in ownership of 1-2 horses. However, at the other end of the spectrum the number of owners with a string of 21 or more has increased from 64 in 2006 to 92 in April Many of these owners are overseas nationals and by this route inject substantial funds into British Racing and the British economy. In total owners (including Point-to-Point owners) are estimated to have incurred costs of 367m for horses in training the majority from training fees of 253m but with additional costs arising from vets and farriers, transport, race entry and BHA registration fees, jockey costs and insurance. Owners receive around 80% of total prize money, equating to 85m in 2008 and generated 7m of sponsorship, resulting in a net cost of 275m. Once the 182m breeders expenditure is added owners injected more than 450m into Racing in A large proportion of this expenditure goes into the rural economy. Trainers There were 592 licensed trainers in Britain with a further 126 permit holders and 276 trainers of hunter chasers. Trainers revenue exceeded 250m in The economic impact of this revenue is subsumed in the owners expenditure above as this is an internal transfer of value within the industry. Trainers largest expenditure is the wages and salaries of c.5,600 full time and c.2,400 part time employees (including the self employed and the trainers themselves) of m.

9 ECONOMIC IMPACT OF BRITISH RACING Breeders The British breeding industry is a major global player, producing the sixth highest number of thoroughbred foals each year. There are around 300 full time stud farms in Britain, and in excess of another 4,000 part time breeders. Given the combination of a lack of country specific vendor data for breeder public sales, private sales and the importance of home bred racehorses, the economic impact of the breeding sector has been estimated by building up breeders expenditure rather than using sales values. Total expenditure of 207m was estimated in 2008 including auctioneer fees, with the wage cost of the estimated 4,000 full time and 5,000 part time employees the largest cost ( 113m). In terms of sales values, between 2002 and 2007 the annual aggregate value of public sales in Britain increased by over 80% from 164m to a record 302m driven by a combination of higher volumes and average price. These increases reflected the global boom in bloodstock markets. However, the global economic downturn has resulted in bloodstock values falling markedly. In 2008 British public sales declined to 212m and further falls have occurred in the first half of Betting While British Racing remains the single biggest sports betting product of British betting operators, and the reason many people visit betting shops, its relative share of gross win has declined from 45% in the year to 31 March 2004 (2003/04) to less than 30% in 2008/09 as bookmakers have diversified their product offering, notably through Fixed Odds Betting Terminals and football betting. Nonetheless since 2003/04 the British betting industry s gross win from British Racing has been over 1 billion each year, and reached a record high of 1.2 billion in 2007/08. However, this fell back to 1 billion in 2008/09 owing, in part, to reduced high roller profits and the movement offshore of several former British based sports betting internet and telephone operators. The Betting industry has therefore generated over 5.5 billion in gross win from British Racing over the last five years to 2008/09, of which 513m was paid to Racing via the Levy. Broadcasting British horseracing benefits from extensive broadcast coverage, through both terrestrial services BBC and Channel 4 and two dedicated racing channels, At The Races and Racing UK, which between them broadcast live every race staged in Britain. Racing therefore has the most broadcast time of any sport in Britain. The Grand National is consistently placed in the top 10 most viewed sports events in any given year, often attracting more than 10m viewers and substantial audience shares (67% in 2008). The two dedicated racing channels operate different business models, both of which were profitable in 2008, enabling them to pass substantial revenues on to their respective racecourse partners. The reputation and quality of British Racing is demonstrated by its global broadcasting reach. Both At The Races and Racing UK product are broadcast to over 20 countries, with new countries being added each year. Racing s rural and local impact Racing is a major employer in the rural economy. Given the decline in many other sectors of agriculture, Racing s importance to the rural community has increased and this trend is likely to continue. While a national industry, Racing is particularly engrained in the fabric of some regions of Britain, and is central to the economy in major and historic training regions such as Newmarket, Lambourn and Malton. The depth and spread of the grassroots of Racing are illustrated by over 600,000 people attending the 200 plus Point-to-Point fixtures each year and 3,800 registered horses involved. Racing can also have a major impact on more urban areas, illustrated by York racecourse accounting for 8% of all visitors to York in a year and busy raceday/nonraceday courses, such as Haydock Park attracting visitors to the areas all year round. International standing British Racing is highly regarded across the international racing market. The quality of British Racing is illustrated by the fact that British Racing provided around 16% of the world s top ranked Flat thoroughbred racehorses and staged seven of the world s top twelve rated Flat races over Britain, along with Ireland, is the dominant global force in Jump racing. Britain operates a different Racing funding model from many other countries, notably it is much less reliant on betting. Around 1% of betting turnover of British Racing is paid back to the sport, a significantly lower percentage than in other major racing nations. 7
 to the British economy.")
10 Introduction Background As the sport s governing and regulatory body the British Horseracing Authority ( BHA ) commissioned the Sports Business Group at Deloitte to perform an assessment of the contribution of the British Racing and Breeding industries ( British Racing or Racing ) to the British economy. This report combines analysis of the more traditional measures of the activity levels, and ultimately the health, of British Racing such as racecourse attendances, horses in training, number of owners, prize money and bloodstock auction values with key economic metrics including total expenditure, employment, capital investment and the tax contribution of the sport. This report updates the analysis included in the 2006 Economic Impact of British Racing report (which covered the period up to 2005) which the British Horseracing Board, the BHA s predecessor, commissioned Deloitte to prepare, and which has been an invaluable tool for the Racing Industry. The intervening period has initially seen record figures in many parts of the Industry, but with some declines in 2008 in part due to the worsening economic climate in Britain and globally. The report focuses on the period up to and including 2008 but, where appropriate, individual sections comment on developments in 2009, particularly those influenced by the recession. Where meaningful the report also comments on key movements over time, particularly since the 2006 report, as well as the 2008 position. Methodology Page 48 sets out in detail the methodology, assumptions and parameters of the study. The following points are particularly important: The study measures the economic activity stimulated directly by the expenditure of participants in British Racing (e.g. breeders, owners, racecourses, trainers and others), and racing consumers (racegoers, bettors etc), which then flows through the economy to create activity in other non-related industries. The data included in this report has been gathered through a combination of: - extensive consultations with Racing s stakeholders over 20 consultations were conducted; - data supplied directly by Racing s stakeholders; - results of the 2008 Racehorse Owners Association survey in relation to the training costs of racehorse owners; and - additional primary research and analysis performed by Deloitte. The internal flows between Racing s participants are relatively complicated, and arguably are of much less relevance to those outside of Racing. Hence, wherever possible this study simplifies matters to focus on the flows into and out of Racing. The study focuses on 2008 wherever possible as adjusted, where appropriate, for exceptional factors during the year, such as the abandonment of York s Ebor meeting in August. Figure 1 illustrates the separate components when determining the economic impact of an industry. Core industry primarily including expenditure by, or generated from, Racing s consumers, racecourses, owners, trainers and breeders but also incorporating organisations such as the BHA, HBLB, At The Races, Racing UK, Weatherbys, Tattersalls, etc. Other direct impacts mainly off-course raceday expenditure by racegoers on such goods and services as food and transport. 8
 and consumer expenditure (e.")
11 ECONOMIC IMPACT OF BRITISH RACING Figure 1: Components of Economic Impact Indirect Impacts Other Direct Impacts Core Industry Raceday Multipliers Source: Deloitte analysis. Indirect and induced impacts quantifies the ripple effect as the direct expenditure by the core industry subsequently flows through the economy via further Business to Business expenditure (e.g. business spending on suppliers) and consumer expenditure (e.g. recipients spending wages elsewhere in the economy). Betting industry the impact of the betting industry is primarily addressed via the statutory levy on British betting operators gross profits and betting exchanges commission on British horseracing as paid to the Horserace Betting Levy Board ( Levy ), and subsequently distributed amongst Racing s participants, primarily owners, through prize money. This report also sets out the total amount of gross win of the British betting industry from betting on British Racing as this is expenditure of racing bettors. It also considers the direct taxation generated from betting on horseracing and the total employment levels in the betting industry. Report structure This report is structured into five key sections as described below: Section 1: Assesses the overall economic impact of Racing via the aggregate level of expenditure by its participants, consumers and indirect impacts. Section 2: Discusses Racing s aggregate levels of employment, taxation and capital investment. Section 3: Considers the individual impact of Racing s key sectors and examines the appeal of Racing for its customers as demonstrated by levels of attendances and broadcast coverage. Section 4: Examines British Racing s standing within the global racing industry, including its reputation for high quality and varied racing. Section 5: Racing is unique in the British economy in its combination of pure sport, the wider leisure industry, a close relationship with the rural economy and strong links with the betting industry. This section sets Racing in this context by making appropriate comparisons with rural/other industries, other sports and leisure activities. Racing is unique in the British economy in its combination of pure sport, the wider leisure industry, a close relationship with the rural economy and strong links with the betting industry. A number of Feature articles have been included in appropriate Sections which examine in more detail particular aspects of Racing, including illustrating the important role Racing plays in local economies. 9
12 Overall economic impact Industry size British Racing s economic impact has been estimated based on the direct expenditure of its participants and the associated expenditure of racing consumers. In determining the economic impact of any industry it is normal to eliminate any double counting of expenditure in order to derive the net injection of expenditure created by the industry. This is particularly important for the Racing industry given the often complex, and two-way, flow of funds between the participants of the industry one participant s expenditure is often another participant s income. The definition of expenditure will vary between participants and consumers but essentially it refers to new cash injected into the Racing industry by each level of the industry. Figure 2 opposite sets out details of each participant s expenditure in order to estimate the overall economic impact of British Racing. Core Industry Racing consumers (racegoers, broadcast viewers, sponsors and on-course bettors, etc.) injected almost 500m into the core Racing industry, primarily through racecourses but also broadcasting channels. The gross win of the British betting industry from betting on British horseracing (i.e. the amount lost by bettors) was over 1 billion in A 10% (as the standard rate) statutory levy on this gross win is paid to Racing. The remaining c. 900m plus includes c. 155m gross profits tax with the balance being betting operators profits. Owners incurred direct gross expenditure of 367m but received 92m back in prize money and sponsorship, resulting in a net expenditure of 275m. However if the expenditure of breeders 182m is assumed to be ultimately incurred by owners, via the purchase of horses, gross owners expenditure was c. 550m, with a net expenditure of 457m. Figure 2: Expenditure of Racing s participants Participant Racecourses The expenditure generated by Britain s 61 (60 open in 2008) racecourses and 117 Point-to-Point courses from the expenditure of racing consumers namely the expenditure of: Racegoers - Raceday admission, membership fees, racecards, etc. - Catering spend (actual spend of racegoers) - Corporate attendees Sponsors and advertisers On-course betting commission paid by Tote and on-course bookmakers fees Non raceday attendees conferences, banquets, on site hotels, etc. Media Owners Breeders Off-course betting Off-course expenditure Source: Deloitte analysis. Industry cash inflow (equivalent to assumed expenditure) All racecourse cash flows are exclusive of VAT, except for catering and admission income, which include VAT. The expenditure of broadcasters and viewers on British Racing via: Broadcasters payments from terrestrial channels and bookmakers (SIS and Turf TV) Racing UK and At The Races through subscriptions (for Racing UK), overseas sales of picture rights, betting commission, etc. The amounts received by racecourses in media money ( 57m) is less as Racing UK and At The Races distribute revenue after deducting their costs. An estimate of non circulation Racing Press revenue is also included in this total. Owners expenditure on racehorses takes two main forms: Ongoing operating expenditure on keeping and training horses training fees (including trainer fees, vet costs, transport etc), jockey costs, entry fees etc Capital cost of buying racehorses Owners expenditure on buying horses is incorporated via breeders expenditure. In aggregate, owners recoup a proportion of their ongoing expenditure on horses from prize money. A large proportion of prize money being paid by the Levy and therefore is internal to the industry. It is therefore necessary to deduct prize money from owners gross expenditure to get their net investment into British Racing. The training and keep costs of c.3,750 Point-to-Point horses are also included. There are an estimated 300 full stud farms and c.4,400 other breeders in Britain generating revenue primarily from the sale of horses (via public or private sales). Given the lack of country specific vendor data for breeder sales, and the importance of home bred racehorses, the economic impact of the breeding sector has been estimated based on breeders expenditure. Additionally, over 25m was paid to public auctioneers in commission. Over 1 billion of gross win (the amount lost by bettors) was generated from betting on British racing by the betting industry. The statutory Levy is applied to betting operators gross profits on British horseracing generally 10% and generated 99m in 2008 which was paid to Racing. Only the Levy element of gross win has been included within the core Racing industry figures. The on-course expenditure of racegoers is captured within racecourse revenue. In addition, the c.5.7m annual racegoers incur additional expenditure costs on travelling to the racecourse, accommodation, food and drink outside the racecourse and other local spending. This expenditure has been directly generated by the decision to go racing hence, while not part of the core industry, is still generated by Racing. Off-course expenditure also includes estimated total Racing Press expenditure of 34m (arising from reader purchases). 10
13 ECONOMIC IMPACT OF BRITISH RACING SECTION 1 In total Racing s consumers, owners and bettors spent c. 2.2 billion on Racing in 2008 ( 2 billion 2005). The expenditure of the core Racing industry was 1,046m in 2008, a 176m (20%) increase from It is important to note that whilst trainers, jockeys and stable staff are not shown separately in Figure 3, this is merely a function of the expenditure method used to assess the economic impact as not only do they play a vital role in the industry, and are certainly within the core, but they also provide an economic impact on the economy in their own right. Their expenditure is effectively included within that of owners. Figure 3: The flows into Racing from its participants and consumers 2008 and 2005 Total expenditure on Racing 2.2 billion ( 2.0 billion) Note: Figures in brackets represent the equivalent expenditure in 2005 which have been reclassified where appropriate. Source: Deloitte analysis. Racing consumers (Racegoers, corporates, viewers) Off-course expenditure 222m ( 180m) Racecourses 361m ( 262m) B2B Consumer Total Media 104m ( 88m) Core British Racing 1,046m ( 870m) Secondary expenditure 1,002m 1,123m 2,125m Total direct and stimulated expenditure 3,393m ( 2,856m) Owners (including expenditure on trainers and jockeys) Direct owners Gross 367m ( 289m) Net 275m ( 200m) ( 851m) ( 955m) ( 1,806m) Breeding expenditure 207m ( 217m) Capital expenditure Racing 106m ( 189m) Secondary expenditure B2B Consumer Total 115m 96m 211m Total 317m ( 565m) Off-course bettors Gross win 1,050m ( 1,088m) 99m levy to Racing ( 103m) ( 205m) ( 171m) ( 376m) Secondary expenditure The core industry expenditure of 1,046m, augmented by 222m of off-course expenditure, generates a further 2.12 billion of expenditure in the economy as the initial expenditure filters through the economy. Business to Business expenditure made up 1 billion of this total, with the balance of 1.12 billion generated by consumer expenditure. This means that for every 1 spent in the core industry and on off-site expenditure, an additional 1.68 is generated in secondary expenditure by linkages in the economy. Capital expenditure It is usual practice to exclude capital expenditure when assessing the economic impact of industries at a particular point in time. However, since 2000 Racing has engaged in a programme of ongoing annual investment, which although expected to decline in the next few years, will still be sizeable. Racing s contribution to the construction industry is important given the impact of the downturn. The impact on the British economy of the 106m capital expenditure in 2008 is therefore shown separately. The initial capital expenditure is estimated to generate a further secondary expenditure of 211m, resulting in total expenditure of 317m in Total expenditure Excluding the impact of capital expenditure, British Racing therefore generated 3.39 billion in direct, indirect and induced expenditure in 2008 (an increase from 2.86 billion in 2005). Including capital expenditure increases the total expenditure to over 3.7 billion. The individual movements between 2005 and 2008 are discussed in the respective sections but it is instructive to note that the Compound Annual Growth Rate of core British Racing expenditure of 6.3% was primarily due to higher racehorse owners and racegoers expenditure. Gross Value Added Total expenditure generated by the industry is relevant in assessing the contribution made to the British economy. However, using expenditure alone does not acknowledge the fact that no value is added by the sourcing of physical inputs alone. It is what the industry does with those inputs that contributes to the economy, rather than simply purchasing the inputs. In simple terms, expenditure can be adjusted to exclude intermediate demand so that only the real or gross value added by stakeholders is included in the analysis. An alternative measure of industry contribution and the one which can be most readily compared to national indicators such as Gross Domestic Product (GDP) is given by Gross Value Added (GVA). To obtain this estimate it is necessary to adjust expenditure to isolate the value added in terms of operating profit and wages paid, based on data from the Office for National Statistics. On this basis, the GVA associated with the 3.71 billion in direct capital and secondary expenditure is found to be approximately 1.73 billion ( 474m from the core industry). 11

14 Racing s cash flow The assessment of the economic impact of Racing as set out on pages 10 to 11 focused purely on the flows into Racing, but it is also instructive to examine the outflows from the industry. Figure 4 sets out inflows and outflows for participants and Racing organisations set out in the centre of the chart all other core Racing participants have been excluded owing to unavailability of robust inflow and outflow information. Several high level assumptions have been required (see notes to Figure 4), hence the cashflow should be regarded as illustrative only. Nonetheless it provides a valuable insight into Racing s cashflows. Figure 4: Racing s key cash flows Racing cash flows in Raceday 141m Catering 129m Media 84m Other Commercial 107m Gross Owners operating spend 347m Owners horse purchases 182m Levy Receipts 99m Total inflows 1,130m British Racing Industry Racecourses BHA HBLB Jockey Club Racetech Weatherbys Tattersalls Owners Trainers Breeders Jockeys Total outflows 1,138m Racing cash flows out Prize Money 106m Wages (take home) 266m Capital expenditure 88m Caterers 70m Other operating expenses 324m Horse costs 100m Repayment to financiers 15m Inflows Raceday consists of racecourse admission receipts from the 5.7m racegoers (excluding Point-to-Point) and on-course betting (commission only). Catering after admissions, catering is the highest area of expenditure for racegoers. The 129m represents the VAT inclusive spend on the racecourse, however racecourses typically outsource their catering operations and are paid a commission by the caterers (hence the 70m shown separately as an outflow). Financiers 38m Interest 4m Net movement ( 8m) Basis of preparation: 1. Movements in working capital have been assumed to be cash neutral. 2. The impact of capital credits taken by racecourses has been assumed to be cash neutral. Levy Board loans are also excluded from the analysis as these loans are assumed to have been made from cash already in the industry, or the 99m Levy receipts for All flows exclude VAT except raceday admissions and catering, with the implicit assumption that all other participants can reclaim VAT. Source: Deloitte analysis. Media income comprises broadcaster plus BAGS/SIS and Turf TV payments to racecourses, and revenue generated by Racing UK and At The Races (which will be higher than that passed on to the racecourses). Other commercial income of 107m is primarily generated by the racecourses ( 80m including sponsorship and nonraceday activities) but is augmented by revenue from other Racing bodies. Interest 20m Dividends 5m Taxation 144m Excluding horse purchases, racehorse owners spent a gross 347m on Racing in As explained in more detail in the Breeders section, the expenditure of the breeders has been used as a proxy for owners expenditure on purchasing horses hence in the cash flow model the inflow is shown with separate components of expenditure in the appropriate categories. Total 2008 levy receipts of 99m have been estimated by pro-rating the fiscal years 2007/08 (i.e. to March 2008) receipts of 115m and 2008/09 receipts of 93m and hence will not correspond to either fiscal year. The prize money element of levy expenditure is based on actual amounts paid, with other payments, primarily integrity payments, based on a pro-rata calculation in line with the receipts methodology above. 12

15 ECONOMIC IMPACT OF BRITISH RACING SECTION 1 The primary aim of many parts of the industry is not a financial return on investment hence cash inflows are generally reinvested in horseracing for the good of the sport. External financiers injected 38m in The majority is due to the funding of Jockey Club Racecourses capital expenditure, but the total also includes estimates for Great Leighs and Ffos Las funding. Outflows Prize money c.80% of the 106m prize money was received by owners. The balance is distributed widely within the sport, with 14m going to trainers (including 6m for their stable staff) and 8m to jockeys. This prize money is considered a valuable additional revenue source to Racing participants. Total wages, including employers National Insurance and estimated trainers profits, of 371m were paid to approximately 17,000 employees (FTEs). Of this an estimated 266m was taken home by the employees after 105m of PAYE and National Insurance was deducted. Horse costs consist of veterinary, feed, transport, farriers costs and others incurred by trainers and breeders. Other operating expenses include racecourse raceday expenditure and operating expenses ( 168m), trainers costs (c. 90m) and various Racing organisation overheads. Taxation comprises the VAT element of raceday admissions and catering and employment taxes for included entities, see page 18 for a fuller discussion of Racing s tax contribution. The capital expenditure of 88m primarily consists of the racecourses spend but also includes an estimated amount to cover trainers and other Racing bodies 2008 expenditure see page 16 for further discussion of Racing capital expenditure. Integrity costs included within and across a number of the outflows is a total of 25m for the provision of integrity services to Racing. Maintaining the high standards of integrity of British Racing both in reality and in the racing consumers perceptions is acknowledged by all in Racing as being critical to its continued prosperity. Interest paid of 20m (mainly from racecourses) is relatively low given the size of the industry, although it has increased markedly from the 5m in 2005 primarily as racecourses have increased borrowings to fund capital expenditure. The Levy Board plays an important role in this respect by the provision of zero interest loans for capital development 43m of loan finance was in place as at March Dividends of 5m were paid in 2008, consisting of 2m paid by Arena Leisure plc (the only racecourse dividend), with the remaining 3m by Tattersalls and Weatherbys. Net interest and dividends in total represented less than 3% of operating cash inflows of the industry. Overall The total inflows of 1,130m compared with outflows of 1,138m resulted in an decrease in cash of 8m. The primary aim of many parts of the industry is not a financial return on investment (hence the low dividends seen) and cash inflows are generally reinvested in horseracing for the good of the sport. As an example, in recent years operating profits generated by racecourses have been used to help fund their extensive capital expenditure, in conjunction with external and Levy finance. 13
16 Employment The extensive and complex nature of Racing means it supports significant levels of employment in a range of economic sectors from racehorse production to staging c.1,500 racedays to facilitating betting on racing. Figure 5: Direct, indirect and associated employment of British Racing 26,000 Core industry Construction ,000 Betting 2,800 18,600 Directly related horseracing employment Secondary employment Total 100,100 Note: Secondary employment is calculated by dividing total secondary expenditure generated within the economy as a result of racing activity by the national average productivity (revenue) per employee. Source: Deloitte analysis. The core Racing industry sustains over 18,600 FTE jobs. Core industry employment levels have remained broadly in line with 2005 levels once changes in estimation methods are taken into account (see note to Figure 6). The further economic activity generated through Racing s combined expenditure creates additional employment of approximately 28,800 (excluding betting industry and construction jobs). Of this additional employment, around 2,800 individuals are employed in activities directly related to the horseracing industry such as vets, farriers, and horse transportation. A further estimated 26,000 are employed indirectly in non related industries, as Racing s expenditure flows through the economy. In addition around 700 jobs in the construction industry are currently supported by the significant level of capital investment by British Racing. There is an intrinsic link between the Racing and betting industries, with an estimated 52,000 FTE betting operator jobs largely in Licensed Betting Offices ( LBOs ) ( ,000). Whilst LBOs handle activity related to other sports and betting activities in addition to horseracing, a significant proportion of betting is on horseracing. The growth in betting industry employment has been driven by more LBOs opening and LBOs permitted opening hours being significantly extended from 2007, particularly between September and March. The fixture list has expanded to meet the betting industry s demands for evening racing in this period. Figure 6 gives a breakdown of the total employees within the core British Racing industry. The core British Racing industry employs 14,100 individuals on a full-time basis. When part-time and raceday staff are included, approximately 18,600 FTE jobs are generated. The largest proportion of employees are involved in the production and training of racehorses, with over 9,500 full-time and around 7,400 part-time employees involved in this activity. Whilst racehorse owners are an integral participant within the horseracing industry, with over 9,500 registered owners in Great Britain, it is assumed that they do not directly employ material numbers of people within the horseracing industry, who are not already captured in other categories. There were 592 licensed trainers in Britain in 2008 and a further 402 permit holders or trainers of hunter chasers. Trainers employ a wide range of support staff Figure 6: Employees within the core horseracing industry in Britain Employment Group FT PT Raceday Total (FTE) (FTE) Trainers (including stable staff) 5,572 2,400 6,772 Breeders (Studs) 4,000 5,000 4,500 Racecourses 1, ,683 Integrity and Governance Weatherbys Jockeys On-course bookmakers Tote (pool betting) Bloodstock auctioneers and agents Media Caterers ,900 Total 14,131 8,000 2,470 18,621 Note: Breeders employment, as estimated by Thoroughbred Breeders Association, assumes 4,000 full time employees and 5,000 part time employees who spend on average a tenth of their time on breeding, hence 500 FTEs and 4,500 FTEs in total. This differs from the 2005 estimate of 3,000 full time, and 6,000 part time employees who were treated as being half FTE hence 6,000 FTEs. Trainer employment levels now include the trainers. Source: Breeders survey; British Racing Statistics 2008; Deloitte analysis. 14


17 ECONOMIC IMPACT OF BRITISH RACING SECTION 2 totalling around 5,600 full-time (including the trainers) and 2,400 part-time staff, ranging from stable grooms to blacksmiths and drivers. Of the 427 full-time jockeys, 121 have professional licences for Flat racing and 99 for Jump racing. The remainder have either apprentice or conditional licences. Jockeys are amongst the hardest working sports competitors in Britain, and for much lower financial rewards than in many sports. A further 100 valets, agents and others have been estimated to directly support the jockeys. Whilst racecourses employ over 1,800 full-time staff, numerous additional staff are employed on a raceday including to staff catering operations and by the Tote to assist in delivering on-course betting facilities. Raceday employees equate to 2,500 FTEs with many thousand individuals employed at the 60 racecourses in any given year and in excess of 5,000 people working on course at the largest meetings. Racecourses have moderately increased their full-time staff since 2005 for a variety of reasons, including some racecourses taking in house previously outsourced activities, notably catering, and increased non raceday activities. However, several courses have reduced staff levels in 2008, influenced by the worsening economic conditions. The largest proportion of employees are involved in the production and training of racehorses, with over 9,500 full-time and around 7,400 part-time employees involved in this activity. Over 300 full-time staff are employed in the critical role of safeguarding Racing s integrity primarily by the BHA but also by Racetech, SIS and directly at some racecourses. The sport s central administrative body, Weatherbys, under contract to the BHA, employs another 300 people across its diverse operations. As Section 5 shows, Racing, after football, employs the most people of any sport in Britain. 15

18 Capital investment Investment in facilities is vital to enabling the growth and sustainability of any sport. Total capital expenditure by British Racing was 706m over the five year period to 2008 the highest level of investment of any sport in Britain, after football. Racecourses expenditure represented the majority of the spending as would be expected for the principal shop window of British Racing. However, trainers, breeders and other Racing bodies all made sizeable investments. In total racecourses are estimated to have invested 556m over the five year period between 2004 to 2008, 79% of total capital expenditure by Racing. The majority of expenditure by racecourses has been on racegoer facilities, such as the development of grandstands and other public facilities. The racecourses have also invested significantly in facilities (including tracks, stables, etc.) for both horses and Racing employees. As shown in Figure 8, total expenditure on racegoer facilities reached a peak in 2006 when 165m was invested by racecourses, with an annual investment of at least 70m since British Racing now boasts some of the best racecourses in the world in terms of services provided to racegoers and racing participants matching the quality of the horseracing on show. Figure 7: Racing industry capital expenditure five years to m 8% Racecourses 40m 6% 50m 7% 556m 79% Trainers Breeders Total 706m Others Note: Capital expenditure by other bodies includes spending by Weatherbys, Racetech and Tattersalls. Source: Deloitte analysis. Whilst the redevelopment of Ascot has accounted for c.40% of this total investment over the last five years, other significant expenditure on existing racecourses includes the comprehensive redevelopment of Doncaster, Aintree s new grandstand, the Duchess s Stand at Epsom, and Cheltenham s Centaur facility. Ayr, Newbury, Newmarket and York amongst others have also undertaken major capital projects over the last five years. Figure 8: Capital expenditure by British racecourses five years to 2008 m Source: Company/group financial statements; Deloitte analysis. Great Leighs and Ffos Las racecourses opened in May 2008 and June 2009 respectively were the first new racecourses to open since Great Leighs received widespread praise for the quality of its all weather racing surface. Financial difficulties forced it to cease racing in January Ffos Las is discussed in more detail on the next page. Continued investment in Britain s racecourses will lead to further long term benefits. Projects are already ongoing or planned at Catterick, Chester, Doncaster (second phase) Fontwell, Lingfield, Newbury, Pontefract and Windsor amongst others

19 ECONOMIC IMPACT OF BRITISH RACING SECTION 2 Many of the recent racecourse developments (including those at Epsom and Cheltenham) have combined enhanced raceday infrastructure with flexible nonraceday facilities, assisting racecourses in developing 365 day a year businesses to support their core racing activities. Racecourse investment in the last five years has been funded by a combination of external finance, internally generated resources, and support from the Levy Board. Despite the current difficult market for fundraising, if money can be found racecourses have the opportunity to take advantage of the reduced construction costs which have arisen from the economic downturn. Trainers and the providers of training facilities have also invested significant amounts, estimated at 60m over the period, equating to 8% of total capital expenditure. This includes the gallops at Newmarket and Lambourn, which are owned by Jockey Club Estates. The Newmarket gallops are amongst the best in the world and benefit from a continuous programme of investment. The Lambourn gallops were purchased by Jockey Club Estates in 2006 and have since been upgraded substantially, helping to maintain the area s standing as a key training centre (see page 31 for Lambourn feature article). Financial information on the capital expenditure by breeders in Britain over the five years to 2008 is limited; however based on that available we have conservatively estimated it at 50m (note this differs from the 20m p.a. discussed in the Breeders section as this will include maintenance expenditure). The majority is likely to have been made by the largest stud farms, including Darley, Cheveley Park Stud, Juddmonte Farms and Highclere Stud. Nonetheless, it is probable that total investment is significantly higher than this estimate. Ffos Las Ffos Las became the first new British turf racecourse to open for over 80 years when it staged its first fixture on 18 June 2009, attracting a 10,000 sell out crowd. Ffos Las was built on the 600 acre brownfield site of what was once Europe s largest open cast coal mine, in South Wales near Llanelli and Carmarthen. The racecourse cost 21m and was financed by a joint venture between Pembrey Racecourse and the Walters Group engineering company through a combination of enabling residential/ commercial development, owner contribution, and a 4m interest free loan from the Levy Board. The operation of the racecourse is managed by Northern Racing Ltd. The quality of the track and facilities at the racecourse have received widespread praise from within the Racing industry and the wider South Wales community. The 12 furlong track built to a specification that meets the BHA s ideal track configuration can be viewed from a 2,700 capacity grandstand containing eight hospitality boxes and a 150 seater restaurant. There is also 120-horse block stable and an Equestrian Centre. The current capacity is capable of being increased to 15,000 as demand is demonstrated and fixtures added. The turf track will stage nine fixtures in 2009, but there is a much expanded programme of 28 Flat and Jump fixtures in 2010, the racecourse having acquired through the annual BHA fixture bidding process a further 12 fixtures in addition to the 16 it is granted by the BHA by virtue of its status as a new racecourse. Ffos Las s management has focussed on developing a racing calendar that includes Racing in every month of the year. August will be the racecourse s busiest month, including a three day Flat festival in Its location is expected to make it particularly attractive to Irish trainers and racegoers, as well as popular holiday attraction in the summer months. Ffos Las is also planning on building comprehensive non raceday activities covering both conferences and entertainment. It can stage large outdoor and indoor events, such as concerts and exhibitions. To maximise its success as a non raceday venue it must draw on the region s tourist population. The racecourse s owners also intend to hold a new Celtic Festival around St David s Day. The new racecourse has already aided the local economy, as many local people were employed in its construction. Now open, 60 local staff members are employed on race days and the visitors it will attract to the region will provide a significant boost to tourist expenditure. The land requirements, capital cost and competitive nature of Racing means opening new racecourses is an infrequent event. However, Ffos Las has proved that by effective planning, assembling a qualified team and ensuring an appropriate funding mix, it is possible. 17
20 Racing s tax contribution British Racing generated at least 325m in tax in 2008, 170m of this from sources other than tax on betting operators gross win on the sport. Over the five years to 2008, it is estimated that Racing has contributed approximately 1.5 billion in tax receipts to Government. Racing s tax payments have increased steadily since 2005 as the industry has grown. Betting represents the largest source of tax paid to Government from Racing activity, with an estimated 155m payable by bookmakers on their gross win from betting on British Racing in 2008 (and over 800m in the last five years). Racing s core 18,600 FTE employees generated total employee taxes of 127m in 2008 (employee and employers NIC and PAYE). Racing s VAT contribution has been estimated primarily on racecourses admissions and catering revenue, as it is these sources of income on which the ultimate payer, the racegoer, is unable to claim back the VAT. In addition to the 15% tax on gross win on British Racing the gross win of over 1 billion will generate further tax in terms of corporation tax on bookmakers profits. Tax is also payable in the form of PAYE/NI on LBO staff. These additional contributions have not been included in the above total but may be in the order of 250m in PAYE/NI alone. UK betting taxes are currently diminishing as several major sporting betting operations have relocated their telephone and internet operations offshore, notably to Gibraltar, to avoid the 15% tax on gross win and 10% levy paid to Racing on gross win on British horseracing. Figure 9: Total tax contribution by type 2008 VAT 42m 13% PAYE 59m 18% 68m 21% Gross profit on betting Source: Deloitte analysis. 0.5m 1% 155m 48% National insurance Corporation tax Total 325m Over the five years to 2008, it is estimated that Racing has generated approximately 1.5 billion in tax receipts to Government. The limited corporation tax contribution by racecourses is partly a result of their significant investment in capital facilities and the use of capital credits from the Levy Board to help fund these developments. As noted in the Capital Expenditure section, it is estimated that Racing has invested over 706m over the five year period to Once the development of capital projects is completed, higher revenue and profits are expected to be generated, which will lead to higher future taxation bills. Racecourses estimated 67m tax contribution comprised 38m in VAT (charged on admissions and catering) and 29m employment taxes, from the estimated 1,800 full time employees and additional raceday staff as well as the employees of the racecourses catering operations, which are typically outsourced. Figure 10: Total tax contribution by contributor 2008 Bodies 31m 9% 30m 9% Bookmakers 38m 12% 67m 21% 4m 1% Racecourses Trainers 155m 48% Breeders Owners Total 325m Note: Racecourses includes employment taxes in relation to racecourse and catering employees and VAT on admission and catering revenues. Source: Deloitte analysis. For breeders and trainers the figures represent the PAYE and NI on staff wages. The rates are relatively modest owing to the relatively low wages in the industry, and a large number of part-time employees. In 2008 an estimated 83% of horses in training were covered by a sponsorship agreement, thus allowing their owners to register for VAT under the VAT Scheme for Racehorse Owners. This in turn allows those owners to reclaim the VAT on their racing related expenses. The BHA commissioned report, the Economic Impact of the VAT scheme for racehorse owners, estimates that the scheme saves the industry 20m in VAT per annum. In today s challenging economy, such a scheme is more valuable than ever. Removal of the scheme would substantially increase owners costs bringing a risk of much reduced ownership levels with a knock on effect through the industry and likely lower tax revenues. 18

21 ECONOMIC IMPACT OF BRITISH RACING SECTION 2 19
22 20
23 ECONOMIC IMPACT OF BRITISH RACING SECTION 3 Racecourses Overview Britain s 60 licensed racecourses operate a variety of racing activities and business models ranging from: Exclusively Jump or Flat racecourses to mixed use which enables year round racing; The five racecourses with all weather tracks which allow them to stage a high volume of fixtures (sometimes over 100) compared to turf only racecourses which stage on average 20 days racing a year; and Racecourses with a dominant raceday/meeting such as Epsom and Aintree to those with a more even spread. Jockey Club Racecourses, Northern Racing and Arena Leisure between them own and/or operate 30 racecourses with the remaining 30 owned independently largely by private companies but some through race clubs or local trusts. Commercial profit maximisation in the true sense is often not the main objective of racecourse owners as many are established so that dividends cannot be paid to their owners and instead profits are reinvested into the sport. Racecourse revenues are a combination of centrally generated Levy Board distributions and individual racecourses (or groups of racecourses ) revenue streams. Levy distributions are outside the direct control of the racecourses, being dependent on the level of British betting operators gross win on British horseracing and the Levy Board s distribution policies. Levy distributions are discussed on page 34 but for completeness are included in Figure 11. The remaining revenues are controllable by the racecourses, and have been split into the six categories set out in Figure 11; each one is considered separately below. The majority of racecourses outsource their catering operations in return for commission based on the percentage of revenue and/or profits. However, some racecourses, notably Figure 11: Racecourse revenues Controllable revenue m m Admissions Raceday catering (gross spend) On-course betting 11 9 Media Sponsorship Other commercial Total controllable Levy distributions Total revenue Note 1: Additional disclosure in 2008 racecourses returns has resulted in more revenue lines being classified within Admissions revenue than in 2005 when they would have been included in Other commercial. A reclassification of 10m has been made from Other commercial to Admissions for Revenue differs from that disclosed in racecourses statutory accounts owing to a variety of factors, including the grossing up of catering revenues, the adjustment of differing accounting policies in respect of Levy distributions, treatment of capital credits and sponsorship monies etc. Source: Racecourse financial statements and BHA returns; BHA; Deloitte estimates. those owned by Arena Leisure and Newbury have moved to in house catering operations. As catering commission received by racecourses who have entered into outsourcing agreements does not reflect the real spend of racegoers, grossed up catering spend has been estimated. Racecourse total revenue (adjusted for catering) was 456m in 2008, an increase of 69m since Racecourses generated c. 150m from direct (on-course and the majority of media income) and indirect (Levy Board distributions) betting sources highlighting the symbiotic relationship between Racing and the betting industry. Nonetheless, betting activities comprise less than one third of the total revenue generated by racecourses, with non betting activities generating over 300m. The 18% increase in racecourse revenues since 2005 has been primarily driven by higher raceday spending on admissions and catering. The emergence of competition for LBO media rights has also increased media revenues. All revenue sources, other than on-course betting, saw some growth. Media monies are generally high profit revenues owing to limited incremental direct costs. 58% of controllable racecourse revenues were generated by the combined results of Jockey Club Racecourses, Arena Leisure and Northern Racing (from 30 racecourses). The remaining 30 racecourses open in 2008 generated c. 150m an average of c. 5m each but with wide variation between the large independents such as Ascot and York and smaller, often rural, racecourses. Admission revenues The 60 racecourses generated 120m in admission revenue in This represents an increase of 22m from 2005 despite a 3% fall in attendances over the same period The significant investment undertaken by racecourses over 550m in the last five years has helped racecourses to segment their offerings such that they can provide high quality hospitality packages as well as very competitively priced general admission tickets. The diverse nature of racing across racecourses and fixtures mean that there is a very broad range of amounts paid ranging from free entrance at Towcester to the premium pricing for iconic fixtures. In aggregate the average admission revenue per attendee in 2008 was 21 from the 5.7m racegoers (up from 17 in 2005). After adding VAT this equates to an average expenditure of 25 per racegoer per raceday. However, this mean average is boosted by hospitality revenues and crown jewel fixtures meaning the majority of racegoers will have paid substantially less than 25. Furthermore, children under the age of 16 gain free admission to the vast majority of fixtures, 21

24 RACECOURSES allowing families to enjoy days out at very competitive prices compared to other sporting events or leisure pastimes. Catering The sheer scale of catering operations at racecourses is illustrated by the partnership between Jockey Club Racecourses and the Compass Group announced in March 2009, which is projected to generate 500m in revenue over the next ten years. Total gross on-course catering spending of 100m, represents an average of c. 21 (including VAT) on food and drink per attendee. This will vary considerably from the corporate attendee at Royal Ascot to more day to day race meetings. Gross catering spend is estimated to have increased by around a quarter since 2005 through a combination of food and drink inflation but also by offering the racegoer a better quality, accessible and diverse catering product although further improvements are required. Working closely with the caterers as key racecourse stakeholders is central to building on this impressive recent performance. Media Media revenue of 57m in 2008 represents a 15m increase from Media revenue is generated from the following sources: Broadcast rights fees paid by the terrestrial channels, but limited to a very small number of the iconic fixtures. Indeed Racing actually contributes to the cost of the c.80 days a year Channel 4 coverage, rather than receiving rights fees; Payments to the 30 Open At The Races ( ATR ) racecourses by ATR and 30 Racing UK racecourses; and Payments by SIS and Turf TV for the supply of racecourse pictures to licensed betting offices. The introduction of Turf TV, a joint venture established in 2007 between 31 racecourses and Alphameric plc, to the LBO market has increased competition and increased the level of revenue to racecourses. Previously SIS was the sole provider of pictures to LBOs. Sponsorship Racecourses generated an estimated 20m in race and/or meeting sponsorship, the vast majority of which is paid out by racecourses in prize money. Of the 9,500 races staged in 2008, 70% carried some sort of sponsorship ranging from blue chip firms for the major races (such as John Smiths and Vodafone for the Grand National and Derby respectively) to much smaller local businesses sponsoring their races at their local racecourse, often part of a corporate hospitality package. The betting industry continues to provide the largest contribution to sponsorship, supporting around 31% of all sponsored races. Major industry organisations such as Weatherbys, Tattersalls and the European Breeders fund are also major sponsors. While such internal sponsorship is important, there is a need for Racing to broaden its sponsorship base including tapping into those economic sectors such as telecoms, alcoholic beverages and the financial sector that are active in the sports sponsorship market. Investec s sponsorship of the 2009 Derby illustrates that there is an appetite of such sectors, and the importance of the racecourses and sponsors working together in partnership to maximise the value of the sponsorship to both parties. On-course betting The 9m betting revenue in Figure 11 represents the commission payable to racecourses from on-course tote operations and bookmaker shops plus bookmaker badges. The actual amount staked, and left behind (i.e. lost) by racegoers, is substantially greater but, as this does not go to racecourses, it is not shown in revenue. The on-course betting revenue retained by racecourses has reduced since 2005 due to the combination of a fall in attendances and a fall in spend per attendee in 2008 as racegoers reacted to the economic downturn with reduced secondary spend. 22

25 ECONOMIC IMPACT OF BRITISH RACING SECTION 3 Racegoers also bet with on-course rails and Tattersalls bookmakers, but no accurate figures for these amounts are available. Haydock Park Other commercial Other commercial revenue contains a diverse range of revenue streams including raceday activities such as racecards and advertising as well as the increasingly important non raceday activities. These other activities represent an average of 1m per racecourse and make a very significant contribution to the ongoing financial health of the racecourses. Racecourses can offer an attractive mixture of more intangible factors such as picturesque settings and history, backed by practical points such as good transport links and ample, free, parking. This package is increasingly being used by racecourses to turn them into 365 day a year businesses, utilising their substantial facilities outside of racedays. The availability of appropriate onsite accommodation can be a barrier to racecourses developing non raceday activities, hence several racecourses have either opened hotels or are developing them. The hosting of conferences, functions and exhibitions are typical non raceday activities, but other activities include golf courses, concerts, and car boot sales. Racecourses can tailor their offering according to their facilities and local markets. Costs Racecourses largest costs consist of prize money ( 106m in 2008 see Owners section), wages and salaries costs of 52m from its 2,700 FTE, integrity payments of 25m and a variety of operating costs including ongoing maintenance costs which are vital (and support capital expenditure) in ensuring a positive experience for racegoers. Racecourses, in common with other major sports, have experienced significant cost inflation in recent years. The impact a racecourse can make on the local economy is illustrated by Haydock Park, a popular urban course located in Newton-le-Willows in the borough of St Helens in the North West of England. In a typical year it attracts around 200,000 visitors to Flat and Jump racing, predominantly from Liverpool, Manchester, Warrington and St Helens. Its core market lives within a 30 minute drive. Haydock is one of the busiest racecourses in the country, with around 30 days of racing each year with average attendances of almost 7,000 and over 15,000 on its busiest days. Haydock has successfully hosted live music after race meetings which has attracted new people to Racing. The racecourse also holds around 1,000 non raceday events a year. It has a diverse and busy calendar of non raceday events, ranging from small to medium sized events to multi day conferences. It benefits from a strong relationship with the local authority, one of its key non raceday customers, attracting approximately 100,000 non raceday visitors in total. Combining raceday and non raceday activities, Haydock s total annual attendance is around 300,000. It is estimated that 5-10% of racegoers will stay overnight, supporting local hotels and restaurants. The associated total direct expenditure it generates for the locality, including money spent with local travel companies, hotels, bars, restaurants and construction companies, is estimated to be at least 15 million. The racecourse is therefore important to the local economy and is a significant local employer, providing 70 direct permanent jobs and, including catering staff, employing 650 (via various contractors, including catering, security and tote) temporary raceday employees. On its busiest fixture it is estimated that over 700 people are employed. Haydock Park Annual racedays c.30 Non raceday events 1,000 Permanent employees 70 Raceday staff 650 Raceday attendance 200,000 Non raceday attendance 100,000 Direct expenditure 15m Since 2002 Haydock has invested over 2m in spectator facilities, including a redevelopment of the County Stand. A project to build a new track is ongoing, with completion due by In keeping with its local course status, one of Haydock s aims is to use local construction companies and suppliers. 23
26 Attendances and racegoers The 60 racecourses staged 1,423 fixtures in 2008 (with racing taking place on 362 days of the year), attracting combined attendances of 5.7m, equating to an average meeting attendance of 4,029. After football, horseracing attracts the highest total attendances of any sport in Britain, aided by its year round nature. Figure 13 shows total attendances for Jump and Flat fixtures and average attendance from 2002 to Figure 12: Day by day comparison of racing attendances 2005 and s 2,000 1, ,913 1,949 1,232 1, Monday Tuesday Wednesday Thursday Friday Saturday Sunday Having averaged around 4m throughout the 1980s, horseracing attendances rose to a peak of over 6m in Total attendances have since weakened to 5.7m over the four years to However 2007 and 2008 were respectively the wettest and seventh wettest summers since records began, which inevitably impacted overall attendances through both abandonments and reducing spectator numbers. Flat racing attracted 3.6m attendees in 2008 with 2.1m visitors to Jump racing, the difference is due to the number of each type of fixture. Jump fixtures recorded marginally higher average attendances (4,115 versus 3,982 respectively). Day by day comparison of racing attendances in 2008 As shown by Figure 12 above, the average attendance at race meetings broadly increases as the week progresses, with weekend racing attracting the largest crowds. In recent years there has been a marked shift in the pattern of weekly racing attendances as Figure 12 illustrates by contrasting 2008 with Whilst mid m 000s , ,799 4,934 4, , , ,377 Average attendance 3,137 2,211 Source: BHA; Deloitte analysis ,376 2,848 2,367 Figure 13: Total and average racing attendances in Britain 2002 to ,029 1,158 1,220 1,299 1,300 1,342 1,330 1,423 3,497 2,298 4,500 4,250 4,000 3,757 3,323 5,269 5,244 7,033 7,191 4,942 4,013 week racing attendances have decreased, more people now attend weekend fixtures. The most notable increase was Friday attendances, which have risen by 247,000 (25%) since In 2008 the lowest average attendances were on Mondays, Tuesdays and Wednesdays, with an average attendance of 2,292 over these days. In total 3.7m attended on either Friday, Saturday or Sunday, 65% of total attendances from just 44% (642) of the fixtures. The highest average attendance of 7,191 is on Saturday, representing a 2% increase since The implication for Racing is that to maximise its value it must continue to focus on attracting high weekend crowds. However, that shouldn t preclude midweek fixtures being marketed to these social groups with more leisure time such as the growing grey market. Flat Jump Number of fixtures Average attendance per fixture Note: Total attendances for Flat racing in each year include a very small proportion of attendances for mixed meetings or both Flat and Jump. Source: BHA; Deloitte analysis. 24
27 ECONOMIC IMPACT OF BRITISH RACING SECTION 3 Attendances by region Figure 14: Attendances by region 2008 Scotland 15% 18% 5% 5% London and South East Midlands, East Anglia and Wales Source: Management information. 25% 32% North Yorkshire South West Figure 14 shows the regional spread of attendances for While Racing has a national footprint there are some areas of particularly intense activity. The five Scottish and nine Yorkshire racecourses generated attendances of over 300,000 and 600,000 respectively, illustrating the popularity of racing in these regions. Scottish Racing and Go Racing in Yorkshire help co-ordinate and market racing in the areas. Racegoers around London are particularly well catered for with typically at least one high quality fixture staged every weekend of the year. In 2008, Ascot had the highest total annual attendances (574,880). Cheltenham (367,466) and Newmarket (355,287) were respectively the busiest exclusive Jump and Flat courses. Racing s diversity British Racing has a huge spread of attendances from iconic fixtures firmly established in the public conscience, the wider sporting calendar and indeed social calendar, to much smaller, locally focused fixtures. Figure 15: Top 10 meeting attendances in 2008 Rank Event (days) Total 1 Royal Ascot (5) 287,876 2 Cheltenham Festival (3) A 177,501 3 Epsom Derby (2) B 160,000 4 Aintree Grand National (3) 144,826 5 Glorious Goodwood (5) 102,068 6 Cheltenham Open (3) 70,024 7 Chester May (3) 63,840 8 Doncaster St Leger (4) 57,263 9 Ascot King George (3) 56, York John Smith s (2) 46,762 Note A: Cheltenham Festival Wednesday was abandoned owing to high winds. York Ebor meeting which was abandoned, attracted 70,000 from three days in Note B: Includes an estimated 100,000 attendees on the Hill who pay limited admission fees. Source: HBLB; Deloitte analysis. The top ten race meetings in 2008 attracted 1.1m attendees, and as shown on page 38 represent some of the highest attended sporting events in the country. Once abandonments and transfers are adjusted for, attendances at these flagship events have increased since 2005 emphasising their enduring popularity. Whilst certain major race meetings attract the largest crowds, Racing also appeals to a broad segment of the population throughout the country, with even relatively small weekday regional fixtures regularly attracting over 1,000 people, predominantly from local communities. The most recent attendances data show that Racing s attendances are holding up reasonably well in the downturn; while attendances in the first six months of 2009 are 3% down in total, compared with the equivalent period in 2008 (and just 1.1% on average), this is a lower decline than many leisure activities have suffered. Profile of racegoers Racing has a relatively small core of high frequency racegoers that is responsible for around half total attendances. For them the racing itself is typically central to the raceday experience. However, for many other less frequent racegoers, while racing is a part of the attraction, it is just one of many factors involved. Racing has acknowledged the need to expand its appeal to a wider demographic through the development of mixed entertainment and racing events discussed below, but also through the root and branch rebranding exercise being led by Racing Enterprises. The combination of music and racing has been particularly successful. Well over 250,000 people attended fixtures with a significant music element in Newmarket s Friday nights were visited by 125,000 and are well established in the social calendar. Many more recent music events at other racecourses are also popular. Ladies days and nights are extremely popular and vary from those with national significance (Royal Ascot), regionally (the Friday at Aintree s Grand National meeting) and the numerous more local events that take place. The future The extremely competitive nature of the leisure market means racecourses will have to continue to find new blends of Racing and entertainment to complement their core racing product. There is evidence this is happening but more can be done, including an increased understanding of their existing and potential customers requirements to enable tailored offerings to be created. 25

28 26
29 ECONOMIC IMPACT OF BRITISH RACING SECTION 3 Owners Racehorse owners are the single biggest contributors to the funding of British Racing through both their purchase of horses from breeders, and ongoing training and racing expenditure paid to trainers and jockeys and supporting industries such as vets, farriers and horse transport companies. Including horse purchases, and net of prize money receipts their investment is estimated to have exceeded 430m in 2008 (excluding Point-to-Point horses). Figure 16: Horses in training and number of owners 2001 to 2008 Number of horses in training 000s 16,000 12,000 8,000 4,000 13,510 13,183 13,292 4,647 4,460 4,276 14,129 4,399 14,568 14,501 4,377 4,419 15,083 15,349 4,393 4,272 2,133 2,293 1,505 1,730 1,854 1,318 1,248 1,333 7,545 7,475 7,683 8,225 8,461 8,228 8,557 8,784 A large proportion of this expenditure is injected into the rural economy ,164 8,898 8,949 9,266 9,403 9,329 9,551 9,539 This section first considers the contribution of owners by examining the number of horses in training and owners in the industry both considered key barometers of the health of the Racing industry. In addition it considers the level of prize money paid by British Racing as, while financial return is not the main driver of horse ownership, the possibility of a return on their outlay for a successful horse is nonetheless important. Figure 16 shows how both numbers of horses and owners have grown to record levels since The relatively high costs of keeping a horse in training (as discussed later) has led to a variety of ownership models which reduce the cost per individual, thus making ownership accessible for many more people. Of the near record 9,539 owners (2007 9,551) with horses in training in 2008, only 2,545 (27%) owned horse(s) individually. The remaining 6,994 (73%) therefore engaged in some sort of shared ownership arrangement including racing partnerships or through companies. These ownership figures do not fully reflect the number of individual part owners involved in syndicates and racing clubs. If these were added the number participating in racing would be significantly higher. For example, the Elite Racing Club has over Flat Mix Jump 13,000 members. In total around 40,000 individuals are estimated to have an involvement in horse ownership in some way. In 2008 there were an average of 15,349 horses in training, up 16% from 2002 (5% from 2005). The majority (c.80% in 2008) of owners are involved in ownership of 1-2 horses. However, at the other end of the spectrum the number of owners with a string of 21 or more has increased markedly from 64 in 2006 to 92 in April Many of these owners are overseas nationals and by this route inject substantial funds into British Racing and the British economy. Total number of owners with a horse in training Note: Horses in training and owners represents the monthly averages during the year. Source: BHA; Deloitte analysis. Around 40,000 individuals are estimated to have an involvement in horse ownership in some way. While the accepted measure of the number of racehorses in the industry is the average number of horses declared as being in training during the year, this average is significantly less than the number of horses in training at some point in the year. Weatherbys have estimated that for 2008 over 25,000 horses were in training at some point (excluding c.3,750 registered as privately trained hunters many of which only ran in Point-to-Points). Over 18,000 British trained horses actually ran in There are numerous reasons for the significant difference between the two measures including: young horses, particularly two year olds, at the early stage of their training but with no immediate racing plans; injured horses; and the natural flow of horses into and out of the industry due to retirements etc. Figure 17 overleaf sets out the estimated average cost of horses in training split by code, together with the total expenditure and amounts recouped by owners. 27

30 OWNERS Figure 17: Average owners operating expenditure per horse 2008 Average spend per horse Flat Jumps Basic training fees (including gallops) 12,818 11,488 Vets, medical and farriers 1,651 1,717 Transport and racing expenses 1,581 1,385 Sub total 16,050 14,590 BHA Registration and entry fees Jockey fees Race entry Insurance Total owners expenditure on training 18,501 16,717 Note: Majority of dual code horses included under Jumps. Adjustments have been made to several cost categories from the ROA survey results to reflect available 2008 industry data. Cost inflation of 3% has been assumed for 2008 in the absence of specific data. Keep costs are not included. Figure 18: Total owners operating expenditure on horses Total expenditure m m Basic training fees (including gallops) Vets, medical and farriers Transport and racing expenses Sub total BHA Registration and entry fees 6 6 Jockey fees Race entry Insurance 7 10 Total owners expenditure on training Keep costs Total owners expenditure Source: BHA; ROA Owners survey; Deloitte estimates. The average ownership costs shown in Figure 17 above are based on a sample of horses of which the vast majority raced in the year and a large majority more than once. It does not therefore reflect the cost of those 7,000 horses (excluding hunters) who, while in training at some point, did not run, which would be expected to be much lower. In total owners are estimated to have incurred costs of 332m for horses in training the majority from training fees of 238m but with additional costs arising from vets and farriers, transport, race entry and BHA registration fees, jockey costs and insurance. The estimated 70m increase in net owners expenditure since 2005 is primarily a function of: the availability of more detailed information on horses in training which facilitated a more accurate estimate of training fees than in 2005, which was acknowledged as a prudent estimate. There are significant regional variations in training fees with the highest fees in Newmarket and then Lambourn. In some regions average basic training fees (including gallops) are less than 9,000, compared with 17,000 in Newmarket. Income Owners prize money Sponsorship 7 7 Net owners expenditure Source: BHA; ROA Owners survey; Deloitte estimates. stables, livery yards, studs etc where they incur keep costs again borne by the owner. Once these keep costs are added to costs of horses in training, owners gross costs are estimated to be about 350m. an increase in horses in training of 5.4% (based on average horses in training); estimated training fees inflation of 3% p.a. as trainers passed on higher operating costs, with higher increases for some expenditure, notably transport; and The costs of a horse not in training are usually lower than when in training, although they can still be significant. The horses are either kept at trainers yards with the basic costs of feeding and bedding plus any veterinary costs passed on to the owner, or sent to other 28

31 ECONOMIC IMPACT OF BRITISH RACING SECTION 3 Figure 19: Prize money by source 2002 to 2008 m HBLB BHB/BHA Source: BHA; Deloitte analysis Owners Sponsors Prize money As Figure 19 shows, record prize money of 106m was paid in 2008, and over the last five years has been around 100m per year. Owners receive c.80% of total prize money ( 85m for 2008). The majority of prize money ( 59m in 2008) is provided by the Levy Board and BHA but racecourses contributed 30m including amounts passed on from sponsorship contributions and owners paid 17m in entry fees. Prize money therefore enabled owners to recoup 24% of their gross expenditure Racecourses Once owners sponsorship of 7m is added this means on average owners recovered 26% of their outlay (excluding horse purchases). The average runner in British races won 1,084 in total prize money in 2008 (c.80% of which goes to owners). This statistic has been in a narrow range of 1,050-1,090 since It is widely acknowledged that the cost of owning racehorses in Britain is greater than in many other major Racing nations. The gross cost per run is over 3,500 (net c. 2,700 after owners prize money). Prize money to costs ratios are therefore much lower. The unique nature of British Racing explains a significant proportion of the additional costs. Notably, horses are typically trained some distance from the racecourses, rather than at the racecourse as in other countries. However while this leads to higher cost it does offer owners much more varied racing and locations, adding to the thrill of ownership Owners injected more than 430m into Racing in 2008 much of it directly into the rural economy. Horse purchases The cost of acquiring horses has been excluded from the analysis due to a lack of robust information on the buying and selling of horses. However, this cost does represent a significant further injection of funds into Racing by owners. By way of illustration the average cost of horses sold at the two principal auction firms in Britain Tattersalls and Doncaster Bloodstock Sales in 2008 was c. 28,000. Owners may recoup some of this expenditure from subsequent sales. The expenditure relating to the purchase of horses has been incorporated indirectly via the expenditure of British breeders. Once this 182m breeders expenditure is added to the net 255m costs discussed here, owners injected more than 430m into Racing in Looking forward Levels of ownership have declined marginally in 2009 owing to the economic climate. However, owners, trainers and breeders are working closely together to devise ways of cushioning the downturn s impact, initiatives such as the ROA/TBA racehorse leasing scheme have already proved popular. 29

32 Trainers There were 592 licensed trainers in Britain with horses in training in 2008, with a further 126 permit holders and 276 trainers of hunter chasers. The scale of training yards varies very significantly as illustrated by Figure 20. The smallest 320 yards trained c.2,000-3,000 horses in 2008, meaning the remaining c.12,500-13,500 of the average number of horses in training came from the other 272 yards. The total number of licensed trainers has increased steadily from 500 in 1993 to 592 in The majority of the growth has been seen at the top and bottom end in terms of horses in training. The number of yards with more than 41 horses has grown by around a third between 2001 and 2008 to 102 (of which 25 yards had more than 100 horses in training). There has been a marked growth at the smaller end since 2001, although this growth has slowed somewhat between 2005 and 2008 (320 from 306 yards). While larger trainers benefit from the number of horses, and often an ability to attract the bigger spending owners and hence generally better horses, smaller trainers do still regularly achieve big race wins. Hence while challenging for new trainers to establish themselves there is certainly the potential to move up the training pyramid or indeed to succeed as a more niche trainer specialising in a certain type of horse. Figure 20: Licensed trainers yards with horses in training 2001, 2005 and Source: BHA Number of trainers Total There has been a limited number of new yards coming on stream in recent years, with the usual route into training being to take over an existing yard as a trainer retires or leaves the sport. Nonetheless several new yards have been built. The planned development of smaller starter yards by Jockey Club Estates in Lambourn will also provide a stepping stone for new trainers entering the sport. Geographic spread Trainers are based throughout Britain but there are several areas with particularly high density of trainers notably Newmarket, Lambourn, Middleham and Malton. These areas have extensive training facilities both at individual trainers yards but also through public gallops. Here Racing is deeply ingrained in the local economy and accounts for a high proportion of local employment and expenditure. The Lambourn feature article in this section illustrates the importance Racing can have in a specific region Number of trainers Total Number of trainers Total Trainers revenues Trainers primary revenue source is the training fees paid by owners as discussed in the Owners section earlier. In addition trainers keep 7-8% of the prize money earned by the horses they train. Trainers stable staff also receive 5% of prize money, in aggregate equating to c. 14m divided amongst them in Many trainers also buy and sell horses, but no reliable data is available to accurately estimate the scale and value of this horse trading. Like prize money, though this can be an important source of revenue for trainers to supplement their basic training fees. Training fees have increased by an estimated 3% per annum since 2005 as operating costs and stable staff wages have increased

33 ECONOMIC IMPACT OF BRITISH RACING SECTION 3 Lambourn and the North Wessex Downs Trainers expenditure The methodology adopted to estimate the economic impact of Racing assumes the initial expenditure of training horses is incurred by the owners via the training fees paid to trainers. However trainers play an important role in both distributing the initial injection from the owners within the industry, and thereafter as the expenditure flows through the economy. Trainers largest item of expenditure is the wages and salaries of the c.5,600 full time and c.2,400 part time staff employees (including self employed and the trainers themselves), with employment levels varying from over 100 for some of the largest, often in Newmarket, yards to fewer than a dozen for the smaller yards. A framework of minimum wages and general working conditions is agreed annually between the National Trainers Federation and National Association of Stable Staff between the minimum rates (which vary by experience) increased by 3-5% per year (excluding 2% in 2008). The annual wages and salaries of yard employees and trainers, including social security payments, were estimated to be between m in These wages generate substantial additional expenditure with a large proportion of it spent in the local, often rural, economy. The wages generate an estimated 40m in annual employment taxes. Trainers other major expenditure items include veterinary and farriers fees, horse transportation and keep fees. Again, the local economy benefits from this expenditure. Trainers have also invested significantly in maintaining and improving their training facilities over the last five years. Including public training facilities, notably at Newmarket and Lambourn, this expenditure is estimated at 60m over the last four years. Lambourn is an internationally renowned horseracing centre in Berkshire, home to around 10% of Britain s racehorse trainers. It forms one of four main clusters of businesses associated with racing in the North Wessex Downs area, alongside East Ilsley, Hungerford and Marlborough. The North Wessex Downs is a sparsely populated rural area. Of its population of 125,000, approximately two thirds work in the surrounding urban areas, yet only 5% of the economically active population is directly employed in agriculture through farming. The contribution of the core Racing industry to the area is therefore extremely important and Racing is firmly embedded in the community. The table below illustrates the scale of the Racing industry. The impact of Racing on the North Wessex Downs area Horses in training or at studs 3,500 Direct racing employment 1 1,438 Owner expenditure on horses trained in North Wessex Downs 35m Note 1: Direct racing employment comprises trainers, studs and supporting businesses. Source: RICS Rural Research Conference The Lambourn area is predominantly a training area but there are also major stud farms and stables located throughout the region. Across the North Wessex Downs there are over 3,500 horses at training yards and stud farms, which represents over 10% of the total in Britain in To support the trainers, many other equine focused businesses are located in the area, including farriers, large veterinary practices, horse feed merchants and a major racehorse transport company. It is estimated that there are over 100 core racing businesses in the North Wessex Downs which in total directly employ over 1,400 people. The region benefits from the injection of substantial owners expenditure on the c.2,000 horses in training. Over 35m of training fees and associated costs flows into the economy each year, a large proportion of which is paid first to trainers before being recycled throughout the economy as secondary expenditure supporting local businesses. The impact at a local level is most obvious in the Lambourn cluster. The 1,400 Racing workers comprise over 20% of all employment in agriculture, community and social and personal service activities across the North Wessex Downs. In 2005 Jockey Club Estates acquired the Lambourn gallops and have since invested 3m in upgrading the facilities. The investment has helped cement Lambourn s position as a major Racing centre with significant recent increases in both the number horses using the gallops and the number of winners of British races. Racing is not only a vital contributor to the region s economy, supporting the livelihood of those who work in and around it; it also plays an important social role. The Lambourn Open Day attracts over 10,000 visitors to the trainers yards and surrounding areas, illustrating the broad appeal of Racing in the region. From an environmental perspective too, Racing is important. The North Wessex Downs is an Area of Outstanding Natural Beauty and the maintenance of the gallops is likely to have encouraged biodiversity in the area. Whilst modern artificial gallops that do not require free draining grassland have been used elsewhere, the Lambourn area s rich history as a training centre ensures that it will remain at the heart for British horseracing for many generations to come. 31
34 Breeders Breeding industry The thoroughbred breeding industry is the first link in the many chains of Racing. As such the British breeding industry is a major contributor to the current, and future, overall health of British Racing. The British breeding industry is complex and diverse, and a major global player. In 2008 nearly 6,000 foals were produced from Britain s 10,740 active broodmares, the sixth highest total in the world, based on 2007 comparatives. The industry ranges from an estimated 300 full time stud farms who typically have both mares and stallions standing, to the c.4,400 breeders who exclusively own broodmares. Broodmare only breeders are typically parttime and their breeding activities often form part of a farming business. The majority (c.3,800) own one or two broodmares who are often boarded at other studs. Figure 21 below sets out the number of stallions, broodmares and foals born in Britain in 2005 and Figure 21: British based bloodstock Stallions Active broodmares 11,947 10,740 British foals born 5,727 5,920 Source: Thoroughbred Breeders Association. Over the last ten years the breeding sector has seen an increased concentration of mares and stallions at a relatively small number of studs. The fact that 27 operations own more than 20 broodmares illustrates this point. Figure 22: Value and average price of horses sold at Tattersalls and Doncaster Bloodstock Sales British public auctions 2002 to 2008 Total sales m Tattersalls total sales Doncaster total sales Source: Tattersalls; Doncaster Bloodstock sales Tattersalls average sales price Doncaster average sales price Breeding industry revenue The breeding industry generates revenue primarily through the sale of horses. Individually breeders will also generate revenue from nomination fees, keep fees, etc but these are largely internal to the industry as they are the expenditure of other breeders or trainers. Although overseas mares being covered in Britain would represent economic benefit to the British breeding industry, comprehensive figures for this are not available. Horses are sold through public auctions or via private sales, with the majority of yearlings sold via public auction in Britain through Tattersalls and Doncaster Bloodstock Sales, both internationally renown and major investors in British Racing. The volume and average price of horses sold at public auctions is regarded as a key indicator of the health of the breeding industry, but also of the wider Racing industry Figure 22 above plots both measures between 2002 to s Average sale price Between 2002 and 2007 the aggregate value of public sales increased by over 80% from 164m to a record 302m. The increase was driven by a combination of higher volumes (32% up for Tattersalls to 5,064 in 2007) and average price (up 38% for Tattersalls). These increases reflected the global boom in bloodstock markets. Bloodstock purchases are typically a high value purchase, and often for leisure purposes, hence are vulnerable to economic conditions. Therefore the global economic downturn has resulted in bloodstock values falling markedly. In 2008 British public sales declined to 212m although this is still higher than 2004 values through lower prices and more unsold horses. Further falls have occurred in the first half of The figures above are for all sales conducted at those auctions. It includes overseas horses sold in Britain. Irish horses are a particularly significant element but Irish and British vendors are not separately identified by the auction houses. In addition 32

35 ECONOMIC IMPACT OF BRITISH RACING SECTION 3 In 2008 nearly 6,000 foals were produced from Britain s 10,740 active broodmares, the sixth highest total in the world. to public sales, a much lower volume of private sales occur. These sales are typically for much higher values with the horses sold a mixture of yearlings and older horses it is not possible to accurately estimate the total values of such sales but the practice is thought to have declined in recent years. A number of the largest studs notably Darley and Shadwell transfer the majority of their production straight to their respective owners and trainers home breeding their racehorses. These operations produce large volumes of high quality horses each year and have invested heavily in their top class facilities and bloodstock. Given the combination of lack of country specific vendor data for breeder public sales, private sales and the importance of home bred racehorses, the economic impact of the breeding sector has been estimated by building up breeders expenditure rather than using sales values. Breeders expenditure As Figure 23 sets out, total expenditure by breeders was estimated at 202m in The labour intensive nature of studs means the largest cost is wages and salaries with an estimated 113m total cost in The breeding sector therefore pays around 30m in employee and employer taxes each year. Breeders also incur significant equine related expenditure on veterinary costs, farriers, feed and to a lesser extent horse transport. Figure 23: Breeders expenditure and employment Source: Thoroughbred Breeders Association. m Wage costs 113 Transport 7 Vets, medical & farriers 27 Other operating costs 35 Annual maintenance/ 20 capital spend Total annual expenditure 202 Employment Full time 4,000 Part time (1/10 time spent) 5,000 Total (FTE) 4,500 The estimated 20m annual maintenance /capital spend reflects the costs of building and maintaining high quality horse boxes, fencing and ancillary buildings. It does not reflect bloodstock investment or the sale of studs. The Thoroughbred Breeders Association ( TBA ) estimate the capital value of studs, excluding bloodstock, to be 20 billion. The TBA estimate that there are 4,000 full time employees in the industry. The number at each stud will vary with over 100 at the larger studs. For example Darley Stud has 250 in Newmarket alone, to a much lower number at the smallest operations. The 5,000 part time employees includes the owners of broodmares who often fit their breeding activities round their main job, but nonetheless play a vital role. 33

36 Betting Overview Until the 1990s horseracing, together with greyhound racing, supplied almost all bookmakers betting product. However since then betting operators in what was already one of the most liberal markets anywhere in the world have been able to develop a diverse portfolio of products including sports betting (particularly football), numbers games, virtual racing and crucially highly profitable Fixed Odds Betting Terminals ( FOBTs ), as well as online. There is a continuing trend of consolidation in the traditional high-street shop (LBO) business, with the estate much changed from a few years ago. Figure 24: Levy receipts by source 2001/ /09 m Retail / /03 Telephones Internet Betting exchanges Other / / / / / /09 A Note A: Includes 1.4m discretionary payments from offshore betting internet operators which has been classified within betting exchanges as primarily from Betfair. Levy receipts represent year to March in all cases. Source: Levy Board; Company/group financial statements; Deloitte analysis As a result, the British betting industry is the most diverse in the world, with a mix of fixed odds, pool and spread betting, together with betting exchanges. The competitive nature of the British betting industry results in the highest return to stakes bet by horseracing punters of any major betting country. The combination of these and the changing tax regime in 2001 (a shift to 15% gross profits tax from a tax on turnover), has fuelled a very substantial increase in both betting turnover and betting operators profits. Meanwhile, in a time of general shift in business online and considerable investment by traditional bookmakers, the impact of exchange betting has yet to be fully assessed. Betfair, the leading betting exchange, has reported revenue growth from 107m in 2005 to 240m in The betting industry has historically been resilient to economic downturns. The evidence from 2008, and first half of 2009 indicates that this resilience may not be as strong as that historically experienced in the face of the deep recession. This is also the first such test for the new diverse gambling industry. Racing s income from betting Levy Racing generates a large majority of its direct revenue from betting via the 10% (with some exceptions) statutory Levy on British betting operators gross win from British Racing. The majority of Levy receipts is allocated to fund either prize money or integrity services. Racecourses revenue from on-course betting is discussed on page 22. Since the change in the tax regime aggregate Levy receipts have, until 2008/09, typically been in the m range but as Figure 24 illustrates this masks several trends: a gradual decline in traditional shop receipts; fluctuations in telephone receipts as a product of being the channel by which high rollers bet; a shift to internet channels including those offshore; and the growth in exchange betting receipts (although still relatively small in absolute terms in large part due to the levy being applied to the 1.5-5% commission applied to winning bets). Betting operators in part attributed the record 115m levy receipts in 2007/08, to 16m of receipts derived from profits from big staking high rollers (predominantly attributed to customers of Ladbrokes). The marked fall from the record 115m levy in 2007/08 to 93m (including a voluntary contribution of 1.6m from offshore operators) in 2008/09 is a concern for British Racing. The gradual increase of the gross profits threshold for individual LBOs under which abated levy charges of less than 10% are applied has also had an impact. The actual levy percentage realised from LBOs is now close to 9%. Several former British based internet sportsbook operators moved offshore and in turn ceased paying the levy (and gross profits tax) which contributed to the decline. Others are reported to be threatening the same.
37 ECONOMIC IMPACT OF BRITISH RACING SECTION 3 Figure 25: British Betting Industry Gross win by type m 4,000 3,000 2,000 1,000 2, /03 2,551 1,153 1,119 1,077 1, /04 2,953 Horseracing1 Other betting 2 3,135 3,235 3,626 3,601 1, / / / / /09 42% 45% 38% 34% 33% 34% 28% British Racing s percentage of gross win 1,010 CAGR 2002/ / % 14.2% (other betting) Note 1: British Racing gross win includes betting exchange commissions, typically 1.5-5%, on winning bets and which has grown from 23m in 2002/03 to 76m in 2008/09. Note 2: Excludes online casino and poker and offshore sportsbook. Source: HM Revenue and Customs; Company/group financial statements; Deloitte analysis. 2.8% against an efficient negotiation between the Racing and Betting industries, and hence in need of major reform or replacement. Regardless, there is a strong desire in the Racing industry to develop commercial partnerships with the betting industry. A frustration is that operators are not competing on content, with the innovation that creates between sports and their partners. There is a drive to attract the flutterer, to create understandable exotic bets. (i.e. low stakes but potential high returns) that appeal to a broader demographic than traditional punters. The development of new bets must complement more effective promotion of horseracing as an exciting sport to bet on with the betting industry working closely with the Racing industry. Racing s proportion of betting industry s gross win Figure 25 sets out the estimated total gross win of betting operators from British Racing and total from all betting, and the proportion derived from British Racing over the seven years to March Since 2003/04 the betting industry s gross win from British Racing has been over 1 billion each year, and reached a peak of 1.2 billion in 2007/08. This fell back to 1 billion in 2008/09. The Betting industry has generated over 5.5 billion in gross win from British Racing over the last five years to 2008/09, of which 513m was paid to Racing via the Levy. Total betting gross win has experienced a period of prolonged growth throughout the current decade with a 1.6 billion (78%) increase between 2002/03 and 2008/09. While horseracing gross win has grown in absolute terms until 2008/09, the drivers of the growth has been the explosion of FOBTs and, to a lesser extent, non racing sports betting. FOBTs are highly profitable and unlike Racing, and other sports, have predictable returns in the region of 2%. From their introduction to LBOs in 2002 the gross win generated from FOBTs is now greater than that generated by British Racing. While British Racing remains the single biggest sports betting product of bookmakers, and the reason many people visit betting shops, its relative share of gross win has declined from 45% in 2003/04 to less than 30% in 2008/09. Challenges The marked decline in gross win from British Racing in 2008/09, and hence the Levy generated, is reflective of a number of trends which are currently against Racing notably an ageing demographic, a shift to other betting products (which is typically beneficial to betting operators given the higher and/or more predictable returns of other betting products) and the continued movement offshore of former British betting operators. Racing continues to argue that it does not receive an adequate or fair return from the betting industry given the value of its product. Furthermore, the current structure of the Levy (itself a product of 1960 s legislation) is seen by Racing as working There is also pressure from Racing, and elements of the Betting industry, to address the perceived unfair competitive advantage offshore operators have by avoiding a cumulative 25% tax/levy on gross win. Looking outside the UK, the international reputation of the British Racing, as the highest quality and most diverse in the world, provides an opportunity to grow the existing relatively small revenues from overseas bettors. Currently over 200m of overseas betting turnover is generated through a combination of overseas betting feeding into the Tote s pools and At The Races and Racing UK s international revenues which are driven by betting activity. While progress has been slower than hoped there remains the opportunity to significantly grow this revenue if it could be broadcast to a wider international market. 35
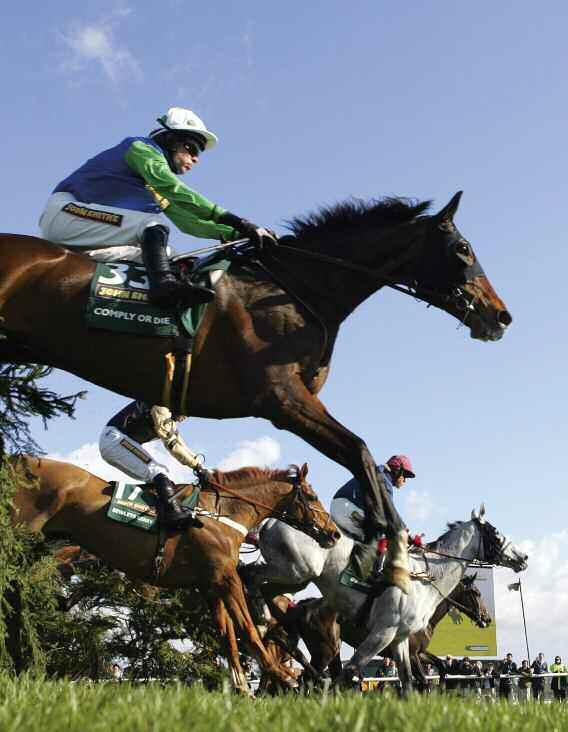
38 36

39 ECONOMIC IMPACT OF BRITISH RACING SECTION 3 Broadcasting Overview Broadcast coverage is a crucial shop window for sport, as it allows access to a greater proportion of the population than just racegoers. British Racing benefits from extensive broadcast coverage, through both terrestrial services BBC and Channel 4 and two dedicated racing channels, At The Races and Racing UK, which between them broadcast live every race staged in Britain. Racing therefore has the most broadcast time of any sport in Britain. Domestic average A total of 93 days racing (encompassing races from 201 individual fixtures) was broadcast on either the BBC or Channel 4 in The BBC will reduce its coverage from 2010 but Channel 4 coverage will continue and will take up most of those meetings the BBC is no longer televising. Viewing figures are typically in the range of m but are significantly higher for the biggest meetings as illustrated in Figure 26. The Grand National is consistently placed in the top 10 most viewed sports events in any given year often attracting more than 10m viewers (in 2008 from a 67% audience share). The two dedicated racing channels operate different business models, both of which were profitable in 2008 enabling them to pass substantial revenues on to their respective racecourse partners. The Grand National is consistently placed in the top ten most viewed sports events in any given year often attracting more than 10m viewers. Figure 26: Broadcast audiences for key meetings 2004 to 2008 m Grand National Derby Source: BARB; Deloitte analysis Royal Ascot (Ladies day) Cheltenham Festival (Gold Cup) At The Races is a free satellite/cable channel which has over 1.5m individual viewers per month from a potential base of 13m homes. It broadcasts races from 30 racecourses in Britain as well as races from Ireland and overseas, televising more than 1,100 British and Irish meetings in Racing UK is a subscription based channel which is owned by 30 racecourses. The channel had an estimated 51,000 residential subscribers in 2008 (up from 36,000 in 2006). Many commercial premises also regularly show Racing UK with over 2,300 such subscribers. Racing UK was part of the Setanta Sports package until Setanta entered Administration in June 2009 and ceased broadcasting. It has now reverted to a stand alone subscription model. Racing fans now also have the option of watching races live online with At The Races and Racing UK, who are both building an associated range of interactive and betting services. International reach The reputation and quality of British Racing is demonstrated by its global broadcasting reach. Both At The Races and Racing UK product is broadcast to over 20 countries, with new territories being added each year. The broadcast pictures facilitate increased overseas betting revenue which, while still relatively small in comparison with British betting levels, is steadily growing with overseas revenues of over 10m shared between the channels in 2008 from over 200m of overseas bets placed on British racing. British Racing s biggest occasions have a global eminence, with the Grand National viewed by over 500m people worldwide. Major British meetings, such as Royal Ascot, are becoming ever more international with runners and winners from Australia, USA, Hong Kong and South Africa. This international dimension should increase its global racing presence further still. Whilst the picture for horseracing broadcasting is relatively complex, it remains not only a key promotional tool for the sport, but a platform for reaching existing and new customers with significant opportunities for further developing the horseracing product. 37
40 International comparisons British Racing is highly regarded on the global stage. This section compares and contrasts British Racing with many of its main competitors by examining the quality and quantity of racehorses, attendance levels and betting turnover. Quality of racehorses Figure 27: Top international classified Flat thoroughbred racehorses by training location % 9% 14% 3% 30% Figure 28: Top International Flat races 2006 to 2008 Rank Race Racecourse Country 1 Breeders Cup Classic Santa Anita USA 2 Arc de Triomphe Longchamp France 3 International Stakes York Britain 4 Prince of Wales s Stakes Ascot Britain 5 King George VI and Queen Elizabeth Stakes Ascot Britain 6 Queen Elizabeth II Stakes Ascot Britain 7 = Japan Cup Tokyo Japan 7 = 2000 Guineas Newmarket Britain 9 = Irish Champion Stakes Leopardstown Ireland 9 = Champion Stakes Newmarket Britain 11 Derby Epsom Downs Britain 12 Moulin De Longchamp Longchamp France Note: Compiled annually, based on a rolling three-year average of ratings of the first four finishers in each race according to the World Thoroughbred Racehorse Rankings. Source: International Federation of Horseracing Authorities ( IFHA ). Britain provided around 16% of the world s top ranked Flat thoroughbred racehorses in 2008 the highest after the USA. In the last five years horses trained in Britain won 52m in overseas prize money, compared with 31m won in Britain by overseas trained horses (including Irish). Attracting the best Britain stages many of the world s top Flat races as illustrated in Figure 28. Seven of the top 12 races, based on the rating of the horses running in them, were staged in Britain in 2008 across four racecourses. Britain, along with Ireland, is the dominant global force in Jump racing. The Cheltenham Festival is the undisputed Olympics of Jump racing, and the Grand National is arguably the world s most famous race. 38 USA Japan 9% Britain 12% Source: IFHA; Deloitte analysis. 16% Australia France Ireland UAE Other Cultural, structural and intangible factors British Racing benefits from a variety of intangible factors which, although not quantifiable, are almost universally accepted as key elements in Racing s prosperity. Owning a racehorse in Britain has an aspirational element to it. The continued association of the monarchy with Racing (for example, Royal Ascot) is indicative of the relatively high social standing that the sport commands. Unlike in some international racing countries, ownership is a respected recreational activity. Another factor that adds to the appeal of British Racing is the variety of races, from major courses of international renown such as Ascot and Aintree to small rural courses. Britain s racecourses are unrivalled globally in terms of their diversity, with each having its own distinct character and features. Racing in Britain is accessible to all and enjoys a reputation for both high quality sport and good value entertainment. Figure 29 across compares British Racing with other major racing nations by looking at three key measures: betting turnover demonstrating the attractiveness of racing as a betting product; number of different runners; and racecourses attendances an indicator of the popularity of racing as a spectator sport. More people attend Racing in Britain than in any other country except the USA and Japan. Average attendances at British fixtures are similar to those in Ireland and are higher than anywhere outside Asia. Global racing attendances have suffered major declines in recent years most pronounced in Asia but also felt elsewhere. The increased betting options, diverse leisure offerings and a failure of Racing to engage with new young racegoers are common issues. Britain s limited declines since 2004 (following a period of sustained growth), has been much shallower than in many countries but nonetheless an issue British Racing must actively seek to address.
41 ECONOMIC IMPACT OF BRITISH RACING SECTION 4 Figure 29: Leading horseracing nations betting, horses and attendances Betting turnover m 15,000 Japan 12,000 Britain 9,000 USA 6,000 France Australia 3,000 Ireland ,000 40,000 60,000 80,000 Number of different runners Note: Attendance data are for 2008 when available or estimates if not. All other data is for Bubble size represents aggregate attendance. Source: Horseracing Ireland; IFHA; Japan Racing Association; Deloitte Analysis. Figure 30: Leading horseracing nations betting turnover and returns to the racing industry Country Total Return % betting to on horse racing racing industry m m Japan 13, Britain 2 12, USA 7, France 3 6, Hong Kong 4, Note 1: Based on 2007 for all countries and using exchange rates as at 31 December Note 2: Consists of estimated levy for calendar year 2007 and commission paid by the tote to racecourses for on-course activities. Note 3: Includes betting on trotting races which is significant. Source: IFHA; Deloitte analysis. Betting on Racing As Figures 29 and 30 show, Britain s absolute betting levels on Racing rank second only to Japan in the world s leading horserace betting markets. It is well ahead of a number of significantly larger markets by adult population. In terms of average betting turnover per adult British Racing is ranked fourth behind, Australia and Ireland and Hong Kong. The gross win from British Racing has, until a fall in 2008/09, held up well in the last five years, in contrast to the declines, or stagnation at best, in many racing markets. Major racing nations are developing ways of promoting exotic bets with international appeal as part of their strategy to arrest the decline. Britain s alternative funding model Britain operates a different Racing funding model from many other countries, notably it has much lower receipts from betting. In Britain, only around a third of racecourses revenue is from betting, despite it generating the second highest betting turnover. Two thirds of revenue is derived from other sources, including admissions, catering, media, sponsorship and other commercial activities. This contrasts with the situation in many other countries, where income from betting forms the large majority of racing's revenue. The betting industry support primarily comes through distributions to racing from the respective national horseracing betting operator, which is almost always a monopoly pool betting operator. Figure 30 illustrates this point by comparing the absolute and percentage returns received by British Racing compared with other major racing nations. British Racing receives around 1% of horseracing betting turnover from British betting operators, compared with the much higher returns of other countries which are as high as 8% in the USA and France. Competitive pressures have led to reductions in take-out rates (i.e. amount not paid out in prize money) and hence returns to the respective racing industries in many countries such as Hong Kong, but even there rates paid to racing remain much higher than in Britain. British Racing has in effect been forced to develop a more diversified funding model. It is increasing placed at a major international disadvantage as it is not able to match the levels of prize money paid by some other countries. This situation risks being exacerbated if further declines in betting revenue paid to British Racing through the Levy are experienced. Racing is therefore considering all options, including a replacement to the Levy system, to arrest this decline. Summary Overall Racing in Britain enjoys a higher profile across all forms of media, and is better supported by racegoers and bettors than in many of the other leading horseracing countries. It already plays a valuable role in international racing but initiatives to increase this presence further are being developed such as Royal Ascot s ongoing recruitment of the world s top horses. 39

42 Rural context Horseracing is a significant contributor to the economic and social infrastructure of the rural economy in Britain as a whole, and makes an even more marked contribution to certain local economies. Employment The importance of Racing to the rural economy is illustrated by Figure 31 below. While naturally farming employs many more people, Racing s employment is still sizeable, and employs more people than forestry, logging and related service activities. These figures are combined national totals as noted below Racing has an even more significant impact on certain local areas of Britain. Figure 31: Employees in rural industries Figure 32: UK agricultural industry income trends 1973 to 2008 bn 10 Total income from farming Trend line 8 Rural economy sector Total employees 6 Farming 200,000 Horseracing 18,600 Forestry and primary wood 11,000 processing Source: DEFRA; Office of National Statistics; Deloitte analysis Note: Income represents business profits plus remuneration for work done by farm owners and other unpaid workers and is stated in real terms at 2008 prices. Unlike in many rural industries employment levels in Racing have increased in recent years. Levels of employment in farming have steadily declined, in part due to the falls in agricultural income which as shown in Figure 32 have fallen in real terms by more than half since The jobs Racing provides are therefore more valuable than ever. Source: DEFRA. Equine industry While the number of thoroughbred horses in training or breeding of c.40,000 represents a relatively small proportion of the total horse population of over 1m, thoroughbred horseracing acts as a valuable flagship for the wider equine industry. The most recent study of the equestrian industry, performed by the British Equestrian Trade Association in 2006, estimated the total expenditure within the equestrian industry to be 4.3 billion per annum including riding lessons and is driven by the over 700,000 horse owners and over 4m riders. Figure 33 across provides a snapshot of the scale of the industry through number of horse owners and riders. Furthermore over 500,000 hectares are dedicated to maintaining and producing horses. The 2.1m people who ride at least monthly (and many of the 2.2m more occasional riders) are almost certainly open to Racing involvement whether in ownership or going racing. The Racing industry already engages with many of these people, but is developing new schemes to build on this. 40
 Source: BETA National Equestrian Survey 2006.")
43 ECONOMIC IMPACT OF BRITISH RACING SECTION 5 Figure 33: Horse owners and riders m Point-to-Point Racing Number of horses 1.4 Number of owners 0.7 Population that rides once a month 2.1 Population that rides at least 2.2 once a year Total riders/annum 4.3 Land dedicated to horses 0.5 (million hectares) Source: BETA National Equestrian Survey The British Horse Industry Confederation has estimated that, excluding Racing, there are 24,000 businesses active in the equestrian industry (incorporating riding schools, farriers, livery yards, retailers and manufacturers of equestrian supplies), which employ almost 50,000 full time employees. A significant proportion of the these businesses and jobs are rural based. Once employment in the equestrian sector is added to Racing, it is the largest sporting employer in the country. The 2.1m people who ride at least monthly are almost certainly open to Racing involvement whether in ownership or going racing. The Racing industry already engages with many of these people, but is developing new schemes to build on this. Point-to-Point racing is an amateur form of Jump racing which provides an important link between grass roots horse racing and professional Jump racing and attracts over 600,000 attendees each year over the November to June season. It has a rich history dating back over 200 years and extends across Britain with over 200 fixtures held in a year across 117 courses spread across the country. Point-to-Point meetings are run by local Hunts or recognised Point-to-Point Clubs and by volunteers who give their time and energy for free. The volunteers are the cornerstone of Point-to-Point with up to 100 involved at each fixture. Meetings form an integral part of the local community. For Hunts and Clubs, Point-to-Points offer the opportunity to raise vital funds. Revenues are driven by attendances, with spectators attracted to local meetings for a low cost family day out, the opportunity to see thoroughbred horses up close and to experience the vibrant raceday experience. Bar and catering facilities, trade stands and various other entertainment (such as country fairs and fairground rides) provide opportunities for organisers to boost attendances and generate additional on-site spend. In total Point-to-Point Racing is estimated to contribute around 30m to Racing. Around two thirds of this is spent by owners primarily consisting of the training, registration and entry fees of the c.3,750 horses, with the majority of the rest being expenditure by spectators. Keep costs for a Point-to-Point horse vary significantly but average around 180 per week over the duration of the season. With ancillary items such as farrier costs, veterinary bills and travel the average cost of owning a Point-to-Point horse is estimated to be over 6,000 per annum. Point-to-Point key statistics 2008/09 Annual racedays 212 Hunter certificates registered 3,754 Riders certificates issues 830 Number of courses 117 Raceday attendance 630,000 Direct expenditure 30m Source: PPA; BHA; Deloitte estimates. Whilst retaining regulatory control, the BHA has recently delegated day to day running of Point-to-Point racing to the newly formed Point-to-Point Authority (PPA). Point-to-Point has a strong track record, as the grass roots support to Jump Racing, in developing owners, riders, trainers and horses that have subsequently achieved success in the professional sport. 41

44 42

45 ECONOMIC IMPACT OF BRITISH RACING SECTION 5 Local aspects Local impact of racing The impact of Racing on Britain s economy and society has been a constant thread in this study. However, the effect of the industry is also particularly important to the local economies of certain key racing locations, as the feature article on the Lambourn area illustrates. In addition to on-course expenditure, the areas surrounding racecourses benefit from secondary expenditure around the raceday. Such expenditure may include transport to and from the meeting, accommodation, food and beverage and entertainment for those staying in the area overnight. Local impact of racecourses The local impact of Racing and the off-site expenditure it generates is demonstrated by the example of York Racecourse, for whom the University of York undertook a study to evaluate its impact on the local economy in York Racecourse is northern England s premier Flat course with a capacity of over 40,000 and in addition to the annual Ebor Festival has in recent years has been used as a temporary site for Royal Ascot (2005) and the St Leger Festival (2006). The study considered the local employment and expenditure effects of York Racecourse in 2007 and reported that: York Racecourse increased total direct and indirect expenditure in York by 44m; The expenditure created 1,354 job years of employment; A total of 347,000 visitors were attracted to York Racecourse in 2007, which accounted for 8% of all visitors to York; These visitors contributed about 15% of the total visitor boost to expenditure and employment to the city of York. The feature article on Haydock Park on page 23 further illustrates the impact a busy urban racecourse has on the local economy. Off-course expenditure The level of off-course expenditure naturally varies across the fixture list, with Racing s flagship festivals attracting the largest crowds and generating the greatest expenditure. The total off-course expenditure of racegoers in 2008 is estimated as being 222m. Figure 34: Estimated off-course expenditure in Britain 2008 m Overnight visitors Day visitors Accommodation and entertainment Travel Trade paper sales Source: Deloitte analysis Trade paper sales The total off-course expenditure of racegoers in 2008 is estimated as being 222m. A substantial proportion of this expenditure is derived from the major multi day events such as the Cheltenham Festival (aided by an estimated 7,000 Irish racegoers per day) to a very low proportion of racegoers for a single day midweek fixture. It has been estimated that 1 in 20 racegoers include an overnight stay and incur expenditure of 41m on accommodation, transport and food and beverage. The remaining racegoers are day trippers and are estimated to incur expenditure of 147m on transport, off-course food and beverage and other spending an average 27 per attendee. In addition to this expenditure from racegoers the estimated 34m spent annually by racing consumers (including racegoers) on specialist racing papers, primarily the Racing Post, is included in off-course expenditure and brings total off-course expenditure in Figure 34 to over 220m. 43
46 Racing s position within the sports market in Britain The sports and leisure market in Britain remains extremely competitive. The ability to attract attendees, sponsorship, broadcasters, other commercial support and media coverage is a key indicator of how effective a sport is in competing for market share. This section assesses British Racing s position within the UK sporting landscape in terms of attendees, revenues, and employee numbers. When comparing sports it is important to consider the often different factors that have shaped their respective commercial structures. For example none of the other sports discussed in this Section have an equivalent to the large body of racehorse owners who inject very substantial sums into the sport each year. Figure 36: Top ten attended sporting events in Britain 2008 Rank Sport Event (duration in days) Aggregate attendance 1 Tennis Wimbledon (13) 476,000 2 Horseracing Royal Ascot (5) 288,000 3 Motorsport Formula One (Silverstone) (3) 240,000 4 Golf The Open (4) 202,000 5 Equestrian Badminton (3) 200,000 6 Horseracing Cheltenham Festival (3) A 178,000 7 Horseracing Derby meeting (2) B 160,000 8 Horseracing Grand National meeting (3) 145,000 9 Motorsport MotoGP (Donnington) (3) 135, Cricket England v South Africa (Lord s) (5) 109,000 Note A: One day of the four-day Cheltenham Festival was abandoned in The Festival attracted an attendance of c.209,000 over four full days in Note B: Includes an estimated 100,000 attendees on the Hill who pay limited admission fees. Source: BHA, Deloitte analysis. Attendances After football, horseracing continues to be comfortably the best attended sport in Britain as shown in Figure 35. Figure 35: Total attendances in Britain for selected sports 2008 The sport s attendances, compared with other sports, are characterised by the following: Total attendances of 5.7m in 2008 are almost two million higher than those of the next best attended sport, Rugby Union, and two and a half times those of Cricket. 44 m Football Horseracing 5.7 Rugby Union Greyhound racing Cricket Rugby League attendances Note: Football and Rugby Union refer to 2008/09 season, all other calendar year Source: BHA; Deloitte analysis. Racing s higher total attendances are, in part, driven by the large number of fixtures (1,423 in 2008) relative to other sports. In comparison, Rugby Union s total attendance of 3.8m is driven from around 400 domestic competition and international match fixtures although attendances at the top horseracing fixtures compare with those at top matches. Certain race meetings are not only cornerstones of the British and global horseracing calendar but are embedded within the wider British sporting calendar. These are vital opportunities for the sport to promote itself to a wider audience. Four race meetings Royal Ascot, the Cheltenham Festival, Grand National meeting and the Derby meeting featured in the top ten attended sporting events in Britain in Whilst Racing has a core and loyal base of regular attendees, a large proportion of its total attendees are irregular racegoers who attend meetings once or twice a year. The ability of Racing to convert the occasional visitor into a more regular customer is likely to hold the key to achieving future attendance growth and effectively competing for market share. Of all the sports shown, Rugby Union has had the most success in growing attendances since 2005 (up by nearly 20%), but Cricket, helped by the development of Twenty20, also recorded solid underlying growth (2005 was an Ashes year and hence had higher attendances at Test matches). Both sports above use of innovative marketing and a willingness to alter/ introduce competitions that reach out beyond their core attendees, provide lessons for Racing. Revenues Racing compares favourably when assessing the level of revenues generated by Britain s racecourses relative to those of other sports in the country. The key characteristics of racecourse revenues, and the sources of revenue, compared to other sports are as follows: Britain s 60 open racecourses in 2008 generated total revenues of 376m second only to football and over 90m above that of Rugby Union, the sport with the next highest revenues.
47 ECONOMIC IMPACT OF BRITISH RACING SECTION 5 Figure 37: Revenue breakdowns for selected sports in Britain m (26%) 71 (19%) 57 (15%) 150 (40%) Horse racing Event day Commercial (32%) 79 (28%) 112 (40%) Rugby Union (31%) 28 (47%) 55 (33%) (20%) 60 (36%) 20 (33%) Cricket Broadcast Betting Rugby League Note: To aid comparability, racecourse revenues have been primarily estimated from racecourse accounts and hence will differ from the figures in Section 4, with the largest difference due to catering revenues being shown as net income. Also all levy receipts have been included which differs from some racecourses accounts. Rugby union, cricket and rugby league revenues include income from international matches. Source: Deloitte analysis. In contrast to other sports, Racing benefits from substantial betting revenues 26% (excluding LBO media monies) of total revenues in However, total racecourse revenues excluding betting revenues (so including LBO media monies) totalled 278m in 2008, similar to that of Rugby Union. Encouragingly, racecourse revenues excluding betting income have increased by 66m (31%) in the three years since This rate of growth exceeds that of Rugby Union (25%) and Cricket (16%). Racecourses generated much higher event day revenues than all other sports outside of football, 38m more than Rugby Union. The volume of fixtures is a major factor, but the biggest race meetings are also amongst the highest grossing sporting events in Britain. In comparison with other sports, the relative contribution of commercial revenues to racecourses total revenues is proportionately low. A continuing challenge for Racing is to build revenues from commercial sources in future, particularly through sponsorship and nonraceday activities. In respect of the former, a collective approach to develop the most of the raceday product, and the linkages between races and race meetings, is likely to be important in marketing the sport to potential sponsors, including those in sectors which have traditionally been relatively untapped. British racecourses have committed 556m in the development of facilities and infrastructure in the five year period to This investment provides the platform for racecourses not only to increase eventday revenues but also grow commercial revenues through non-raceday activities. Employees Whilst employment within the majority of sports is related to governance, administration, and delivery of events, as well as the employment of athletes and coaching staff, the nature of the Racing industry means that its operations span several industry sectors. Full-time employees within the Racing industry include breeders, owners, trainers, jockeys, and administrative staff (both at racecourses and other bodies). Racing employs over 14,000 full time employees (rising to 18,600 FTE when parttime and raceday employees are included). Among sports, this is second only to football, whose clubs and administrative bodies employ approximately 18,000. When these employee numbers are considered relative to their revenues, Racing can be considered relatively labour intensive. It should be noted that a substantial number of individuals are involved with other sports at grassroots level (either paid or voluntary) on a full-time, part-time or casual basis. Horseracing also employs a substantial number of people (8,000) on a part-time basis. Figure 38: Full time employees within professional sports in the UK 000s ,000 Football 14,100 Horseracing Rugby Union 2,400 Cricket 1,800 Rugby League 1,100 Note: Racing also employs 8,000 part-time (non-raceday) staff, which is significantly greater than other sports. Source: Deloitte analysis. Racecourses generated much higher event day revenues than all other sports outside of football. Looking forward Racing s position within the British sporting landscape is well established. Behind football, the sport retains its second place ranking in terms of total attendances and revenues, and there is evidence that it is competing effectively for market share. The leisure and entertainment market continues to be hugely competitive, with perceptions of which activities deliver the best value for money increasingly important in terms of how consumers choose to spend their leisure time and allocate discretionary spend. The challenge for Racing like all sports is to continually assess its product offering in order to attract attendees, sponsors, other commercial partners and national and international media coverage. 45
48 Leisure comparisons The leisure market Racing competes for consumers not only with other sports, but with the wider range of leisure activities. The term leisure is allencompassing and refers simply to the time spent on activities that are not considered to be work. Consumer expenditure on leisure and recreation has boomed over the last twenty years. With a seemingly unlimited choice of options of how people can choose to spend their leisure time, and higher disposable incomes, modern households devote almost a fifth of their expenditure to leisure goods and services. Figure 39: Activities performed in free time 0 Watching TV Time with friends/family 79 Listening to music 73 Eating in restaurants 66 Sport/exercise 65 Reading 60 Days out 59 Shopping 50 Pubs/bars/clubs 47 Internet/ ing46 DIY 43 Gardening 43 Cinema Theatre/concerts 27 Computer games % Applicable to Racing Note: Dark green shading has been used to highlight leisure activities that could be combined with Racing. Percentages do not sum to 100 per cent as respondents could give more than one answer. Source: Taking Part: The National Survey of Culture, Leisure and Sport, Department for Culture, Media and Sport, 2006/07. Figure 39 illustrates how a day at the races combines the description of many of the nation s favourite leisure activities this is one of its great strengths. 85 Leisure activity attendances Figure 40 below puts racecourse attendances in the context of other popular leisure activities (see also Racing s position within the sports market in Britain). Figure 40: Total annual number of visits to selected leisure activities Total number of visits 1 million Cinema 164 Bingo clubs 2 78 Music concerts 24 Casinos 16 Theme parks 13 Horseracing 5.7 Note 1: Visitor numbers have been quoted for the most recent years available. Note 2: Bingo estimate is for 2005 hence will overstate visits by potentially more than 25%. Source: Gambling Commission; BHA; UK Film Council; MINTeL. Other events that have similarities in having betting as part of their entertainment model such as bingo and casinos currently attract a greater number of annual visitors, though the bingo market has declined markedly in recent years, particularly as a result of the smoking ban. Since racecourses are rarely filled to capacity there is the opportunity for Racing to increase its attendances by targeting other industries customers and/or working together to cross sell package leisure activities. Increased diversification of the raceday product, such as combining live music with Racing has been successful in recent years, aided by the general resurgence in music concerts. Given the competitive nature of the leisure industry racecourses must fight to maintain their market position. Without ongoing innovation Racing risks losing market share. Revenues Figure 41 compares the expenditure on Racing with that on other leisure activities together with a high level estimate of spend per visit. The analysis highlights that while racecourse expenditure per visitor is much higher than for some of the selected leisure activities it is competitive against others. Racing spend also covers a broad range of customers, including corporates. Families can utilise free entry for children to create very competitive family packages. As leisure expenditure becomes threatened in periods of economic instability, racecourses have the further advantage of being able to offer an entry price to suit all levels of demand. The expenditures that have been selected for Racing and other leisure activities are those that permit a meaningful comparison of spending per visit to be made. For Racing this means racehorse owners expenditure ( 430m) and off-course betting ( 1.1 billion) have been excluded. If these were included then they would be significantly greater than all other quoted leisure examples other than music concerts for which it would be similar. Employees The relatively labour intensive nature of Racing means it supports more employment than many similar sized leisure industries. Figure 42: Number of employees for selected leisure industries ( ) 000s Cinema (film/ video) 18.6 Horse racing 18.5 Bingo clubs 17.0 Theme parks 15.0 Casinos Note: Horseracing employment consists of core FTE industry only. Bingo estimate is from 2005 hence will overstate current levels given the decline in the number of clubs. Source: Gambling Commission; UK Film Council; Deloitte analysis. 46
 Casinos 0.30 Theme parks 0.")
49 ECONOMIC IMPACT OF BRITISH RACING SECTION 5 Figure 41: Expenditure on selected leisure activities in Britain ( ) bn Music concerts Bingo clubs Cinema (box office) Casinos 0.30 Theme parks Racecourses Illustrative spend per visit Note: Racecourses revenue based on admissions, catering, on-course betting and other sundry amounts. Casino expenditure represents house win plus estimate of secondary spend. Bingo spend is the net loss of attendees on all games plus other spending and is for 2005 hence will overstate current expenditure. Source: Gambling Commission; UK Film Council; MINTeL; Deloitte analysis. Looking ahead Leisure expenditure is discretionary and naturally becomes more vulnerable during periods of economic instability, as experienced during 2008, as people s disposable incomes are threatened. The distinction between necessity expenditure and expenditure on luxury goods becomes heightened and people may seek cheaper alternatives to expensive activities, such as watching television and reading. Indeed the concept of intertainment (increased leisure time spent at home) has recently emerged. Racing, as a significant contributor to the British leisure industry, clearly faces these challenges. Nonetheless the economic climate brings opportunities for specific leisure sectors if they can react quickly to changing customer demands. For example, a weak pound and lower disposable incomes will encourage people to holiday in Britain, and a day at the races may be seen as welcome light relief from economic gloom. Given the competitive nature of the leisure industry racecourses must fight to maintain their market position. The challenge for racecourses will be to continue to provide value for money entertainment that appeals to new race goers as well as traditionalists. Flexibility of corporate offerings as well as a continued focus on the raceday experience will be central to achieving this. 47
50 Report preparation, methodology and limitations Introduction and scope of our review The BHA commissioned Deloitte LLP ( Deloitte ) to produce this Report, which has been prepared in accordance with the contract dated 18 March The Report sets out the results of research and analysis of the Economic Impact of British Racing Industry, and sets this in the context of other sports, leisure activities and the rural economy in Britain and major overseas racing nations. Use of this report and legal responsibility Some of the matters discussed in this Report are by their nature technical. The intended recipient of the report, the BHA, is familiar with the issues, facts and other matters addressed and the Report was written with that in mind. This Report is prepared for the sole and confidential use of the BHA and for the purposes set out in the terms of engagement. In preparing this report our only responsibility and duty of care is to the BHA. We did not, and do not by consenting to publication of this Report, assume or accept or owe any responsibility or duty of care to any other person. The BHA has asked for our consent to making this report publicly available by posting it on BHA or other Racing websites, and other appropriate distribution methods as agreed with Deloitte. We have agreed to provide such consent on the following conditions: This report may not be suitable for the use of any person other than the BHA. Accordingly, publication of this report to persons other than the BHA is for information purposes only and no person other than the BHA should place any reliance on this Report; and We do not assume or accept or owe any responsibility or duty of care to any person other than the BHA. Accordingly, any person other than the BHA who, contrary to the above, chooses to rely on this Report, does so at their own risk and we will not be responsible for any losses of any such person caused by their reliance on this Report. Economic model methodology The methodology applied can be simplified into three broad stages described below: 1. Collation of direct and indirect expenditure data from available information. 2. Translation of expenditure data into expenditure by industry type to facilitate modelling. 3. Development and use of an input-output model to estimate the wider effects of the industry on the economy as a whole. 1. Collating industry expenditure The methodology used in estimating direct and indirect expenditure within the industry is discussed in the main body of the document. The collation of this information serves two purposes. First and foremost as an end in itself, but also as the input to the model which generates estimates of multiplier impact activity in the rest of the economy. An example of this is the need to source services that are not related to the core industry such as a trainer using the services of an accountant. The method used to assess this type of knock-on benefit is outlined below. 2. Translating expenditure The horseracing industry does not correspond directly to one of the 123 industry/product groups used for modelling purposes as defined by the Office for National Statistics ( ONS ). For this reason it is necessary to relate industry expenditure to the appropriate industry/product. This means that the direct expenditure is treated as a sporting activity, which comes under industry/product group 121 Recreational, Cultural and Sporting Activities. Indirect off-site expenditure such as on retail and travel is distributed accordingly to the relevant industry/product group. 3. Modelling The multiplier methodology described below is used extensively by Deloitte in assessing both the impact of a given sector or industry on the national economy or the economic impact of new developments in a given location. The model is based upon the 1995 Domestic Use input-output table for the United Kingdom, produced by the ONS. Specifically the model is an alteration of the publicly available input-output table, which has been modified to differentiate between types of impact that are not published by the ONS. This was achieved by using specialist matrix manipulation software. The model details what proportion of inputs each industrial sector sources from other sectors when producing an extra unit of output. The principle behind a multiplier effect is that a change in economic activity will have knock-on effects for the rest of the economy. These effects can be assumed to take place through two channels: Supply-side linkages (Business to Business effects) if industry demand increases it can be assumed that production will increase. This expansion requires more raw materials and associated services from other industries. In turn these other industries may need to increase production to meet the demand and they too will increase levels of economic activity (the indirect effect); and Consumer or wage effects an increase in an organisation s activity level will mean a higher wage bill. This money will be spent partly in the economy. This rise in consumer demand requires increasing production of goods and services, hence increasing expenditure (the induced effect). The multipliers used in this Report, give both the indirect and induced effects of expenditure in the horseracing industry. The indirect and induced effects are estimated by Type I and Type II multipliers in the model. Type I multiplier data allows us to calculate the indirect effects as a result of the initial expenditure. Type II multipliers enable us to calculate the indirect and induced effects generated by the initial expenditure. By taking the differences between Type I and Type II effects, it is possible to isolate the consumer spending effects of the expenditure. It should be pointed out that in interpreting the results from the model, the hypothetical removal of the horseracing industry from the UK economy would not result in a drop in national economic output of the magnitude that the industry currently contributes. This is simply because businesses and people would spend their money elsewhere. The model is intended to show the extent to which the industry is linked with the rest of the economy and what the contribution of the industry currently is, rather than suggesting what would happen to the UK economy if the industry did not exist. Consultations We have consulted with individuals from over 20 organisations from every sector, including: Racecourses Racecourse Association, Northern Racing, Jockey Club Racecourses, Ffos Las, York racecourse; Other racing organisations Racing Enterprises, Jockey Club, Levy Board, Weatherbys, Point-to-Point Authority; Ownership and training Racehorse Owners Association, National Trainers Association, Jockey Club Estates; Breeding Thoroughbred Breeders Association, Federation of Bloodstock Agents; Betting industry Administration of Gambling on Tracks Ltd, Tote; Broadcasting Racing UK; International Various international horseracing governing authorities and IFHA. Our reliance on information In preparing this Report, we have used information and data extracted from various published surveys, which we assume to be reliable, to obtain the inputs into the economic model which we used to estimate the economic impact of the Racing Industry. In addition, we have used information and data which have been provided to us by a wide variety of organisations including the BHA, other British racing organisations, overseas Racing bodies, the betting industry and Government sources. In all cases (and including information from organisations not listed), we have relied upon such information and data as being true, correct and complete and have not audited, tested or checked any such information or data. Specific limitations of our review In accordance with our terms of engagement, or due to our findings when performing our work, the following specific limitations should be noted: The economic impact of those elements of the Horse Industry outside of the British Thoroughbred Racing and Breeding Industries ( British Racing ) other than the indirect expenditure which arises in these elements as a result of British Racing has been excluded. The British breeding industry is complex and consists of a number of sub-sectors with distinct, often very different, characteristics. In preparing this Report we have looked at the breeding industry in aggregate only, and at a high level only. The amount and robustness of information available for the breeding sector is currently less than for other aspects of British Racing addressed in this Report. The economic impacts in this Report do not specifically include the likely economic contribution made by off-site British Bookmakers from profits made on British Racing other than that generated through the Levy payments and tax paid on betting operators gross win on British Racing. As a simplification of any industry an economic model of this type can only ever be expected to represent an approximation of a real-life outcome. The model relies upon data published by ONS as well as information provided by stakeholders as part of this study. It is possible that industry linkages have changed since the publication of the 1995 Domestic Use Matrix, but as the latest available data on which to base our analysis the ONS data used is the most appropriate. 48

51 ECONOMIC IMPACT OF BRITISH RACING Glossary BHA British Horseracing Authority British Racing or Racing British Racing and Breeding Industries CAGR Compound Annual Growth Rate FOBT Fixed Odds Betting Terminal FTE Full Time Equivalent GDP Gross Domestic Product GPT Gross Profits Tax being 15% of Gross win Gross win Amount staked by bettors less prizes paid out GVA Gross Value Added HBLB or Levy Board Horserace Betting Levy Board IFHA International Federation of Horseracing Authorities LBO Licensed Betting Office NTF National Trainers Federation PAYE Pay As You Earn REL Racing Enterprises Limited RCA Racecourse Association ROA Racehorse Owners Association SIS Satellite Information Services Ltd TBA Thoroughbred Breeding Association VAT Value Added Tax
Introduction to racing. Robin Mounsey, British Horseracing Authority Head of Media
 Introduction to racing Robin Mounsey, British Horseracing Authority Head of Media What is racing? A sport? An industry? A betting product? A leisure pastime? It is ALL of these, and so much more British
1. Executive summary Purpose Objectives Strategy: Specific priorities 4
 HORSERACE BETTING LEVY BOARD BUSINESS PLAN 2018/2019 CONTENTS 1. Executive summary 1 2. Purpose 2 3. Objectives 3 4. Strategy: Specific priorities 4 5. Income 5.1 New Levy mechanism 5 5.2 Bank interest
THE ECONOMIC CONTRIBUTION FROM HORSES
 THE ECONOMIC CONTRIBUTION FROM HORSES ECONOMIC CONTRIBUTION FROM HORSES HIGHLIGHTS The horse industry contributes more than $19 billion annually to the Canadian economy On-farm activities with horses generate
FREQUENTLY ASKED QUESTIONS PASS CARD HOLDERS
 FREQUENTLY ASKED QUESTIONS PASS CARD HOLDERS CONTENTS 1. Frequently Asked Questions 2. Further Information a. The New System and New PASS Cards b. The Online Concierge System c. Before I go Racing d. At
British racing - the structure of the industry. Joe Rendall, British Horseracing Authority
 British racing - the structure of the industry Joe Rendall, British Horseracing Authority British racing headline numbers THE NUMBERS The British racing industry World-leading in international Racing Second
HORSERACE BETTING LEVY BOARD BUSINESS PLAN 2014
 HORSERACE BETTING LEVY BOARD BUSINESS PLAN 2014 INTRODUCTION 1. Section 24(1) of the Betting, Gaming and Lotteries Act 1963 requires the Horserace Betting Levy Board to assess and collect monetary contributions
ECONOMIC IMPACT OF IRISH breeding
 ECONOMIC IMPACT OF IRISH breeding and RACING 2017 28,900 Direct, indirect and secondary employment 1.3 million Attendees at Irish racing 1.84 billion Total direct and stimulated expenditure 438m Bloodstock
make it yours membership
 make it yours membership Full JUMP Season FLAT Season MEMBERSHIP 201 3 your Newbury your way Choose from our range of flexible membership options and take advantage of the many benefits, exclusive events
The Economic Impact of Colonial Downs in Virginia
 The Economic Impact of Colonial Downs in Virginia Prepared for Revolutionary Racing January 31, 2018 1309 E Cary Street, Richmond, VA 23219 1025 Huron Road East, Cleveland, OH 44115 chmuraecon.com Table
Foreword 3. Mission & Objectives 4. Financial Overview 8. Money In 10. Money Out 11. Delivering Services 12. Services Explained 13
 2016 BUDGET GUIDE Foreword 3 Mission & Objectives 4 Financial Overview 8 Money In 10 Money Out 11 Delivering Services 12 Services Explained 13 Cost to Participants 14 FOREWORD NICK RUST CHIEF EXECUTIVE
The Economic Contribution and Financing of Racecourses in Ireland 2017
 Cover Page: Killarney Racecourse August 2017, Healy Racing Photographers CONTENTS PAGE 1. EXECUTIVE SUMMARY... 2 2. TERMS OF REFERENCE AND METHODOLOGY... 6 2.1. BACKGROUND... 6 2.2. METHODOLOGY... 6 2.3.
Growing Racecourse Attendance
 Growing Racecourse Attendance Background In March 2015, Britain s 58 RCA racecourses came together for the first time to share their customer data in British racing s biggest and most farreaching piece
WESTERN AUSTRALIAN RACING INDUSTRY
 WESTERN AUSTRALIAN RACING INDUSTRY ECONOMIC & SOCIAL IMPACT REPORT HIGHLIGHTS OUR RACING INDUSTRY THOROUGHBRED RACING IS THE THIRD HIGHEST ATTENDED SPORT IN WA The Western Australian racing industry plays
The NSW Greyhound Breeders, Owners & Trainers Association
 ACN 000 043 756 ABN 68 000 043 756 The NSW Greyhound Breeders, Owners & Trainers Association Submission to GRNSW re: Proposed Welfare and Integrity Levy From: The NSW GBOTA Date Submitted: March 27, 2015
LOGO. Racing s Lifeblood The Future Landscape for Wagering
 LOGO Racing s Lifeblood The Future Landscape for Wagering LOGO Racing s Lifeblood The Future Landscape for Wagering Speaker: Paul Bittar Chief Executive, British Horseracing Authority BRITISH RACING AND
HORSERACE BETTING LEVY BOARD BUSINESS PLAN 2013
 HORSERACE BETTING LEVY BOARD BUSINESS PLAN 2013 INTRODUCTION 1. Section 24(1) of the Betting, Gaming and Lotteries Act 1963 requires the Horserace Betting Levy Board to assess and collect monetary contributions
39B, Kingfisher Court, Hambridge Road Newbury, Berkshire RG14 5SJ
 Part 4 JOCKEYS TAX & VAT BOOKLET 39B, Kingfisher Court, Hambridge Road Newbury, Berkshire RG14 5SJ Telephone: Newbury (01635) 44102 Fax: (01635) 37932 email: info@thepja.co.uk Web: www.thepja.co.uk 1 I
Review of Outlook
 Review of 2012 2013 Outlook Our membership now numbers over 200,000 racing fans and on average we see around 1,700 new members joining us per week. 2012 Highlights Q1 Sponsor of the Rewards4Racing Cleeve
HORSERACE BETTING LEVY BOARD FIFTY-FIRST LEVY SCHEME 1st April 2012 to 31st March 2013 FORM OF DECLARATION ( FOD )
") HORSERACE BETTING LEVY BOARD FIFTY-FIRST LEVY SCHEME 1st April 2012 to 31st March 2013 FORM OF DECLARATION ( FOD ) 51 The Levy Scheme applies to all holders of Gambling Commission operating licences and
HORSERACE BETTING LEVY BOARD FIFTY-FIRST LEVY SCHEME 1st April 2012 to 31st March 2013 FORM OF DECLARATION ( FOD ) 51 The Levy Scheme applies to all holders of Gambling Commission operating licences and
ANNUAL BADGEHOLDERS GUIDE 2019
 ANNUAL BADGEHOLDERS GUIDE 2019 ANNUAL BADGEHOLDER SCHEME BENEFITS Ascot Annual Badgeholders enjoy discounted entry into the King Edward VII Enclosure, with access to exclusive catering and viewing facilities.
ANNUAL BADGEHOLDERS GUIDE 2018
 ANNUAL BADGEHOLDERS GUIDE 2018 ANNUAL BADGEHOLDER SCHEME BENEFITS Ascot Annual Badgeholders enjoy discounted entry into the King Edward VII Enclosure, with access to exclusive catering and viewing facilities.
QUEENSLAND RACING INDUSTRY. Economic & Social Impact Report Highlights
 QUEENSLAND RACING INDUSTRY Economic & Social Impact Report Highlights PREPARED BY IER OCTOBER 2017 OUR RACING INDUSTRY The Queensland racing industry plays an important economic and social role, enhancing
New Zealand Thoroughbred Racing (NZTR) Job Description
 Job Description") New Zealand Thoroughbred Racing (NZTR) Job Description Position Director, NZTR Board External and Internal Key Relationships Internal: NZTR CEO Managers & Staff of NZTR External: NZ Racing Board (NZRB)
New Zealand Thoroughbred Racing (NZTR) Job Description Position Director, NZTR Board External and Internal Key Relationships Internal: NZTR CEO Managers & Staff of NZTR External: NZ Racing Board (NZRB)
Hunter and Angler Expenditures, Characteristics, and Economic Effects, North Dakota,
 Agribusiness and Applied Economics Report No. 507-S January 2003 Hunter and Angler Expenditures, Characteristics, and Economic Effects, North Dakota, 2001-2002 Dean A. Bangsund and F. Larry Leistritz*
The Racing Association: The Sport Of Horseracing. 1. Background
 The Racing Association: The Sport Of Horseracing 1. Background The Racing Association was incorporated in December 1997 following the signing of a Memorandum of Understanding between the Horseracing Industry
STATE OF NEW YORK OFFICE OF THE STATE COMPTROLLER 110 STATE STREET ALBANY, NEW YORK September 2015
 THOMAS P. DiNAPOLI COMPTROLLER STATE OF NEW YORK OFFICE OF THE STATE COMPTROLLER 110 STATE STREET ALBANY, NEW YORK 12236 GABRIEL F. DEYO DEPUTY COMPTROLLER DIVISION OF LOCAL GOVERNMENT AND SCHOOL ACCOUNTABILITY
Win the love of your bookmaker...
 Win the love of your bookmaker... A guide to romance for racing punters... This unique FREE report from Against the Crowd includes: 15-years-worth of meticulously researched horse racing data... Revealing
The Economic Benefits of Hunting and Fishing Activities in Alberta in 2008
 The Economic Benefits of Hunting and Fishing Activities in Alberta in 2008 Submitted to Hunting For Tomorrow Foundation Submitted by May, 2009 Introduction Hunting and Fishing related expenditures by Alberta
Welcome to William Hill
 1 Welcome to William Hill 2 Today s running order Highlights and year-to-date overview Ralph Topping Financial results Simon Lane Online overview Ralph Topping Henry Birch Current trading, summary and
CRICKET HONG KONG 2019 AGM CHAIRMAN S REPORT
 CRICKET HONG KONG 2019 AGM CHAIRMAN S REPORT INTRODUCTION The 2019 AGM is a major milestone in the history of cricket in Hong Kong. The board elected at this AGM will be the first under the new constitution
Economic Impact of DECEMBER 2014
 Economic Impact of Ascot Racecourse DECEMBER 2014 CONTENTS Executive summary 4 Introduction 8 Ascot Racecourse s position in British Racing 9 Facilities 12 Racecourse attendances 15 On-course expenditure
Go Racing In Yorkshire Annual Awards Luncheon. Thursday 19 November Speech by Ian Barlow. Chairman, The Racecourse Association Ltd
 Go Racing In Yorkshire Annual Awards Luncheon Thursday 19 November 2009 Speech by Ian Barlow Chairman, The Racecourse Association Ltd Good afternoon. I'm delighted to be back in Yorkshire, the county with
SESSIONS OF IFHA CONFERENCE IN PARIS BETTING / STIMULATING WAGERING TURNOVER - HONG KONG
 ORGANIZACIÓN SUDAMERICANA DE FOMENTO DEL SANGRE PURA DE CARRERA OSAF NEWS November 21st, 2018 SESSIONS OF IFHA CONFERENCE IN PARIS BETTING / STIMULATING WAGERING TURNOVER - HONG KONG Continuing with Session
NEW ZEALAND RACING INDUSTRY
 SIZE & SCOPE OF THE NEW ZEALAND RACING INDUSTRY PREPARED BY IER / FEBRUARY 2018 IER PTY. LTD. Size and Scope of the New Zealand Racing Board / XX KEY FINDINGS 04 INTRODUCTION 08 ECONOMIC IMPACTS 12 EMPLOYMENT
RACING & WAGERING PERFORMANCE OVERVIEW
 RACING & WAGERING PERFORMANCE OVERVIEW FIRST HALF OF 17/18 RACING SEASON (AUGUST 17 - JANUARY 18) Published March 18 INTRODUCTION 17/18 RACING SEASON H1 OVERVIEW IT IS NOW 1 MONTHS SINCE WE COMMITTED TO
ANNUAL REVIEW 2017/18
 ANNUAL REVIEW 2017/18 ANNUAL REVIEW 2017/18 FOREWORD This review presents a summary of Liverpool Vision s achievement s in 2017/18. With the creation of 1,042 jobs and generating over 79 million in private
Irish Bookmakers Association
 Irish Bookmakers Association Pre Budget Submission October, 2011 2 Contents Overview and Key Proposals... 3 Level the Playing Field... 4 Modernise the Sector... 5 Economic Impact of Modernisation and Liberalisation...
STATE OF NEW YORK OFFICE OF THE STATE COMPTROLLER 110 STATE STREET ALBANY, NEW YORK September 2015
 THOMAS P. DiNAPOLI COMPTROLLER STATE OF NEW YORK OFFICE OF THE STATE COMPTROLLER 110 STATE STREET ALBANY, NEW YORK 12236 GABRIEL F. DEYO DEPUTY COMPTROLLER DIVISION OF LOCAL GOVERNMENT AND SCHOOL ACCOUNTABILITY
Economic Impact Study: NFL International Series London, 28 October 2012
 LONDON & PARTNERS Economic Impact Study: NFL International Series London, 28 October 2012 December 2012 LONDON & PARTNERS ECONOMIC IMPACT STUDY NFL INTERNATIONAL SERIES LONDON, 28 OCTOBER 2012 DECEMBER
An exciting and rewarding opportunity now exists to become part of the Sussex Cricket s sponsorship programme for the 2018 season.
 At Sussex County Cricket Club, we are very proud of our history, success and family ethos. The Club was founded in 1839 and is the oldest county cricket club in the UK. Alongside this longevity, Sussex
Apprentice and conditional jockeys
 Apprentice and conditional jockeys The following is a brief guide for trainers with apprentice or conditional jockeys. It does not seek to cover every scenario nor individual cases but gives an overview
Working Draft: Gaming Revenue Recognition Implementation Issue. Financial Reporting Center Revenue Recognition
 October 2, 2017 Financial Reporting Center Revenue Recognition Working Draft: Gaming Revenue Recognition Implementation Issue Issue # 6-12: Accounting for Racetrack Fees Expected Overall Level of Impact
Rural Ontario s Hidden Sector: The Economic Importance of the Horse Industry Final Report
 Rural Ontario s Hidden Sector: The Economic Importance of the Horse Industry Final Report - 2009 Photo Credit: J.W. Wilton Dr. Bronwynne Wilton and Dr. Wayne Caldwell University of Guelph 1 Executive Summary
BUSINESS PLAN January Richard Wooles. Executive Director # West Broadway Vancouver, BC V5Y 3W2 Tel:
 BUSINESS PLAN January 2015 Richard Wooles Executive Director #201-210 West Broadway Vancouver, BC V5Y 3W2 Tel: 604 737 3164 richard@cyclingbc.net Table of Contents Vision... 2 Mission... 2 Values... 2
British racing. industry roadshows One voice on the future of British racing. York Racecourse 27 February. Musselburgh Racecourse 28 February
 British racing industry roadshows 2017 One voice on the future of British racing York Racecourse 27 February Musselburgh Racecourse 28 February Cheltenham Racecourse 2 March Newmarket Rowley Mile 3 March
ON-COURSE PHYSICAL THERAPY SERVICES SERVICE LEVEL AGREEMENT
 ON-COURSE PHYSICAL THERAPY SERVICES SERVICE LEVEL AGREEMENT 1. Purpose and Objectives This document provides a service level agreement for The Injured Jockeys Fund (IJF) on behalf of The Jockeys Injury
OHRIA Ontario Horse Racing Industry Association
 OHRIA Ontario Horse Racing Industry Association P.O. Box 456, Stn. B, Toronto, ON M9W 5L4 Tel: 416-679-0741 Fax: 416-679-9114 Email: ohria@ohria.com Submission to the Standing Committee of Finance and
Equine Summit 2017 Presentation of Industry Statistics
 Equine Summit 2017 Presentation of Industry Statistics Sasha Kerins Partner and Head of Agri-Food 1 - The Past Historic Facts Historic Facts - Thoroughbreds Tales from Irish mythology mention horse racing
By making use of SAFRIM (South African Inter-Industry Macro-Economic Model) By Jeaunes Viljoen, Conningarth Economists, 1
 By Jeaunes Viljoen, Conningarth Economists, 1") By making use of SAFRIM (South African Inter-Industry Macro-Economic Model) By Jeaunes Viljoen, Conningarth Economists, South Africa 10/13/2011 1 1960: The economy experienced high growth rates mining
By making use of SAFRIM (South African Inter-Industry Macro-Economic Model) By Jeaunes Viljoen, Conningarth Economists, South Africa 10/13/2011 1 1960: The economy experienced high growth rates mining
The 2010 Economic Contribution of Tourism to the Meadowlands Liberty Region
 The 2010 Economic Contribution of Tourism to the Meadowlands Liberty Region Key Metrics & Evaluation 93 MAIN STREET :: ANNAPOLIS, MD 21401 WWW.VANTAGESTRATEGY.COM :: 202-449- 9708 1 Vantage Strategy ::.
Report for the Government Appointed Members of the Horserace Betting Levy Board. dated 19 October 2010
 Report for the Government Appointed Members of the Horserace Betting Levy Board Deloitte LLP Athene Place 66 Shoe Lane London EC4A 3BQ Report for the Government Appointed Members of the Horserace Betting
CRV is a non-for-profit organisation that exists for the promotion and facilitation of country horse racing for its members and the wide community.
 26 February 2016 Gaming Machine Arrangements Review Office of Liquor, Gaming and Racing Department of Justice and Regulation PO Box 18055 Collins Street East MELBOURNE VIC 8003 Email: Olgr.gmar@justice.vic.gov.au
Britain and Ireland unite to launch rich new bonus scheme Plus 10
 Wednesday, 23 July 2014 MEDIA RELEASE Britain and Ireland unite to launch rich new bonus scheme Plus 10 Plus 10, a new 5.5 million bonus scheme for Great British and Irish owners and breeders has been
WARWICK RACECOURSE 2017/18 SEASON GUIDE
 WARWICK RACECOURSE 2017/18 SEASON GUIDE 2017/18 FIXTURES 2017 THE GRAND SEASON OPENER Tuesday 26th September THE AUTUMN MEETING Thursday 5th October BUSINESS NETWORKING RACEDAY Friday 10th November WINTER
Presented
 Presented www.winningmore.com The UK Dream Horse Racing System The aim of this system is to indicate winners using proven form principles. Form is without doubt, the only accurate method of establishing
Annual results Accell Group 2016
 Annual results Accell Group 2016 Amsterdam, 10 March 2017 René J. Takens, CEO Hielke H. Sybesma, CFO Agenda 1. Key results 2016 2. Strategy 3. Outlook 10 March 2017 Accell Group N.V. presentation annual
Winners of UK Group 1 Flat Races in 2015
 Winners of UK Group 1 Flat in 2015 Race Distance 2015 Date Racecourse Value 1st Prize Winner Qipco 2000 Guineas Stakes (The 205th Running) (British Champions Series) 1m 02 May 2015 Newmarket 498,750 282,841
Submission to the Victorian Government s Review into Static Betting Advertising
 Submission to the Victorian Government s Review into Static Betting Advertising 19 September 2016 About bet365 bet365 is a privately held group of companies which was founded in Stoke-on-Trent in the UK
The economic value of the EU shipping industry. Andrew P Goodwin
 The economic value of the EU shipping industry Andrew P Goodwin 2 nd April 2014 Introduction Shipping is a vital facilitator of world trade 135 % Increase in world GDP in the last two decades 180 % Increase
Alley OUR BUSINESS SUMMARY
 Alley OUR BUSINESS SUMMARY Table of Contents Introduction to Strike Bowling Alley 1 Our Organizational Model 2 Revenue Streams 3 Personnel & Job Creation 4 Location Selection & New Construction 5 Bowling
Community Update. Life in the Heartland Community Information Evening. Pembina Pipeline Corporation
 Pembina Pipeline Corporation Community Update Life in the Heartland Community Information Evening Wayne Carey Manager, Field Projects, Redwater Facility October 23, 2017 Forward-Looking Statements This
FLAT RACES DATE RACECOURSE TITLE TYPE RIDER SEX AGE DIST SURFACE RATING
 FLAT RACES 1/2/17 SOUTHWELL THE VISIT attheraces.com AMATEUR RIDERS' HANDICAP STAKES (CLASS 6Hcap Amtr All 4yo+ 2m AWT 46-65 1/11/17 KEMPTON PARK THE 10 FREE BET AT 32RedSport.com AMATEUR RIDERS' HANDICAP
BUCS Strategic Plan for Rugby Union
 BUCS Strategic Plan for Rugby Union 2011-15 Introduction The purpose of this document is to achieve agreement across relevant partners on a set of achievable strategic aims for the development and continued
Danish gambling market statistics Third quarter, 2017
 Danish gambling market statistics Third quarter, Third Quarter, 7. december Third Quarter, Danish gambling market statistics 1 Indhold A. Introduction... 2 B. Quarterly market statistics for the Danish
How to Explain Car Rental to Banks and Investors
 How to Explain Car Rental to Banks and Investors Scott White Senior Managing Director, Head of Investment Banking C.L. King & Associates March 8-9, 2011 Las Vegas Hilton 1 My Background 18 Years Advising
Report to COUNCIL for decision
 17 152 Title: Section: Prepared by: Olympic Pool Business Case Community & Recreation Andrew White (Community & Recreation Manager) Meeting Date: 18 May 2017 Legal Financial Significance = Medium Report
Europe June Craig Menear. Chairman, CEO & President. Diane Dayhoff. Vice President, Investor Relations
 Europe June 2016 Craig Menear Chairman, CEO & President Diane Dayhoff Vice President, Investor Relations Forward Looking Statements and Non-GAAP Financial Measurements Certain statements contained in today
FAQ s. Q1. What is AberDNA?
 FAQ s Q1. What is AberDNA? AberDNA is a new membership initiative which aims to capture the imagination of not only local, but national and international supporters. Unlike season tickets or other memberships,
The First Year. Race Horse Deathwatch: RACE HORSE DEATHWATCH. A special report by Animal Aid s Horse Racing Consultant, Dene Stansall
 Race Horse Deathwatch: The First Year RACE HORSE DEATHWATCH A special report by Animal Aid s Horse Racing Consultant, Dene Stansall Summary and Key Findings Animal Aid s Race Horse Deathwatch is a unique
15, 2015 EXECUTIVE SUMMARY
 Economic Contribution, Impacts, and Economic Benefits of Deer, Waterfowl and Upland Game Bird Hunting in North and South Dakota: Relationship to CRP Lands Dr. John Loomis and Dr. Michelle Haefele in cooperation
STRATEGY / PLANNING / RESEARCH
 Harness Racing Australia: Economic Impact of the 2012 V75 Inter Dominion Championship 1 Harness Racing Australia / Economic Impact 2012 V75 Inter Dominion Championship Prepared by: IER Pty Ltd 27A Stubbs
GROWING THE GAME FOR THE FUTURE
 GROWING THE GAME FOR THE FUTURE THE CHILDREN AND YOUNG PEOPLE S PLAN FOR GOLF 2017 2021 INTRODUCTION As pressure on young people s time continues to increase and the pace of life moves quicker, young people
Reboot Annual Review of Football Finance Sports Business Group June 2016
 Reboot Annual Review of Football Finance 216 Sports Business Group June 216 As the Premier League looks forward to its 25th season, the Deloitte Annual Review of Football Finance has now completed its
A Satellite Account for GOLF. in the Republic of Ireland
 A Satellite Account for GOLF in the Republic of Ireland FOREWORD Golf plays a positive role in the social and sporting life of Irish society. Golf clubs and members have long known this through their
WHY BET WITH TIMEFORM? 1
 WHY BET WITH TIMEFORM? 1 Timeform has over sixty years of experience in understanding and assessing races. The highly-skilled members of the Timeform team use this accumulated experience to ensure that
Miles Briggs MSP; Rachael Hamilton MSP; John Scott MSP; Ross Hamilton; Donald Morrison
 MINUTES OF THE FIRST MEETING OF THE CROSS PARTY GROUP ON SCOTTISH HORSERACING AND BLOODSTOCK INDUSTRIES HELD ON WEDNESDAY 22 nd FEBRUARY 2017 AT 5.30PM IN THE SCOTTISH PARLIAMENT 1. PRESENT Miles Briggs
South West Region MINUTES OF THE MEETING HELD AT TAUNTON RACECOURSE ON MONDAY 30 TH OCTOBER 2017 AT 2:00 PM
 South West Region MINUTES OF THE MEETING HELD AT TAUNTON RACECOURSE ON MONDAY 30 TH OCTOBER 2017 AT 2:00 PM PRESENT: Mr S Mullins (Chairman) Mr J Barber Mr V Dartnall Mr H Derham (representing Mr P Nicholls)
The economic benefits of LFC an independent report
 Introduction Liverpool FC is one of the most iconic clubs in English and world football. The profile of the Club, sell-out matches at Anfield and their day-to-day activities all generate a very significant
Brookfield Asset Management O AK T R E E ACQUISITION M A R C H 1 3,
 Brookfield Asset Management O AK T R E E ACQUISITION M A R C H 1 3, 2 0 19 Transaction Summary On March 13, 2019, Brookfield Asset Management ( BAM ) and Oaktree Capital Group ( OAK ) announced an agreement
An Bille um Rásaíocht Capall Éireann, 2015 Horse Racing Ireland Bill Meabhrán Mínitheach Explanatory Memorandum
 An Bille um Rásaíocht Capall Éireann, 2015 Horse Racing Ireland Bill 2015 Meabhrán Mínitheach Explanatory Memorandum AN BILLE UM RÁSAÍOCHT CAPALL ÉIREANN, 2015 HORSE RACING IRELAND BILL 2015 EXPLANATORY
British Icon Index II. How home-grown brands, industries and institutions carry the story of modern Britain to the world
 British Icon Index II How home-grown brands, industries and institutions carry the story of modern Britain to the world 2018 Foreword Highlights Over the coming months there will be countless column inches
CITY OF HAMILTON PUBLIC WORKS DEPARTMENT Energy, Fleet & Facilities Management Division
 CITY OF HAMILTON PUBLIC WORKS DEPARTMENT Energy, Fleet & Facilities Management Division TO: Chair and Members Public Works Committee COMMITTEE DATE: June 5, 2017 SUBJECT/REPORT NO: Municipal Golf Course
Strategic Plan for Sevens Rugby. September 2006
 Strategic Plan for Sevens Rugby September 2006 Introduction The promotion of Sevens has been instrumental in taking Rugby to new territories and regions. The continued growth of Sevens would help achieve
COQUITLAM FILM STRATEGY
 2017 2022 COQUITLAM FILM STRATEGY A special thank you to the following film sector professionals for their contributions to the 2017 2022 Coquitlam Film Strategy: RICK FEARON, LOCATION SCOUT, GEP MAGICIANS
The Jockey Club Round Table Conference on Matters Pertaining to Racing. August 12, 2018
 The Jockey Club Round Table Conference on Matters Pertaining to Racing August 12, 2018 Stuart S. Janney III Chairman The Jockey Club The Jockey Club Round Table Conference on Matters Pertaining to
Web.com Completes Acquisition of Yodle Deal strengthens Web.com s portfolio of products that help small businesses compete and succeed online
 Web.com Group, Inc. 12808 Gran Bay Parkway West Jacksonville, FL 32258 T: (904) 680-6600 F: (904) 880-0350 NASDAQ: WEB Web.com Completes Acquisition of Yodle Deal strengthens Web.com s portfolio of products
TOUR DE FRANCE GRAND DÉPART YORKSHIRE
 TOUR DE FRANCE GRAND DÉPART YORKSHIRE Economic Impact Assessment Report for Calderdale Metropolitan Borough Council New Economy www.neweconomymanchester.com 28 September 2012 New Economy 1 1 Introduction
A strategic review of the FEI World Equestrian Games. Consultation report: Executive Summary. November
 A strategic review of the FEI World Equestrian Games Consultation report: Executive Summary November 2014 FINAL 1 Executive summary (1/5) Background The FEI World Equestrian Games * has grown substantially
Residential Jurisdistions of Attendees 1998 Breeders Cup Races in Louisville
 Residential Jurisdictions of Attendees, 1998 Breeders Cup Race in Louisville share of jurisdiction number total 1 Kentucky resident, Louisville MSA 35,515 44.1% 2 Indiana resident, Louisville MSA 3,088
Xcel Energy (Baa3/BBB-)
") January 28, 2004 Fixed Income Research Recommendation: Market Perform Credit Trend: Improving Jacob P. Mercer, CFA Senior Research Analyst 612-303-1609 jacob.p.mercer@pjc.com Mark D. Churchill Associate
January 28, 2004 Fixed Income Research Recommendation: Market Perform Credit Trend: Improving Jacob P. Mercer, CFA Senior Research Analyst 612-303-1609 jacob.p.mercer@pjc.com Mark D. Churchill Associate
Business management in equine businesses
 Business management in equine businesses Pack 1 The equine sector Pack Code: EBM1 This pack you will help you to: Explain the importance of the equine sector. www.lbcnc.org.uk Outline the role of some
2016 REVIEW 2017 OUTLOOK
 2016 REVIEW 2017 OUTLOOK WE GET RACEGOERS GOING WHO WE ARE Rewards4Racing is British racing s award winning rewards programme dedicated to racing fans and those who love a great day out at the races. WHAT
Eventing Sponsorship Opportunities. britisheventing.com
 Eventing Sponsorship Opportunities 2 Eventing Sponsorship 3 Eventing offers unique, powerful and affordable sport and lifestyle sponsorship opportunities; regionally, nationally or even internationally.
Department of Legislative Services Maryland General Assembly 2007 Special Session FISCAL AND POLICY NOTE
 Department of Legislative Services Maryland General Assembly 2007 Special Session HB 45 FISCAL AND POLICY NOTE House Bill 45 Ways and Means (Delegate G. Clagett) Public School Construction - Funding -
EQUINE HE2014. BSc (Hons) in Equine Management FdSc in Equine Management
 in Equine Management FdSc in Equine Management") EQUINE HE2014 BSc (Hons) in Equine Management FdSc in Equine Management Equine Enniskillen Campus currently provides the widest range of equine programmes in Ireland. Courses have been developed which
EQUINE HE2014 BSc (Hons) in Equine Management FdSc in Equine Management Equine Enniskillen Campus currently provides the widest range of equine programmes in Ireland. Courses have been developed which
The Power of Outdoor Recreation Spending in Pennsylvania:
 The Power of Outdoor Recreation Spending in Pennsylvania: How hunting, fishing, and outdoor activities help support a healthy state economy November, 2018 Prepared for the Theodore Roosevelt Conservation
A Threatened Bay: Challenges to the Future of the Penobscot Bay Region and its Communities
 A Threatened Bay: Challenges to the Future of the Penobscot Bay Region and its Communities 1 A A Threatened Bay: Challenges to the Future of the Penobscot Bay Region and its Communities In 1996 the Island
Mediaset Board Meeting 30 July 2009
 Press Release Mediaset Board Meeting 30 July 2009 BOARD APPROVES RESULTS FOR THE FIRST HALF OF 2009 Consolidated Results Net revenues: 1,951.7 million Operating profit: 374.4 million Net profit: 180.8
5. Golf Industry Trends and Developments in the US 6. The US Macro Economy Factors and Impact over Golf Industry
 TABLE OF CONTENTS 1. Golf Industry Performance Worldwide 1.1. Overview 1.2. Global Golf Equipment Demand and Economy 2. The US Golf Industry Overview 2.1. Industry Segmentation 3. Industry Performance
The University of Georgia
 The University of Georgia Center for Agribusiness and Economic Development College of Agricultural and Environmental Sciences Economic Impacts of Alabama Quail Hunting Prepared by: Archie Flanders and