This file is part of the following reference: Access to this file is available from:
|
|
|
- Imogene Short
- 6 years ago
- Views:
Transcription
 thesis, James Cook University. Access to this file is available from: htt://researchonline.jcu.edu.")

1 This file is art of the following reference: Osborn, Eric Peter (2016) Characteristic wind actions on large flat roofed orous canoies. Masters (Research) thesis, James Cook University. Access to this file is available from: htt://researchonline.jcu.edu.au/44649/ The author has certified to JCU that they have made a reasonable effort to gain ermission and acknowledge the owner of any third arty coyright material included in this document. If you believe that this is not the case, lease contact ResearchOnline@jcu.edu.au and quote htt://researchonline.jcu.edu.au/44649/
2 JAMES COOK UNIVERSITY COLLEGE OF SCIENCE, TECHNOLOGY AND ENGINEERING CHARACTERISTIC WIND ACTIONS ON LARGE FLAT ROOFED POROUS CANOPIES Eric Peter Osborn B. Eng (Civil), B.A., M.I.E.Aust Thesis submitted to the College of Science, Technology and Engineering in fulfilment of the requirements for the degree of Master of Philosohy February
3 Acknowledgements I wish to acknowledge the assistance of my suervisor Associate Professor John Ginger and the staff at the Cyclone Testing Station, Don Braddick, Dennis Smith and research engineer Peter Kim. Acknowledgement is given to Dr John Holmes for his assistance in roviding direction to the study and to the staff at Netro Protection Canoies - Adrian Pradella for his construction of the Models for testing and Claude Grayling and Michael Thomson for their encouragement and sharing of their ractical knowledge. I also wish to thank Michael Barbagallo for his testing of the non-orous model and Marcel Olivotto for his assistance in the exerimental work and rocessing the large amounts of data. Finally thank you to my wife Bronwen for her atience and suort during this study. 2
4 Statement on the Contribution of Others Nature of Assistance Contribution Co-Contributors Intellectual Suort Data Analysis Editorial Assistance Michael Barbagallo Marcel Olivotto Assoc Professor John Ginger Therese Farrell Exerimental Testing Building of Models Wind Tunnel Set U Model Testing Fabric Porosity Testing Adrian Pradella Don Braddick, Denis Smith Michael Barbagallo, Marcel Olivotto, Mitchell Humhreys Dr Matthew Mason 3
5 Abstract Large orous rotection canoy construction has evolved in Australia over the ast 30 years from modest small orchard canoies to large canoies over essential water storages to reduce evaoration and ollution, canoies over large numbers of vehicles for car imorters and exorters, and horticultural canoies of over 40 hectares in area. The canoies have roved to be an effective economical method to rotect increasing numbers and tyes of assets from exosure to sun, hail, wind, birds and insects. Canoy design and construction has evolved from the grass roots with initially no structural engineering design inut. As the value of assets rotected has increased, the request for structural engineering certification of the canoies has become common. To be able to certify the canoy s structure, the certifying engineer needs to confidently be able to redict the wind actions that may occur. In the ast there has been limited structural engineering research undertaken into wind loads on orous structures. The aim of this study is to research the characteristic wind actions normal to large flat roof orous canoies and derive design ressure coefficients. Surface friction actions from wind drag across the surfaces are not researched in this thesis and remain a subject for future research. Four scale models of a tyical orous rotection canoy were constructed for testing in the wind tunnel at the Cyclone Testing Station (CTS), James Cook University, Townsville. The models are of identical geometry, but each of different orosity, 0%, 19%, 38% and 58%. The Models were laced in the CTS boundary layer wind tunnel and rotated through 360 at increments of 15. At each 15 increment, three sets of ressure readings, each for 30 seconds, were taken at a series of ressure tas located on the Model externally and internally. The ressure readings were rocessed by the wind tunnel transducer into non dimensional ressure coefficients and then adjusted for the boundary layer seed at the height of the Model. The ressure coefficient results were imorted into the analysis software Matlab and Excel and then lotted against the geometry of the canoy. This thesis resents these results grahically with ressure coefficients being lotted against distance. The distance is shown non dimensional as ratios of model width and length to model height. It is evident from the external ressure results, that the introduction of orosity into the canoy s roof surface causes significant reduction in the magnitude of the wind actions acting on the roof when comared to the non-orous canoy. In contrast, the introduced orosity does not modify the magnitude of the wind actions on the walls greatly, but does alter the coefficient distribution. Internal ressure coefficients were found to decrease in magnitude across the model away from the windward edge. 4
6 To redict the resultant wind actions on the canoy surfaces, the simultaneous external and internal ressure coefficients were summed and adjusted using a gust factor in accordance with the Standard AS/NZS The net surface ressure coefficient was then lotted for four wind directions in increments of 15 from 0 to 45. The results were then combined to find the eak maximum and minimum ressure coefficients for a ±45 wind direction sector orthogonal to the structure as required in AS/NZS It was found that the introduction of orosity to the models caused significant reduction in the magnitude of normal roof wind actions. Increasing the magnitude of the orosity caused only minor further reduction. The wind actions on the orous walls do not decrease significantly from the magnitudes of the coefficients on the equivalent non-orous walls, but are distributed differently due to the flow of the wind in and out of the canoy interior through the orous wall and roof surfaces. The derived net ressure coefficient results are summarised in tabular form and rovide values for the design of large orous flat roofed canoies under wind load. 5
7 Table of Contents Acknowledgements... 2 Statement on the Contribution of Others... 3 Abstract... 4 List of Figures Introduction Large Protection Canoies Aims and Objectives Net Protection Canoies in Australia and Previous Research The Develoment of Net Protection in Australia Canoy Construction Benefits of Protection Canoies Horticulture Agriculture and Aquaculture Vehicle Protection Water Storage Covers Other alications Relevant Past Research into Loads on Porous Surfaces Wind Loads on Porous Structures (Richards and Robinson, 1999) Design of a Low Cost Wind Resistant Shade Cloth Structure (Donnan et al, 1987) Integrated Structural Design Methodology for Agricultural Protecting Structures Covered with Nets (Briassoulis and Mistriotis, 2010) Mean Wind Loads on Porous Canoy Roofs (Letchford et al, 2000) Wind Pressures on Permeably and Imermeably-clad (Robertson et al, 2002) Review Summary Exerimental Methodology Overview The Boundary Layer Wind Tunnel Selection of Test Model Dimensions Models % Non-Porous Model Model A % Porous Model Model B % Porous Model Model C % Porous Model - Model D Determination of loss coefficient K
8 3.4 Testing of Internal Pressure and Combined Internal and External Pressure Grahical Presentation of the Results Wind Tunnel Test Results Model A, Zero Porosity Model A External Pressure Coefficients for = Model A External Pressure Coefficients for = Model B, 19% Porosity Model B External Pressure Coefficients for = Model B External Pressure Coefficients for = Model B Internal Pressure Coefficients Model C, 38% Porosity Model C External Pressure Coefficients, = Model C External Pressure Coefficients, = Model C Internal Pressure Coefficients Model D, 58% Porosity External Pressure Coefficients for = Model D External Pressure Coefficients for = Model D Internal Pressure Coefficients Summary Comarison of Wind Tunnel Pressure results for the four Models Net Pressure Coefficients for Large Flat Roof Porous Canoies Net Pressure Coefficient Pressure Coefficient,, Roof Surface R, Porous Models B, C and D Model B, 19% Porosity Model C, 38% Porosity Model D, 58% Porosity Review of Roof Coefficients, Pressure Coefficient,, Porous Models B, C and D, Walls W1,W2,W3 and W Pressure Coefficient,, Model B, Walls W1,W2,W3 and W Net Pressure Coefficient., Model C, Walls W1,W2,W3 and W Net Pressure Coefficient,, Model D, Walls W1,W2,W3 and W Comarison of net eak ressure wall coefficient results Conclusions References Aendix A
9 Aendix A A.1 Roof Pressure Coefficient Contour Plots Model B (19% orosity) A1.1 Model B, Roof R,./ Maximum,,,, Wind Directions A1.2 Roof Pressure Coefficient Contour Plots Model B, Roof R,./ Minimum,,,, Wind Directions A2. Roof Pressure Coefficient Contour Plots, Model C (38% orous) A.2.1 Model C Roof R,./ Maximum,,,, Wind Directions A.2.2 Roof Pressure Coefficient Contour Plots Model C roof,./ Minimum,,,, Wind Directions A3. Roof Pressure Coefficient Contour Plots, Model D (58% orous) A3.1 Model D roof,./ Maximum,,,, Wind Directions A3.2 Roof Pressure Coefficient Contour Plots Model D roof,./ Minimum,,,, Wind Directions A4 Wall Pressure Coefficient Plots, Model B A4.1 Model B. (19% Porous) A4.2 Model B Side Walls W2,./,,,, Wind Directions A4.3 Model B Wall W3,./, =,, A4.4 Model B Wall W4, [,], =, A5 Model C, (, Porous) A5.1 Windward Wall W1,./, =,,, A5.2 Side Wall W2,./, =,,, A5.3 Leeward Wall W3,./, =,, A5.4 Side Wall W4,./, =, A6 Model D 58% Porous A6.1 Windward Wall W1,./, =,,, A6.2 Side Wall W2,./, =,,, A6.3 Leeward Wall W3,./, =,, A6.4 Side Wall W4,./, =,
10 List of Tables Table Measured Wind loads, Force Coefficients (Donnan et al, 1987) Table Net Pressure Coefficients for an Emty Free Standing Pitched Canoy Roof with Pitch Sloe (Briassoulis and Mistriotis, 2010) Table Net Pressure Coefficients for a Fully Blocked Free Standing Canoy Roof with Pitch Sloe = (Briassoulis and Mistriotis, 2010) Table Aerodynamic Coefficients for a Flat-roof House (Briassoulis and Mistriotis, 2010)41 Table 3.1 Loss Coefficients K Table 4.1 External Peak and Mean Roof Pressure Coefficients, = Table 4.2 Distribution of External Minimum Pressure Coefficients, = Table 4.3 External Windward Wall W1 Peak Pressure Coefficients, = Table 4.4 External Leeward Wall W3 Peak Pressure Coefficients, = Table 4.5 External Side Wall W2 Pressure Coefficients, = Table 4.6 External Windward Wall Pressure Coefficients, = Table 4.7 External Leeward Wall Pressure Coefficients, = Table 4.8 Peak Internal Pressure Coefficients for Porous Models B, C and D Table 5.1 Summary of Resultant Pressure Coefficients, Roof R, 19% Porosity Table 5.2 Summary of Resultant Pressure Coefficients, Model C, Roof R, 38% Porosity Table 5.3 Summary of Net Pressure Coefficients, Roof R, 58% Porosity Table 5.4 Summary of Roof R Net Pressure Coefficient,,, = ± Table 5.5 Summary of Wall Net Pressure Coefficient, Wall W1,,, = ±. 125 Table 5.6 Summary of Wall Net Pressure Coefficient, Side Walls W2, W4,,, = ± Table 5.7 Summary of Wall Net Pressure Coefficient, Leeward Wall W3,,, = ±
11 List of Figures Figure 1.1 Large Free Sanning Canoy over Orbost Clear Water Storage Figure 2.1 Canoies for Stone Fruit Orchards at Childers, Queensland Figure 2.2 Canoy for Mango Orchard in Northern Queensland Figure 2.3 Dam Cover Construction at The Summit, Queensland Figure 2.4 Vehicle Protection Canoy Figure 2.5 Flat Roofed Canoy Structure Design Figure 2.6 Canoy Net Sagging to the Ground with Accumulated Hail between Tree Rows Figure 2.7 Pitched Hail Protection Canoy for Vehicles Figure 2.8 Orchard Canoy Figure 2.9 Vegetable Seedling Canoy Figure 2.10 Hail Protection Canoy over Seedlings Figure 2.11 Shade Covers to Feedlot Cattle Pens Figure 2.12 Net Canoy over Fish Breeding Facility Figure 2.13 Canoy over Abalone Farm Facilities Figure2.13 Pitched Vehicle Storage Hail Canoy Figure 2.14 Clear-san Protection Canoy over Clear Water Storage Figure 2.15 Irrigation Channel Cover Figure 2.16 Canoy for Waste disosal Facility Figure2.17 Searation of Fluid at a Solid Body s Leading edge Figure 2.18 Fluid Flow through and around Porous Body Figure 2.19 Loss Coefficients for Round Wire Screens (Richards and Robinson, 1999) Figure 2.20 Wind Tunnel Arrangement for Testing of Porous Screens Figure 2.21 Drag Coefficients for windbreak fences (Wind erendicular to the fence surface, = ) (Richards and Robinson, 1999) Figure 2.22 Model Testing Arrangement Figure 2.23 Model Configurations for Testing by Letchford et al Figure Drag and Lift Coefficients for Three Pitches of a Gable Roof at 0 Degrees Azimuth (Letchford et al, 2000) Figure Drag and Lift Coefficients for Three Pitches of a Mono-sloe Roof at 0 Azimuth (Letchford et al, 2000) Figure Cross Section of Model of Flat Roofed Shade Structure Tested by Robertson et al Figure 2.27 Mean Pressure Coefficients on the walls and Roof of a Flat Roof Shade House. 46 Figure2.28 Tyical Roof Suort Member Loads for Porous and Non- Porous Roof Members 48 10
12 Figure 3.1 Turbulence Intensity Profile Figure 3.2 Wind Tunnel Mean Velocity Profile Figure 3.3 Full Scale Large Flat Roofed Porous Canoy used for Scale Modelling Figure 3.4 Scale Model Dimensions Figure 3.5 Taing Points and Identification Grid Figure 3.6 Connection of Plastic Tubes to Taing Tubes Model on Turntable in Wind Tunnel Figure View of Underside of Model A with Taing Tubes Figure % Porous Perforated Sheet for Model B Figure % Porous Model C using a fine Brass Mesh Figure 3.10 Underside of Model C with Taing Inserts and Suort Trusses Figure 3.11 Perforated Sheet with 58% oen area Model D Figure 3.12 Model D on Turntable Figure 3.13 Close u of Model D on turntable Figure 3.14 Loss factor K and mean ustream seed Figure 3.15 Pressure loss coefficient K as a function of Reynolds number (Letchford et al, 2000) Figure 3.16 Internal Pressure Measurement Ta Locations, Model B and Model C Figure 3.17 External Pressure Ta Locations for combined External and Internal Pressure Results, Model B and Model C Figure 3.18 Wall Pressure Measurement Heights h/3 and 2h/ Figure 3.19 Wall and Roof References and Roof Plan View Axes Figure 4.1 Mean External Roof Pressure Coefficient Figure 4.2 Maximum External Roof Pressure Coefficient, C, Zero Porosity Model A, = C ), Zero Porosity Model A, = Figure 4.3 Minimum External Roof Pressure Coefficients, C(, Zero Porosity Model A, = Figure 4.4 Pressure Coefficients for Windward Wall W1 of Model A, = Figure 4.5 External Pressure Coefficients, for Leeward Wall W3 of Model A, = Figure 4.6 External Pressure Coefficient, for Side Walls W2 and W4 of Model A, = 71 Figure4.7 Mean External Pressure Coefficient, C, Zero Porosity Model A, = Figure 4.8 Maximum External Pressure Coefficient, C), Zero Porosity Model A, = Figure 4.9 Minimum External Roof Pressure Coefficients, C(, Zero Porosity Model A, Zero Porosity Model A, = Figure 4.10 Pressure Coefficients for Windward Walls W1 and W2 of Model A, = 73 11
13 Figure 4.11 Pressure Coefficients for Leeward Walls W3 and W4 of Model A, =.. 73 Figure 4.12 Mean External Pressure Coefficient, C, 19% Porosity Model B, = Figure 4.13 Maximum External Pressure Coefficient, C), 19% Porosity Model B, = Figure 4.14 Minimum External Pressure Coefficient, C(, 19% Porosity Model B, = Figure 4.15 External Pressure Coefficients for Windward Wall W1 of Model B, = Figure 4.16 External ressure Coefficients for Leeward Wall W3 of Model B, = Figure 4.17 External Pressure Coefficients for Side Wall W2 of Model B, = Figure4.18 Mean External Pressure Coefficient, C, 19% Porosity Model B, = Figure4.19 Maximum External Pressure Coefficient, C), 19% Porosity Model B, =.. 79 Figure 4.20 Minimum External Pressure Coefficient, C(, 19% Porosity Model B, =.. 79 Figure 4.21 External Pressure Coefficient Windward Wall W1 of Model B, = Figure 4.22 External Pressure Coefficient Leeward Wall W3 of Model B, = Figure 4.23 Mean Internal Pressure Coefficient, C Model B, = Figure 4.24 Maximum Internal Pressure Coefficient, C), Model B, = Figure 4.25 Minimum Internal Pressure Coefficient, C(, 19% Porosity Model B, = Figure 4.26 Mean Internal Pressure Coefficient, C Model B, = Figure 4.27 Maximum Internal Pressure Coefficient, C), Model B, = Figure 4.28 Minimum Internal Pressure Coefficient, C(, 19% Porosity Model B, = Figure 4.29 Mean External Pressure Coefficient, C, 38% Porosity Model C, = Figure 4.30 Maximum External Pressure Coefficient, C), 38% Porosity Model C, = Figure 4.31 Minimum External Pressure Coefficient, C(, 38% Porosity Model C, = Figure 4.32 External Pressure Coefficients for Windward Wall W1,, Model C, = Figure 4.33 External Pressure Coefficients for Leeward Wall W3,, Model C, = Figure 4.34 External Pressure Coefficients for Side Wall W2,, Model C, = Figure 4.35 Mean External Pressure Coefficient, C, 38% Porosity Model C, = Figure 4.36 Maximum External Pressure Coefficient, C), 38% Porosity Model C, = 93 Figure 4.37 Minimum External Pressure Coefficient, C(, 38% Porosity Model C, = 93 Figure 4.38 External Pressure Coefficients,, Windward Wall W1 of Model C, = 94 Figure 4.39 External Pressure Coefficients,, Leeward Wall W3 of Model C, = Figure 4.40 Mean Internal Pressure Coefficient, C Model C, =
14 Figure 4.41 Maximum Internal Pressure Coefficient, C) Model C, = Figure 4.42 Minimum Internal Pressure Coefficient, C(, 38% Porosity Model C, = Figure 4.43 Mean Internal Pressure Coefficient, C Model C, = Figure 4.44 Maximum Internal Pressure Coefficient, C) Model C, = Figure 4.45 Minimum External Pressure Coefficient, Figure4.46 Mean External Pressure Coefficient, C(, 38% Porosity Model C, = 98 C, 58% Porosity Model D, = Figure4.47 Maximum External Pressure Coefficient, C), 58% Porosity Model D, = Figure 4.48 Minimum External Pressure Coefficient, C(, 58% Porosity Model D, =. 100 Figure 4.49 External Pressure Coefficient Windward Wall W1 of Model D, = Figure 4.50 External Pressure Coefficient Leeward Wall W3 of Model D, = Figure 4.51 External Pressure Coefficient Side Wall W2 of Model D, = Figure 4.52 Mean External Pressure Coefficient, C, 58% Porosity Model D, = Figure 4.53Maximum External Pressure Coefficient, C), 58% Porosity Model D, = 103 Figure 4.54 Minimum External Pressure Coefficient, 58% Porosity Model D, = Figure 4.55 External Pressure Coefficient Windward Wall W1 of Model D, = Figure 4.56 External Pressure for Leeward wall W3 of Model D, = Figure 5.1 Maximum Pressure Coefficient,, Model B, Wind direction sector = ± Figure 5.2 Minimum Pressure Coefficient,, Model B, Wind direction sector = ± Figure 5.3 Maximum Pressure Coefficient,, Model C, Wind direction sector = ± Figure 5.4 Minimum Pressure Coefficient,, Model C, Wind direction sector = ± Figure 5.5 Maximum Pressure Coefficient,, Model D, Wind direction sector = ± Figure 5.6 Minimum Pressure Coefficient,, Model D, Wind direction sector = ± Figure 5.7 Maximum and Minimum Net Pressure Coefficient., Model B, Wall W Figure 5.8 Maximum and Minimum Net Pressure Coefficient., Model B Wall W
15 Figure 5.9 Maximum and Minimum Net Pressure Coefficient,, Model B Wall W Figure 5.10 Maximum and Minimum Net Pressure Coefficient,, Model C Wall W Figure 5.11 Maximum and Minimum Net Pressure Coefficient,, Model C Wall W Figure 5.12 Maximum and Minimum Net Pressure Coefficient., Model C Wall W Figure 5.13 Maximum and Minimum Net Pressure Coefficients,, Model D Wall W Figure 5.14 Maximum and Minimum Net Pressure Coefficient,, Model D Wall W Figure 5.15 Maximum and Minimum Net Pressure Coefficient,, Model D Wall W

16 1. Introduction 1.1 Large Protection Canoies Large rotection canoies are a unique develoment of structural ingenuity, where extensive areas of woven net are suorted by re-tensioned high tensile cables sanning large distances frequently in excess of 100m. These resilient, lightweight, tensile systems rovide great structural efficiency leading to significant cost savings and are quickly erected and easily maintained. They rovide a solution to the rotection of large areas of valuable assets from sun, hail, wind and birds. A recent (2013) examle of these clear far sanning structures is the Evaoration Canoy constructed over the Orbost Clear Water Storage for East Gisland Water shown in Figure 1.1. The clear storage area covered by this canoy is 100mx140m or 1.4Ha. The lightweight structure is constructed using 12mm diameter high tensile steel re-tensioned cables with galvanised steel erimeter osts and screw anchors. Figure 1.1 Large Free Sanning Canoy over Orbost Clear Water Storage To design and construct these canoies successfully, an understanding of the critical design actions is essential. The weight of the net cover and self weight of the cables are easily quantified, but the orous structure s resonse to wind is resently little understood with only limited research comleted on wind actions on orous canoies. The large area of net suorted by each cable subject to wind loads is significant, but it is evident from current canoy construction, that the wind actions on the orous surfaces are considerably less than the design wind actions on a non-orous roof. Inadequate understanding of the wind loads has led to structural failures during extreme storm events, causing wide-sread 15
17 damage to the assets under cover. In the ast, the design and develoment of the net canoy structural systems have develoed emirically from a ractice base where systems have been tried and extended, modified and refined without structural engineering design. This has mostly led to resilient and serviceable structural systems, but also at times unredictable structural erformance. The challenge for a structural designer is to show that these lightweight structures are structurally adequate for site design winds secified in the wind loading standard AS/NZS (2011). No guidance on wind actions at this time is rovided in this Standard for the design of orous canoies. Additional information is also required showing how these loads vary with different net orosities and their distribution across the flat roof surfaces and along the orous walls. Previous studies by Richards and Robinson (1999), Donnan (1987), Letchford et al (2000) Wolbers (1999), Briassoulis and Mistriotis (2010), and Robertson et al (2002) rovide research findings into wind loads on orous structures. These studies are reviewed in Chater 2 and it is shown that, while roviding valuable information on wind loads on orous structures, the additional research resented in this thesis has been necessary to investigate wind actions on large orous canoies. 1.2 Aims and Objectives This research aims to establish ressure coefficients that, combined with the site wind velocity, will enable the structural engineer to redict wind actions on tyical enclosed flat roof orous canoies. The resulting design coefficients are intended to form the basis for future inclusion in the design standard AS/NZ Structural Design Actions Part 2: Wind Actions. The research aims also to study the influence of the degree of orosity on the wind actions, comaring wind actions for various degrees of orosity with those found for an equivalent solid structure. This is achieved by carrying out a series of wind tunnel exeriments to obtain measurements of ressure on external and internal surfaces of scale models, reresenting orous canoies with different degrees of orosity. The wind tunnel ressure measurements are analysed and resented grahically. The simultaneous internal and external ressures are combined to obtain net ressure coefficients for the structure s surfaces. The scoe of this study does not include wind surface friction actions, which can be significant due to the large roof areas, and dynamic effects from wind actions. These subjects remain for future study. 16

18 2. Net Protection Canoies in Australia and Previous Research 2.1 The Develoment of Net Protection in Australia Large scale net rotection structures were initially constructed to rotect orchards and cros from hail, wind, temerature extremes, ests and birds. In the ast thirty years these structures have become more sohisticated with new systems and methods being develoed by commercial comanies that secialise in the construction of the canoies. In Australia and New Zealand comanies such as Netro, VP Structures, Suersan and Coastguard Netting have rovided these structures for a wide range of agricultural and horticultural rojects installing tensioned cable structures that suort woven nets with a wide range of shade ercentages and orosities. There are examles of similar canoies in Israel, India and South Africa. The alication of the cable structures has been limited to regions of drier climatic conditions, where snow does not occur. The large san cable structures are limited by their lack of caacity to carry the weight of the snow. Net suort structures required to suort snow loads require stronger nets, more closely saced suort grids and frequently the relacement of the cables with steel trusses leading to significant cost increase. The canoies can be extensive, adated to the roduce being rotected and the irregular layout of the orchard or farm as shown below in Figure 2.1 where the canoies have followed the orchard footrint. Figure 2.1 Canoies for Stone Fruit Orchards at Childers, Queensland One of the first tyes of net rotection for horticulture was the vertical net wind break, constructed to rotect kiwi fruit orchards on the North Island of New Zealand from catastrohic wind damage. The success of these structures lead to extensive analytical and wind tunnel 17
19 research into the wind loads on vertical wind break net structures at Auckland University (Richards and Robinson, 1999). Further research work has continued on their alication to control dust and article disersion from mineral stockiles (Cheng-Peng Yeh et al, 2010). Several New Zealand net rotection contractors gained exerience in the construction of the vertical wind breaks and identified the otential of net rotection canoies, commencing a rotection canoy construction comany in Stanthore, Queensland, an intensive area for fruit growing. This comany develoed a canoy rotection system which evolved into the current Netro Protection Canoies. Similarly, Suersan commenced constructing net canoies in the 1980 s at Flinders, Victoria followed by a number of other contractors. At James Cook University in 1987, Donnan undertook a roject investigating wind ressure on net rotection structures for his Bachelor of Engineering Honours thesis, under the suervision of Professor Walker. This work was later ublished in the roceedings of the First National Structural Engineering Conference (Donnan et al, 1987). The damage to net structures and green-houses by cyclones has been a large cost to the fruit growing industry in the North Queensland region and the need for engineering design was aarent. Donnan, who as a resident in North Queensland had witnessed this damage, constructed a green-house model and tested the normal ressure coefficients for a number of different nets in the Cyclone Testing Station Wind Tunnel. He resented the results in his undergraduate thesis and subsequently in the aer mentioned above. In 1989, the author was required to reort and rovide evidence on the collase of a net shade structure that had been constructed for an orchid grower at Murhys Creek near Toowoomba. This structure had failed during a storm and subsequently there was extensive damage to the valuable imorted orchid tissue stock. Substantial loss was incurred by the grower and the imlications of failure were significant enough to take the claim by the grower against the contractor to the Sureme Court. The evidence that was resented highlighted the lack of significant testing and research into the wind actions on net structures. It also demonstrated the need for correct detailing, articularly with regard to the connection of the net to the cables. The demand by orchardists for rotection canoies continued to increase for rotection of the wide range of fruit grown, including ales, ears, aricots and eaches. Significant losses due to severe hail storms, bird damage and frost had been exerienced, creating the need for an effective affordable rotection canoy system. Contactors commenced constructing flat canoies over orchards using timber osts, high tensile cables and a range of woven net fabrics with varying levels of shade, hail and bird rotection. Figure 2.2 shows a canoy erected for rotection of mangoes. 18


20 Figure 2.2 Canoy for Mango Orchard in Northern Queensland Soon the net canoies were being constructed over a variety of fruit, vegetables and cros at wide sread locations throughout Australia and New Zealand. Abalone growers used the nets to rotect their roduce from birds and the sun. Parafield Air Port in Adelaide installed a net canoy over a large dam used to collect surface water for uming back into ground aquifers. The urose of the canoy was to revent birds breeding in large numbers on the dam and causing a hazard to the aerolane engines. Covers were also constructed over water storages to reduce water evaoration and imrove water quality as illustrated in Figure 2.3. Figure 2.3 Dam Cover Construction at The Summit, Queensland 19

21 A major, current alication is the construction of canoies over vehicle storage facilities. Car imorters and exorters store large numbers of vehicles before distribution to dealers or exort and require rotection against hail and the sun as shown in Figure 2.4. Car retailers have also constructed the canoies to rotect their stock on a smaller scale. Figure 2.4 Vehicle Protection Canoy The variety of uses of cable suorted canoy systems is constantly develoing. The cost effectiveness of the net canoy system is able to be demonstrated by the current (2015) aroximate rates of construction: 1. 12mm quad flat canoy, with walls and roviding bird, moderate hail, wind and 20%-30% shade rotection, cost of construction : $5.50/m. 2. Pitched hail rotection canoy, with hail guard netting and roviding, hail, bird, wind and 30% shade rotection, cost of construction : $12-$15/m. Traditional alternatives to the net rotection canoies include the hooed tunnel green house and steel framed itched structures. These structures necessarily have smaller clear sans and are used in intensive growing situations where retractable roofs and/or controlled mechanical venting may be alied. The costs of these structures gradually increase from $15/m to over $100/m deending on the technology and sohistication of the system. The seed of construction and ease of reair and maintenance are also significant advantages of the net structures. The effectiveness of the net rotection canoies has led to insurers offering growers and car storage comanies reduced remiums against storm damage if the canoies are installed. 20
22 2.2 Canoy Construction The net canoy structures consist of tensioned woven olyester net roofs and walls suorted by a two way grid of re-tensioned cables, which in turn are suorted by steel or timber osts restrained by tie back cables and ground anchorage systems. The nets are manufactured using UV stable olymer threads in weaves that are suitably elastic for tensioning during installation and have adequate strength to carry the wind load and self weight loads. Tyically the cloths when tested in a biaxial tension test have two distinct stages of load versus deformation behaviour. The first stage is usually linear u to a tightening of the threads into knots at their intersections. This then leads to a first ermanent deformation of the net which then, with increased load, moves into a second stage of resonse before tensile failure of the fibres. When the nets are loaded to the second stage of deformation, ermanent stretching of the nets occurs and relacement is often required. The relacement of failed nets and cables can be carried out quickly, roviding a resilient structural system. A wide range of nets is now available from the high orosity low shade nets used for bird rotection to the low orosity shade netting roviding u to 95% shade. The weaves are diverse and have different strength and tensioning characteristics. A number of comanies in Australia, New Zealand and Asia have develoed the caacity to roduce these cloths with a wide range of weaves, colours and strengths. High tensile steel cables that are used in this tye of canoy are frequently of 6.1mm (7x2mm strands), 7.5mm (7x2.5mm strands) or 12.0mm (19x2.5mm strands) diameters and are currently being manufactured in Australia. The minimum breaking forces of the cables are secified as 31kN, 51kN and 124kN resectively. A roject secific retension force, obtained by exerience and ast assessment of the deflection once a net is installed, is alied to the cables with an electric or hand winch. The orthogonal tensioned cables rovide a structural grid onto which the cloth is able to be clied. The nets are rolled out in a nominated longitudinal direction with wires woven into the cloth. The wires are connected with lastic clis to the longitudinal cables, which interact with the cross cables to rovide a two way suort system. A number of load tested cliing and cable slice connection systems are available on the market. The use of clis and slices that do not damage the net s weave and structure is an essential art of the canoy system. Local wind forces on the clis can be assumed to have eak forces greater than the average roof actions across the roof structure in a manner similar to roof screws fixing metal roof sheeting. Helical cable slices, develoed for the ower transmission industry, have been adated successfully, allowing smooth slicing of the cables and avoiding wear oints on the cloth. Generally in the horticultural canoies, timber osts of treated hard wood or radiata ine are used to suort the cable and net structure. The external osts are suorted by tie back or guy 21
23 cables that tyically are installed at 45 degrees to a ground anchorage system. The retension loads alied to the roof and tie back cables act to lace the erimeter osts in comression and drive them into a redrilled ground hole. Sometimes a timber or concrete bearing ad is laced under the osts to sread this load in weaker soils. Internal osts are laced to rovide suort to the cables and reduce deflections to the canoy under the weight of the net and cables. The osts self weight and frictional anchorage in the ground rovide resistance to ulift and can also, where required, be anchored using screw anchors or mass concrete footings. The tie back cable anchors are frequently constructed using a log buried in a trench with a high tensile rod laced through the log and out though the ground for connection of the cable. This system is a convenient method of anchorage, using the materials that are at the site for construction of the suerstructure, but is difficult to assess for structural caacity. The back fill to the trench is tyically moderately comacted by machine wheel rolling. The re-tensioning of the roof and tie back cables ulls the log into the side of the trench engaging the assive ressure resistance of the soil. One roblem that has occurred with this system is when the anchors are installed in oen earth drains surrounding the orchard. The soil becomes saturated during high levels of rain and run-off and the logs have a tendency to be ulled out of the ground. This is avoided by ensuring that there is good drainage away from the anchor locations. More recently, screw ile anchors have been used to anchor the tie back cables. These anchors can be installed to a measured resistance torque and the required ull out caacity achieved. The use of these anchors has led to the need for geotechnical investigations to be carried out so that the screw ile contractor can estimate the length and caacity of the ile system. The installation of these iles into a weathered non cohesive rock material can lead to the torque resistance being achieved, but the ull out caacity being much lower than that required. The flight of the ile will drill into the non cohesive material but not engage with the weathered rock surrounding. Installation roblems also can occur where there are rock floaters or weak wet non cohesive sand. Another alternative in situations where there is shallow rock or non cohesive material is to use bored concrete iers or mass concrete ads. Grouted rock anchors and manta ray anchors have also been used effectively. Frequently, the anchors are the first oint of failure for the structure, with required anchorage caacity of over 10 tonnes often secified. Their failure will lead to a rogressive collase similar to the failure of a tent once one guy roe is released. 22

24 Figure 2.5 shows a canoy designed to fit a secific site, with cable sacing and ost centres chosen to suit the net to be installed and the site design wind. Figure 2.5 Flat Roofed Canoy Structure Design The flat canoies have been found to have good caacity to withstand wind loads and the self weights of the net and cables, but to have limitations when suorting hail loads. Tyically the hail collects in the centre of a rectangular cable suorted anel and the net sags to the ground. This extra load sometimes causes cables to break or tie back foundations to be ulled out of the ground. Oenings in the centre of the net anels to allow the collected hail to fall through have been introduced. A multile itched roof structure with valleys that allow the hail to fall through has been found to be most effective. These structures with their close cable centres and truss tye arrangements have roved to be resilient with low deflection. They also attract higher horizontal wind loads than the flat roofs due to the inclined roof sections. In car rotection canoy construction, the car arking can be lanned so that the hail from the valley falls between the arked vehicles. In orchards, canoies can be constructed with the main cables located over the tree rows, leading to the net sagging to the ground between the trees and minimising damage as shown in Figure


25 Figure 2.6 Canoy Net Sagging to the Ground with Accumulated Hail between Tree Rows Figure 2.7 shows the design of a tyical itched car rotection structure. Column centres and cable grids are reduced from usual flat roof cable sacing and additional horizontal roof drag loads, due to the ridge and valley reetitive arrangement, occur. Figure 2.7 Pitched Hail Protection Canoy for Vehicles The structures develoed for rotection of vehicles have evolved from the rural structures constructed for growers. The car rotection canoies are tyically constructed using steel circular hollow section columns and generally higher wind loads are used for their design. Universal Beam sections are used as cantilever edge suorts where no sace for tie back cables is available. 24

26 Dam and reservoir covers can be installed at ground level above the high water level using the steel cable system and screw anchored erimeter suorts. Free sanning canoies have been constructed with additional external susension cables relacing the suort rovided by internal osts. 2.3 Benefits of Protection Canoies Horticulture A number of horticultural trials have been carried out to assess the effectiveness and cost benefits of the net rotection canoies for the grower. Middleton (2004) found reduced sunburn, imroved fruit colour and skin finish, greater water use efficiency and the elimination of bird damage as benefits of hail netting that may make canoies an economic roosition. Annels et al (2008) reorted trials that comared fruit grown under the canoies to fruit without rotection. It was concluded that benefits from rotective netting over horticulture cros include increased cro reliability, reduced water usage and a reduction in esticide usage. Production benefits included increased ack-out of first grade fruit as a result of reduced environmental damage. The Australian Fruitgrower, in the October 2007 issue confirmed the benefits that might be gained by installing net rotection: reduced sunburn, wind damage, increased bird and est control, hail rotection, insect control and water saving (Netro et al, 2007). The canoy structure tends to have some measure of a greenhouse effect, creating a modified climate or microclimate for the roduce that allows growers to control their roduction and quality and to fulfil their suly quotas with more confidence. Figure 2.8 shows a tyical arrangement for an orchard canoy. The choice of colour and degree of shade will deend on what benefits the grower rimarily wishes to obtain from the canoy. A balance between adequate shade and adequate sunlight for growth is an examle of the outcomes that need to be examined. Figure 2.8 Orchard Canoy 25

27 The develoment of a fruit fly roof net has also added to the otential benefits of a net rotective canoy. The Qld Deartment of Primary industries reorted that netting rotection trials with stone fruit, a highly suscetible cro, roved to be highly effective. Fruit flies and other larger insect ests were excluded. As well as being almost comletely chemical free, the quality of the fruit was found to imrove significantly (DPI, 2008). Similar benefits were found to occur for vegetable growers when net canoies, as shown in Figure 2.9, were constructed. Environmentally suscetible vegetables such as casicums benefited greatly from the rotection structures. An article in the Southern Free Times (Robinson, 2007) described the benefits of growing vegetables inside a domestic net rotection structure clad with the fruit fly netting. Insect rotection, hail rotection and moderating of temerature variation were some of the benefits observed. Additionally the creation of a manageable growing facility meant greater roductivity of home grown roduce, reducing the carbon footrint for a sustainable future. Figure 2.9 Vegetable Seedling Canoy Pitched canoies, as shown in Figure 2.10, similar to the canoies built to rotect vehicles from hail rovide greater hail rotection to roduce. The valleys of the canoy oen u and allow the collected hail to fall through. Beds are laid out so that the canoy falls between the lant beds. 26

28 Figure 2.10 Hail Protection Canoy over Seedlings Retractable net systems for orchards have also been develoed in areas such as Batlow in Southern NSW where snow falls in the winter. The simlicity and economy of the cable and ost construction system allows for adatation to secial climate or cro needs. With the raid growth of the world s oulation and demand for food, it can be guaranteed that the canoies, with their relatively low construction cost, will have a greater role in increasing efficient food roduction. The growers association Horticulture Australia Limited actively romotes the use of the rotective canoies through sonsoring research into effectiveness and alication in Australia. Comleted research rojects include Building Codes and Greenhouse Construction. This study investigates the relevance and alicability of current building standards to rotective structures and a further roject is Investigation of Low Cost Protective Croing for Vegetable Growers Agriculture and Aquaculture A balance between shade and exosure to sunlight has been achieved for feedlot cattle ens, by installing shade covers over sections of the en still allowing the ens to dry out, but also rovide shade for the cattle. This is illustrated in Figure Heat fatigue and sunstroke have reviously been significant issues for feedlot oerators. The benefits to the cattle are described as very ositive in the article in the Australian Lot Feeders Association s ublication (ALFA Feedlotting) where it is noted that greater rovision of shade area for feedlot cattle has roduced the best ossible result for the Australian grain fed beef industry (ALFAFeedlotting, 2005). The $40M feedlot Grassdale in Southwest Queensland constructed in 2008 and since exanded has adoted this aroach and currently there is significant interest in Texas and Arizona, USA. 27


29 Figure 2.11 Shade Covers to Feedlot Cattle Pens Nets have also been constructed over fish roduction facilities, Figure 2.12, roviding rotection from birds that rey on the fish and also reducing evaoration. Figure 2.12 Net Canoy over Fish Breeding Facility Abalone farmers have also constructed nets over their roduction facilities; see Figure 2.13, to rovide shade and rotection from birds. Figure 2.13 Canoy over Abalone Farm Facilities 28

30 2.3.3 Vehicle Protection Large numbers of vehicles are imorted into Australia each year as well as exorted from the local car manufacturing lants. Vehicle imorters receive the cars from the ort and store the vehicles while they are rocessed and reared for delivery to the many car dealershis. Protection from weather extremes including hail is rovided to the high value vehicle stock as shown in Figure Recent hail damage events have lead to an increase in the construction of these canoies. Figure2.13 Pitched Vehicle Storage Hail Canoy A number of vehicle rotection canoy failures have occurred due to a lack of rofessional engineering design, where there has been little understanding of the structural forces resulting from wind actions. Tyically the inadequate sizing of the cables and cable anchorage has led to the failures. It is now standard ractice for local government authorities to request structural certification for these structures. This has made research into the characteristic wind actions on orous structures critical Water Storage Covers The major benefit in using net covers over water storages is reduction in evaoration. A roject by CSIRO Textile and Fibre Technology Division with Gale Industries and East Gisland Water examined the benefits of the net covers (Finn and Barnes, 2007), which included reducing light levels to revent algal and lant growth, reducing wind-borne contaminants and reduction of evaoration. Data was collected from two covered storages and it was found that the water quality was enhanced and water evaoration reduced. Further research at the National Centre for Engineering in Agriculture, University of Southern Queensland was carried out on a cover installed over a dam at The Summit in Queensland. Tests showed that the cover has the otential to reduce evaoration by 70% (Schmidt, 2007) 29

31 With the cost of water increasing and severe fluctuations in season conditions, the reduction of evaoration is becoming increasingly necessary. An increased number of covers for water storages have been constructed in the last two years as shown in Figure Figure 2.14 Clear-san Protection Canoy over Clear Water Storage Irrigation channels, shown in Figure 2.15, have also been covered to reduce evaoration. Figure 2.15 Irrigation Channel Cover Other alications Some other alications that are common include bird rotection canoies over water reservoirs and effluent onds to revent the nesting of birds at these facilities and the construction of canoies over waste disosal facilities, shown in Figure 2.16, to revent litter and dust sreading. Bird aviaries including an eagle enclosure have also been constructed. 30
32 Figure 2.16 Canoy for Waste disosal Facility The develoment of canoy rotection systems for ore and aggregate stockiles in areas where the revention of dust is necessary is also being investigated. Presently vertical wind breaks are used to reduce the wind seeds and dust creation and a structural system to cover a large stockile is currently being develoed. The canoies as shown above, offer a low cost way to rovide rotection over large areas of roduce, stock and other assets. 31
33 2.4 Relevant Past Research into Loads on Porous Surfaces The ressures acting on orous surfaces, when subject to the flow of a fluid, have been investigated by a number of researchers using mathematical and exerimental methods over the ast years. However, the comlexities of this research have resulted in limited oututs for alication in structural design codes. For the most art, the research has concentrated on the flow of the fluid normal to the orous surface. Examles of this research include Annand (Annand, 1953)and Hoerner (Hoerner, 1965) who both investigated the resistance to air flow by wire gauzes, and, following on, research by Richards and Robinson (Richards and Robinson, 1999), who investigated the wind ressures on orous wind breaks. Subsequently Donnan (Donnan et al, 1987), Letchford (Letchford et al, 2000), Briassoulis (Briassoulis and Mistriotis, 2010) and Robertson (Robertson et al, 2002) carried out investigations to determine the wind ressures on orous canoies. Donnan, Letchford and Briassoulis investigated oen canoies without internal ressure, while Robertson modelled an enclosed horticultural structure and measured external and internal ressures. These studies found that the loads acting on the orous elements are influenced by the degree of orosity and the construction (weave of nets) of the orous material, the flow velocity characteristics (magnitude and intensity) and tye of fluid. The angle of the orous element to the flow of the fluid has also been identified as significant, but research into the actions resulting from the flow of a fluid arallel to a orous surface have not been considered in detail, as these forces were not considered significant. Although relatively small, these actions for a fluid flowing arallel to the surface are significant for large flat roof canoies due to the large roof areas on which the actions act. The flow of a fluid around a building structure, termed a bluff structure as distinct from a streamlined structure similar to an aerolane wing, is characterised by forces acting erendicular to and arallel to the structure s surfaces and a disturbance or searation of the fluid at the leading edges of the structure (Holmes, 2007). The velocity of the fluid aroaches zero at contact with the non-orous surface of a structure creating boundary layer flow where the velocity varies from zero at the surface to the free fluid velocity away from the surface of the structure. Figure 2.17 shows the searation of the fluid at the leading edge. 32
34 Figure2.17 Searation of Fluid at a Solid Body s Leading edge The orous surface of a structure will modify the velocity, forces and searation by having both a art of the fluid resisted and deflected by the structure and a art that flows through the surface and into the interior. The wind velocity instead of being reduced to zero by a non-orous barrier is decreased by a factor determined by the roerties of the orous surface as shown in Figure Flow through orous wall Figure Fluid Flow through and around Porous Body Holmes (Holmes, 2007) introduces a orosity factor, which is deendent on the solidity δ (i.e. the ratio of the solid area to the total area of the surface), which leads to a modification of the erendicular (drag) force to, as defined in Equation 2.1., =. (2.1) does not vary linearly with resect to the degree of orosity (Holmes, 2007). It can be exected with a orous canoy structure that the searation at the leading edge (wall and roof intersection) will largely disaear. 33
35 The Reynolds number, a roerty of the fluid flow through the orous material (influenced by the velocity, turbulence and characteristic dimension of the orous surfaces oenings), is identified as influential on the resulting forces on the structure. The Reynolds number is the ratio of fluid inertia forces in the flow to the viscous forces on the solid body or element. Viscous forces are resent in the surface boundary layers that are created at each oening in the orous surface where, for examle with a woven net, forces are generated around each solid element by the flow of air through the net. To investigate revious research on these characteristics of wind loads on orous structures, a review of research on orous structures was carried out resulting in the following research aers concerning wind loads on orous structures being studied Wind Loads on Porous Structures (Richards and Robinson, 1999) This aer written by Richards and Robinson resents the results of research at Auckland University that investigated the wind s actions on vertical orous screens and net wind breaks. This investigation resents analytical and exerimental results obtained from ast research, theoretical analysis, wind tunnel measurements at Auckland University and also field measurements on full scale wind breaks. The fluid ressure on a orous screen erendicular to the fluid flow is characterised by a loss coefficient (k) which is deendent on the screen orosity (β) and also the screen s construction or weave, in the case of a fabric. The orosity is calculated by dividing the screen oen area by the total screen area. The manner of construction of the orous material will vary the flow through the material and the resulting Reynolds number. Previous research by Annand (Annand, 1953), Hoerner (Hoerner, 1965) and the Engineering Science Data Unit, London (Engineering Science Data Unit, 1972) into the magnitude of the loss coefficient are resented and the authors analysis of the geometry of the screens leads to their refinement of the relationshi between orosity and the loss coefficient. This is resented in the Figure 2.19 (Richards and Robinson, 1999). Equation 8 shown grahically is comiled from the results obtained for the loss behaviours at low orosities and at high orosities and is reroduced in Equation 2.2 (Richards and Robinson, 1999). (,Re>2000,round=( ( +(1 /(1 0.75(1. (2.2) = ressure loss coefficient of the orous surface = the surface orosity and 1- the solidity (1-δ) Re = Reynolds Number for screen with round cylindrical elements 34
36 Figure 2.19 Loss Coefficients for Round Wire Screens (Richards and Robinson, 1999) The authors introduce the concet of an effective or reference orosity(β ) based on the loss through a round wire mesh screen. The loss through a differently constructed screen can be related to this value. The ressure loss across the orous screen ( P) can be exressed by the following Equation 2.3 (Richards and Robinson, 1999): P = k0.5ρ (2.3) ρ = Density of air = Volume rate or air er unit area k = Loss coefficient deendent on orosity, tye of construction and Reynolds number The Reynolds number is derived from Equation 2.4 (Richards and Robinson, 1999) R =ρv d/μ (2.4) d = the characteristic screen dimension μ=kinematic viscosity of air The reference characteristic screen dimension d may be defined as the dominant fibre diameter or in the case of a erforated late, the tyical hole diameter, but must be ket consistent when comaring Reynolds number of different screens. Richards and Robinson found that the loss coefficient remained relatively constant for Reynolds numbers greater than 2000, but increased at lower Reynolds numbers, with a ratio of aroximately 3 occurring between 2000 and 100. Woven net fabrics were found to have values of the order of several hundred and loss coefficients increasing with reduced area 35
37 orosity. The loads on the canoy surfaces erendicular to the air flow can be exected to be significant. Wind tunnel tests of the round wire screens were carried out at Auckland University to rovide data comarative to redicted theoretical results. Porous fabrics were tested in a closed 300mm x 300mm wind tunnel to obtain their loss coefficients and then were mounted on a 300mm x 1500mm frame in a 1500mm x1500mm wind tunnel as illustrated in Figure Forces were measured arallel and erendicular to the frame for a range of angles to the wind flow. Figure 2.20 Wind Tunnel Arrangement for Testing of Porous Screens This research found that the drag coefficient on a orous wind break fence, both theoretically and from the wind tunnel test results, decreases almost linearly with the effective orosity of the tested screen. Figure 2.21 shows this variation. The drag coefficient, is defined as the ressure coefficient for the wind normal to the vertical wind break front surface with the ositive direction towards the surface. 36
38 Figure 2.21 Drag Coefficients for windbreak fences (Wind erendicular to the fence surface, = ) (Richards and Robinson, 1999) The various references made in the legend of the figure refer to research results obtained from research by Richardson, Painter, Seginer, Robertson and Hagen testing the wind ressures on freestanding wall structures. The equations refer to equations derived from research and momentum theory. It is seen that there is reasonable correlation between all the results. From these results it can be concluded that the wind acting erendicular to a orous net surface will roduce significant forces that need to be allowed for in the design of the windbreak structure. The angle of the wind on a orous surface was also investigated and the effective loss coefficient (k) was found to be reduced by, where = angle between wind direction and a normal to the surface. This leads to the effective orosity increasing and the loads decreasing as increases from 0 to 90. From this research it can be exected that the drag forces on the walls of a large orous canoy will be greatest when=0. The research has relevance to this roject, defining the key factors that influence the wind resistance of a orous surface as degree of orosity, Reynolds number and direction of wind relative to the orous structure. The results for ressure coefficients on a free standing orous wind break show that wind forces on the structure diminish with increased orosity. Additionally the wind loads diminish as the direction of the wind on the surface varies from erendicular to arallel. The research however does not consider the ressures on an enclosed canoy structure with walls and roof. To be able to understand the wind forces on a large rotective canoy, additional wind tunnel testing of scaled orous canoy models is required that will allow the influence of the wind arallel to the roof and the interaction between resulting external and internal ressures to be investigated. 37
39 2.4.2 Design of a Low Cost Wind Resistant Shade Cloth Structure (Donnan et al, 1987) This research roject was carried out at James Cook University. Wind tunnel testing was carried out on 1:100 scale models of a cable and ost suorted net structure. The full scale size of the structure investigated was 3.25m high and 21 metres dee. Four different orosities were tested: non-orous, 90% shade, 70% shade and 50% shade. The % shade is defined by ercentage of light blockage of the screen and is influenced by the solid area of the net, the net construction and also the net colour. It generally closely aroximates the solidity of the net and is often used as a first estimate for solidity and hence orosity. The models were mounted on a three comonent force balance to allow measurement of the resultant drag and lift forces. The test arrangement is shown in Figure Figure 2.22 Model Testing Arrangement The results are resented as force coefficients on the model s lan surface (lift coefficient with negative value for suction away from the structure s surfaces) and in the model s front surface (drag coefficient with ositive value towards the structure s front surface). The derivation of these values is shown in Equations 2.5 and 2.6. = (2.5) = (2.6) 38
40 Where, = lift and drag forces resectively,, are the rojected lan and frontal areas and the wind ressure at roof height. The results resented in Table 2.1 shows that the overall drag forces increase with orosity, the non-orous model showing the lowest drag. The lift forces however decreased significantly with the introduction of small amounts of orosity, but did not increase significantly with increasing orosity. Table Measured Wind loads, Force Coefficients (Donnan et al, 1987) Drag Lift AS (nonorous) Non-orous % Shade , % Shade , % Shade ,-0.13 These results rovide indication that the lift ressure coefficients on the roof of a large orous flat canoy will be of lower magnitude than the lift coefficients for a non-orous roofed canoy. The results also indicate that the drag ressures on the walls of the canoy will be similar or greater than that for a non-orous windward facing wall. The results resented give the resultant overall forces on the canoy, but do not rovide any information on the distribution of the ressure for examle on the leeward wall of the model. Net ressure coefficients for all the canoy surfaces are required for the structural design of large flat roof canoies and hence further research is required beyond that resented in this aer Integrated Structural Design Methodology for Agricultural Protecting Structures Covered with Nets (Briassoulis and Mistriotis, 2010) Briassoulis and Mistriotis at the Agricultural University of Athens, Deartment of Agricultural Engineering, resent in this aer a comrehensive summary of recent research that has been carried out for the determination of wind loads on orous structures (Briassoulis and Mistriotis, 2010). It is concluded that the wind load reduction for a orous net relative to a non-orous cover is not roortional to the orosity of the net, and additionally deends on the osition of the net relative to the wind flow. A summary of results obtained for wind breaks is resented, referencing Richards and Robinsons work together with ressure coefficients rovided by the Eurocode 1 and ANSI Standard. Also rovided is a summary of results obtained for a orously clad elevated anel under wind load. They comment:... the determination of load requirements reresents the first ste in the design rocedure. However, the calculation of loads for orous agricultural rotecting structures has not been the subject of any national or Euroean standard or code of 39
41 ractice. The aer also emhasises the load carrying caacity and mechanisms of the net, articularly relevant where frequent snow and hail loads are to be carried by the nets, reflecting the different climatic conditions in Greece and Southern Euroe from those in Australia. A comrehensive review of current research into loads on net structures is resented with reference to their own revious work and the work by Richards and Robinson, Letchford et al (2000) and Robertson et al (2002). They resent results from their research for a freestanding itched roof canoy with a roof sloe of20, a height at the ridge of 5m and width of 4.8m. The structure is considered unblocked and blocked underneath. The results have been obtained using numerical methods with Comutational Fluid Dynamics (CFD) numerical modelling and are shown in Tables 2.2 and 2.3. In the tables solidity refers to (1 - orosity). The ressure coefficient -net is the net ressure coefficient for the forces acting on the canoy roof. The windward -net refers to the windward half of the canoy roof and the leeward to the leeward half of the roof. Table Net Pressure Coefficients for an Emty Free Standing Pitched Canoy Roof with Pitch Sloe (Briassoulis and Mistriotis, 2010) Name of Net Solidity % -netwindward -netleeward FRU OMBR BIO OMBR AGREW FILM EUROCODE The ressures increased when the structure was modelled as fully blocked under, where there is solidity under the canoy roof reventing free flow of the wind beneath. It is noted that the Eurocode-1 (CEN, 2005b) rovides values only for non-orous canoies. The non-orous film result is significantly different than the Eurocode value, but it is not commented uon by the authors. Table Net Pressure Coefficients for a Fully Blocked Free Standing Canoy Roof with Pitch Sloe = (Briassoulis and Mistriotis, 2010) Name of Net Solidity % -netwindward -netleeward FRU OMBR BIO OMBR AGREW FILM EUROCODE
42 Briassoulis and Mistriotis also used numerical methods to redict the ressure coefficients on a flat orous roof with a height of 4m and width of 4.8m shown in Table 2.4. The zones referred to in the table G,H,I are defined by Eurocode1 : a) G-zone (x <h/5); b) H-zone(h/5 <x <h); and c) I-zone (h <x), where x is the distance from the windward eave and h is the height of the flat roof. Table Aerodynamic Coefficients for a Flat-roof House (Briassoulis and Mistriotis, 2010) Name of net Solidity (%) -net h/5 G-Zone -net h H-Zone -net >h I-Zone LIBEC SHNT OMBR FILM EUROCODE /0.2 The results show the large reduction in magnitude of coefficients from non-orous to the most orous material, where zero coefficients are redicted. Additionally, for the orous roofs, the ressures do not vary significantly with distance across the roof. The aer also considers snow and hail loads and rooses that for a canoy constructed in a temerate climate, rovision for a minimum hail load should be allowed for when designing the net. This has not necessarily been the case in Australia where large net sans for flat roofs have been chosen to gain site coverage and the net has been reaired or relaced if damaged by hail. As discussed in this chater, there has also been the develoment of itched roof designs which allow the shedding of the hail. Other loads considered are the ermanent self weight of the net and structure and also loads from covered orchard trees within the canoy interacting with the net. The net ermanent loads are given as being in the range of 15g/m to 180g/m. This is similar to the nets used in Australia where some of the higher level shade nets weigh 250g/m. Generally loads from the trees have been ignored in Australia as they are designed with good clearance from the trees, but may be relevant in some orchard conditions. Load combination factors are considered with reference to the Euroean Codes. The aer resents research into the design and load carrying caacity of the net. Non linear finite element analysis can be used to analyse the net s caacity once the net s behaviour under load is tested and hysical roerties for the weft and war directions are determined. The suort of the net with cables is considered and the concet of analysing the cover as an orthotroic membrane system roosed. 41
43 In conclusion the aer rooses that the design methodology resented...can lead to designs at a minimum construction and material cost satisfying simultaneously well established margins of safety in accordance with the relevant rovisions of the Eurocodes. The numerical modelling of a flat roofed shade house has roduced results that can be comared with the wind tunnel testing of the orous models in this roject, but does not rovide adequate information to rovide eak wind load coefficients for the design of a large net canoy. The information on the distribution of the ressure coefficients across the walls and roof are limited and the results rovided are only for a wind direction of =0 normal to the modelled canoy. Additional research to that resented is again identified as being necessary Mean Wind Loads on Porous Canoy Roofs (Letchford et al, 2000) This aer resents the results of research at the University of Queensland where wind loads on free itched and mono-sloe orous roofs of varying sloe were redicted by wind tunnel testing (Letchford et al, 2000). Research was carried out into the loss of ressure which occurs when a normal wind flows through a orous surface. The loss of ressure was comared for a number of commercial net fabrics and erforated metal screens used in the test models. The reresentation of orosity as a hysical ratio of (1- the solid area) divided by the total area is refined by the introduction of an exerimentally based loss coefficient K which is defined in Equation 2.7. This aroach is similar to the work Richards and Robinson reviewed in Section where Richards and Robinson used both theoretical and exerimental aroaches to establish the loss coefficient for a number of materials. K= / (2.7) where K = loss coefficient = ustream static ressure = downstream static ressure U = average aroach velocity = air density Similar area orosity fabrics or screens, which show different ressure losses because of differing construction, are comared with the loss coefficient K. This allows the ressure measurements on the orous erforated mesh models to be related to and comared with commercial shade fabrics. 42
44 The models tested were oen under the roof with no walls or blockage. Figure 2.23 shows the model configurations. Figure 2.23 Model Configurations for Testing by Letchford et al A series of models constructed with steel erforated late surfaces weree laced in the wind tunnel and forces on the articular model were measured by force balance or ressures measured through taing tubes connected to the model. The erforated lates were tested for ressure loss under a normal wind flow and comared with nets of varying orosity which were also tested for ressure loss under normal wind flow. The mean force coefficients measured on the canoy models were lotted against the orosity of the material tested. The forces were exressed as coefficients derived from the mean dynamic ressure at eaves height and the rojected area. The drag coefficients, and lift coefficients are as shown in Figure The results for the itched roof models are shown in Figure Figure Drag and Lift Coefficients for Three Pitches of a Gable Roof at 0 Degrees Azimuth (Letchford et al, 2000) 43
45 For the lowest itched roof of 7 the mean force coefficients vary between -0.1 and 0.1, similar to the numerical results of Briassoulis (Briassoulis and Mistriotis, 2010), although model dimensions differ between the two rojects. Drag values increase significantly with increased itch, but decrease with orosity for the 27 canoy. The lower itches however show an increase in drag coefficient with orosity. The authors used flow visualisation on a 15 gable roof and found... that orosity induces flow through the windward roof reventing reattachment beneath this section of the roof and thereby increasing both the uer surface load through increased stagnation area and lower surface load through revention of ressure recovery after reattachment. It was found that, for steeer itch roofs, the reattachment does not occur so readily. It is also concluded that:... the leeward roof exeriences reduced loading because the searation bubble formed on the uer surface at the ridge line is vented somewhat while the lower surface exeriences a much more significant wake effect from the flow through the windward roof section (Letchford et al, 2000). The influence of wind flowing through the windward section and the venting of the searation bubble at the ridge indicate that orous structures will behave differently from non-orous structures under wind load. The free, mono-sloe roof results are shown in Figure Figure Drag and Lift Coefficients for Three Pitches of a Mono-sloe Roof at 0 Azimuth (Letchford et al, 2000) As the itch reduces and aroaches the flat roof, the drag and lift coefficients reduce to below +/ Significantly the lift coefficients decrease with increase in orosity for all of the itches, for the 7 degree itch, the drag coefficient increases slightly with orosity. The aer does not resent research into enclosed canoies with flat roofs and walls, but rovides insight into a successful methodology of measuring wind forces on orous surfaces. 44
46 The lowest itched roof (7 ) model rovides results that indicate the likely wind action behaviour on a flat roof Wind Pressures on Permeably and Imermeably-clad (Robertson et al, 2002) Robertson et al carried out wind tunnel testing on a shade house with a flat roof of 6m san and 1.68m height and rounded eaves (radius of curvature 0.33m), shown in Figure 2.26 (Robertson et al, 2002). Testing was done at a scale of 1:2 and insect and shade net together with nonorous film were used in the testing. The oen area of the two nets was measured under a microscoe and the ressure loss coefficients for a flow normal to these orous materials were also measured. Curved Region Eave Height (cm) Width (cm) Figure Cross Section of Model of Flat Roofed Shade Structure Tested by Robertson et al The units in this figure are in centimetres and the horizontal and vertical axes show the horizontal and vertical dimensions of the model cross-section. The following mean external ressure results in Figure 2.27 (Robertson et al, 2002) were obtained for a solid film, insect net of 33% oen area and a shade net of 39% oen area. The coefficient is the mean external ressure coefficient measured in the wind tunnel with ositive direction towards the shade house surface. 45
47 Figure 2.27 Mean Pressure Coefficients on the walls and Roof of a Flat Roof Shade House The first section of the grah shows the film and two nets roducing a similar ositive ressure coefficient of 0.5 to 0.6 on the wall of the model. At the curved eaves area there is significant change from the drag ressure coefficients measured on the wall, with the maximum ulift ressure coefficient for the solid film being -0.7 on the roof after searation of the wind from the structure occurs. The roof ressure coefficients for the insect and shade net reduce to within +/- 0.1, showing little searation effects at the wall roof intersection. The authors conclude: the rincial findings were that the high external suctions develoed over arts of each structure when imermeably clad were destroyed when ermeably clad, resulting in virtually no net ulift. Additionally the ositive drag ressures on the wind ward wall was found to be virtually unaffected by the orosity. The internal ressure coefficients measured were found to be consistently small for the two net structures (< 0.05), although it is commented that there may have been a bleeding of the internal ressure through the gable ends due to the exerimental set u. The authors comment that further exerimental work needs to be carried out to rovide reliable data for the design of orous clad structures. This would include varying the wind direction relative to the orous clad structure, additional measurement of the internal ressure to ensure no leakage of air is occurring and also more roof ressure measurements. 2.5 Review Summary From the research reviewed, the wind velocity at a orous surface is reduced, but not to zero as with a non-orous surface. The flow of air through the surface to the interior of a canoy creates an internal ressure, and the difference of this internal ressure to external ressure at the canoy s external surface determines the net wind action normal to the surface. The reduction of the air velocity through the orous surface is influenced by the orosity of the structure s 46
48 material, the material s construction, or in the case of nets, the weave, and the Reynolds number generated by the air flow through the material. Porosity is both resented in terms of measured oen area divided by total area and also in terms of a loss coefficient which also takes into account the construction of the orous material. Richards and Robinson determine the loss coefficient both theoretically and exerimentally and also resent the concet of an equivalent orosity referenced to the loss coefficient of a round wire screen. Letchford et al determined exerimentally the loss coefficients for the various model screens used in their wind tunnel research and comare these loss coefficients with those of commercial orous fabrics. Donnan, Robertson et al and Letchford et al have carried out wind tunnel testing to measure wind actions on constructed scale models. Donnan s model was a flat roofed oen structure, whereas Letchford et al investigated monosloe and itched roof models of tyical greenhouse structures. Robertson et al investigated an enclosed green house model measuring both external and internal ressure coefficients. Briassoulis and Mitriotis used numerical comuter modelling to investigate the ressure coefficients on a range of mono sloe and itched orous structures. The results from the wind tunnel testing and numerical modelling, show that orosity leads to significant reduction in wind actions on the roof of a flat or low itched roofed structure. Mean lift forces on the flat or low itched orous roofs tended towards zero, whereas the wind actions on the walls were found to be of similar magnitude to the actions on a non-orous cladding. The large canoies being studied by this roject have large cable sacing and sans, generating significant cable forces and dislacements under small wind ressures. Although the wind actions on the orous roof surfaces can be exected to be small in comarison to the ressures on a non-orous roof surface loaded in the same conditions, the large roof tributary load areas to the cables generate large actions on the structure. This is illustrated in Figure 2.28, showing a 14m saced cable, with design wind ressure of 1kPa and ressure coefficient of -0.1, resulting in a distributed load q = -1.4kN/m. This can be comared to the wind load that acts on a urlin suorting a steel clad roof with design wind ressure = 1kPa, ulift ressure coefficient of -1.1 and urlin sacing = 1.2m, roducing a similar force/m of -1.32kN/m. If the orous roof design coefficient for the cable load varies from -0.1 to -0.2 or -0.05, it can be seen that the total load is halved or doubled, illustrating the sensitivity of the load to very slight changes of the ressure coefficient. 47
49 Figure2.28 Tyical Roof Suort Member Loads for Porous and Non- Porous Roof Members The gas in current research indicated by the literature survey include: The research reviewed has only been carried out on relatively small greenhouse structures with much larger height to breadth ratios than are resent in the large flat canoies. There are no in-deth studies of the resulting wind actions on large flat orous roofs. There are no results for wind actions on sloing walls which are revalent in the large rotective canoy industry. The research resents the measured mean ressure coefficients rather than the eak maximum and minimum coefficients. There is limited measurement of internal ressures in enclosed canoies and no study of the variation of internal ressure along a orous structure s interior. There is no examination of the resulting actions from the wind direction changing through 360 This roject seeks to fill these gas by wind tunnel scale model testing of a series of flat roofed canoy models with varying orosity. 48
50 3. Exerimental Methodology 3.1 Overview In this study, the characteristic distribution of wind actions on large flat orous canoies has been investigated by testing scale models of a tyical rotective canoy in the Boundary Layer Wind Tunnel at the Cyclone Testing Station, James Cook University. Four models of identical geometry were constructed, each with different cladding to vary the orosity, but maintaining identical dimensions. Pressure tas were fixed to the external surfaces of the models and several tas installed inside the model to measure internal ressure. The tas were connected to the wind tunnel s Dynamic Pressure Measurement System (DMPS) with tuned lastic tubes. A series of test ressure measurement runs on each model was then carried out, with the wind direction relative to the model being varied in 15 increments. The ressures recorded by the DMPS were analysed and adjusted for the wind velocity at the model s roof relative to the wind velocity measured at a height of 500mm. Mean, maximum and minimum ressure coefficient results are resented grahically and analysed for changes in magnitude, due to the different orosities of the models. Net ressure coefficients on the models surfaces are then derived by finding the eak values of the sum of simultaneous external and internal ressures at each ta location using the time based history of the data recorded. These values are divided by a gust factor squared to rovide a seudo-steady coefficient value consistent with the design coefficients secified in AS/NZS (2011). The coefficients are reviewed and conclusions drawn on the behaviour of large orous flat roof canoies under wind actions. 3.2 The Boundary Layer Wind Tunnel The atmosheric boundary layer wind tunnel is located at the Cyclone Testing Station in the College of Science, Technology and Engineering at James Cook University (JCU). The 22.0m long tunnel has a cross section of 2.0m high x 2.5m wide. A 2.43m diameter 5 blade fan is located at the downstream end of the tunnel with a diffuser. The fan is owered by a 45kW Brook squirrel cage induction motor with a variable seed drive. The atmosheric boundary layer was modelled to a length scale of 1/250 by installing a 250mm tri board and caret to the tunnel floor to rovide a suitable roughness to reresent a Terrain Category 2 as defined in AS/NZS (2011). The turbulence intensity of the wind tunnel set u is shown in Figure 3.1 with comarison to the turbulence intensity rofile secified in AS/NZ for terrain category 2, where 49
51 turbulence intensity is defined as the ratio of the fluctuating comonent of the wind seed to the mean seed. Height (m) AS/NZS Turbulence intensity Figure 3.1 Turbulence Intensity Profile Figure 3.2 shows the wind tunnel mean velocity rofile with comarison to AS/NZS terrain category 2 rofile. Height (m) AS/NZS Uz/U50 Figure 3.2 Wind Tunnel Mean Velocity Profile A length scale = and a velocity scale = are used for the exeriments. This gives the time scale calculated by Equation
52 = = = (3.1) 2.5 For a 30 second test, the modelled wind duration T is found by Equation 3.2. T = =50 minutes (3.2) A itot tube is located 500mm above the floor ustream of the model to measure the static and total head for calculation of wind velocity in the tunnel. The models, built at the scale 1 250, were individually laced on a turntable just ustream of the fan. The turntable is able to rotate 360 to test multile wind directions and was rotated in increments of 15 for the tests. The ressure taing tubes installed on the models were connected with tuned 1.5mm lastic tubes to the transducer, the Turbulent Flow Instrumentation (TFI) DPMS. The DPMS houses a ressure module of 64 ressure channels, each with its own ressure transducer. The system is caable of samling data at very high frequency. The ressure transducers and tubing frequency resonse for the data acquisition system are calibrated by the manufacturer. All ressures were filtered at 625Hz and samled simultaneously at 1250Hz for 30 seconds. The minimum, mean, maximum and standard deviation of the wind ressure at each ta was then calculated by the recording software. Performing three tests at each location allowed for a mean of each of these to be calculated and rovides a measure of variability. The results were normalised using the wind tunnel mean velocity rofile, converting from the velocity measured at 500mm above the floor of tunnel to the velocity at roof height of model (25mm) using the relationshi given in Equation 3.3. = (3.3) C = ressure coefficient at required height (roof of model, 25mm) C = ressure coefficient at 500mm height Normalising factor (Velocity ratio) for 25mm height x = The mean, maximum and minimum ressure coefficients were found using Equation 3.4. C ) ( =, C (3.4) ρu ρu h ) =, C ( ρu = h h ) (,, are mean, maximum and minimum ressures 51
53 ρ = Density of air U h = Mean wind seed at roof height of 25mm in model scale Chater 4 resents the external and internal ressure coefficient results grahically for = 0 and 45 wind directions. The results are investigated for the influence of the orosity on the resulting wind ressure coefficients and comared with the non-orous model. 3.3 Selection of Test Model Dimensions Net rotection canoies have frequently a footrint of several hectares, fitting the land area of asset to be rotected. A full scale structure of roof area 196mx196m and 6.25m high was selected as a tyical canoy for modelling after investigating the dimensions of large rotective canoies constructed in Australia. These dimensions also suit the tyical 14m roof cable sacing often used in ractice to accommodate the common 14m net roll width. Walls inclined at 45 were adoted, a tyical arrangement which allows the side netting to be suorted by the inclined tie back cables, creating additional rotected sace. The inclined walls have the added benefit of roviding imroved aerodynamic characteristics of the structure comared to vertical wall construction, leading to reduced wind actions on the structure. The height of 6.25m is tyical for large flat canoies and allows room for mobile machinery to oerate and the growth of lants as well as good air circulation. The ratio of height to width and length is small (0.031), a significant feature of the large net structures. The geometry of the full sized structure modelled is shown in Figure


54 6.25m Figure 3.3 Full Scale Large Flat Roofed Porous Canoy used for Scale Modelling This selected canoy structure was modelled at a scale of 1:250. This gives a model roof size of 784mm square and a height of 25mm as shown in Figure 3.4. The overall footrint including the sloing walls is 834mm x 834mm which was a suitable size for lacement in the wind tunnel. The wind direction for the testing is shown as the angle. 53

55 Pressure tas =0 Figure 3.4 Scale Model Dimensions The symmetry of the models allows the taing of one eighth of the model, which can then be rotated to achieve ressure test results for the full roof and wall areas. The first non-orous model was taed across one quarter of the model and the three orous models taed across one eighth. Figure 3.5 shows the detailed dimensions of the locations of the taing oints and labelling. A grid system of alhabetic letters and numbers was set u to identify each taing oint e.g. A5. This allowed the lastic connecting tubes to be tagged with the taing oint name and be identified at the numbered transducer channel. Results then could be identified and related to the correct taing oint on the structure. 54


56 Figure 3.5 Taing Points and Identification Grid The external ressure measurement arrangement allows u to 62 taing oints on the external surface of the model and one oint internally, located centrally on the model floor, to be connected and measured during one run of measurements. One additional measurement channel is used to measure the wind seed ustream from the model at 500mm above the wind tunnel floor using the itot tube installed for this urose. Two searate test runs of the model were required to allow testing at all the taing oints in the eighth sector. The oints were distributed across the sector with a greater density of oints close to the roof edge to examine edge searation effects and associated higher external ressures. Two rows of tas were located on the walls at one third (8mm) and at two thirds height (16mm). The model was rotated through 360 degrees in the tunnel in increments of 15 and tested three times at each location. This sequence of tests was reeated twice roviding six sets of results for each ta location at each increment of rotation. 55

57 The model was laced on the turntable and the taing tubes, welded onto the Model surfaces, were connected via the tuned lastic tubes to the transducer channels. The base of the Model was sealed with the taing tubes connected to each side of the non-orous floor to ensure that no air flowed through the base of the model. Initial tests on the orous models showed that leakage through the bottom had a significant effect on the results with the air flow through the model being diverted out the floor oening and altering the internal ressure conditions. Large downward forces were measured on the roof surface. Figure 3.6 shows the model on the turntable in the wind tunnel and the connection of the lastic tubes to the taing oints. 3.3 Models Figure 3.6 Connection of Plastic Tubes to Taing Tubes Model on Turntable in Wind Tunnel Four models were constructed to the dimensions described in Section 3.2 with varying orosity. These orosities were 0% (non-orous), 19%, 38% and 58% % Non-Porous Model Model A Model A was constructed from non-orous ersex and ressure tas drilled and tubes then glued in lace as shown in Figure 3.7. This model was tested for comarison with the orous models and also with the ressure coefficients for large flat roofs given in the design standard AS/NZS :(2011). 56


58 Figure View of Underside of Model A with Taing Tubes The model was sealed around the edges so that no internal ressure variation was generated by the wind in the tunnel. Only external ressure measurements were recorded % Porous Model Model B The 19% model tested was constructed from a erforated steel sheet to the same dimensions of the non-orous model A. The oen area orosity was calculated as 19% with 6.3mm diameter holes at 13.8mm centres. A section of the erforated sheet is shown in Figure 3.8. Figure % Porous Perforated Sheet for Model B 57


59 The taing tubes were welded to the solid sections of the late surface and connection of the lastic connecting tubes was aided by the rigidity of the late model % Porous Model Model C The 38% orous model tested was constructed using a fine brass mesh, which rovided a similar material to a woven net with a regular grid of round strands, and is shown in Figure 3.9 and Figure The orosity by oen area was measured as 38%. Taing tubes were brazed onto the mesh, which was a time consuming exercise. The flexibility of the mesh made connections of the PVC connecting tubes slow and several of the small insert cylinders were ushed through the mesh during the connection rocess. The mesh was suorted by light metal trusses. Figure % Porous Model C using a fine Brass Mesh Figure 3.10 Underside of Model C with Taing Inserts and Suort Trusses 58
 tested the mesh used for this model in a circular 600mm diameter wind tunnel at James Cook University and found that the ressure was reduced by 32% across the screen by")
60 The fine brass mesh used in the model is constructed with wire of diameter 0.18mm and with aertures of 0.315mm width. Barbagallo (Barbagallo, 2011) tested the mesh used for this model in a circular 600mm diameter wind tunnel at James Cook University and found that the ressure was reduced by 32% across the screen by measuring the difference between the static ustream and downstream ressures. The ressure loss factor was calculated using Equation 2.7( refer Section 2.4.4) as resented by Letchford et al (2000). This ressure dro ercentage is not directly alicable to the model and its testing, due to the model being subject to external wind actions arallel to the roof surface and an internal ressure from the wind flow through the orous surfaces into the interior of the model. The inclination of the model walls at 45 also varied from the vertical mesh arrangement in the 600mm diameter wind tunnel. The loss coefficient of the brass mesh can comared to the loss coefficients of other orous materials including commercially used net fabrics and the erforated metal screens used on Models B and D % Porous Model - Model D A second model made from erforated steel sheet, with a greater oen area ercentage giving a orosity of 58%, was tested. The holes are 8mm in diameter and at 10mm centres on a 60 angle between rows as shown in Figure Figure 3.11 Perforated Sheet with 58% oen area Model D Figure 3.12 shows Model D laced on the turntable in the wind tunnel and Figure 3.13 shows a close u of the corner of the model. 59

. 3.")
61 Figure 3.12 Model D on Turntable Figure 3.13 Close u of Model D on turntable This model has significantly higher orosity than the three other models tested (0%, 19% and 38%) Determination of loss coefficient K A series of measurements of ressure reduction across a number of commercial net fabric and the erforated metal screens used for Models B and D was undertaken by Mason at the University of Queensland in collaboration with the author and Netro (Mason, 2016). The 60
62 measurements were carried out in the School of Civil Engineering s wind tunnel which is an oen loo facility with two adjoining 760mm x 760mm x 1180mm test sections. A 25mm wide suort frame was installed between the two test sections to mount each of the orous materials onto. The mounting frame has the effect of causing flow contraction due to the air assing through the smaller cross sectional area of the frame and varying the mean ustream and downstream wind seeds. This flow contraction varies from the testing referred to by C.W. Letchford et al, and referred to in of this thesis and also the testing by Barbagallo of the Model C gauze fabric where no similar contraction occurred. The loss coefficient K is found by Equation 3.5 which allows for the change in mean wind seeds u and downstream of the frame. K= (,, ( / / (2.7) where K = loss coefficient P = ustream static ressure P = downstream static ressure U = measured uwind wind seed U = measured downwind wind seed = air density 61
63 The averages of the exerimental results are shown in Table 3.1 with the additional brass gauze (used in Model C) loss coefficient result from the testing at James Cook University by Barbagallo Table 3.1 Loss Coefficients K Porous Material K M1, Model B erforated sheet 32 M2, Model D erforated sheet 2.5 Brass Gauze 0.90 F1, 95 % shade cloth 51 F2, Heavy quad cattle shade 7.2 F3, 12mm Quad fabric 0.64 F4, 16mm Quad fabric 0.43 F5, 24mm Quad fabric 0.43 F6, 20mm bird net fabric 0.27 The results show that the loss coefficients for the Model B sheet (orosity by measured area of 19%) and Model D (orosity by measured area of 58%) are less than the coefficient for the 95% heavy shade cloth and slightly greater than the heavy cattle shade cloth with aroximately 70% shade. The loss coefficient for the brass gauze is significantly less than that of the Model D erforated sheet which has higher area orosity, indicating that the wind flow through the mesh is greater than the erforated sheet. The loss coefficient K results are lotted against ustream wind seed U in Figure Figure 3.15 resents the ressure loss coefficients found by Letchford et al (2000) lotted against the material s Reynolds number. 62
64 Figure 3.14 Loss factor K and mean ustream seed Figure 3.15 Pressure loss coefficient K as a function of Reynolds number (Letchford et al, 2000) The ressure loss coefficient results shown in Figure 3.15 are of a similar order to the results in Figure 3.14 but demonstrate the variability of the loss coefficient for different materials and fabric weaves. 63
65 The loss factors resented can be used when alying the exerimental results resented in this thesis to the design of commercial fabric structures that are constructed from the net materials referred to above (F1 F6). 3.4 Testing of Internal Pressure and Combined Internal and External Pressure It was identified that the internal ressure varies in magnitude along the model due to the wind assing through the orous models. Initially just one internal ressure measurement was taken in the centre of the model floor, but to obtain better understanding of the changing internal ressure and more accurate combined external and internal ressure results, testing of the internal ressure distribution across the floors of two of the orous models, Model B and Model C was undertaken. The arrangement across one-eighth of the model is shown in Figure As for the external ressure measurements the model, was rotated through 360 to obtain a full model distribution of internal ressure. Figure 3.16 Internal Pressure Measurement Ta Locations, Model B and Model C To measure the simultaneous internal and external ressures on Models B and C the number of external tas were reduced so that there was less interference to the internal wind flow from attached tubes. Figure 3.17 shows the arrangement of external tas used and also references the internal ta measurement with which each external ta measurement was combined to obtain net ressure resultant values. 64
66 Figure 3.17 External Pressure Ta Locations for combined External and Internal Pressure Results, Model B and Model C 3.5 Grahical Presentation of the Results In Chater 4, the external roof ressure coefficient distributions for 0 and 45 directions are resented in colour contour lots of the comlete roof surface, using the Matlab software to generate the lots. The horizontal and vertical axes of the lots are to the model dimensions divided by the height of the model h, creating a non-dimension lot from the model results. The ressures are shown by different graded colours referenced to a colour scale adjacent to the lot. In all of the ressure contour lots for the roofs of the four models, red indicates the maximum value and blue the minimum value as shown on the side bar with intermediate colours indicating the grading across the surface. The wall ressures were measured across the walls at two vertical heights, h/3 and 2h/3 as shown in Figure 3.18 and are grahed with the vertical axis showing the ressure coefficient and the horizontal axis showing the dimensionless distance referenced to height h across the wall. The walls are referenced as W1, W2, W3 and W4 as shown in Figure The roof is referenced as R. The ositive directions of the wall drag coefficients and the roof lift coefficients are also shown 65
67 () () Figure 3.18 Wall Pressure Measurement Heights h/3 and 2h/3. y x =0 Figure 3.19 Wall and Roof References and Roof Plan View Axes In Chater 5, the net ressure coefficients, are derived from the internal and external measurements and are resented in a grahical form showing the distributions across the models surfaces. These are comared between models and commentary is rovided on the trends and variations with increasing orosity. In Aendix A, the contour lots of the net eak directional ressure coefficients for the three orous models B, C and D are resented for = 0, 15,30 and 45 wind directions. In Chater 6 conclusions are drawn from the research, resenting the key results and identifying areas for future research into large orous canoies. 66
68 4. Wind Tunnel Test Results The measured external ressure coefficient results for the four models are resented grahically for wind directions =0 and=45. Measured internal ressures are also resented and comarisons of the results between the four models are made. The exerimental results obtained include also the external ressure coefficient measurements for =15 and =30 which have been used in Chater 5 for the derivation of design coefficients. 4.1 Model A, Zero Porosity Model A External Pressure Coefficients for = The test results for the non-orous Model A based on the wind seed at 500mm height in the tunnel were exorted into an Excel sread sheet and normalised as discussed in Chater 3, by factoring the results for the lower wind seed at the height of the model (25mm). Figures 4.1, 4.2 and 4.3 show the contour lots of the mean, maximum and minimum external roof ressure coefficients that were obtained for = 0 on roof surface R. As discussed in Chater 3, vertical and horizontal axes show distance in increments of the height h with the x and y dimensions of the model divided by the height h. This is tyical for all contour lots resented. The right side bar shows the ressure coefficients with red denoting the highest ositive value and blue the highest negative. Distance (y/h) C = Figure 4.1 Mean External Roof Pressure Coefficient Zero Porosity Model A, = C, 67

69 Figure 4.1 shows that the highest mean suction coefficient occurs at the windward edge and then raidly reduces with distance away from the front edge. The mean value reduces to a value of -0.2 over a distance of aroximately 6h and then remains constant until there is a slight increase 2h away from the leeward edge. The downward ressure coefficients shown in Figure 4.2 vary from 0 to 0.6 with a reduction at the windward and leeward edges. At the windward edge there is zero downward ressure recorded. Distance (y/h) C ) = Figure 4.2 Maximum External Roof Pressure Coefficient, Model A, = C ), Zero Porosity Figure 4.3 shows a minimum ressure coefficient distribution similar to the mean ressure coefficient contours, but with higher values and no increase at the leeward edge. The values eak at the windward edge and reduce over a distance of aroximately 5h, then remain constant across the surface. This can be attributed to the searation of the wind flow at the wall and roof intersection. The 45 wall sloe makes the searation less abrut than for a vertical wall. The distribution is similar to the design minimum ressure secified for a large flat roof in AS (2011). 68

70 Distance (y/h) C( = Figure 4.3 Minimum External Roof Pressure Coefficients, A, = C(, Zero Porosity Model The wall ressure measurements were taken at vertical heights of h/3 and 2h/3 on the wall surface with 45 sloe. The results for the mean, maximum and minimum wall ressure coefficients are shown in Figures 4.4, 4.5, and 4.6 for Walls W1, W3 and W2. Figure 4.4 Pressure Coefficients for Windward Wall W1 of Model A, = 69
71 Figure 4.4 resents the ressure coefficients on the windward wall W1 across half the wall s width (the distribution being symmetrical around the walls centreline) with a highest magnitude of +2.3 at a height of 2h/3. The ressures are relatively evenly distributed across the wall width and increase in magnitude slightly at 2h/3 from the maximum magnitudes at h/3, due to the wind seed increasing as it aroaches the wall-roof intersection. The mean values show an even distribution of inward ressure with mean values slightly higher at 2h/3. Minimum suction ressure coefficients are shown, varying between -0.2 and -0.6, demonstrating that the inclined walls are subject to both ositive and negative ressures for this wind direction. The ositive ressure coefficients on the leeward wall W3 shown in Figure 4.5, vary from 0 to The mean coefficients vary between -0.6 to -0.3 suction. The minimum suction coefficients show a distribution with eak magnitudes of -1.8 over the distance 2h from the wall corner reducing to -1.0 over the next 2h distance and then averaging -0.8 across the middle section of the wall. Figure 4.5 External Pressure Coefficients, for Leeward Wall W3 of Model A, = The side wall coefficients resented in Figure 4.6 for the full length of the wall, as symmetry of the ressure coefficient results around the wall centreline does not aly, commence with the highest suction coefficient at the windward corner of -2.4 and diminish after a distance of 2h along the wall to There is a slight increase in suction at the leeward corner. The mean coefficients are suction ressure coefficients, reducing gradually along the wall from windward to leeward corners. The maximum ressure coefficients are relatively constant along the wall with a slight increase in the measurement at 2h/3 at the leeward corner. 70

72 Figure 4.6 External Pressure Coefficient, for Side Walls W2 and W4 of Model A, = Model A External Pressure Coefficients for = The ressure coefficient contour lots for the mean, maximum and minimum ressures on the roof surface R of the non-orous Model A for =45 wind direction are shown in Figures 4.7, 4.8 and 4.9. Distance (y/h) C =45 Figure4.7 Mean External Pressure Coefficient, C, Zero Porosity Model A, = 71
, Distance (y/h) C( =45 Figure 4.")

73 Distance (y/h) C) =45 Figure 4.8 Maximum External Pressure Coefficient, Zero Porosity Model A, = C), Distance (y/h) C( =45 Figure 4.9 Minimum External Roof Pressure Coefficients, C(, Zero Porosity Model A, Zero Porosity Model A, = The eak minimum and maximum coefficients are similar in magnitude to the results for 0 wind direction and the mean coefficients slightly less. The suction values reduce with distance raidly away from the two windward walls W1 and W2 and the downward values vary between 72
74 0 and 0.6. The external ressure coefficients on the windward walls W1 and W2 and leeward walls W3 and W4 subject to the 45 wind are resented in Figures 4.10 and Figure 4.10 Pressure Coefficients for Windward Walls W1 and W2 of Model A, = The mean ressure coefficients on walls W1 and W2 vary from +0.4 at the windward corner to 0.0 at 1h before the leeward corner. There is a slight increase then at the leeward corner. This trend is shown also in the maximum ositive ressure coefficients varying from 2.0 at the windward corner to 1.0 at a distance 1h from the leeward corner. The suction values are relatively constant across the length of the wall averaging Figure 4.11 Pressure Coefficients for Leeward Walls W3 and W4 of Model A, = 73
75 The ressure coefficients on the leeward walls W3 and W4 show a reversal of the trends shown on walls W1 and W2. The minimum and mean suction coefficients are highest at the windward corner reducing gradually to aroximately the halfway oint of the walls width and then remaining relatively constant along to the far corner. The maximum ressure coefficients are smaller in magnitude and are lowest at the windward corners. 4.2 Model B, 19% Porosity Model B External Pressure Coefficients for = The mean, maximum and minimum external ressure coefficients for the roof surface R are shown for the 19% orous Model B in Figures 4.12, 4.13 and 4.14, for =0. Distance (y/h) C = Figure 4.12 Mean External Pressure Coefficient, 19% Porosity Model B, =. C, The mean ressure coefficients vary from to in comarison to -1.6 to 0 for the nonorous Model A. Model B also shows a more gradual reduction in ressure from the windward edge comared to Model A. 74


76 Distance (y/h) C) = Figure 4.13 Maximum External Pressure Coefficient, C), 19% Porosity Model B, =. The maximum downward external roof ressure coefficients shown are of similar magnitude to the non-orous Model A, ranging from 0 to At the windward edge zero downward ressure was measured, similar to Model A. Distance (y/h) C( = Figure 4.14 Minimum External Pressure Coefficient, 19% Porosity Model B, =. C(, 75
77 The minimum external ressure coefficients shown in Figure 4.14 have a similar distribution to the mean values. The largest magnitude at the windward edge (-1.70) is significantly less than the eak coefficient (-4.5) measured at the windward edge of Model A, demonstrating the reduced searation of the wind at the edge of the orous model. The Model B wall external ressure coefficient distributions are shown in Figures. 4.15, 4.16, 4.17, with ressure coefficients measured at heights h/3 and 2h/3 lotted vertically against distance across the model horizontally. The lots for Walls W1 and W3 resent ressure coefficients for half the distance across the model only. The lots are symmetrical around the centre line of the model. Figure 4.15 External Pressure Coefficients for Windward Wall W1 of Model B, =. Figure 4.15 shows the eak wall ressure coefficient of 2.2 occurs at h/3 height and reduces to a eak value of 1.8 at 2h/3. Peak suction coefficients of -1.0 were measured at 2h/3 and the mean values vary between 0 and 0.5. The eak maximum coefficient 2.2 is similar to the eak measured on Model A (2.3) indicating that the orosity has not influenced significantly the ressure coefficients. 76
78 Figure 4.16 External ressure Coefficients for Leeward Wall W3 of Model B, =. The Wall 3 coefficients in Figure 4.16 show minimum coefficients of -0.7 to -1.1, less than the eak suction value of -1.5 measured on Model A. The mean coefficient distribution is similar to the Model A mean values and the maximum coefficient 0.3, is equal to the maximum for Model A. The side wall W2 ressure coefficients are shown in Figure 4.17 Figure 4.17 External Pressure Coefficients for Side Wall W2 of Model B, = 77
79 Side wall coefficients vary from -1.3 to The mean varies between 0 and Peak values occur at the windward corner end of the wall similar to non-orous Model A (-2.5) but of lower magnitude (-1.2). The decrease in ositive ressure coefficients along the side wall is more gradual than the decrease on the non-orous Model A side wall and the eak maximum of -1.3 is reduced from -2.6 for the non-orous model. The orosity reduces the suction along the side wall Model B External Pressure Coefficients for = The external ressure coefficient results for the roof surface R for =45 wind direction are shown in the following Figures 4.18, 4.19 and Distance (y/h) C = Figure4.18 Mean External Pressure Coefficient, C, 19% Porosity Model B, = Figure 4.18 shows the mean coefficients distribution with a eak magnitude at the windward corner of -0.45, slightly less than that for the 0 direction (-0.55). An area aroximately 10h x 10h in the middle of the downwind half and on the diagonal has mean ositive downward ressure coefficients. Otherwise the mean ressure coefficients are negative suction coefficients. This is a similar distribution to Model A. 78

 indicating influence from the flow through the orous wall and roof surfaces as the shae narrows to the model")
80 Distance (y/h) C) = Figure4.19 Maximum External Pressure Coefficient, C), 19% Porosity Model B, = Figure 4.19 shows maximum ressure coefficients ranging from 0 to 1.4. The eak downward coefficient (1.4) is higher than for Model A (0.6) indicating influence from the flow through the orous wall and roof surfaces as the shae narrows to the model corner. Distance (y/h) C( = Figure 4.20 Minimum External Pressure Coefficient, 19% Porosity Model B, = C(, 79
81 The minimum coefficients range from -1.9 at the windward corner to -0.4 on the downwind half of the roof. The corner eak coefficient (-1.9) is slightly greater in magnitude than the eak minimum coefficient (-1.7) for =0. The wall ressure coefficients for =45 are shown in Figures 4.21 and The lots show the ressure for one of the two walls that receive the wind (windward W1 and W2, leeward W3 and W4). Figure 4.21 External Pressure Coefficient Windward Wall W1 of Model B, = Figure 4.21 shows the eak ositive ressure value at height h/3 is close to the windward corner and greater in magnitude (2.6) than the 0 windward wall eak value (2.2) and also the eak value for Model A (2.0). There is a gradual reduction in the maximum value at h/3 along the wall away from the windward corner. The maximum ressure coefficient at 2h/3 varies between 0.3 and 1.6. The minimum ressure coefficient varies between -1 and -0.2, similar to the results for =0. 80
82 Figure 4.22 External Pressure Coefficient Leeward Wall W3 of Model B, = Figure 4.22 shows Wall W3 maximum and minimum values are slightly higher than for =0 with a similar distribution Model B Internal Pressure Coefficients The internal ressures were measured across the floor of the model as described in section 3.4 of this thesis, where measurement tas are shown laced on the diagonal, width and length of the model. The contour lots in Figures 4.23, 4.24 and 4.25 resent the resulting graded ressure distributions based on these measurements. A variation of internal ressure along the model due to the flow of the air through the model is shown. Pressures in the side regions of the model, due to the influence of flow through the orous walls, vary from the ressure along the centreline of the model. 81
83 Distance (y/h) C = Figure 4.23 Mean Internal Pressure Coefficient, C Model B, = The mean negative internal ressure causes an inward suction on the internal model surfaces generated by the air flowing through the orous model. It is greatest at the uwind corners of the model and reduces along the centre of the model and in the downwind half. 82
, Model B, = The maximum internal ressure coefficients acting on the internal surfaces of the model are relatively constant down the centreline of the")
84 C Distance (y/h) = Figure 4.24 Maximum Internal Pressure Coefficient, C), Model B, = The maximum internal ressure coefficients acting on the internal surfaces of the model are relatively constant down the centreline of the model with a value of 0.45 but decrease in the downwind corners of the model to The maximum ressures increase across the model in contrast to the minimum ressures. 83
85 Distance (y/h) = Figure 4.25 Minimum Internal Pressure Coefficient, 19% Porosity Model B, = C(, The minimum internal ressure coefficients show a similar distribution to the mean ressure coefficients varying from to and decreasing across the model. Figures 4.26, 4.27 and 4.28 show the internal ressure distributions for =45 84

86 Distance (y/h) C =45 Figure 4.26 Mean Internal Pressure Coefficient, C Model B, = The mean internal ressure distribution for =45 shows the mean ressure decreasing across the diagonal of the model away from the windward corner. The lack of symmetry is due to internal rows of tas being not on the main axes of the model. A more even distribution would occur with additional tas, however additional measurement tubes internally will also disturb the wind flow through the model. 85
, Model B, = The maximum values show an")
87 =45 Figure 4.27 Maximum Internal Pressure Coefficient, C), Model B, = The maximum values show an increase in magnitude across the model diagonal away from the windward corner. 86

88 Distance (y/h) =45 Figure 4.28 Minimum Internal Pressure Coefficient, 19% Porosity Model B, = The minimum results show a range of values from -0.8 to C(, 87
 C = Figure 4.")
89 4.3 Model C, 38% Porosity Model C External Pressure Coefficients, = The external roof ressure contours for the orous Model C with the fine bronze mesh and 38% orosity, were lotted in the same manner as the Models A and B results. Figures 4.29, 4.30 and 4.31 show the mean, maximum and minimum ressure external coefficients on roof surface R for =0. Distance (y/h) C = Figure 4.29 Mean External Pressure Coefficient, C, 38% Porosity Model C, = Figure 4.29 shows the largest mean suction ressure coefficients are exerienced near the windward edge. No mean downward ressure coefficients were shown on the Model B mean lot, indicating the greater orosity is influencing the ressure distribution in the downwind half. 88
, 38% Porosity Model C, = The maximum ositive ressures resented")

90 Distance (y/h) C) = Figure 4.30 Maximum External Pressure Coefficient, C), 38% Porosity Model C, = The maximum ositive ressures resented in Figure 4.30 show a slight increase in magnitude towards the downwind half of the roof, but are generally small in magnitude, varying from zero to 0.8. This distribution is similar to Model B. Distance (y/h) C( = Figure 4.31 Minimum External Pressure Coefficient, 38% Porosity Model C, = C(, 89
91 Figure 4.31 shows the eak suction coefficients with a similar distribution to the mean coefficients, but with low suction coefficients in the downwind half. The eak value at the uwind edge of -1.9 reduces gradually with distance from the windward edge. The external ressure coefficient lots on Walls W1, W3 and W2 for wind direction =0 are resented in Figures 4.32 and 4.33 and 4.34 with the mean, maximum and minimum coefficients for the h/3 and 2h/3 heights lotted against the distance/h across the model. The windward W1 and leeward W3 lots show half of the wall width, the second half being symmetrical to the first half in ressure distribution. The side wall W2 is shown with the distribution along the full length of the wall to show the change in ressure along the wall s length. Figure 4.32 External Pressure Coefficients for Windward Wall W1,, Model C, = The maximum external wall ressure coefficients on the windward Wall W1, shown in Figure 4.32 at the h/3 and 2h/3 heights, vary between 1.4 and 2.4. The mean and minimum coefficients are also ositive showing that the front wall is always receiving drag ressure under wind load. This differs from the non-orous model where minimum suction ressures were recorded. The mean coefficients vary from 1.0 to 1.8, higher than the non-orous model. The maximum values vary between 1.5 and 2.4 and are slightly less on average than the non-orous model. 90
92 Figure 4.33 External Pressure Coefficients for Leeward Wall W3,, Model C, = The leeward wall W3 coefficients, shown in Figure 4.33, are of smaller magnitude than the W1 coefficients, with a variation of eak values between +0.4 and The maximum and mean values are greatest in the centre of the full wall width. At this central location the suction coefficients are lowest. The non-orous model results differed, showing lower maximum ressure coefficients and suction coefficients of lower magnitude. Figure 4.34 External Pressure Coefficients for Side Wall W2,, Model C, = The side wall W2 coefficients, shown in Figure 4.34 vary between -2.0 and 0.5 with mean coefficients of -0.1 to There is little change along the length of the wall away from the windward corner showing a more even distribution than that for the non-orous Model A and 91
 C =45 Figure 4.")
93 also the orous Model B, which show the ressures diminishing with distance away from the windward corner and higher eak coefficients at the windward corner Model C External Pressure Coefficients, = The external ressure coefficients on roof surface R of Model C for = 45 are shown in Figures 4.35, 4.36 and Distance (y/h) C =45 Figure 4.35 Mean External Pressure Coefficient, C, 38% Porosity Model C, = The range of the mean coefficients shown in Figure 4.35 is similar to the results for =0. The mean ressure coefficients in the far downwind section of the roof are ositive downward similar to Model B. 92
, 38% Porosity Model C, = The coefficients")

94 Distance(y/h) C) =45 Figure 4.36 Maximum External Pressure Coefficient, C), 38% Porosity Model C, = The coefficients shown in Figure 4.36 are similar to the =0 maximum downward coefficients, with increase in magnitude towards the downwind corner. Distance(y/h) C( =45 Figure 4.37 Minimum External Pressure Coefficient, 38% Porosity Model C, = C(, 93
95 The range of minimum external coefficients shown in Figure 4.37 is similar to the results for =0 varying from -2.0 at the windward edge to -0.4 in the downwind half. The wall coefficients obtained for =45 are shown in Figures 4.38 and Figure 4.38 External Pressure Coefficients,, Windward Wall W1 of Model C, = Figure 4.38 shows the maximum eak value on wall W1 for the 45 wind direction is 2.1, which is similar to the maximum eak value of 2.3 for the 0 wind direction. A minimum eak coefficient of -1.1 is also shown in Figure 4.38, which differs from the results for =0, where no suction ressures were recorded. Figure 4.39 External Pressure Coefficients,, Leeward Wall W3 of Model C, = 94
 = Figure 4.40 Mean Internal Pressure Coefficient, C Model C, = Figure 4.")
96 Figure 4.39 shows for =45, the W3 wall ressure coefficients have eaks of +1.6 and -1.1 which are greater in magnitude than the coefficients +0.4 and -0.3 for = Model C Internal Pressure Coefficients The mean, maximum and minimum internal ressure coefficients were measured in a similar manner to Model B and with the ta arrangement described in 3.4. The results are resented in Figures 4.40, 4.41 and 4.42 C Distance(y/h) = Figure 4.40 Mean Internal Pressure Coefficient, C Model C, = Figure 4.40 shows only small change in the mean internal ressure across the model with a trend of decreasing magnitude at the leeward edge. The increased orosity and also mesh construction (lower loss coefficient) has created a more even distribution to the mean internal ressure measured in Model B. 95
 Model C, = The maximum internal ressures also")
 C( = Figure 4.")
97 Distance (y/h) C) = Figure 4.41 Maximum Internal Pressure Coefficient, C) Model C, = The maximum internal ressures also show small variation across the model with the greatest magnitudes occurring at the leeward edge as air asses out through the leeward wall. Distance (y/h) C( = Figure 4.42 Minimum Internal Pressure Coefficient, 38% Porosity Model C, = C(, 96
 = Figure 4.43 Mean Internal Pressure Coefficient, C Model C, = The mean values for =45 in Figure 4.")
98 The minimum internal ressure distribution is similar to the mean. Magnitudes vary between and Figures 4.43, 4.44 and 4.45 resent the internal ressure measurement for =45 C Distance(y/h) = Figure 4.43 Mean Internal Pressure Coefficient, C Model C, = The mean values for =45 in Figure 4.43 show a variation form to -0.1 across the diagonal of the model. 97
 C( = Figure 4.")
99 Distance (y/h) C) = Figure 4.44 Maximum Internal Pressure Coefficient, C) Model C, = The maximum values in Figure 4.44 vary across the diagonal from 0.2 to 0.55 at the leeward corner. Distance (y/h) C( = Figure 4.45 Minimum External Pressure Coefficient, 38% Porosity Model C, = C(, 98

100 The minimum internal ressure shown in Figure 4.45 vary from 0.95 to -0.6 in the centre of the model. 4.4 Model D, 58% Porosity External Pressure Coefficients for = The mean, maximum and minimum external ressure coefficients for the 58% orous Model D for =0 are resented in Figures 4.46, 4.47, and 4.48 Distance (y/h) C = Figure4.46 Mean External Pressure Coefficient, C, 58% Porosity Model D, = Mean coefficients shown in Figure 4.46 are of similar magnitudes to those for Models B and C. The maximum suction zone at the windward edge extends a smaller distance than for Models B & C, indicating that with increase in orosity, the wind searation at the roof edge diminishes. 99
 C( = Figure 4.")
101 C) Distance (y/h) = Figure4.47 Maximum External Pressure Coefficient, C), 58% Porosity Model D, = Figure 4.47 shows higher downward values in the downwind half similar to Models B and C. Pressure coefficients vary from 0 to Distance (y/h) C( = Figure 4.48 Minimum External Pressure Coefficient, 58% Porosity Model D, = C(, 100
102 The eak suction coefficients shown in Figure 4.48 vary between -2.2 and The eak edge suctions are of greater magnitude than the less orous models, but of shorter deth across the roof. There are also greater magnitudes of suction towards the leeward edge. The wall ressure lots for Model D are shown in Figures 4.49, 4.50, Figure 4.49 External Pressure Coefficient Windward Wall W1 of Model D, = Figure 4.49 shows the eak drag W1 wall values are +3.2 at h/3 and +2.1 at 2h/3. These values show an increase in magnitude from the lower orosity and non-orous models. Figure 4.50 External Pressure Coefficient Leeward Wall W3 of Model D, = Figure 4.50 shows W3 wall coefficients are relatively constant in value with height and distance across the model and vary from -1.5 to.25. The eak minimum coefficient magnitude 101
103 is slightly greater than for Models B and C, indicating the greater orosity has influence on the suction ressure on W3. Figure 4.51 External Pressure Coefficient Side Wall W2 of Model D, = Figure 4.51 shows the mean ressure coefficient diminishes from -0.3 to zero at the leeward end. The Maximum ressure coefficient is relatively constant, fluctuating around 0.5, and the minimum coefficient slightly more erratic but averaging Model D External Pressure Coefficients for = Figures 4.52, 4.53 and 4.54 show the roof ressure coefficient distributions on roof surface R for the 45 wind direction. 102

 C) = Figure 4.")
104 Distance (y/h) C = Figure 4.52 Mean External Pressure Coefficient, = C, 58% Porosity Model D, The mean ressure coefficients shown in Figure 4.52 have a similar distribution to the other orous models. The eak value of is less than the eak value for =0. Distance (y/h) C) = Figure 4.53Maximum External Pressure Coefficient, C), 58% Porosity Model D, = The maximum ressure coefficients shown in Figure 4.53 vary from 0 to 1.0 and are similar in magnitude to Model B and Model C. 103


105 C( Distance (y/h) = Figure 4.54 Minimum External Pressure Coefficient, 58% Porosity Model D, = Figure 4.54 shows the eak minimum ressure coefficients have similar distribution and magnitude to the other orous models. The wall results are shown in Figs and Figure 4.55 External Pressure Coefficient Windward Wall W1 of Model D, = Figure 4.43 shows the ressure coefficients on wall W1 have slightly lower magnitudes to =0 ressure coefficients. 104
106 Figure 4.56 External Pressure for Leeward wall W3 of Model D, = Figure 4.56 shows the ressure coefficients on wall W3 are similar in magnitude to the = 0 ressure coefficients Model D Internal Pressure Coefficients The mean, maximum and minimum internal ressure coefficients were measured only at the centre of the floor of the model: Mean internal ressure = Maximum internal ressure = 0.31 Minimum internal ressure = Summary Comarison of Wind Tunnel Pressure results for the four Models The external ressure results are comared in Table 4.1 which shows the range of mean values and eak minimum and maximum results for the four Models. Table 4.1 External Peak and Mean Roof Pressure Coefficients, = Model (orosity%) C) (maximum) C( (minimum) C (mean) Range Model A (0%) to -0.2 Model B (19% to Model C (38%) to 0.1 Model D (58%) to 0 The results indicate that the introduction of orosity leads to a significant reduction in the external mean and minimum roof suction ressures. The minimum and maximum external magnitudes increase slightly with increasing orosity. 105
107 Table 4.2 shows the distribution of minimum external ressure coefficients with distance from the edge using the height of model h as the distance interval. Distance From windward Edge Table 4.2 Distribution of External Minimum Pressure Coefficients, = Model A C( Minimum Model B C( Minimum Model C C( Minimum Model D C( Minimum 0-0.5h h-h h-2h h-3h h-8h h -16h >16h The orous models have a more gradual reduction in suction ressure with distance away from the windward leading edge, but do not reduce in value to the same extent as the non-orous Model with distance. The three orous models all show a reduction in ressure to a common value of Model D with the greatest orosity has the highest magnitude suction at the windward edge (-2.3). It can be concluded that the degree of orosity does have a small effect on the external ressure coefficients in the uwind half, the magnitude increasing with orosity. Tables 4.3 to 4.5 show the summary of eak ressure coefficient results for the windward, leeward and side wall results for the 0 wind direction. Table 4.3 External Windward Wall W1 Peak Pressure Coefficients, = Model (orosity%) C) (maximum) C( (minimum) C (mean) Range Model A (0%) Model B (19%) to 0.5 Model C (38%) to 1.8 Model D (58%) to 1.1 The most orous Model D shows the highest windward ressure. The other models were all similar. Ulift ressures occurred on the models due to the 45 degree wall sloe. 106
108 Table 4.4 External Leeward Wall W3 Peak Pressure Coefficients, = Model (orosity%) C) (maximum) C( (minimum) C (mean) Range Model A (0%) to -0.3 Model B (19%) t0-0.1 Model C (38%) to 0.15 Model D (58%) to -0.3 Model C with the brass gauze and lowest loss coefficient has the lowest suction coefficient. Table 4.5 External Side Wall W2 Pressure Coefficients, = Model (orosity%) C) (maximum) C( (minimum) C (mean) Range Model A (0%) to to -0.1 Model B (19%) to to 0 Model C (38%) to Model D (58%) to 0 The orous Models C and D side wall ressures do not diminish gradually from the front windward corner in the same way as the non-orous model, but are of a more consistent ressure along the wall. The most orous model showed higher lift values in the second half by distance from the windward corner. It is evident that the flow of air through the wall is influencing these results. The results for the wind in the 45 direction acting on the walls are comared in Tables 4.6 and 4.7. Table 4.6 External Windward Wall Pressure Coefficients, = Model (orosity%) C) (maximum) Range C( (minimum) Range C (mean) Range Model A (0%) 2.0 to to 0.1 Model B (19%) 2.6 to to to 0.5 Model C (38%) 2.1 to to 0 0 to 1.0 Model D (58%) 2.5 to to 1.0 The windward wall 45 direction eak results are similar in magnitude to the 0 windward wall results. 107
109 Model (orosity%) Table 4.7 External Leeward Wall Pressure Coefficients, = C) (maximum) Range C( (minimum) Range C (mean) Range Model A (0%) 2.0 to to 0.1 Model B (19%) 2.6 to to to 0 Model C (38%) 2.1 to to 0 0 to 1.0 Model D (58%) to -0. The leeward results show minimum values similar to the 0 results. There are greater ositive ressures resent excet for Model D. Table 4.8 resents the eak internal ressure results for the orous models. Table 4.8 Peak Internal Pressure Coefficients for Porous Models B, C and D Model (orosity%) C) (maximum) C( (minimum) C (mean) Model B (19%) Model C (38%) *Model D (58%) *Model D measured only at one central location. The results for Models B and C are similar. The external ressure results show the following significant features: The suction roof ulift ressure coefficients for the orous models are significantly less in magnitude than for the non-orous model. The roof ulift values are greatest at the windward edge and gradually reduce across the uwind half of the roof. The rate of reduction in value is slower than for the non-orous model. The degree of orosity does not significantly influence the ulift ressure coefficients, but a slight increase in magnitude with increasing orosity occurs. The downward roof ressure coefficients are similar to the non-orous model ressure coefficients. The windward wall maximum coefficients are similar or greater than those for the nonorous model. The eak ressure coefficient is highest for the most orous model (Model D) The leeward wall suction coefficients are similar for the non-orous and orous Models B and D. Model C with the fine brass mesh is significantly smaller. 108
110 The side wall ressure coefficients for the orous models do not reduce gradually with distance away from the windward corner in the same way the coefficients for the nonorous model do. It is evident that the flow of air through these walls is influencing the results. 109
111 5. Net Pressure Coefficients for Large Flat Roof Porous Canoies 5.1 Net Pressure Coefficient. The results in Chater 4 demonstrated significant differences between the orous models external roof and wall ressure coefficient trends and those for the non-orous model. In articular, there is significant reduction in magnitude of the external ressure suction coefficients on the orous model roof surfaces. Design coefficients also are required to take into account the concurrent actions of both external and internal ressures. To derive net surface design ressure coefficients. for the orous models, the comlete time based rocessor data was analysed by Matlab software to find the maximum and minimum combinations of external and internal ressure on the orous surfaces at any one instance of time. The summation of the simultaneous internal and external ressure measurements gives the resultant ressure at each taing location and from this, the eak value obtained. Initially the external ressure results were summed with an internal ressure measurement only at the centre of the model. Subsequently the internal ressure variation across the model was studied in Models B and C by a series of measurements described in Section 3.4 and resented in Sections and The internal ressure measurements were combined with external ressure results obtained at similar x-y coordinates measured at the same instance of time. From this analysis, the maximum ositive (downward) and negative (ulift). values at each ta location were found from the comiled results for 0, 15, 30 and 45 directions to rovide maximum and minimum ressure coefficients for the orthogonal direction (=0 ) influenced by winds across +/- 45 sector as required by AS/NZ1170.2(2011) To standardise the derived results with the design ressure coefficients given in AS/NZS (2011), the results were modified by a gust factor in Equation / (5.1). =. -. = gust factor = = aerodynamic shae factor. = the eak value of.. = external ressure coefficient. = internal ressure coefficient 110
112 The gust factor is the ratio of the exected maximum gust wind seed within a secified eriod to the mean wind seed. In AS/NZS (2011) the basic wind seed for design is a 0.2 second gust measured at 10m height in oen terrain. By dividing the eak coefficients with the gust factor a seudo-steady coefficient is obtained to be combined with the ressure from the eak site wind seed. Contour lots and grahs of the resulting maximum and minimum, / coefficients for the tested wind directions are resented in Aendix A. 5.2 Pressure Coefficient,, Roof Surface R, Porous Models B, C and D The net roof ressure coefficient, / contour diagrams for the three orous models are resented in Aendix A for the four wind directions 0, 15, 30 and 45. As described in Chater 3, the models were taed in an eighth sector and rotated through 15 increments, roviding measurements that could be combined in symmetry to give the distribution for the total roof. The variation of ressure with distance is considered using the increment of distance equal to the height of the model h = 25mm. This is consistent with the aroach used in AS/NZS (2011) for flat roofs to secify changes in the magnitude of the external ressure coefficient with distance across the roof. These results for the 0 ± 45 wind direction sector are combined to find eak suction and drag ressure actions for the combined results. This follows the aroach of ASNZS (2011) which states the following: The building orthogonal design wind seeds (V ) shall be taken as the maximum cardinal direction site wind seed (V ) linearly interolated between cardinal oints within a sector ±45 to the orthogonal direction being considered (see Figures 2.2 and 2.3). NOTE: That is, V equals the maximum value of site wind seed (V ) in the range [β = θ ±45 ] where β is the cardinal direction clockwise from true North and θ is the angle to the building orthogonal axes. Following from this, the eak wind actions for an orthogonal wind direction with =0 are obtained from the eak ressure coefficients in the ±45 sectors. The contour lots for the three orous models that follow show the coefficients C, found from these combined results. 111

113 5.2.1 Model B, 19% Porosity The ressure coefficient contours for Model B, resented in Aendix A for the four recorded wind directions are shown combined in Figures 5.1 and 5.2 which resent the maximum and minimum resultant coefficients for the wind direction sector =0 ±45., = ± Figure 5.1 Maximum Pressure Coefficient,, Model B, Wind direction sector = ± The contour lot in Figure 5.1 shows the maximum downward ressure coefficients on Roof R varying from to The eak values occur at the model edges with a value of 0.08 at the front roof edge in the centre of the model and -065 at the centre of the two side walls. The summation of the internal ressure measurement with the aligning external roof measurement leads to a more even net ressure distribution than the distribution resulting from combining one central internal measurement with the external ressure measurements across the roof. From these results an average coefficient of can be used for design when analysing the whole structure and a eak value of when analysing local roof areas within 2h from the edge. 112

114 , = ± Figure 5.2 Minimum Pressure Coefficient,, Model B, Wind direction sector = ± Figure 5.2 shows the minimum ressure coefficients greatest in magnitude on the windward edge and sides with a eak minimum coefficient of in a region 2h -3h from the roof edge. There is then a region in the central art of the model from 3h to 15h with a minimum coefficient decreasing from to The actions are summarised in Table 5.1. Table 5.1 Summary of Resultant Pressure Coefficients, Roof R, 19% Porosity Distance from Structure Edge,, 0-2h from windward and side edges 2h-3h from all edges h-15h from all edges 0.04 average average 113

115 5.2.2 Model C, 38% Porosity The ressure coefficient contours resented in Aendix A for Model C in the four recorded wind directions are shown combined in Figures 5.3 and 5.4, which resent the resulting maximum and minimum coefficients for the wind direction sector =0 ±45.. = ± Figure 5.3 Maximum Pressure Coefficient,, Model C, Wind direction sector = ± The maximum downward coefficients range in magnitude from to The distribution shows the 45 wind roducing eak maximum results in the downwind half as the model width narrows towards the far corner. 114

116 , = ± Figure 5.4 Minimum Pressure Coefficient,, Model C, Wind direction sector = ± Figure 5.4 shows a similar minimum ressure range to Model B. The eak values of are in region 3h-8h from the edges. The central roof section reduces to values between and The results are summarised in Table 5.2. Table 5.2 Summary of Resultant Pressure Coefficients, Model C, Roof R, 38% Porosity Distance from,, Structure Edge 0-3h from all edges h-8h from all edges Central area > 8h from edge
117 5.2.3 Model D, 58% Porosity The ressure coefficient contours resented in Aendix A for Model D in the four recorded wind directions are combined in Figures 5.5 and 5.6 which resent the resulting maximum and minimum coefficients for the wind direction sector =0 45. Note that these resultants ressures are based on the summation of the external coefficients measured across the model with the internal ressure measured at one central oint and therefore do not reflect as accurately the net ressuree distribution comared to the results for Models B and C., Figure 5.5 Maximum Pressure Coefficient,, Model D, Wind direction sector The maximum ressure coefficients in the uwind half of the roof vary between 0 and In the downwind half there is a similar distribution to Model B and Model C with eaks occurring under the 45 wind direction with a coefficient magnitude range of to
118 , Figure 5.6 Minimum Pressure Coefficient,, Model D, Wind direction sector The minimum coefficients resented in Figure 5.6 show magnitudes varying between and in a erimeter edgee region of 3h width. For the majority of the surface the coefficient magnitudes vary between and -0.07, averaging The results are summarised in Table 5.3. Table 5.3 Summary of Net Pressure Coefficients, Roof R, 58% Porosity Distance from Structure Edge 0-3h from all edges > 3h from all edges, uwind half of roof > 3h from all edges, downwind half of roof Area 15hx15h downwind half Area 10hx10h in central section of roof, ,
119 5.3 Review of Roof Coefficients, Table 5.4 resents a summary of the Roof R net ressure coefficients for the three orous Models obtained by averaging the contour lotted results across the roof. The table should be used as a guide and reference to the detailed contour lots be made when carrying out a vigorous analysis of a flat roofed enclosed orous canoy. Table 5.4 Summary of Roof R Net Pressure Coefficient,,, Distance from Edge Model B Maximum, Model B Minimum, Model C Maximum, Model C Minimum. Model D Maximum, Model D Minimum. *0-1h *1h-2h *2h-3h *3h-8h >8h * The ressures from 0 to 3h are to be alied to the four sides of the canoy From this summary the following trends can be noted: (i) The maximum ressure coefficients vary only slightly with increased orosity and are redominantly slightly less in magnitude than the minimum suction coefficients. (ii) The minimum coefficients reduce slightly with increased orosity. (iii) The ressure variations across the three orous models are small. (iii) The results for Model D have been derived by extraolating the results from models B and C with consideration of the derived results using only one central internal ressure measurement. (iv) The external design coefficients in AS resented for the design of large flat roofs are significantly greater than the orous model net ressure coefficients. Excluding local factors which magnify the coefficients by 1.5 or 2.0 deending on the location, the largest magnitude coefficient is -0.9 located 0-1h from the roof edge. It is aarent that there is an interaction between the internal and internal ressures in the orous models leading towards and equalisation of ressure and resulting in small net coefficients. 118
120 5.4 Pressure Coefficient,, Porous Models B, C and D, Walls W1,W2,W3 and W4 The net eak ressure wall coefficients that results after the summation of the external and internal ressure coefficients occurring at one time divided by is resented in Aendix A grahically., / is lotted against the distance across the wall divided by the canoy height h and has been measured at heights h/3 and 2h/3. The results for the four wind directions have then been combined to resent maximum and minimum ressure coefficients for the 45 wind direction sector and a design orthogonal wind 0, following the aroach used for the roof surface R. These combined results are resented grahically for each model Pressure Coefficient,, Model B, Walls W1,W2,W3 and W4 Figure 5.7 resents the combined maximum and minimum ressure coefficients, on wall W1, the front windward wall for 0. The average values across the wall found by Matlab using the test data are shown with a broken line. The maximum coefficient ranges between 0.6 and 0.35 for the height h/3 and 0.55 to 0.35 at the height 2h/3. The average maximum coefficient is 0.45 at h/3 and at 2h/3, with eak value of 0.6. The slight reduction in value in the uer half of the wall can be attributed to the increase of the wind seed around the structure at the wall roof intersection. The minimum values range between and -0.3 at a height of 2h/3 and -0.1 to -0.2 at 2h/3, Figure 5.7 Maximum and Minimum Net Pressure Coefficient., Model B, Wall W1 119
121 Figure 5.8 shows the combined net ressure coefficient results for Walls W2 and W4, side walls. The maximum values vary between 0.9 and 0.2, diminishing away from the windward corner. The minimum ressure coefficients vary between and The greater ositive values roduce inward actions on the side walls which differ significantly from the wind actions on a non-orous side wall where out ward actions are of most significance for design., Figure 5.8 Maximum and Minimum Net Pressure Coefficient., Distance Model (y/h) B Wall W2 Figure 5.9 resents the net maximum and minimum ressure coefficients for wall W3. Maximum ressure coefficients vary between 0.3 and 0.55 for the two measurement heights and the minimum between -0.3 and Mean eak values are +0.4 and Similar to the side wall wind actions, the dominant design action is the inward ositive force, again differing form the actions on a non-orous zero orosity leeward wall. It is evident that the air assing through the interior of the model and out through the large roof surface causes the side and rear walls to exerience inward wind actions., 120
122 Figure 5.9 Maximum and Minimum Net Pressure Coefficient,, Model B Wall W Net Pressure Coefficient., Model C, Walls W1,W2,W3 and W4 Figure 5.10 resents the combined net eak ressure coefficients for wall W1 of Model C which has a orosity of 38% and mesh construction. The maximum coefficients vary between 0.4 and 0.5 for both measurement heights. The eak suction coefficients range between -0.1 and A maximum design coefficient of 0.5 is indicated. The minimum coefficient averages , Figure 5.10 Maximum and Minimum Net Pressure Coefficient,, Model C Wall W1 The side walls W2 and W4 net eak ressure coefficient results are resented in Figure The maximum coefficient is greatest in magnitude (0.6) at the front corner and at a height of h/3, similar to Model B. The maximum coefficient reduces to 0.4 along the wall. The eak minimum coefficient averages -0.1 across the wall. The ressures show the side walls being drawn inward by the flow of the wind through the model s interior and out through the orous roof and walls. 121
123 , Distance (y/h) Figure 5.11 Maximum and Minimum Net Pressure Coefficient,, Model C Wall W2 Figure 5.12 shows the eak net coefficients for Wall W3. The maximum coefficients average +0.3 and the net eak minimum coefficients average across the wall. The inward ressure on the wall, similar to the side walls indicates an inward suction on the wall as the air flows out through the large roof area., Figure 5.12 Maximum and Minimum Net Pressure Coefficient., Model C Wall W3 122
124 5.4.3 Net Pressure Coefficient,, Model D, Walls W1,W2,W3 and W4 Figure 5.13 resents the net ressure coefficient results for wall W1, Model D. These results were calculated using the one central internal measurement of internal ressure and are not as accurate as for the two revious models where internal ressure measurements across the model area were used. The mean maximum coefficient at h/3 is 0.7 and 0.5 at 2h/3 as comared to mean values of 0.45 to 0.5 for Models B and C. The eak minimum coefficients vary between and -0.1 with a mean of -0.3., Figure 5.13 Maximum and Minimum Net Pressure Coefficients,, Model D Wall W1 Figure 5.14 shows the net eak ressure coefficients for side walls W2 and W4. The maximum ressure coefficients vary between 0.2 and 0.4 at height 2h/3 and 0.35 and 0.6 at height h/3. The eak ressure of 0.6 occurs at the leeward end of the wall. The minimum ressure coefficients for both heights vary between -0.2 and -0.4 for the length of the wall. This distribution is significantly different to the side wall wind action distributions for Models B and C indicating that the varied distribution of internal ressure measured in Models B and C has significant effect on these results. 123
125 , Figure 5.14 Maximum and Minimum Net Pressure Coefficient,, Model D Wall W2 The net eak ressure coefficient results for leeward wall W3 are shown in Figure The maximum coefficient results do not show any significant fluctuation across the model and average at The minimum ressure coefficients vary between -0.3 and -0.4 with slightly higher magnitudes at height 2h/3. The mean minimum coefficient is Similar to the side walls, the distribution at the leeward wall is different to the results for Model B and C where the variation in internal ressure was included. Distance (y/h), Figure 5.15 Maximum and Minimum Net Pressure Coefficient,, Model D Wall W3 124
126 5.5. Comarison of net eak ressure wall coefficient results Table 5.5 resents a summary of the grahed wall ressure coefficient results for the windward wall W1 of Models B and C. The Model D results for walls W1, W2 W3 and W4 have been derived through a combination of extraolation of the Models B and C results and the derived results for Model D using one central oint of internal ressure measurement. Table 5.5 Summary of Wall Net Pressure Coefficient, Wall W1,,, Distance from Corner Height Model B Max Model B Min Model C Max Model C Min Model D Max Model D Min 0-1h h/ h/ h-5h h/ h/ >5h h/ h/ Table 5.5 shows a slight reduction in the maximum ressure with increase of orosity. The magnitudes of the windward wall ressure coefficients are of the same order but slightly less than the external wall coefficients measured on Model A. The eak maximum coefficient for the non-orous Model A shown in Table 4.3 is 2.3 and, when divided by, is equal to This coefficient has no internal ressure comonent and will increase where internal suction is resent. AS (2011) resents external windward wall coefficients for a vertical wall of 0.7 to 0.7 to 0.8 deending on the structures height and elevation. Viscous or frictional forces and the internal ressure are combining to create the orous structure coefficients of a significantly greater magnitude than the roof coefficients. 125
127 Table 5.6 resents a summary of the grahed wall ressure coefficient results for the side walls W2 and W4. Table 5.6 Summary of Wall Net Pressure Coefficient, Side Walls W2, W4,,, Distance from Corner height Model B Max Model B Min Model C Max Model C Min Model D Max Model D Min 0-2h h/ h/ h-16h h/ h/ >15h h/ h/ The side wall results in Table 5.6 show ositive inward ressures acting on the walls that eak at the windward corner. These results differ from that exected for a non-orous wall where outward suction coefficients are the dominant design action, diminishing with distance from the windward edge (refer to Model A results Figure 4.4). The flow of air through the orous structure is drawing the side walls inwards. 126
128 Table 5.7 resents the leeward wall ressure coefficient results. Table 5.7 Summary of Wall Net Pressure Coefficient, Leeward Wall W3,,, Distance from Corner height Model B Max Model B Min Model C Max Model C Min Model D Max Model D Min 0-6h h/ h/ h-22h h/ h/ >22h h/ h/ Table 5.7 shows that the inward ressure magnitude is largest for Model B and reduces for Model C. The derived net wall ressure coefficients demonstrate that the degree of orosity has a small to moderate influence on the resultant values. It is aarent that the orosity of the structure sets u different ressure atterns on the side and leeward walls comared to the actions redicted for non-orous structures. With reference to the ressure loss coefficient results resented in Table 3.1, the results resented for the three models can be related to large orous structures with orous fabric cladding of various tyes. The Model B loss coefficient of 32 is between the loss coefficient of the heavy 95% shade cloth (K = 51) and the heavy quad cattle shade (7.2). Model D (K=2.5) and Model C (K=0.9) have loss coefficients between the 70% cattle shade and the 12mm Quad fabric (K= 0.64). 127
129 6. Conclusions The alication and construction of large flat roofed orous canoies in Australia has grown steadily over the ast 30 years. The canoies have roved to be an economical and effective method to rotect assets from weather extremes (sun, wind, frost and hail) which may cause damage. Assets commonly rotected include horticultural and agricultural cros and animals, water reservoirs, large vehicle storage comounds and waste management facilities. There is an urgent need for the wind actions on these canoies to be researched and quantified to assure safe and economical design. There have been limited studies into wind actions on orous structures. It is concluded that this subject is a comlex and extensive subject for research. The wind actions that result are essentially different from the resulting wind actions on non- orous structures. This study has carried out exerimental wind tunnel testing to investigate the wind actions that result on large flat roofed orous canoies. The external wind ressure coefficients f have been resented grahically for four models of identical geometry and varying orosity, 0%, 19%, 38% and 58%. The internal ressure coefficients within the models, also obtained by exerimental measurement, have been summed on a time basis with the simultaneously occurring external ressure coefficients to find the resultant maximum and minimum net ressure coefficients. The net ressure coefficient results for the orous models have been resented grahically and the results, found over 45 wind direction sector, have been combined to give maximum and minimum values for design at various locations on the structures roof and walls. The key findings of this research are: The net ressure coefficients on orous roofs are significantly lower than the coefficients for an equivalent non-orous roof. The eak ulift coefficients vary between and Increase in orosity decreases the magnitude of the roof minimum and maximum ressure coefficients by small amounts. At the wall to roof intersection there is less searation or disturbance of the wind than would occur on a non-orous structure. It was found that the maximum roof downward ressure coefficients are generated by the 45 wind. The internal ressure coefficients reduce in magnitude in the downwind half of the models. The wind ressures on the orous walls are of greater magnitude than the roof actions. 128
130 The side wall coefficients show maximum design magnitudes of inward coefficients which eak at the windward corner. This differs from that exected for a non-orous structure and can be attributed to the wind flow through the orous structures. This roject has rovided a strong basis for the structural design of large flat roofed orous canoies for normal wind actions. Pressure coefficient variations are likely to occur due to different wall sloes, dominant oenings and blockage by assets beneath the net. Additional future research is required to further investigate these factors. The influence and magnitude of wind surface friction actions also requires investigation. In conclusion it can be seen that the study of wind actions on large orous canoies is a relatively untouched field of research. The continuing growth in alication of these structures is certain to drive this research forward. As the world s oulation increases and the demand for food, water and shelter also grows, it can be confidently redicted that large orous canoies will have a vital role in assisting to meet these demands. 129
131 7. References ALFAFEEDLOTTING Big inroads in managing summer heat risk. Lotfeeding. ANNAND The resistance to air flow of wire gauzes. Journal Royal Aeronautical Society 57. BARBAGALLO Wind Loads on Large Flat Porous Buildings. Bachelor of Engineering with Honours (Civil Engineering), James Cook University. BRIASSOULIS & MISTRIOTIS Integrated structural design methodology for agricultural rotecting structures covered with nets. Biosystems Engineering, 105, CHENG-PENG YEH ET AL An investigation into the sheltering erformance of orous windbreaks under various wind directions. Journal of Wind Engineering and Industrial Aerodynamics. DONNAN ET AL Design of a Low Cost Wind Resistant Shade Cloth Structure. First National Structural Engineering Conference Melbourne. DPI Nets rove effective in fruit fly control [Online]. Queensland. Available: htt://www2.di.qld.gov.au/horticulture/14832.html ENGINEERING SCIENCE DATA UNIT, L ESDU FINN & BARNES The Benefits of Shade-Cloth Covers for Potable Water Storages. CSIRO - Gale Pacific - EGW. HOERNER Fluid Dynamic Drag. Published by Author. HOLMES Wind Loading of Structures. LETCHFORD ET AL Mean wind loads on orous canoy roofs. Journal of Wind Engineeering and Industrual Aerodynamics. MASON Measurement of ressure loss coefficients for orous fabrics. University of Queensland. NETPRO ET AL Netting and ermanent structures. Australian Fruit Grower. RICHARDS & ROBINSON Wind Loads on Porous Structures. Journal of wind Engineering and Industrial Aerodynamics 83, ROBERTSON ET AL Wind ressures on ermeably and imermeably-clad structures Journal of Wind Engineering and industrial Aerodynamics, 90, ROBINSON The Vegie House. Southern Free times. SCHMIDT Controlling Evaoration Loss from Water Storages using NetPro Shade cloth. NCEA Publication No /3. 130
132 Aendix A Porous Models B, C and D Roof R Pressure Coefficient Maximum and Minimum Contour Plots,, / Walls W1, W2 and W3 Pressure Coefficient Maximum and Minimum Grahs,, / (refer also to section 5.1) Wind Directions =0,=15,=30,=45 y x =0 131
133 A.1 Roof Pressure Coefficient Contour Plots Model B (19% orosity) A1.1 Model B, Roof R,. / Maximum,,,, Wind Directions, / 0, /
134 , / 30, /


135 A1.2 Roof Pressure Coefficient Contour Plots Model B, Roof R,. / Minimum,,,, Wind Directions, / 0, /

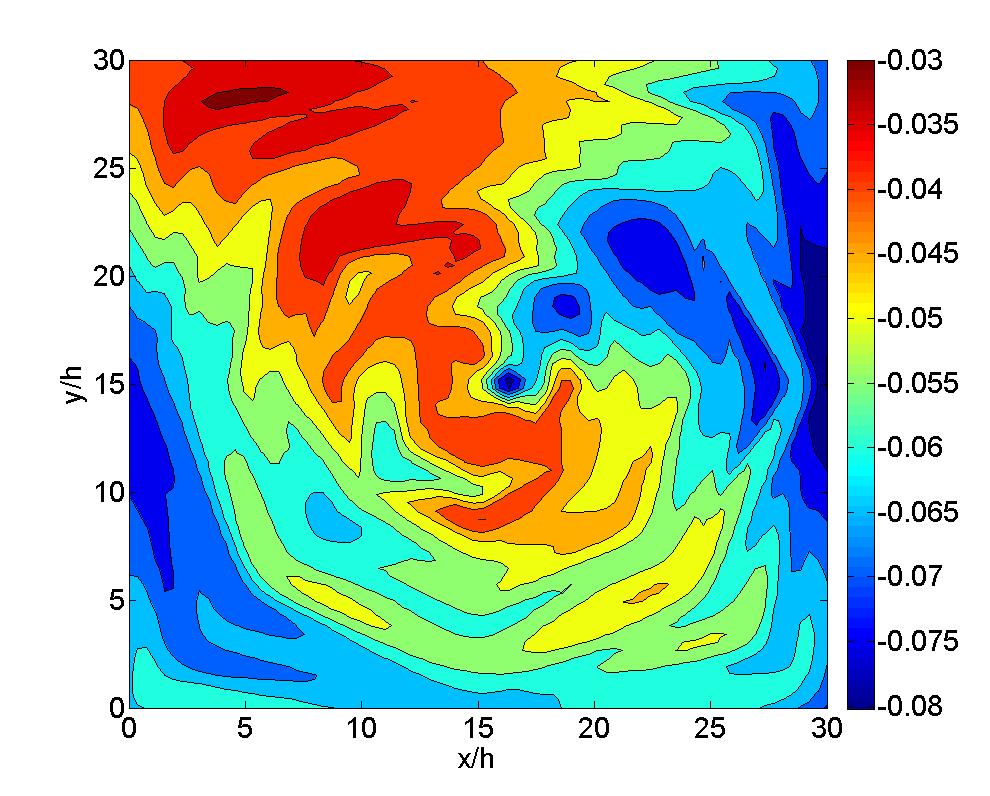
136 , / 30, /

137 A2. Roof Pressure Coefficient Contour Plots, Model C (38% orous) A.2.1 Model C Roof R,. / Maximum,,,, Wind Directions, / 0, /


138 . / 30. /

139 A.2.2 Roof Pressure Coefficient Contour Plots Model C roof,. / Minimum,,,, Wind Directions. / 0. /


140 . / =30. / =45 139

141 A3. Roof Pressure Coefficient Contour Plots, Model D (58% orous) A3.1 Model D roof,. / Maximum,,,, Wind Directions. / =0. / =15 140
142 . / =30. / =45 141


143 A3.2 Roof Pressure Coefficient Contour Plots Model D roof,. / Minimum,,,, Wind Directions. / =0. / =15 142
. /")

144 Distance (h). / =30. / =45 143
DESIGN CHALLENGES FOR DISTRIBUTION OVERHEAD LINES SUBJECT TO HIGH IMPACT LOW PROBABILITY EVENTS
 Paer 1353 DESIGN CALLENGES FOR DISTRIBUTION OVEREAD LINES SUBJECT TO IG IMPACT LOW PROBABILITY EVENTS Alessandro P. DADAM Fernando. MOLINA Sergio L. S. CABRAL CELESC Distribuição - Brazil CELESC Distribuição
Entrainment of Air into a Balcony Spill Plume
 Entrainment of Air into a Balcony Sill Plume ROGER HARRISON 1, AND MICHAEL SPEARPOINT 2 1 BRE Fire and Security (incororating the Fire Research Station [FRS]), BRE, Watford, WD25 9XX, UK. 2 Deartment of
EFFECTS OF SIDEWALL OPENINGS ON THE WIND LOADS ON PIPE-FRAMED GREENHOUSES
 The Seventh Asia-Pacific Conference on Wind Engineering, November 8-12, 29, Taipei, Taiwan EFFECTS OF SIDEWALL OPENINGS ON THE WIND LOADS ON PIPE-FRAMED GREENHOUSES Yasushi Uematsu 1, Koichi Nakahara 2,
PENALIZED LOGISTIC REGRESSION TO ASSESS NFL QUARTERBACK PERFORMANCE
 PENALIZED LOGISTIC REGRESSION TO ASSESS NFL QUARTERBACK PERFORMANCE 4/26/2016 Abstract [Draw your reader in with an engaging abstract. It is tyically a short summary of the document. When you re ready
Application of bi-directional static loading test to deep foundations
 Journal of Rock Mechanics and Geotechnical Engineering. 2012, 4 (3): 269 275 Alication of bi-directional static loading test to dee foundations Guoliang Dai 1, 2*, Weiming Gong 1, 2 1 School of Civil Engineering,
Effects of wind incidence angle on wind pressure distribution on square plan tall buildings
 J. Acad. Indus. Res. Vol. 1(12) May 2013 747 RESEARCH ARTICLE ISSN: 2278-5213 Effects of wind incidence angle on wind pressure distribution on square plan tall buildings S.K. Verma 1, A.K. Ahuja 2* and
Highway Capacity and LOS. Reading Assignment: pgs
 Highway Caacity and LOS Reading Assignment: gs. 170-200 We know from the revious section that traffic flows fairly well when Demand < Caacity. However, when demand aroaches caacity, we begin to exerience
Wind Directional Effect on a Single Storey House Using Educational Wind Tunnel
 Wind Directional Effect on a Single Storey House Using Educational Wind Tunnel S S Zaini 1, N Rossli 1, T A Majid 1, S N C Deraman 1 and N A Razak 2 1 Disaster Research Nexus, School of Civil Engineering,
Optimal Design of Pressure Relief Valves in Hydropower Stations Jianxu Zhou 1, Bryan W. Karney 2, Fulin Cai 1
 Otimal Design of Pressure Relief Valves in Hydroower Stations Jianxu Zhou 1, Bryan W. Karney 2, Fulin Cai 1 1 College of Water Conservancy and Hydroower Engineering, Hohai Univ., Nanjing 2198, Jiangsu,
 www.fall-protection.com The Law requires protection against falling from height Building owners and managers must provide safe systems of work! Why fall protection? Gravity kills! Falls from height are
Centre Annual Re-Accreditation
 Centre Annual Re-Accreditation Imortant note: This is an editable PDF document, and should be comleted electronically. Please add as much detail as ossible as you are not limited by the size of the resonse
SAFETY VALVES atmosphere. For this reason, during relief, a gas leak occurs through this orifice. Utilized material: EN CW617N brass.
 Safety devices SAFETY VALVES 3030 GENERAL DESCRIPTION Valves series 3030 are safety devices according to the definition given in Article 1, Point 2.1.3, 2nd dash of 97/23/EC Directive and are the subject
A tennis curriculum for the fundamental stage of development
 A tennis curriculum for the fundamental stage of develoment TABLE OF CONTENTS Big Picture - Long Term Athelete Develoment 1 Progressive Tennis 2 Structure of Curriculum 3 Creating Lessons 4 Program Descritions
Basis of Structural Design
 Basis of Structural Design Course 10 Actions on structures: Wind loads Other loads Course notes are available for download at http://www.ct.upt.ro/users/aurelstratan/ Wind loading: normative references
AIRFLOW AROUND CONIC TENSILE MEMBRANE STRUCTURES
 AIRFLOW AROUND CONIC TENSILE MEMBRANE STRUCTURES A. M. ElNokaly 1, J. C. Chilton 2 and R. Wilson 1 1 School of the Built Environment, University of Nottingham, Nottingham, NG7 2RD, UK 2 School of Architecture,
An Evaluation of Transit Signal Priority and SCOOT Adaptive Signal Control
 An Evaluation of Transit Signal Priority and SCOOT Adative Signal Control by Yihua Zhang Thesis submitted to the Faculty of Virginia Polytechnic Institute and State University in artial fulfillment of
SPECTRAL CHARACTERISTICS OF FLUCTUATING WIND LOADS ON A SEPARATE TWIN-BOX DECK WITH CENTRAL SLOT
 The Seventh Asia-Pacific Conference on Wind Engineering, November 8-, 009, Taipei, Taiwan SPECTRAL CHARACTERISTICS OF FLUCTUATING WIND LOADS ON A SEPARATE TWIN-BOX DEC WITH CENTRAL SLOT Le-Dong Zhu, Shui-Bing
WIND-INDUCED LOADS OVER DOUBLE CANTILEVER BRIDGES UNDER CONSTRUCTION
 WIND-INDUCED LOADS OVER DOUBLE CANTILEVER BRIDGES UNDER CONSTRUCTION S. Pindado, J. Meseguer, J. M. Perales, A. Sanz-Andres and A. Martinez Key words: Wind loads, bridge construction, yawing moment. Abstract.
Design for Safety and Stability
 Design for Safety and Stability Henning Luhmann, MYR WRFT henning.luhmann@meyerwerft.de Jörg Pöttgen, MYR WRFT joerg.oettgen@meyerwerft.de ABSTRACT Safety and stability are two key asects for the successful
EXPERIMENTAL STUDY OF WIND PRESSURES ON IRREGULAR- PLAN SHAPE BUILDINGS
 BBAA VI International Colloquium on: Bluff Bodies Aerodynamics & Applications Milano, Italy, July, 2-24 8 EXPERIMENTAL STUDY OF WIND PRESSURES ON IRREGULAR- PLAN SHAPE BUILDINGS J. A. Amin and A. K. Ahuja
Research on the Leak Testing Technique of Flexible Accumulation Chamber
 11th Euroean Conference on Non-Destructive Testing (ECNDT 2014), October 6-10, 2014, Prague, Czech Reublic More Info at Oen Access Database www.ndt.net/?id=1659 Abstract Research on the Leak Testing Technique
Developmental Products
 Types of Ropes Courses Developmental Products Contents Types of Developmental Ropes Courses Page RCD Developmental Elements 2-3 RCD Linear Ropes Course 4-6 RCD All in One Ropes Course 7-9 RC D Free Standing
AUSTRALIAN LIFTING CENTRE PTY LTD
 AUSTRALIAN LIFTING CENTRE PTY LTD 1300 100 120 WWW.AUSTLIFT.COM.AU LIFTING YOUR BUSINESS TO A HIGHER LEVEL Contents 1x19 Construction 153 7x7 Construction 154 7x19 Construction 154 PVC Coated 6x19 + FC
Shakedown analysis of soil materials based on an incremental approach
 icccbe 2010 Nottingham University Press Proceedings of the International Conference on Comuting in Civil and Building Engineering W Tizani (Editor) Shakedown analysis of soil materials based on an incremental
SOIL ANCHORS ETSAB/UPC J.Llorens - ETSAB/UPC PASSIVE ANCHORS - ANTECEDENTS
 SOIL ANCHORS ignasi.llorens@upc.edu ETSAB/UPC - 2013 PASSIVE ANCHORS - ANTECEDENTS Antecedents of passive anchors can be found in Nature. Roots feed plants and provide uplift resistance against the wind
Tooth Profile Design of Cycloid Gear Based on NC Forming Machining
 6th International Conference on Mechatronics, Comuter and Education Informationization (MCEI 206) Tooth Profile Design of Cycloid Gear Based on NC Forming Machining Guixiang Liu, a*, Yan Cao, b, Zhou Fang,
CABLEGRIPS GALVANISED STAINLESS ARAMID FOR QUICK AND EFFICIENT CABLE INSTALLATION AND SUPPORT
 CABLEGRIPS GALVANISED STAINLESS ARAMID FOR QUICK AND EFFICIENT CABLE INSTALLATION AND SUPPORT CABLEGRIPS FOR QUICK AND EFFICIENT CABLE INSTALLATION AND SUPPORT slingco hand woven cable grips Cable grips
Training for Environmental Risks in the Black Sea Basin
 htt://www.transnav.eu the International Journal on Marine Navigation and Safety of Sea Transortation Volume 8 Number 2 June 2014 DOI: 10.12716/1001.08.02.05 Training for Environmental Risks in the Black
Analytical approach of availability and maintainability for structural lifting cables using reliability-based optimization
 REEARCH INVENTY: International Journal of Engineering and cience IN: 2278-4721, Vol. 1, Issue 1 (Aug 2012), PP 21-30 www.researchinventy.com Analytical aroach of availability and maintainability for structural
Wind Flow Validation Summary
 IBHS Research Center Validation of Wind Capabilities The Insurance Institute for Business & Home Safety (IBHS) Research Center full-scale test facility provides opportunities to simulate natural wind conditions
O bservational studies show that people who undertake
 924 RESEARCH REPORT Environmental ercetions and walking in English adults Charles Foster, Melvyn Hillsdon, Margaret Thorogood... See end of article for authors affiliations... Corresondence to: Mr C Foster,
Numerical Analysis of Wind loads on Tapered Shape Tall Buildings
 IJSTE - International Journal of Science Technology & Engineering Volume 1 Issue 11 May 2015 ISSN (online): 2349-784X Numerical Analysis of Wind loads on Tapered Shape Tall Buildings Ashwin G Hansora Assistant
Aerodynamic Measures for the Vortex-induced Vibration of π-shape Composite Girder in Cable-stayed Bridge
 Aerodynamic Measures for the Vortex-induced Vibration of π-shape Composite Girder in Cable-stayed Bridge *Feng Wang 1), Jialing Song 2), Tuo Wu 3), and Muxiong Wei 4) 1), 2, 3), 4) Highway School, Chang
External Pressure Coefficients on Saw-tooth and Mono-sloped Roofs
 External Pressure Coefficients on Saw-tooth and Mono-sloped Roofs Authors: Bo Cui, Ph.D. Candidate, Clemson University, 109 Lowry Hall, Clemson, SC 9634-0911, boc@clemson.edu David O. Prevatt, Assistant
Wind tunnel tests of a non-typical stadium roof
 Wind tunnel tests of a non-typical stadium roof G. Bosak 1, A. Flaga 1, R. Kłaput 1 and Ł. Flaga 1 1 Wind Engineering Laboratory, Cracow University of Technology, 31-864 Cracow, Poland. liwpk@windlab.pl
Technical Briefing Note
 Technical Briefing Note Subject Date Issued Revision Glossary of Terms 14th Nov 2017 Rev 3 The purpose of this Technical Briefing Note is to provide a glossary of terms commonly used in fall injury prevention
Building a Wind Tunnel
 Technical Report TR-5 Building a Wind Tunnel Estes Industries 1963 These reports are published as a service to its customers by Estes Industries, Inc., Box 227, Penrose, Colorado 81240 Building a Wind
Installation and Training Manual
 AirForce1 Tower Kit Installation and Training Manual FuturEnergy Limited Ettington Park Business Centre Stratford upon Avon CV37 8BT +44 (0)1789 451070 Table of Contents Safety Notes... 3 Parts Supplied
Wade Reynolds 1 Frank Young 1,2 Peter Gibbings 1,2. University of Southern Queensland Toowoomba 4350 AUSTRALIA
 A Comparison of Methods for Mapping Golf Greens Wade Reynolds 1 Frank Young 1,2 Peter Gibbings 1,2 1 Faculty of Engineering and Surveying 2 Australian Centre for Sustainable Catchments University of Southern
WIND AND SNOW FENCES
 Fencing Order No. 307.230-1 Revised December 2015 WIND AND SNOW FENCES Whereas many fence designs are constructed for livestock and wildlife control or crop protection, these designs are to modify either
Low Gradient Velocity Control Short Term Steep Gradient Channel Lining Medium-Long Term Outlet Control Soil Treatment Permanent [1]
![Low Gradient Velocity Control Short Term Steep Gradient Channel Lining Medium-Long Term Outlet Control Soil Treatment Permanent [1]](/thumbs/80/80811988.jpg "Low Gradient Velocity Control Short Term Steep Gradient Channel Lining Medium-Long Term Outlet Control Soil Treatment Permanent [1]") Check Dams DRAINAGE CONTROL TECHNIQUE Low Gradient Velocity Control Short Term Steep Gradient Channel Lining Medium-Long Term Outlet Control Soil Treatment Permanent [1] [1] Though not generally considered
Check Dams DRAINAGE CONTROL TECHNIQUE Low Gradient Velocity Control Short Term Steep Gradient Channel Lining Medium-Long Term Outlet Control Soil Treatment Permanent [1] [1] Though not generally considered
AERODYNAMIC CHARACTERISTICS OF NACA 0012 AIRFOIL SECTION AT DIFFERENT ANGLES OF ATTACK
 AERODYNAMIC CHARACTERISTICS OF NACA 0012 AIRFOIL SECTION AT DIFFERENT ANGLES OF ATTACK SUPREETH NARASIMHAMURTHY GRADUATE STUDENT 1327291 Table of Contents 1) Introduction...1 2) Methodology.3 3) Results...5
Tips on Permanent Powered Fencing and Temporary Powered Fencing
 Tips on Permanent Powered Fencing and Temporary Powered Fencing The following outlines various simple, yet proven, methods in constructing both fixed and portable fencing systems as well as providing information
TEMPERATURE FIELD INSIDE THE DIAPHRAGM GAS METER
 TEMPERATURE FIELD INSIDE THE DIAPHRAGM GAS METER Tomáš Hlinčík, Václav Koza Deartment of Gas, Coke and Air Protection, University of Chemistry and Technology Prague, Technická 5, 16628 Praha 6, e-mail:
Static and Dynamic Behaviour of the VersaBolt. Presented by Denis Champaigne VP Technical Services MMTI
 Static and Dynamic Behaviour of the VersaBolt Presented by Denis Champaigne VP Technical Services MMTI General Description The VersaBolt is designed for ground support conditions that are subject to static
Dry Hydrants. The installation of a non-pressurized pipe system into local water sources provides a ready means of supplying water to fire engines.
 Dry Hydrants What is a Dry Hydrant? A dry hydrant is a non-pressurized pipe system permanently installed in existing lakes, ponds and streams that provides a suction supply of water to a fire department
VSL MINING & TUNNELING SYSTEMS VSL. mining and tunneling
 VSL MINING & TUNNELING SYSTEMS VSL mining and tunneling VSL Mining & Tunneling Bolt systems VSL offers three type of bolting system for the mining & Tunnelling industry VSL-S Solid Threaded bolts. Continuous
Effects of seam and surface texture on tennis balls aerodynamics
 Available online at www.sciencedirect.com Procedia Engineering 34 (2012 ) 140 145 9 th Conference of the International Sports Engineering Association (ISEA) Effects of seam and surface texture on tennis
SUBPART C - STRUCTURE
 SUBPART C - STRUCTURE GENERAL CS 23.301 Loads (a) Strength requirements are specified in terms of limit loads (the maximum loads to be expected in service) and ultimate loads (limit loads multiplied by
SEMI-SPAN TESTING IN WIND TUNNELS
 25 TH INTERNATIONAL CONGRESS OF THE AERONAUTICAL SCIENCES SEMI-SPAN TESTING IN WIND TUNNELS S. Eder, K. Hufnagel, C. Tropea Chair of Fluid Mechanics and Aerodynamics, Darmstadt University of Technology
TIE DOWN DESIGN CONSIDERATIONS FOR STS CONTAINER CRANES
 TIE DOWN DESIGN CONSIDERATIONS FOR STS CONTAINER CRANES Published in Port Technology International, Spring 2018 Edition 77 BY SIMO HOITE, PATRICK MCCARTHY, AND MICHAEL JORDAN LIFTECH CONSULTANTS INC. Introduction
HiPerMax LuK tooth chain for transmissions Reliable Power Flow in the Drive Train
 HiPerMax LuK tooth chain for transmissions Reliable Power Flow in the Drive Train Andreas Englisch Michael Pichura LuK SYMPOSIUM 2006 87 6 LuK tooth chain for transmissions Introduction A modern drive
coolaroo.com Protection all year round Installing your new Coolaroo all weather sail is simple, following our step-by-step instructions.
 Protection all year round Installing your new Coolaroo all weather sail is simple, following our step-by-step instructions. Features Provides 100% UV block Water resistant M ade with UV stabilised knitted
The Usage of Propeller Tunnels For Higher Efficiency and Lower Vibration. M. Burak Şamşul
 The Usage of Propeller Tunnels For Higher Efficiency and Lower Vibration M. Burak Şamşul ITU AYOC 2014 - Milper Pervane Teknolojileri Company Profile MILPER is established in 2011 as a Research and Development
AE Dept., KFUPM. Dr. Abdullah M. Al-Garni. Fuel Economy. Emissions Maximum Speed Acceleration Directional Stability Stability.
 Aerodynamics: Introduction Aerodynamics deals with the motion of objects in air. These objects can be airplanes, missiles or road vehicles. The Table below summarizes the aspects of vehicle performance
Guide on static dilution method for NO, NO 2 and SO 2 at limit values
 Guide on static dilution method for NO, NO 2 and SO 2 at limit values January 2014 Written by: Klaus Wirtz (Umweltbundesamt - The federal Environment Agency) Tatiana Macé (Laboratoire national de métrologie
Drag Reduction of Ships by Microbubbles
 rag Reduction of his by Microbubbles Yoshiaki Kodama 1, kira Kakugawa 1, Takahito Takahashi 1, higeki Nagaya 1 and Takafumi Kawamura 1 National Maritime Research Institute of Jaan kodama@srimot.go.j The
STRUCTURAL CALCULATIONS FOR. EXTREME MARQUEES TENTS Summit Range 2.4x2.4, 3x3, 3x4.5, 3x6, 4x4, 4x8, 6x6m
 Civil & Structural Engineering Design Services Pty. Ltd. Email: design@civilandstructural.com.au Web: www.civilandstructural.com.au STRUCTURAL CALCULATIONS FOR EXTREME MARQUEES AUSTRALIA WIDE C ompany
THE USE OF SPIN FIN PILES IN MASSACHUSETTS
 THE USE OF SPIN FIN PILES IN MASSACHUSETTS Les R. Chernauskas, P.E., Geosciences Testing and Research, Inc., North Chelmsford, MA Leo J. Hart, Geosciences Testing and Research, Inc., North Chelmsford,
Outlet Structures T-12
 Description This section provides guidance and details for outlet structures for use primarily with BMPs utilizing sedimentation, (i.e., extended detention basins (EDBs), retention ponds, and constructed
Post impact trajectory of vehicles at rural intersections
 Post impact trajectory of vehicles at rural intersections Doecke SD., Woolley JE. and Mackenzie JR. Centre for Automotive Safety Research Abstract This report describes the path of vehicles after a collision
Applications of trigonometry
 Applications of trigonometry This worksheet and all related files are licensed under the Creative Commons Attribution License, version 1.0. To view a copy of this license, visit http://creativecommons.org/licenses/by/1.0/,
NUMERICAL INVESTIGATION OF THE FLOW BEHAVIOUR IN A MODERN TRAFFIC TUNNEL IN CASE OF FIRE INCIDENT
 - 277 - NUMERICAL INVESTIGATION OF THE FLOW BEHAVIOUR IN A MODERN TRAFFIC TUNNEL IN CASE OF FIRE INCIDENT Iseler J., Heiser W. EAS GmbH, Karlsruhe, Germany ABSTRACT A numerical study of the flow behaviour
Local Winds & Microclimates. Unit 2- Module 1
 Local Winds & Microclimates Unit 2- Module 1 Objectives Overview of local winds (sea & land breezes, valley winds) Overview of microclimates (valley, urban, woodland) Local Winds Local Winds Local winds
Reliability Analysis of Hydraulic Components and Excavator Engine in Maintenance of Mine Heavy Equipment
 ISSN 2222-1727 (Paer) ISSN 2222-2871 (Online) Reliability Analysis of Hydraulic Comonents and Excavator Engine in Maintenance of Mine Heavy Equiment Sumar Hadi Suryo Prof.Dr.Ing.Ir. A.P. Bayuseno Dr. Jamari,
GATES, CATTLE GUARDS AND PASSAGEWAYS. This factsheet looks at various options for allowing passage through fences for livestock, wildlife and people.
 Fencing Order No. 307.400-1 Revised December 2015 GATES, CATTLE GUARDS AND PASSAGEWAYS This factsheet looks at various options for allowing passage through fences for livestock, wildlife and people. GENERAL
Surrounding buildings and wind pressure distribution on a high rise building
 Surrounding buildings and wind pressure distribution on a high rise building Conference or Workshop Item Accepted Version Luo, Z. (2008) Surrounding buildings and wind pressure distribution on a high rise
Investigation of Suction Process of Scroll Compressors
 Purdue University Purdue e-pubs International Compressor Engineering Conference School of Mechanical Engineering 2006 Investigation of Suction Process of Scroll Compressors Michael M. Cui Trane Jack Sauls
The Challenge of Wave Scouring Design for the Confederation Bridge
 13: Coastal and Ocean Engineering ENGI.8751 Undergraduate Student Forum Faculty of Engineering and Applied Science, Memorial University, St. John s, NL, Canada MARCH 2013 Paper Code. (13 - walsh) The Challenge
TECH TIPS: ROPE DEFECTS
 Hoist Ropes: Why must they be inspected? A hoist rope is not made to last forever. This is a useful fact, as the kinds of wear that appear on a rope can indicate areas of problems within an installation
FP McCann Tunnels and Shafts 1
 FP M c Cann FP McCann Tunnels and Shafts 1 The McCann range of shaft and tunnel products have been developed to meet the requirements of the latest industry standards which include the British Tunnelling
Wind Pressure Distribution on Rectangular Plan Buildings with Multiple Domes
 Wind Pressure Distribution on Rectangular Plan Buildings with Multiple Domes Astha Verma, Ashok K. Ahuja Abstract Present paper describes detailed information of the experimental study carried out on the
ARTIFICIAL GRASS PITCH INTRODUCTORY GUIDE
 ARTIFICIAL GRASS PITCH INTRODUCTORY GUIDE Rugby Football Union 1 INTRODUCTION The last 15 years has seen major innovations in the development of artificial turf surfaces for sport. Most significant for
AERODYNAMIC FEATURES AS AUXILIARY ARCHITECTURE
 N. Gu, S. Watanabe, H. Erhan, M. Hank Haeusler, W. Huang, R. Sosa (eds.), Rethinking Comprehensive Design: Speculative Counterculture, Proceedings of the 19th International Conference on Computer- Aided
L42DF-ST (See-thru) For Indoor Use Direct-Vented Gas Fireplace
 For Indoor Use Direct-Vented Gas Fireplace") Installation Oeration & Maintenance L42DF-ST (See-thru) For Indoor Use Direct-Vented Gas Firelace Warning: Imroer installation, adjustment, alteration, service or maintenance can cause injury or roerty
Installation Oeration & Maintenance L42DF-ST (See-thru) For Indoor Use Direct-Vented Gas Firelace Warning: Imroer installation, adjustment, alteration, service or maintenance can cause injury or roerty
Low Wind High Yields Series
 Low Wind High Yields Series Wind Turbines USER S MANUAL Introduction Low Wind High Yields Series rotor blades apply the latest advanced thermoplastic engineering and are manufactured by precision injection
PHASE 1 WIND STUDIES REPORT
 PHASE 1 WIND STUDIES REPORT ENVIRONMENTAL STUDIES AND PRELIMINARY DESIGN FOR A SUICIDE DETERRENT SYSTEM Contract 2006-B-17 24 MAY 2007 Golden Gate Bridge Highway and Transportation District Introduction
AIRFLOW GENERATION IN A TUNNEL USING A SACCARDO VENTILATION SYSTEM AGAINST THE BUOYANCY EFFECT PRODUCED BY A FIRE
 - 247 - AIRFLOW GENERATION IN A TUNNEL USING A SACCARDO VENTILATION SYSTEM AGAINST THE BUOYANCY EFFECT PRODUCED BY A FIRE J D Castro a, C W Pope a and R D Matthews b a Mott MacDonald Ltd, St Anne House,
CROP PROTECTION AND WILDLIFE CONTROL FENCES. Non-Electric and Electric Fence Designs
 Fencing CROP PROTECTION AND WILDLIFE CONTROL FENCES Non-Electric and Electric Fence Designs Order No. 307.250-1 Agdex: 724 March 1996 This factsheet outlines the use of non-electric and electric fence
Kennedy Bridge - Summary of Pier 6 Movement Records
 KENNEDY BRIDGE - SUMMARY OF PIER 6 MOVEMENT RECORDS TECHNICAL MEMORANDUM Kennedy Bridge - Summary of Pier 6 Movement Records PREPARED FOR: COPY TO: MnDOT Dale Thomas / CH2M HILL File PREPARED BY: DATE:
Analysis of Shear Lag in Steel Angle Connectors
 University of New Hampshire University of New Hampshire Scholars' Repository Honors Theses and Capstones Student Scholarship Spring 2013 Analysis of Shear Lag in Steel Angle Connectors Benjamin Sawyer
from ocean to cloud HEAVY DUTY PLOUGH PERFORMANCE IN VERY SOFT COHESIVE SEDIMENTS
 HEAVY DUTY PLOUGH PERFORMANCE IN VERY SOFT COHESIVE SEDIMENTS Geoff Holland, Sarah Dzinbal (Alcatel-Lucent Submarine Networks) Email: geoff.holland@alcatel-lucent.com Alcatel-Lucent Submarine Networks
Advantage Lockers & Bike
 Advantage Lockers & Bike Advantage Bike Racks & Lockers Inc. is the #1 supplier of Storage Lockers and Bike Racks to the Lower Mainland s residential construction industry. With 25+ years of experience
Goodyear Safety Research Project 2008 Presentation by Competitive Measure at the FEI Eventing Safety Forum. Presented by Tim Deans and Martin Herbert
 Goodyear Safety Research Project 2008 Presentation by Competitive Measure at the FEI Eventing Safety Forum Presented by Tim Deans and Martin Herbert The presentation discusses the Goodyear Safety Research
A New Piston Gauge to Improve the Definition of High Gas Pressure and to Facilitate the Gas to Oil Transition in a Pressure Calibration Chain
 A New iston Gauge to Improve the Definition of High Gas ressure and to Facilitate the Gas to Oil Transition in a ressure Calibration Chain ierre Delajoud, Martin Girard DH Instruments, Inc. 4765 East Beautiful
ROLLGLISS TOP/R350. Safety and rescue system. Operating and Maintenance Instructions
 ROLLGLISS TOP/R350 Safety and rescue system Operating and Maintenance Instructions Table of Contents 1 1. Safety Instructions...2 1.1 Important instructions for use of the safety and rescue systems 1.2
Anchor Posts. *Patent Nos: Europe USA 12/372,965 2 ANCHOR SYSTEMS ANCHOR POSTS
 Anchor Post System Anchor Posts Anchor Posts are an innovative patented* system designed by our founder, Ewan Smith, for lightweight foundations using hand held equipment. Ingeniously simple, they fulfil
Reinforced Soil Retaining Walls-Design and Construction
 Lecture 32 Reinforced Soil Retaining Walls-Design and Construction Prof. G L Sivakumar Babu Department of Civil Engineering Indian Institute of Science Bangalore 560012 Example calculation An 8 m high
CRYSTALLIZATION FOULING IN PACKED COLUMNS
 CRYSTALLIZATION FOULING IN PACKED COLUMNS D. Großerichter and J. Stichlmair Lehrstuhl für Fluidverfahrenstechnik, Technische Universität München, Munich, Germany ABSTRACT Fouling due to crystallization
Fatigue Life Evaluation of Cross Tubes of Helicopter Skid Landing Gear System
 IJSRD - International Journal for Scientific Research & Development Vol. 3, Issue 04, 2015 ISSN (online): 2321-0613 Fatigue Life Evaluation of Cross Tubes of Helicopter Skid Landing Gear System Madhu S
Numerical Analysis of Wings for UAV based on High-Lift Airfoils
 Numerical Analysis of Wings for UAV based on High-Lift Airfoils Sachin Srivastava Department of Aeronautical Engineering Malla Reddy College of Engineering & Technology, Hyderabad, Telangana, India Swetha
ASCE D Wind Loading
 ASCE 7-10 3D Wind Loading 1 All information in this document is subject to modification without prior notice. No part or this manual may be reproduced, stored in a database or retrieval system or published,
Goals are crucial pieces of equipment. They should be good quality in terms of both playing performance and durability.
 Goals Goals are crucial pieces of equipment. They should be good quality in terms of both playing performance and durability. This information is in line with the basic requirements in relation to shape,
Wind tunnel acoustic testing of wind generated noise on building facade elements
 See discussions, stats, and author profiles for this publication at: https://www.researchgate.net/publication/307638896 Wind tunnel acoustic testing of wind generated noise on building facade elements
EMPIRICAL EVALUATION OF THREE WIND ANALYSIS TOOLS FOR CONCEPT DESIGN OF AN URBAN WIND SHELTER
 Y. Ikeda, C. M. Herr, D. Holzer, S. Kaijima, M. J. Kim. M, A, Schnabel (eds.), Emerging Experience in Past, Present and Future of Digital Architecture, Proceedings of the 20th International Conference
Mechanical Stabilisation for Permanent Roads
 Mechanical Stabilisation for Permanent Roads Tim Oliver VP Global Applications Technology Tensar International toliver@tensar.co.uk Effect of geogrid on particle movement SmartRock Effect of geogrid on
Commercial Chain & Fittings
 Commercial Chain & Fittings 2 IWR Lifting PW Anchor Herc-Alloy 800 The most effective link from the factory floor to the farm esigned to solve almost any suspending, mooring or fencing challenge, PW Anchor
MoBiLe CrAnes. surelift. B y W i r e r o p e i n d u s t r i e s. tower CrAnes. port CrAnes
 MoBiLe CrAnes tower CrAnes overhead CrAnes port CrAnes 004-14-201-WR203-06/00 Printed in Canada on Recycled Paper performance series performance series ropes For MuLti-purpose AppLiCAtions Backed by over
SET OF EUROLEAGUE BACKSTOP UNITS (Reference PK120)
") SET OF EUROLEAGUE BACKSTOP UNITS (Reference PK120) DESCRIPTION The EUROLEAGUE backstop unit is mainly designed for multi-sports pavilions and installations where the highest-level basketball competitions
SET OF EUROLEAGUE BACKSTOP UNITS (Reference PK120) DESCRIPTION The EUROLEAGUE backstop unit is mainly designed for multi-sports pavilions and installations where the highest-level basketball competitions
MICROPHONE WIND SPEED LIMITS DURING WIND FARM NOISE MEASUREMENTS
 MICROPHONE WIND SPEED LIMITS DURING WIND FARM NOISE MEASUREMENTS Abstract Jon Cooper 1 and Tom Evans 2 1 Resonate Acoustics, Level 1/23 Peel St, Adelaide SA 5000, Australia Email: jon.cooper@resonateacoustics.com