AMERICAN METEOROLOGICAL SOCIETY
|
|
|
- Gavin Rogers
- 5 years ago
- Views:
Transcription

1 AMERICAN METEOROLOGICAL SOCIETY Journal of Climate EARLY ONLINE RELEASE This is a preliminary PDF of the author-produced manuscript that has been peer-reviewed and accepted for publication. Since it is being posted so soon after acceptance, it has not yet been copyedited, formatted, or processed by AMS Publications. This preliminary version of the manuscript may be downloaded, distributed, and cited, but please be aware that there will be visual differences and possibly some content differences between this version and the final published version. The DOI for this manuscript is doi: /JCLI-D The final published version of this manuscript will replace the preliminary version at the above DOI once it is available. If you would like to cite this EOR in a separate work, please use the following full citation: Maroon, E., D. Frierson, S. Kang, and J. Scheff, 2016: The precipitation response to an idealized subtropical continent. J. Climate. doi: /jcli-d , in press American Meteorological Society
2 Manuscript (non-latex) Click here to download Manuscript (non-latex) mfks_postreview_finaldraft.docx 1 The precipitation response to an idealized subtropical continent 2 3 Elizabeth A. Maroon and Dargan M. W. Frierson Department of Atmospheric Sciences, University of Washington, Seattle, USA Sarah M. Kang School of Urban and Environmental Engineering, Ulsan National Institute of Science and Technology, Ulsan, Republic of Korea Jacob Scheff Lamont-Doherty Earth Observatory, Columbia University, Palisades, NY, USA Journal of Climate Revised February Corresponding author address: Elizabeth A. Maroon (emaroon@uw.edu), Department of Atmospheric Sciences, University of Washington, Box , Seattle, WA 98115, USA 1
3 28 Abstract A subtropical continent is added to two aquaplanet Atmospheric General Circulation Models (AGCMs) to better understand the influence of land on tropical circulation and precipitation. The first model, the Gray Radiation Moist (GRaM) AGCM has simplified physics, while the second model, the GFDL Atmospheric Model (AM) 2.1 is a fully comprehensive AGCM. Both models have a continent that is 60 wide from 10 N to 30 N, in an otherwise slab oceancovered world. The precipitation response varies with cloud and clear sky feedbacks and depends on continental albedo. In GRaM simulations with a continent, precipitation in the northern hemisphere decreases mostly due to decreased evaporation. In AM2.1 simulations, precipitation also shifts southward via Hadley circulation changes due to increasing albedo, but the radiative impact of clouds and moisture creates a more complex response. Results are similar when a seasonal cycle of insolation is included in AM2.1 simulations. The impact of a large, bright subtropical continent is to shift precipitation to the opposite hemisphere. In these simulations, the hemisphere of greater tropical precipitation is better predicted by the hemisphere with greater atmospheric energy input, as has been shown in previous literature, rather than the hemisphere that has higher surface temperature. 2
4 44 1. Introduction The Intertropical Convergence Zone (ITCZ) is associated with upward motion by the Hadley circulation and a maximum of zonal mean precipitation. The annual and zonal mean ITCZ is north of the equator, though its position is thought to have varied over the recent past (Hwang et al. 2013; Ridley et al. 2015) and the deeper past (Black et al. 1999; Haug et al. 2001; Koutavas and Lynch-Steiglitz 2003, Arbuszewski et al. 2013). Numerous model studies with hemispherically asymmetric forcings have noted accompanying ITCZ shifts (Rotstayn et al. 2000; Chiang et al. 2003; Chiang and Bitz 2005; Zhang and Delworth 2005; Broccoli et al. 2006; Yoshimori and Broccoli 2008; L Heveder et al. 2015; Kang et al. 2015). It has been suggested that the northward cross-equatorial ocean heat transport by the Atlantic Meridional Overturning Circulation is critical for displacing the ITCZ north of the equator in the present climate (Fučkar et al. 2013, Frierson et al. 2013, Marshall et al. 2013). In addition, northern hemisphere (NH) land is thought to be warmer than southern hemisphere (SH) land also due to the role of northward ocean energy transport (Kang et al. 2015) There are two perspectives on what determines the ITCZ position. One perspective emphasizes surface temperature (e.g. Xie 2005; Cvijanovic and Chiang 2013). As surface pressure gradients in the tropics are determined by the surface temperature gradients, anomalous crossequatorial boundary layer flows are driven by interhemispheric surface temperature gradients, and the ITCZ location is controlled by the region of convergence (Lindzen and Nigam 1987). The ITCZ position can also be interpreted as following the sea surface temperature (SST) maximum 3
5 64 65 with threshold behavior near 28 C in the tropics (Gadgil et al. 1984; Zhang 1993; Sud et al. 1999) The other perspective focuses on the atmospheric energy budget (e.g. Broccoli et al. 2006; Kang et al. 2008; Kang et al. 2009; Yoshimori and Broccoli 2009; Frierson and Hwang 2012; Seo et al. 2014; Maroon et al. 2015). An extratropical or tropical forcing that creates an interhemispheric gradient in energy can impact the Hadley Circulation. As a result, the Hadley circulation transports energy across the equator in the direction of its upper branch and transports moisture across the equator the opposite direction by its lower branch, shifting the ITCZ to the hemisphere with greater energy. Since the Hadley circulation transports energy toward the cooler hemisphere, to partly compensate the cooling, the two perspectives are broadly consistent. Kang and Held (2012) argued that the atmospheric energy budget and the moist static stability determine the ITCZ response, not the surface temperature. The tropical surface temperature response is suggested to be a result of the surface energy budget and not a driver of the tropical precipitation response During the solstice seasons, much of the cross-equatorial surface flow in the Hadley circulation occurs in the Asian monsoon region (Dima and Wallace 2003). If the monsoon is thought of as the summer displacement of the ITCZ over land (Chao and Chen 2001; Gadgil 2003), then theories of the ITCZ can be applied to monsoon circulations. Lindzen and Hou (1988) showed off-equatorial heating resulted in a stronger (weaker) Hadley cell in the winter (summer) hemisphere, in the dry angular-momentum conserving Held and Hou (1980) model. This variation in seasonal Hadley cell strength is also observed (Dima and Wallace 2003). The 4
6 Hadley circulation has nonlinear threshold behavior in response to subtropical heating in this model (Plumb and Hou 1992), but outside this axisymmetric framework, this threshold behavior is not always present. In complex AGCMs, eddies are thought to play a large role in the formation of monsoon circulations (Privé and Plumb 2007a,b; Bordoni and Schneider 2008). Simulations with regional subtropical diabatic heatings produce a Rossby and Kelvin wave response that affects dynamics outside the monsoon region (Gill 1980, Hoskins and Rodwell 1995). Rodwell and Hoskins (1996) connect diabatic heating from the summer Asian monsoon to the desertification of northern Africa, where NH summer subsidence from the Hadley circulation would otherwise be small Land surface effects also play a role in the subtropical precipitation distribution: Cook and Gnanadesikan (1991) show that the saturation of an idealized continent s surface affect the precipitation distribution over the continent. Cook (2003) show that the presence of continents in an AGCM simulation doubles the winter hemisphere Hadley cell s strength. Chou et al. (2001) note the importance of surface saturation on the precipitation of an idealized continent; they also show that ocean heat transport, ventilation, and the remote Rossby wave forcing of Rodwell and Hoskins (1996) all play a role in limiting the poleward extent of precipitation. Chou and Neelin (2001) and Chou and Neelin (2003) both emphasize the importance of the low MSE air ventilation over the continent and show that the Sahara s high albedo limits the poleward extent of precipitation. Privé and Plumb (2007a,b) also examine the role of idealized continents in modifying the tropical circulation and precipitation: they show that a maximum in MSE predicts the poleward edge of the monsoon precipitation in their model, building on work by Emanuel et al. (1994). Karnauskas and Ummenhofer (2014) show that the Hadley circulation is 5
7 composed of distinct regional and opposing circulations associated with the distribution of continents Here, we build on these past studies and examine how a subtropical continent modifies the precipitation distribution, the tropical circulation, and the energetic budget as compared to an aquaplanet. One of our aims is to see how energy transport and SST are related to the precipitation distribution. The two should be broadly consistent. The divergence of the atmospheric energy transport is equal to the sum of the top of atmosphere (TOA) and surface energy budgets. SST are an important factor in setting the surface energy budget; SST are also important for the TOA heat budget, but not in a straightforward way due to clouds. By adding subtropical land in our simulations, land surface temperature and column MSE are no longer as tightly linked because the land surface may be unsaturated. With limited surface moisture, surface absorbed SW must be balanced by increased sensible heat and LW surface fluxes, potentially raising land temperature. Ignoring cloud changes, increased clear-sky LW emission and greater reflected SW could decrease column MSE while simultaneously having a higher surface temperature. Should zonal mean precipitation then move toward the hotter, but drier, hemisphere? If the hot continent is a net energy sink, then the temperature and energetic perspectives will have predicted different locations We also explore a result from Frierson et al. (2013): the net TOA radiative imbalance (ignoring ocean heat transport) would indicate greater SH precipitation; the largest contributor to this TOA imbalance is from the Sahara. To test this hypothesis, our idealized continent is loosely 6
8 based on the approximate size and shape of the Sahara, and we also examine the role of continental albedo The two AGCMs used are described in Section 2. Section 3 contains the results for the simpler model, while Section 4 contains results for the more comprehensive AGCM. The seasonal cycle s impact in the comprehensive model is discussed in Section 5, with conclusions in Section Models Two GFDL AGCMs, the Gray Radiation Moist (GRaM) model and Atmospheric Model (AM)2.1, coupled to a mixed-layer ocean, are used in this study. This version of GRaM (Frierson et al. 2006) has a B-grid core with 2 x2 resolution and 25 vertical levels. The model includes latent heat release by condensation, but with gray radiation, water vapor does not impact radiation. Insolation is set to approximate the annual mean and SW absorption in the atmospheric column is set to 0.2; there is no seasonal or diurnal cycle and there is no sea ice. Because there are no clouds, the albedo is set to 0.29 over the ocean to bring the atmospheric energy budget closer to observed. LW radiation is calculated in one band with a prescribed optical depth meant to mimic the impact of water vapor. There are no cloud, ice, or water vapor radiative feedbacks in either the SW or LW. Large scale condensation along with a simplified Betts-Miller convection scheme (Frierson, 2007) is used. 7
9 An aquaplanet version of GFDL s AM2.1 with a mixed-layer ocean is used with annual mean insolation (Anderson et al. 2004, Delworth et al. 2006, Kang et al. 2008). All fields that would produce an asymmetric radiative forcing (e.g. ozone) have been symmetrized about the equator, and as with GRaM, there is no sea ice. The dynamical core uses finite volume numerics with 2.5 x2 horizontal resolution and 24 vertical hybrid pressure-sigma levels. The model has more elaborate physics than GRaM: comprehensive radiation, convection, and cloud schemes are implemented, and cloud and water vapor feedbacks are present. The radiative impact of aerosols is not included. A relaxed Arakawa-Schubert scheme (Moorthi and Suarez 1992) is used. The heat capacity of the slab ocean in both models is 1 x 10 7 JK -1 m -2 (which corresponds to 2.4m of water). The shallow mixed layer depth decreases the integration time to equilibrium and has little effect on the mean climate in comparison to deeper mixed layers in simulations without a seasonal cycle (Kang et al. 2008) The effect of the seasonal cycle on precipitation location is also tested in a set of AM2.1 simulations; for these experiments, the mixed layer heat capacity is increased to 1 x 10 8 JK -1 m -2 (24m of water) and no surface heat flux was used. These simulations address how robust the precipitation response is to seasonally varying insolation. We do not address the effect of seasonal cycle in the GRaM simulations as our version of this model does not yet have a seasonal cycle implemented A single NH continent, inspired by the Sahara, is placed in the subtropics. The continent has its southern and northern boundaries at 10 N and 30 N, and its western and eastern boundaries at 8
10 and 180. Aquaplanet simulations in both models were completed for comparison to the single continent simulations Both models were coupled to the GFDL Land Model 2 (LM2). This configuration of GRaM uses LM2.0 (Milly and Shmakin 2002) and this configuration of AM2.1 uses the similar LM2.1 (Delworth et al. 2006). Our specific AM2.1 configuration allows land location to be varied and was first implemented by Shi and Durran (2014). LM2 s hydrology is a simple one-bucket model, only a few steps more advanced from Manabe (1969). When the soil water reservoir reaches its maximum capacity, excess water runs off. Evapotranspiration is directly limited by soil moisture. Land parameters in both GRaM and AM2.1 are constant in time and space. In GRaM, the parameters used are the defaults for the ICCMp1 model (Farneti and Vallis 2009), from which our land-configurable version of GRaM was derived. These idealized values were likely chosen to cool off ICCMp1 s too hot land. The soil thermal diffusivity is six orders of magnitude too large, but the heat capacity of the land is very small in GRaM, and we are not conducting any simulations in GRaM with a seasonal or diurnal cycle. In AM2.1, the default land parameters are those from Scheff (2014); for vegetation, these parameters represent mixed broadleaf-needleleaf trees for all but the roughness, which is more representative of grassland. Table 1 compares the default parameters; in some cases they are very different In GRaM, land albedos of 0.15, 0.29, 0.40, and 0.60 are used, while in AM2.1, albedos of 0.0, 0.06, 0.20, 0.30, 0.40, and 0.60 are used; these albedos are chosen to span a wide range of possible albedos. From these two sets of experiments, a dark and a light simulation from each model are chosen for key comparison. As the default ocean albedo in GRaM is
11 (because GRaM has no clouds), the GRaM simulation with the land albedo of 0.29 is referred to as the dark GRaM case. We compare this dark simulation with the aquaplanet simulation and a light continent simulation with a land albedo of The AM2.1 simulation with 0.06 land albedo is the dark AM2.1 simulation since 0.06 is similar to the ocean s albedo near the continent (the ocean albedo varies with zenith angle). The dark AM2.1 simulation is compared with the aquaplanet simulation and a light simulation with a desert-like land albedo of For comparison, the albedo of the Sahara is (Ba et al. 2001). Seasonal cycle simulations in AM2.1 were completed with the same dark and light land albedos as in the annual-mean simulations Annual-mean GRaM and AM2.1 simulations are spun-up for 10 years, with an additional 5 years of simulation for the climatology. For the AM2.1 simulations with seasons, the model was initialized from the annual mean simulation with corresponding geometry and land albedo, and spun up for 20 years; the climatology is constructed from an additional 20 years beyond the spin-up period The climatologies of both models as aquaplanets have a few notable differences (Figure 1). The ITCZ in the GRaM simulation has a smaller precipitation maximum and is wider than the ITCZ in the AM2.1 simulation. The subtropics in the AM2.1 simulation are drier than in the GRaM simulation. GRaM s simulation also has a weaker Hadley circulation, weaker jets, and a lower tropopause when compared with those of AM The response of precipitation in GRaM simulations 10
12 To understand the impact of a subtropical continent on tropical precipitation in the simplest context, we start with a GRaM simulation that has a continent with the same albedo as the ocean. Later, we vary the continental albedo as well. 211 a. Dark continent simulation Compared to the aquaplanet GRaM simulation, the addition of a continent with the ocean s albedo decreases precipitation over the continent and over the ocean directly south of the continent (Figure 2a&c). Much of the precipitation decrease over the continent is due to a decrease in evaporation (Figure 2c). Zonal mean evaporation decreases by about 0.7 mm day - 1, due to the decrease of about 4 mm day -1 over the continent. Evaporation decreases by more than 90% over more of the continent; adding a dry continent significantly decreases evaporation, as would be expected Moisture convergence by mean meridional circulation (MMC) changes with the addition of the continent (Figure 2d). We calculate the changes in MMC moisture convergence as: δ[v ][q ] g dp = {[v ]}δ[q ] g dp {[q ]}δ[v ] dp g (1) where v is the meridional wind component, q is the specific humidity, square brackets [] are zonal means, overbars are time means, δ refers to the difference in the quantity between two simulations (e.g., vcont-vaquaplanet), and the curly brackets {} refer to the mean of a quantity in those two simulations (e.g., [vcont+vaquaplanet]/2). Here, represents the horizontal spherical divergence operator; because the quantities are already zonally averaged, the divergence is equivalent to the latitude (φ) component of the divergence, 11 1 a cos(φ) φ (cos(φ) A φ), where A φ is
13 the quantity that being operating on and a is the Earth s radius. The vertical integrals are calculated over the entire column; for a full derivation of the water vapor budget and spherical divergence, see Peixoto and Oort (1992) In the dark continent simulation, the decreased moisture convergence decrease to the south of the continent that is more due to changes in circulation (dark green line, Figure 2d) than in moisture (dark purple line, Figure 2d). The overturning circulation weakens in the NH due to the continent (Figure 2e). This circulation change between 0 and 15 N extends through the troposphere and has anomalous ascent over the southern portion of the continent, while subsidence at 30 N is enhanced. At the surface, the weakened overturning circulation decreases moisture convergence on the northern side of the ITCZ, decreasing ITCZ precipitation (Figure 2e, 3a). Over the southern half of the continent, the anomalous moisture convergence offsets some of the decreased evaporation The soil is not saturated, disfavoring evaporation. As a result, the absorbed surface SW is now balanced by increased in sensible heat flux and upward LW flux over the continent and the surface temperature increases (Figure 2a and 3a). The NH temperature is higher than that of the SH (dark blue line, Figure 4a). If hemispheric precipitation were solely dependent on surface temperature, then the hotter NH would have greater precipitation than the SH. However, the decrease in evaporation due to a lack of surface moisture disfavors greater NH precipitation. The interhemispheric difference in total (combined land and ocean) surface temperature therefore predicts the wrong hemisphere for greater precipitation. The interhemispheric difference of SST (which does not include the unsaturated surface) could be a 12
14 better measure of which hemisphere has greater precipitation because it only includes regions where boundary layer moisture is available. However, in this simulation, the NH also has higher SST because of the continent s proximity (Figure 2a and 3a). Compared to the SH, the NH has higher SST in the tropics (dark blue line, Figure 4b). Precipitation decreases near the continent, even though SST is higher than at the equator (Figure 3a). The change in the land-induced circulation and stability is more important for determining precipitation than is the local SST Although the change in mass transport at the equator is small, there is a small heat transport from the SH to the NH. This must be balanced by an interhemispheric difference in the net TOA radiation budget (e.g., Kang et al. 2008). The NH-SH difference in net TOA radiation is negative (dark blue line, Figure 4c) because of increased OLR over the northern half of the continent due to its higher temperature (there is no greenhouse or cloud radiative effects in GRaM). The NH is a net sink of MSE compared to the SH, so energy fluxes into that hemisphere. Regardless, in this simulation, the precipitation changes are due mostly to evaporation. In Kang et al. (2009), which connects changes in precipitation to the energetic budget, changes in evaporation are assumed to be small; here, the addition of a dry continent results in a large evaporation change relative to the aquaplanet b. Continents with varying albedo With a higher albedo continent, precipitation decreases similarly to the dark continent simulation (Figure 2b). However, the ITCZ shifts more noticeably to the south (light blue line, Figure 2c). The evaporation decrease over the continent is still large (light red line, Figure 2c), 13
15 but there is also anomalous moisture convergence south of the equator due to small changes in the MMC (light green line, Figure 2d). In the upper troposphere, there is an anomalous crossequatorial Hadley circulation (Figure 2f). This feature was weaker in the dark simulation (Figure 2e). This anomalous circulation transports MSE from the SH to NH, and transports moisture southward between hpa at the equator (light green line, Figure 2d). At the surface, the anomalous land-induced circulation decreases the southward moisture transport into the ITCZ (Figure 5). With higher albedo, the southward moisture transport in the hPa layer becomes larger than the northward surface transport In this simulation, precipitation is still mostly constrained by evaporation, but a small amount of the ITCZ shift can be attributed to the interhemispheric difference in TOA radiation (light blue line, Figure 2c). The SST are larger in the NH tropics than in the SH tropics (Figures 2b, 3b, and 4b) as they were in the dark simulation. Over the entire hemisphere, SST are slightly lower in the NH than in the SH, mainly from a SST decrease in the northern extratropics. These decreased SST are accompanied by a weak decrease in OLR in the NH extratropics (light blue line, Figure 4c) and are due to decreased NH heat transport. However, the largest change in the hemispheric difference of TOA net radiation comes from the decreased SW flux from higher land albedo The NH-SH difference in net TOA radiation is proportional to the transport of energy across the equator. Greater energy in the SH compared to the NH indicates a northward transport of energy. This northward transport of energy would accompany a southward shift of precipitation minus evaporation (P-E) along the equator if the Hadley circulation changes there. 14
16 Examining P-E accounts for evaporation, and shows how much of the moisture transport change can be attributed to the energy budget. Figure 6a shows the NH-SH TOA net radiation against NH-SH P-E, and Figure 6b-c break this quantity into NH-SH TOA LW and SW (both defined as positive for an addition of energy into the Earth). With increasing albedo, NH-SH SW radiation becomes more negative because of increasing NH reflection. NH-SH LW radiation increases with increasing albedo due to decreasing OLR from the lower surface temperatures. For a given albedo, NH-SH LW radiation partially offsets the NH-SH SW radiation changes, leading to a NH-SH net radiation change that has the same sign as SW radiation. NH-SH P-E is linear with changes in all three NH-SH radiation quantities. The amount of hemispheric precipitation asymmetry that is not due to evaporation can be attributed to circulation changes at the equator The response of precipitation in AM2.1 simulations Equivalent simulations are completed in the AM2.1 model for comparison to the GRaM simulations. The land albedo in the dark AM2.1 simulation is 0.06 (the approximate albedo of the subtropical ocean), while the albedo in the light AM2.1 simulation is The AM2.1 simulations with a subtropical continent have a more complex response than the GRaM simulations because of the radiative impact of clouds and water vapor feedbacks a. Dark continent simulation 15
17 Subtropical precipitation in the AM2.1 aquaplanet model is already low (Figure 1a), so the addition of a continent can decrease precipitation by only a small amount over the continent (Figure 7a). The change in evaporation over the continent in the AM2.1 simulation is similar to the evaporation change in GRaM (note different y-axis scales between 2c and 7c). In contrast to evaporation, the change in the tropical precipitation in AM2.1 is much larger than in GRaM, and is due to larger relative changes in moisture convergence. As in the light GRaM simulation, these changes are mostly due to changes in the MMC, not to changes in moisture (Figure 7d). Changes in the MMC moisture transport are larger than the changes in precipitation due to transients. Also unlike the GRaM simulations, in the AM2.1 dark simulation, there is large zonal variation in precipitation and vertical motion (Figures 7a and 8). To the west of the continent, the ascending motion shifts southward and precipitation moves south with it; to the east of the continent, the opposite happens. In the zonal band with the continent, a shallow land-induced circulation develops with ascending air over the southern half of the continent (Figure 8b). There is also deep anomalous descent at the equator in this region. A northward shift of the NH jet also occurs due to the addition of the dark continent (Figure 7e). The shift is strongest at 200 hpa, occurs at all longitudes, and also appears weakly at the surface. This jet shift could be associated with changes in baroclinicity associated with meridional surface temperature gradient changes, resulting from changes in cloud cover or latent heating due to the different surface type In the deep tropics, these regional precipitation shifts sum to a zonal mean precipitation decrease at the equator and an increase on its flanks (Figure 7c), coincident with a decrease in the strength of the Hadley circulation (Figure 7e). Part of the explanation for these sharp 16
18 precipitation shifts is that the ITCZ in the AM2.1 control simulation is already very narrow (Figure 1a); a small displacement of the ITCZ leads to a large change in local precipitation. 335 In this simulation, there is slightly greater precipitation in the NH. As examined previously with the GRaM simulations, we look at whether the precipitation follows the warmer hemisphere or the hemisphere with greater energy. Overall, the total surface temperature and SST are higher in the NH, though temperature changes are not spatially uniform. In the region of the continent, SST increase north of the equator, up to 32 C, while precipitation decreases at the equator (Figure 3c, 7a). The hottest SST in the deep tropics are associated with a region of decreased precipitation because the tropical circulation is less amenable to deep convection. Other regions show notable changes in SST. Anomalously low SST form to the west of the continent due to increasing low clouds. The NH is also the hemisphere with more absorbed radiation. In this simulation, there is higher hemispheric-average SST and TOA net radiation in the hemisphere of greater precipitation (dark red lines, Figure 4a-c). As a result, this simulation cannot distinguish between the SST and energetic perspectives on the hemisphere of greater precipitation, as both perspectives would predict the NH hemisphere. However, the local relation between SST and precipitation is not consistent: the region with highest SST does not have the greatest precipitation (Figure 3c) Due to the zonally-varying ITCZ shifts, the hemispheric difference in TOA net radiation is composed of zonally compensating terms. Figures 9 and 10 decompose the TOA radiation budget into LW and SW clear and cloudy sky terms. To diagnose LW changes, the TOA LW is decomposed into the clear sky LW component (which is a model diagnostic) and LW cloud 17
19 forcing (the difference of the total and the clear sky). The SW cloudy and clear sky portions are calculated using the Approximate Partial Radiative Perturbation (APRP) method (Taylor et al. 2007), which takes cloud masking into account. Using the APRP method, changes in SW radiative forcing are decomposed into the changes due to cloud fraction, atmospheric scattering coefficient in clear and cloudy conditions, surface albedo in clear and overcast skies, and clear sky and cloud absorption; a positive sign indicates energy into the atmosphere. Here, we use the changes in the terms from cloud fraction and cloud scattering for the change in SW cloud radiation. The remainder of the terms, surface albedo in clear sky and in overcast conditions, clear sky atmospheric scattering, and clear sky atmospheric absorption, constitute the change in SW clear-sky radiation. The residual term in the APRP decomposition is small In the dark simulation, the NH absorbs slightly more energy than the SH (black line, Figure 9a). Having greater net energy input in the NH would favor greater precipitation in the NH as well, as described above. Though the NH absorbs slightly more energy than the SH, the longitudinal variation in the individual radiation terms is large because of the varying directions of ITCZ shifts and the direct impact of the continent. Where the ITCZ shifts across the equator, changes in LW and SW cloud radiation oppose each other. When the ITCZ s clouds shift toward one hemisphere, the deep clouds reduce SW absorbed there, but they also cause greater LW trapping (Figure 10a,e). The opposite happens when the ITCZ clouds shifts away: there is more absorbed SW due to decreased reflection by deep clouds, and there is more OLR with fewer high clouds. In the deep tropics, the changes in SW cloud radiation are larger than those from 18
20 LW cloud radiation. The combined SW and LW cloud radiative changes oppose the shift in the ITCZ because they decrease the net energy into the hemisphere with the ITCZ (Figure 10a,e). ITCZ shifts also change the clear sky LW absorbed in the deep tropics: with greater moisture in the shifted ITCZ, more clear sky LW is trapped (Figure 10g). Where the ITCZ shifts, the SW term dominates over LW cloudy and clear sky together. In the zonal mean, the changes in clear sky LW forcing are small equatorward of 5 (Figure 9a). SW cloud radiation changes dominate because of the positive NH SW cloud radiation changes in the longitudes of the continent (Figure 10a). From 5-15, LW clear and cloud sky forcing is larger than SW. As a result, NH-SH TOA net radiation is positive, indicating greater energy input into the NH, which is also where the zonal mean precipitation has shifted There are other notable radiation changes associated with the addition of the continent. In this AM2.1 simulation, these other changes altogether have a small net impact on the interhemispheric difference in TOA radiation. Decreases in low clouds over the continent lead to more absorbed SW, especially over its northwestern corner (Figure 10a). Low stratus clouds form west of the continent, which decreases the absorbed SW. The formation of these clouds could be due to dry continental air temporarily increasing evaporation, cooling the surface, and increasing subsidence. This increasing subsidence creates stratocumulus, which then maintain themselves. Their formation could be from subsidence due to a Rossby-wave response from the monsoon region (as in Rodwell and Hoskins 1996), or from increased subsidence from the southward shifted overturning circulation. Regardless, lower SST and subsidence from these clouds disfavors NH deep ascent in this region (Figure 8a). 19
21 Over the southern part of the continent, LW increases due to the increase of higher clouds from the weak monsoon-like circulation (Figure 10e). Clear sky OLR increases due to the hotter continent surface. As mentioned above, in the zonal mean, these regional TOA radiative changes together result in the NH having slightly more net radiation absorbed than the SH, mostly between the equator and 20 N (Figure 9a) An examination of individual APRP terms shows that SW changes most from changes in surface albedo, cloud fraction, or cloud scattering (not shown). Changes in cloud fraction and scattering contribute to the change in SW cloud forcing, with cloud fraction decrease most important over land and changes in scattering most important south of the continent; elsewhere cloud fraction and scattering share responsibility for changes. Unless surface albedo changes, the clear sky SW changes little; SW clear sky radiation increases a little in the subtropics due to overcast-sky surface albedo changes (cloud masking) b. Continent simulations with varying albedo Increasing the albedo of the continent creates a stronger interhemispheric difference in TOA net radiation than in the dark simulation. In the light continent case where the land albedo is 0.30 (comparable to the albedo of Earth s deserts), the higher albedo decreases the NH absorbed SW (light red line, Figure 4c). In the zonal mean, this creates an anomalous Hadley circulation across the equator (Figure 7f) that moves more energy to the NH, more moisture to the SH, and increases the precipitation in the SH relative to the NH, as compared with the dark simulation (Figure 7a,b). The anomalous monsoon-like circulation over the continent is 20
22 shallower than in the dark simulation likely due to decreased SW surface absorption with the higher albedo. The NH jet decreases on the equatorward side, but does not shift substantially (Figure 7f) The precipitation distribution in the light simulation has a different pattern from the dark simulation (Figure 7b). The ITCZ shifts south of the equator everywhere in the light simulation, unlike in the dark simulation where it varied about the equator; the shift is still largest to the continent s west. Because the ITCZ shifts southward everywhere in the light simulation, the changes in SW and LW radiative forcing in the deep tropics are more zonally uniform than in the dark continent case (Figure 9b, 10b,d,f,h). As in the dark simulation, the ITCZ shift determines the change in local radiative forcing because it moves moisture and deep clouds (Figure 10). In the ITCZ region, the change in TOA SW cloud radiation is larger than the opposing change in the total TOA LW radiation. Our result that SW changes outweigh LW changes was also found in Kang et al. (2014), but differs from the simulations using other forcing types in AM2.1 where changes in total LW was greater than SW in the ITCZ shift (see, for instance, Maroon et al. 2015; Woelfle et al. 2015). Cloud responses are likely model dependent: in Cvijanovic and Chiang (2013) s CAM simulations, the LW response was larger than the SW. Because of the SW dominance in the ITCZ shift, the NH has greater net radiation absorbed than the SH in the deep tropics (black line, Figure 9b) NH-SH TOA radiation changes the most in the subtropics, where the increased albedo has largely reduced the absorbed SW over the NH continent (Figure 10d). As in the dark simulation, clouds decrease over the dry continent, which increases the absorbed SW cloud forcing in that 21
23 region. The hotter surface also increases the clear sky OLR. Stratus clouds again form off the west coast of the continent, which decreases absorbed SW cloud radiation. In the zonal mean, these effects largely offset each other between 10-30, and the NH-SH net radiation difference is of the same sign and similar magnitude to the change in SW clear sky radiation due to the change in surface albedo (Figure 9b). Because other terms compensate, the change in clear sky SW from albedo largely determines which hemisphere receives more tropical precipitation (Figure 6) These results are similar for AM2.1 simulations with albedos higher than NH-SH SW cloud sky radiation and LW total radiation compensate in the other AM2.1 simulations with varying land albedo (Figure 6d,e). Except for the simulations with the highest and lowest albedo, all simulations show a similar response to the continent s west (Figure 7b): the formation of stratocumulus clouds is a robust result that decreases the absorbed SW in the NH relative to the SH, regardless of land albedo. These clouds also create an interhemispheric imbalance in TOA radiation that in isolation would amplify the southward ITCZ shift As albedo increases, the tropical rainfall distribution changes from a longitudinally-varying structure (as in the dark simulation) into a zonally-coherent southward ITCZ shift (as in the light simulation). The 0.2-albedo simulation shows this evolution between the dark and light simulations described above. The 0.2-albedo case has a southward shift to the continent s west that is similar to the dark simulation, but a weak northward shift on the continent s east side. As the precipitation shifts change, the NH-SH TOA net radiation follow the precipitation shifts (Figure 7a,b). West of the continent, the NH-SH TOA radiation does not change until an albedo 22
24 of 0.6 is reached. East of the continent, the NH-SH radiation changes sign with increasing albedo. With the brightest albedo, there is a uniform southward precipitation shift. The ITCZ is in the SH everywhere with no ascent over the continent Including the seasonal cycle in AM2.1 simulations Next we examine the robustness of the precipitation shifts with a subtropical continent when the seasonal cycle is included in AM2.1. The aquaplanet control simulation has a broad equator-centered ITCZ with off-equatorial peaks that have a small amount of random asymmetry (Figure 11a). The seasonal cycle is responsible for the peaks in precipitation on either side of the equator. Seasonally varying midlatitude storm tracks are also present (Figure 12a). The annual mean overturning streamfunction and jets are weaker than in the annualmean insolation aquaplanet AM2.1 simulation (Figure 13) With a dark continent in a simulation with seasonal insolation, continental evaporation decrease (dark grey lines, Figure 11b). In the annual mean, both peaks in tropical precipitation shift southward slightly (Figure 11b-c). The ITCZ migrates across the equator faster with the continent (Figure 12b). Compared to the aquaplanet simulation, the ITCZ in the dark simulation is farther south from October-March as it moves to the SH, while from May-August, the ITCZ is farther northward as it moves to the NH. Figures 11e&g show that precipitation is farther poleward in both JJA and DJF than in the aquaplanet simulation. This simulation has soil saturation and runoff, unlike the annual-mean insolation simulations. 23
25 Changes in overturning streamfunction match the precipitation changes. Adding a dark continent causes a small annual-mean circulation change in the form of a shallow monsoon circulation with ascent near 20 N (Figure 14a). The subtropical continent strengthens the solstice-season winter-hemisphere Hadley circulation from the aquaplanet (Figure 14c,e). These results are similar to simulations in Cook (2003) where the presence of realistic continents doubles the strength of the winter hemisphere Hadley cells. In both JJA and DJF, anomalous southwesterly 10m winds at the southwest corner of the continent decrease the trade winds. In JJA, this flow is strong enough to reverse the trade winds, resulting in a lowlevel westerly jet, reminiscent of the West African Westerly Jet (Grodsky et al. 2003; Pu and Cook 2012). This low level jet is not present in the annual mean simulations In the dark simulation with seasons, annual mean SST increase south of the continent where annual mean precipitation also decreases, just as in the earlier dark simulation with annual mean insolation (Figure 11c). Precipitation and SST increase together during JJA when the monsoon-like circulation is strongest (Figure 11e). However, the DJF precipitation decrease is larger than the JJA increase, and occurs alongside a modest SST increase near the continent (Figure 11g); the changes in SST are not as important as the extra southward moisture transport due to the strengthened winter monsoon circulation. To the continent s west where low clouds form, SST and precipitation decrease together year-round. While the SST and precipitation changes are consistent in JJA and in the low cloud region, SST alone does not always diagnose the change in annual mean precipitation everywhere. 24
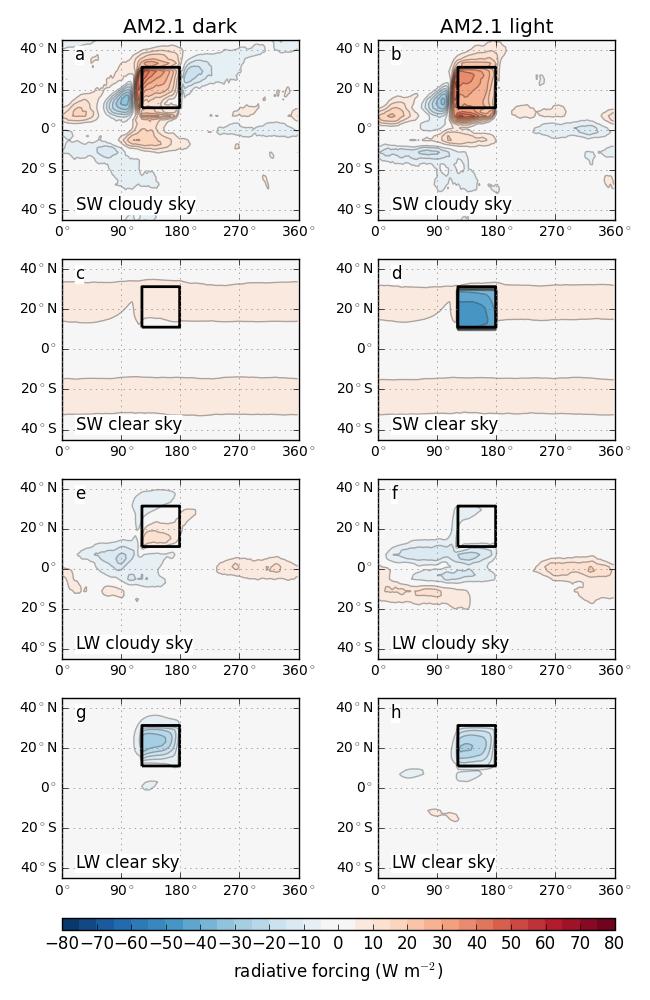
26 Although the addition of the continent causes large changes in SW cloudy sky and LW clear sky radiation over the continent, the hemispheric difference in TOA radiation is close to zero over the continent (Figure 15a, 16a,g). The weak southward shift in precipitation is consistent with greater absorbed energy in the SH, but some of the precipitation change in this simulation is due to a decrease in evaporation Some aspects of the TOA radiation changes are similar to those in the annual-mean insolation simulations (Figure 10 versus 16). SW cloudy sky radiation increases over the continent and decreases over the low cloud deck to the continent s west. The decrease in SW cloudy sky radiation from increased low clouds is weaker than in the annual mean simulation. LW clear sky radiation decreases over the continent due to greater OLR, as before. The ITCZ shifts are smaller in this simulation and the corresponding shifts in TOA radiation are also smaller. There is some hint of opposing changes in SW and LW cloudy sky radiation, especially southwest of the continent With a higher albedo (0.3), precipitation shifts farther south, especially the SH ITCZ (Figure 11b,d). The increase in albedo limits the amount of precipitation that reaches the continent. An anomalous Hadley circulation forms across the equator with its upper branch moving mass and energy into the NH (Figure 14b). The solstice season precipitation and anomalous Hadley cells are still stronger than in the aquaplanet simulation (Figure 11f,h and 14d,f). However, the asymmetry between JJA and DJF increases when compared to the dark albedo simulation. The amplified seasonal shift of the ITCZ into the SH now occurs from September through May and has increased in magnitude (Figure 12c). The shift during JJA decreases. The winter 25
27 hemisphere Hadley cells in both solstice seasons are stronger than in the aquaplanet, but the DJF cell is stronger than the JJA cell in the light simulation. In addition, the addition of the light continent causes a SH jet shift and southward ITCZ shift in DJF, similar to results in Ceppi et al. (2013) Annual mean SST south of the continent increases, while annual mean precipitation decreases in the light simulation (Figure 11d). In contrast to the dark seasonal-cycle simulation, JJA precipitation does not change while SST increases to the south of the continent (Figure 11e vs 11f). The light simulation s JJA anomalous Hadley cell is weaker than the dark simulation s, indicating less northward moisture transport to the continent, while the SST are higher because of its proximity to the continent. JJA precipitation also increases east of the continent, while SST there do not change. In DJF, precipitation and SST decrease together consistently. These results support the idea that SST changes alone do not always explain the changes in precipitation location The higher albedo leads to a larger NH-SH TOA radiation difference (Figure 15b), just as in the annual-mean insolation simulations. While SW cloudy sky radiation increases over land (Figure 16b), LW clear sky radiation decreases over land when compared with the dark continent simulation (Figure 16h), also like the annual-mean insolation simulations (Figure 10h). In addition, LW cloudy sky radiation decreases in the NH tropics and increases in the SH from the larger southward ITCZ shift (Figure 16f). LW cloudy sky radiation also changes similarly in the annual-mean simulation (Figure 10f). As a result, the hemispheric difference in net radiation is larger than that from changes in surface albedo alone. The cloud and clear sky changes amplify 26
28 the NH energy deficit and the ITCZ s southward shift. The details of the seasonal cycle simulation s radiation budget differs from those of the annual-mean insolation simulations (e.g., larger SW cloud radiation changes outside the continent), but the addition of seasons does not change the qualitative results Summary and Conclusions The precipitation response to the addition of a subtropical continent has been studied in two AGCMs of differing complexity. In the GRaM model, which lacks radiative feedbacks, the primary response to a subtropical continent is to decrease precipitation in the NH because of decreased evaporation over the dry continent. As the land albedo increases, a weak, anomalous Hadley circulation transports moisture to the SH, in addition to the evaporationdriven response The annual-mean AM2.1 simulations have a zonally-varying precipitation response, but the main result, that a bright continent shifts zonal-mean tropical precipitation southward, is the same. Evaporation changes are relatively unimportant in the AM2.1 simulations; deep circulation changes are responsible for the altered precipitation distribution. The changes in clouds and water vapor amplify the Hadley circulation response. In the deep tropics, the ITCZ shift creates compensating clear and cloudy sky responses, with the SW radiation slightly dominating the balance; the cloud response would likely differ in other models. The surface albedo sets the hemispheric difference in net radiation because the total LW and SW cloud radiation changes compensate. As a result, the continent s albedo determines the location of 27
29 greater precipitation. These simulations support Chou et al. (2001) s result that high land albedo limits the northward extent of the monsoon and paleoclimate studies of the Green Sahara that point to the importance of albedo-precipitation feedbacks (Kutzbach et al. 1996; Bonfils et al. 2001; Levis et al, 2004) AM2.1 simulations with seasons share the main results in the annual-mean simulations. The ITCZ shifts in the seasonal simulations are weaker, partially due to the broader aquaplanet ITCZ. The changes in TOA radiation components are qualitatively similar. The ITCZ shifts southward with increasing albedo, though the seasonal cycle changes many details of the radiation decomposition. The presence of a single continent strengthens the cross-equatorial Hadley cell during solstice seasons, as seen in Cook (2003). Although we do not include ocean heat transport, the results of Chou et al. (2001) and Clement (2006) indicate that surface fluxes are also important for the seasonal Hadley circulation Surface temperature alone does not dictate which hemisphere should have the greater precipitation. Rather, the hemispheric difference in TOA net radiation is more important because of its impact on the Hadley circulation. All GRaM and AM2.1 annual-mean simulations with land have a NH with higher surface temperature, but some of these simulations also have a NH that was a net energetic sink (both GRaM simulations and the light AM2.1 simulation). When evaporation is included, the energetic perspective correctly predicts the hemisphere of greater precipitation. When examining tropical SST (which, based on the conclusions of a significant body of literature on tropical precipitation, should more directly control the ITCZ), tropical precipitation in the dark GRaM simulation was better predicted by TOA net radiation 28
30 than by SST. The hemisphere with the continent is warmer in terms of land and ocean surface temperature, but has less MSE Frierson et al. (2013) showed that without examining ocean heat transport, the Saharan energy sink should constrain the SH as the ITCZ location. Our continent with bright albedo shows this result as well, further indicating the importance of the Atlantic Meridional Overturning Circulation s ocean heat transport in the observed zonally-averaged location of tropical precipitation. The regionally shifting ITCZ in our AM2.1 continent simulations should not be compared to observations; this steady response is not seen in the simulations with seasonally varying insolation. Rather, the relevant result is that the ITCZ shifts southward zonally due to the addition of a hot subtropical continent with a bright albedo. This result is robust to the addition of seasonal insolation The study of single continents in an AGCM examines the fundamental influence that land has on tropical precipitation, circulation, and radiation in isolation of other geographic features. Without other continents, this single continent setup could be used for climate model comparisons to study ocean-land-atmosphere interactions among models and how past albedo changes may have altered precipitation Acknowledgements EAM was supported by a NDSEG fellowship and an NSF IGERT Program on Ocean Change traineeship. DMWF, EAM, and JS were supported by NSF grants AGS , AGS , 29
31 AGS , PLR , and a UW Royalty Research Fund grant. SMK was supported by Basic Science Research Program through the National Research Foundation of Korea (NRF) funded by the Ministry of Science, ICT and Future Planning (2013R1A1A ). JS was supported by AGS References and Citations Anderson, J. L., and Coauthors, 2004: The new GFDL global atmosphere and land model AM2 LM2: Evaluation with prescribed SST simulations. J. Climate, 17, , doi: / JCLI Arbuszewski, J. A., P. B. demenocal, C. Cléroux, L. Bradtmiller, and A. Mix, 2013: Meridional shifts of the Atlantic intertropical convergence zone since the Last Glacial Maximum. Nat. Geosci., 6, Ba, M. B., R. Frouin, S. E. Nicholson, and G. Dedieu, 2001: Satellite-Derived Surface Radiation Budget over the African Continent. Part I: Estimation of Downward Solar Irradiance and Albedo. J. Climate, 14, Black, D. E., L. C. Peterson, J. T. Overpeck, A. Kaplan, M. N. Evans, and M. K. Kashgarian, 1999: Eight centuries of North Atlantic ocean atmosphere variability. Science, 26, , doi: /science Bonfils, C., N. de Noblet-Ducoudré, P. Braconnot, and S. Joussaume, 2001: Hot desert albedo and climate change: Mid-Holocene Monsoon in North Africa. J. Climate., 14,
32 Bordoni, S. and T. Schneider. (2008) Monsoons as eddy-mediated regime transitions of the tropical overturning circulation. Nat. Geosci., 1, Broccoli, A. J., K. A. Dahl, and R. J. Stouffer, 2006: Response of the ITCZ to Northern Hemisphere cooling. Geophys. Res. Lett., 33, L01702, doi: /2005gl Ceppi, P., Y.-T. Hwang, X. Liu, D. M. W. Frierson, and D. L. Hartmann, 2013: The relationship between the ITCZ and the Southern Hemispheric eddy-driven jet. J. Geophys. Res. Atmos., 118, Chao, W. C., and B. Chen, 2001: The origin of monsoons. J. Atmos. Sci., 58, Chiang, J. C. H., and C. M. Bitz, 2005: Influence of high latitude ice cover on the marine Intertropical Convergence Zone. Climate Dyn., 25, , doi: /s Chiang, J. C. H., M. Biasutti, and D. S. Battisti, 2003: Sensitivity of the Atlantic Intertropical Convergence Zone to Last Glacial Maximum boundary conditions. Paleoceanography, 18, 1094, doi: / 2003PA Chou, C., J. D. Neelin, and H. Su, 2001: Ocean-atmosphere-land feedbacks in an idealized monsoon. Quart. J. Roy. Meteor. Soc., 127, Chou, C. and J. D. Neelin, 2001: Mechanisms limiting the southward extent of the South American summer monsoon. Geophys. Res. Lett., 28, Chou, C., and J. D. Neelin, 2003: Mechanisms limiting the northward extent of the northern summer monsoons over North America, Asia, and Africa. J. Climate, 16,
33 Clement, A. C., 2006: The Role of the Ocean in the Seasonal Cycle of the Hadley Circulation. J. Atmos. Sci., 63, Cook, K. H., and A. Gnanadesikan, 1991: Effects of saturated and dry land surfaces on the tropical circulation and precipitation in a general circulation model. J. Climate, 4, Cook, K. H., 2003: Role of continents in driving the Hadley cells. J. Atmos. Sci., 60, , Cvijanovic, I. and J. C. H. Chiang, 2013: Global energy budget changes to high latitude North Atlantic cooling and the tropical ITCZ response. Clim. Dyn., 40, Delworth, T. L., and Coauthors, 2006: GFDL s CM2 global coupled climate models. Part I: Formulation and simulation characteristics. J. Climate, 19, , doi: /jcli Dima, I. M., and J. M. Wallace, 2003: On the seasonality of the Hadley cell. J. Atmos. Sci., 60, Emanuel, K. A., J. D. Neelin, and C. S. Bretherton, 1994: On large-scale circulations in convecting atmospheres. Quart. J. Roy. Meteor. Soc., 120, Farneti, R., and G. K. Vallis, 2009: An Intermediate Complexity Climate Model (ICCMp1) based on the GFDL flexible modelling system. Geosci. Model Dev., 2, 73 88, doi: / gmd Frierson, D. M. W., 2007: They dynamics of idealized convection schemes and their effect on the zonally averaged tropical circulation. J. Atmos. Sci., 64, , doi: /jas
34 Frierson, D. M. W., I. M. Held, and P. Zurita-Gotor, 2006: A gray radiation aquaplanet moist GCM. Part I: Static stability and eddy scale. J. Atmos. Sci., 63, , doi: /jas Frierson, D. M. W. and Coauthors, 2013: Contribution of ocean overturning circulation to tropical rainfall peak in the Northern Hemisphere. Nat. Geosci., 6, , doi: /ngeo Frierson, D. M. W. and Y.-T. Hwang. (2012) Extratropical Influence on ITCZ Shifts in Slab Ocean Simulations of Global Warming. Journal of Climate, 25, Fučkar, N. S., S.-P. Xie, R. Farneti, E. A. Maroon, and D. M. W. Frierson, 2013: Influence of the extratropical ocean circulation on the intertropical convergence zone in an idealized coupled general circulation model. J. Climate, 26, , doi: /jcli-d Gadgil, S., P. V. Joseph and N. V. Joshi, 1984: Ocean-atmosphere coupling over monsoon regions. Nature, 312, Gadgil, S., 2003: The Indian monsoon and its variability. Annu. Rev. Earth Planet. Sci., 31, Gill, A. E., 1980: Some simple solutions for heat-induced tropical circulation. Quart. J. Roy. Meteor. Soc., 106, Grodsky, S. A., J. A. Carton, and S. Nigam, 2003: Near surface westerly wind jet in the Atlantic ITCZ. Geophys. Res. Lett., 30, doi: /2003gl
35 Haug, G. H., K. A. Hughen, D. M. Sigman, L. C. Peterson, and U. Rohl, 2001: Southward migration of the intertropical convergence zone through the Holocene. Science, 293, Held, I. M., and A. Y. Hou, 1980: Nonlinear axially symmetric circulations in a nearly inviscid atmosphere. J. Atmos. Sci., 37, Hoskins, B., and M. Rodwell, 1995: A model of the Asian summer monsoon. Part I: The global scale. J. Atmos. Sci., 52, Hwang, Y.-T., D. M. W. Frierson and S. M. Kang, 2013: Anthropogenic sulfate aerosol and the southward shift of tropical precipitation in the late 20th century. Geophys. Res. Lett., 40, , doi: /grl Kang, S. M., and I. M. Held, 2012: Tropical precipitation, SSTs and the surface energy budget: A zonally symmetric perspective. Climate Dyn., 38, , doi: /s Kang, S. M., I. M. Held, D. M. W. Frierson, and M. Zhao, 2008: The response of the ITCZ to extratropical thermal forcing: Idealized slab ocean experiments with a GCM. J. Climate, 21, , doi: /2007jcli Kang, S. M., D. M. W. Frierson, and I. M. Held, 2009: The tropical response to extratropical thermal forcing in an idealized GCM: The importance of radiative feedbacks and convective parameterization. J. Atmos. Sci., 66, , doi: / 2009JAS Kang, S. M., I. M. Held, and S.-P. Xie, 2014: Contrasting the tropical responses to zonally asymmetric extratropical and tropical thermal forcing, Climate Dyn., 42,
36 Kang, S. M., R. Seager, D. M. W. Frierson, and X. Liu, 2015: Croll revisited: Why is the Northern Hemisphere warmer than the Southern Hemisphere? Climate Dyn.,44 doi: /s z Kang, S. M., B.-M. Kim, D. M. W. Frierson, S.-J. Jeong, J. Seo and Y. Chae, 2015: Seasonal dependence of the effect of Arctic greening on tropical precipitation, J. Climate, 28, Karnauskas, K. B. and C. C. Ummenhofer, 2014: On the dynamics of the Hadley circulation and subtropical drying. Clim. Dyn., 42, Koutavas, A., and J. Lynch-Stieglitz, 2003: Glacial interglacial dynamics of the eastern equatorial Pacific cold tongue Intertropical Convergence Zone system reconstructed from oxygen isotope records. Paleoceanography, 18, 1089, doi: / 2003PA Kutzbach, J. and G. Bonan, and J. Foley and S. P. Harrison, 1996: Vegetation and soil feedbacks on the response of the African monsoon to orbital forcing in the early to middle Holocene. Nature, 384, Levis, S., G. B. Bonan, and C. Bonfils, 2004: Soil feedback drives the mid-holocene North African monsoon northward in fully coupled CCSM2 simulations with a dynamic vegetation model. Clim. Dyn., 23, doi: /s y L Heveder, B., F. Codron, and M. Ghil, 2015: Impact of anomalous northward ocean heat transport on global climate in a slab ocean setting. J. Climate, 28, Lindzen, R. S., and A. V. Hou, 1988: Hadley circulations for zonally averaged heating centered off the equator. J. Atmos. Sci., 45,
37 Lindzen, R. S. and S. Nigam (1987). On the role of sea surface temperature gradients in forcing low level winds and convergence in the tropics. J. Atmos. Sci., 44, Manabe, S., 1969: Climate and the ocean circulation: The atmospheric circulation and the hydrology of the earth s surface. Mon. Wea. Rev., 97, Maroon, E. A., D. M. W. Frierson, and D. S. Battisti, 2015: The Tropical Precipitation Response to 722 Andes Topography and Ocean Heat Fluxes in an Aquaplanet Model. J. Climate, 28, Marshall J., Donohoe A., Ferreira D., McGee D., 2013: The ocean s role in setting the mean position of the inter-tropical convergence zone. Clim. Dyn., doi: /s z Milly, P. C. D. and A. B. Shmakin, 2002: Global Modeling of Land Water and Energy Balances. Part I: The Land Dynamics (LaD) Model. J. Hydrometeor, 3, Moorthi, S. and M. J. Suarez, 1992: Relaxed Arakawa-Schubert. A Parameterization of Moist Convection for General Circulation Models.Mon. Wea. Rev., 120, Peixoto, J. P. and A. H. Oort, 1992: Physics of Climate. American Institute of Physics, 520pp Plumb, R., and A. Hou, 1992: The response of a zonally symmetric atmosphere to subtropical forcing: Threshold behavior. J. Atmos. Sci., 49, Privé, N. C., and R. A. Plumb, 2007: Monsoon dynamics with interactive forcing. Part I: Axisymmetric studies. J. Atmos. Sci., 64,
38 Privé, N. C., and R. A. Plumb, 2007b: Monsoon dynamics with interactive forcing, Part II: Impact of eddies and asymmetric geometries. J. Atmos. Sci.,64, Pu, B. and K. H. Cook, 2012: Role of the West African Westerly Jet in Sahel Rainfall Variation. J. Climate, 25, Ridley, H. E. and coauthors: Aerosol forcing of the position of the intertropical convergence zone since ad 1550, Nature Geoscience, 8, 3, Rodwell, M., and B. Hoskins, 1996: Monsoons and the dynamics of deserts. Quart. J. Roy. Meteor. Soc., 122, Rotstayn, L. D., and J. E. Penner, 2000: Precipitation changes in a GCM resulting from the indirect effects of anthropogenic aerosols. Geophys. Res. Lett., 27, Scheff, J., 2014: Understanding the responses of precipitation, evaporative demand, and terrestrial water availability to planetary temperature in climate models. PhD. Dissertation, Department of Atmospheric Sciences, University of Washington, 199pp, Seo, J., S. M. Kang, and D. M. W. Frierson, 2014: Sensitivity of intertropical convergence zone movement to the latitudinal position of thermal forcing. J. Climate, 27, , doi: /jcli-d Shi, X. and D. R. Durran, 2014: The Response of Orographic Precipitation over Idealized Mid- Latitude Mountains Due to Global Increases in CO2. J. Climate, 27,
39 Sud, Y. C., G. K. Walker, and K.-M. Lau, 1999: Mechanisms regulating sea-surface temperatures and deep convection in the tropics. Geophys. Res. Lett., 26, Taylor, K. E., M. Crucifix, P. Braconnot, C. D. Hewitt, C. Doutriaux, A. J. Broccoli, J. F. B. Mitchell, and M. J. Webb, 2007: Estimating Shortwave Radiative Forcing and Response in Climate Models. J. Climate, 20, Woelfle, M.D., C.S. Bretherton, and D.M.W. Frierson (2015): Time scales of response to antisymmetric surface fluxes in an aquaplanet GCM, Geophys. Res. Lett., 42, doi: /2015GL Xie, S.-P., 2005: The shape of continents, air-sea interaction, and the rising branch of the Hadley circulation. In The Hadley Circulation: Past, Present and Future, H. F. Diaz and R. S. Bradley (eds.), Kluwer Academic Publishers, Dordrecht, Yoshimori, M. and A. J. Broccoli, 2008: Equilibrium Response of an Atmosphere Mixed Layer Ocean Model to Different Radiative Forcing Agents: Global and Zonal Mean Response. J. Climate, 21, Yoshimori, M. and A. J. Broccoli, 2009: On the link between Hadley circulation changes and radiative feedback process. Geophys. Res. Lett., 36, L20703, doi: /2009gl Zhang, C., 1993: Large-Scale Variability of Atmospheric Deep Convection in Relation to Sea Surface Temperature in the Tropics. J. Climate, 6, Zhang, R., and T. L. Delworth, 2005: Simulated tropical response to a substantial weakening of the Atlantic thermohaline circulation. J. Climate, 18, , doi: /jcli
40 774 List of Tables 775 Table 1: Land model parameters used in GRaM and AM2.1 simulations List of Figures Figure 1: Zonal mean climatologies for the aquaplanet GRaM and AM2.1 simulations. Panel a shows the zonal mean precipitation and evaporation and panel b shows SST. The zonal-mean zonal wind (black contours) and overturning streamfunction (shading) are shown for both the GRaM (c) and AM2.1 (d) aquaplanet simulations, respectively. Wind contours are spaced every 5 m s -1 with the westerly wind in solid contours, easterly wind in dashed contours, and the zero wind as a thicker contour. Red (blue) streamfunction is clockwise (counterclockwise) Figure 2: Change in dark and light GRaM simulations from aquaplanet. Panels a and b show the change in precipitation (shading) and surface temperature (contours) from an aquaplanet in the dark and light simulations, respectively. Solid (dashed) contours indicate a positive (negative) surface temperature change; the first positive (negative) contour starts at 0.5K (-0.5K), with subsequent contours every 1K; the zero contour is omitted. Panel c shows the zonal mean change in precipitation (blue) and evaporation (orange) from adding a continent. Panel d shows the change in the mean meridional circulation component of moisture convergence due to changes in circulation (green) and due to changes in moisture (purple). The quantities for the dark (light) continent simulations are in the darker (lighter) shades of the colors. Panels e and f show the change in streamfunction (shading) and zonal wind (contours) for the dark and light continent simulations, respectively. Zonal wind is contoured every 39
41 m s -1 and the zero zonal wind contour is thickened, positive contours are solid, and negative contours are dashed Figure 3: Precipitation (shading), surface temperature (contours), and 10m wind (arrows) in dark and light GRaM (a,b) and AM2.1 (c,d) simulations Figure 4: NH minus SH plots for dark and light albedo rectangular continents in GRaM and AM2.1 simulations. The NH-SH surface temperature (a), NH-SH SST (b), and TOA net radiation (c) are shown for the GRaM (blue) and AM2.1 (red) continent simulations. In panels a-c, the darker (lighter) colors refer to the dark (light) albedo simulation. The values printed are the area-weighted average of the hemispheric difference (NH-SH) for the quantity in that panel; font colors correspond to the same colors as the line for each simulation. Panels d-f show different zonal portions of the NH-SH TOA net radiation for the AM2.1 simulations with different land albedos. The darker the shade of the red line, the darker the albedo of that simulation. Panel d shows the portion of the TOA radiation budget between longitude where the continent is located. Panel e (f) shows the portion of the budget to the west (east) of the continent from ( ). The lines in panels d-f are weighted such that directly taking the mean of the three lines for one simulation would yield the mean hemispheric 812 difference in TOA radiation. Note that area-weighted latitude is used here Figure 4: NH minus SH plots for dark and light albedo rectangular continents in GRaM and AM2.1 simulations. The NH-SH surface temperature (a), NH-SH SST (b), and TOA net radiation (c) are shown for the GRaM (blue) and AM2.1 (red) continent simulations. In panels a-c, the darker (lighter) colors refer 40
42 to the dark (light) albedo simulation. The values printed are the area-weighted average of the hemispheric difference (NH-SH) for the quantity in that panel; font colors correspond to the same colors as the line for each simulation. Panels d-f show different zonal portions of the NH-SH TOA net radiation for the AM2.1 simulations with different land albedos. The darker the shade of the red line, the darker the albedo of that simulation. Panel d shows the portion of the TOA radiation budget between longitude where the continent is located. Panel e (f) shows the portion of the budget to the west (east) of the continent from ( ). The lines in panels d-f are weighted such that directly taking the mean of the three lines for one simulation would yield the mean hemispheric 825 difference in TOA radiation. Note that area-weighted latitude is used here Figure 5: Change in moisture transport across the equator by the MMC ([v ][q ]) with height due to meridional wind changes in GRaM continent simulations compared to an aquaplanet simulation. The dark blue line is for the dark albedo simulation while light blue line is for the light albedo simulation Figure 6: NH-SH tropical precipitation and NH-SH radiative imbalance for GRaM and AM2.1 continent simulations (panel a). The NH-SH tropical precipitation difference is defined here as the difference of area-weighted mean precipitation from 0-90 N and 0-90 S. The NH-SH difference in TOA radiation is decomposed into LW clear sky radiation (panel b), SW clear sky radiation (panel c), LW cloudy sky radiation (panel d), and SW cloudy sky radiation (panel e). Blue squares are rectangular GRaM continent simulations, while red circles are rectangular AM2.1 continent simulations. The darker the color of the marker, the lower the land albedo is. The blue (red) star is the aquaplanet GRaM (AM2.1) simulation. TOA SW and LW are defined to be positive when they add energy to the planet. 41
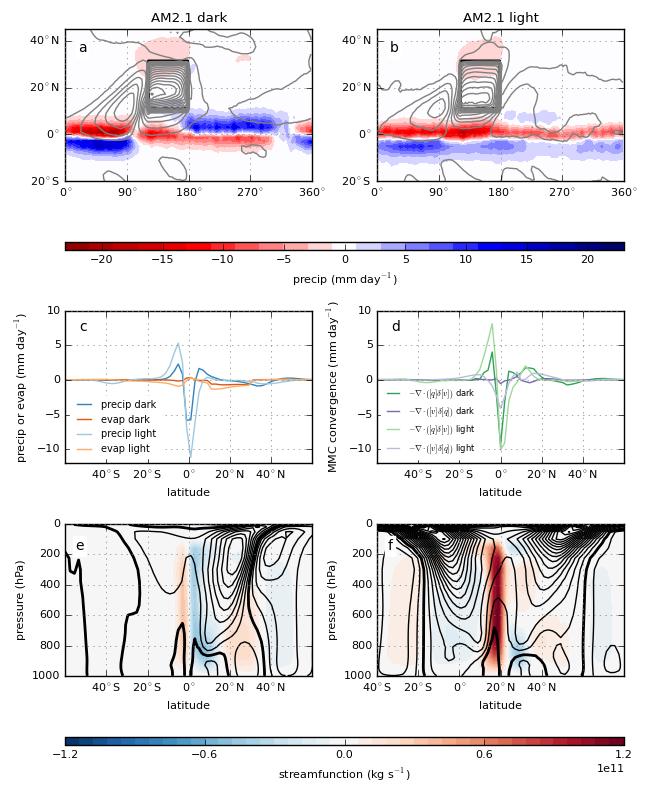
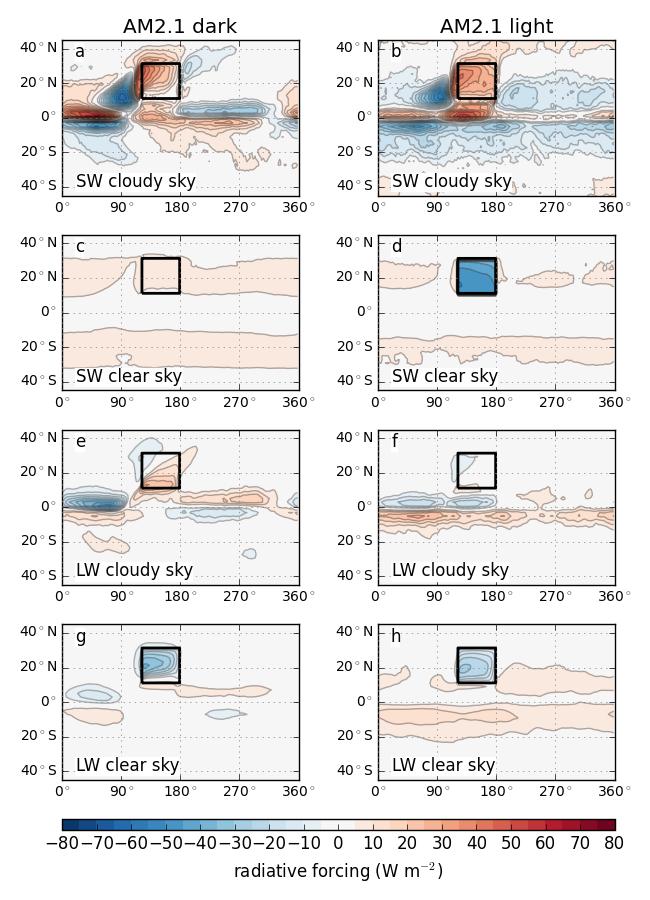
43 Figure 7: Changes in the annual mean AM2.1 dark and light continent simulations. Quantities displayed are the same as in Figure 2. Note the larger range of the y-axes in panels c and d as compared to Figure 2c&d Figure 8: Regional circulation changes in the dark AM2.1 simulation. Panel a shows the change in zonal mean meridional wind (contours) and omega (shading) for the region to the west of the continent ( ) from the aquaplanet AM2.1 simulation. Panels b and c show the same quantities for the continental region ( ) and the region to the east of the continent ( ). Wind is contoured every 1 m s -1 ; solid (dashed) contours indicate anomalous northward (southward) winds; the zero contour is omitted Figure 9: Changes in the hemispheric difference of zonal mean TOA radiation in dark (a) and light (b) albedo simulations compared to an aquaplanet AM2.1 simulation. NH-SH total TOA radiation (black), SW cloudy sky radiation (red), SW clear sky radiation (blue), LW cloudy sky radiation (green), and LW clear sky radiation (purple) are shown. TOA LW and SW are defined to be positive when they add energy to the planet Figure 10: Cloudy and clear sky decomposition of the TOA radiation budget for AM2.1 dark and light land albedo simulations. Panels a and b show the anomalous change in SW cloudy sky radiation from the aquaplanet simulation for the dark and light albedo continent, respectively. Panels c and d show the SW clear sky change, panels e and f show the LW cloudy sky change, and panels g and h show the LW clear sky change. Changes in radiation that heat the planet are defined as positive. 42
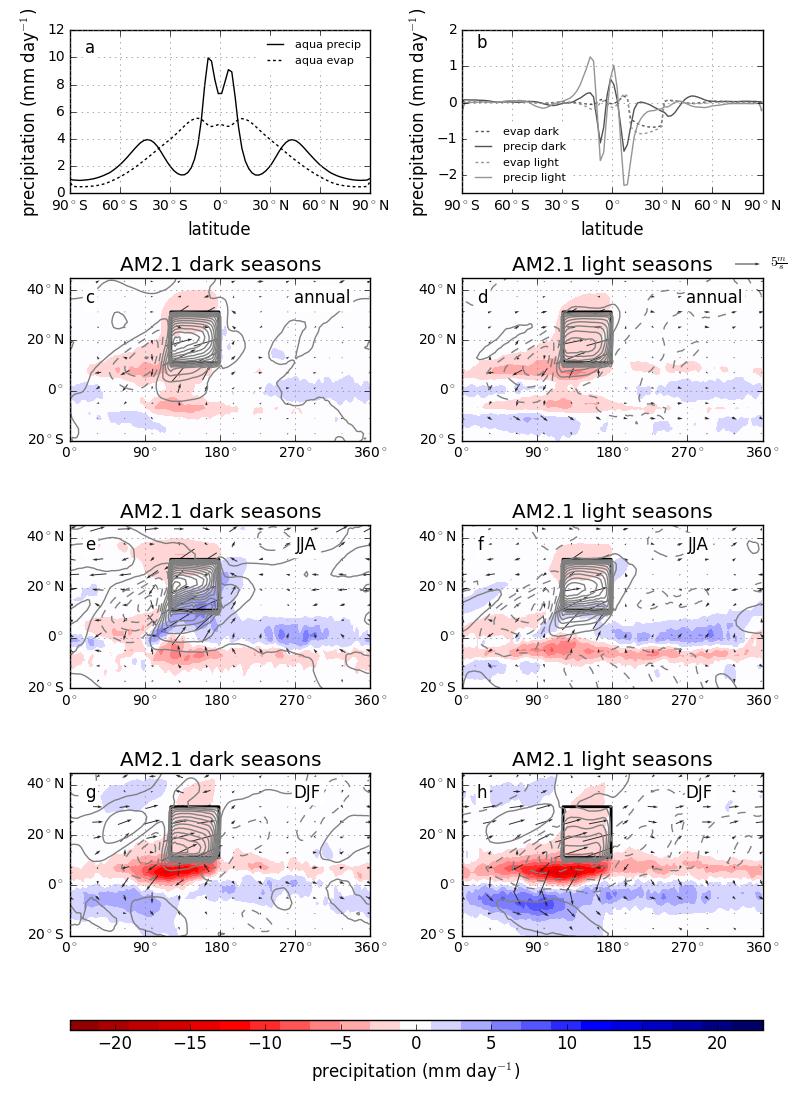
44 Figure 11: Precipitation, evaporation, surface temperature, and 10m wind changes in AM2.1 seasonal cycle simulations. Panel a shows the aquaplanet zonal mean precipitation (solid lines) and evaporation (dashed lines). The difference of the dark and light land albedo precipitation and evaporation from the aquaplanet are in panel b. Panels c and d show the difference in annual mean precipitation (shading), SST (contours), and 10m wind (arrows) of the dark and light albedo simulations from the aquaplanet simulation. Panels e and f show the same quantities for JJA precipitation, and panels g and h for DJF precipitation. Contouring intervals are the same as in Figure 2a and 7a Figure 12: The seasonal cycle of precipitation in an aquaplanet AM2.1 simulation (a) and the difference of dark (b) and light (c) land albedo simulations with a seasonal cycle from the aquaplanet Figure 13: Circulation in the AM2.1 aquaplanet simulation with seasonal cycle. Quantities and shading intervals are the same as in Figure Figure 14: Changes in streamfunction (shading) and zonal wind (contours) for dark (panel a) and light (panel b) continent simulations with a seasonal cycle as compared to the AM2.1 aquaplanet simulation with seasonal cycle. Panels a and b show annual mean differences for the dark and light albedo simulations, respectively. Panels c and d show the same quantities for JJA and panels e and f show DJF. Blue (red) shading denotes counterclockwise (clockwise) circulation. Wind is contoured every 1 m s -1, with positive contours solid, negative contours dashed, and the zero-contour thickened
45 Figure 15: Changes in the hemispheric difference of zonal mean TOA radiation in dark (a) and light (b) albedo simulations with seasons compared to an aquaplanet AM2.1 simulation with seasons. Colored lines refer to the same quantities as in Figure Figure 16: Cloudy and clear sky decomposition of the TOA radiation budget for AM2.1 dark and light land albedo simulations with a seasonal cycle. Quantities are the same as in Figure
46 887 Tables Parameter AM2.1 GRaM Soil bucket capacity 162 mm 208 mm Momentum roughness length 0.07 m 0.01 m Scalar roughness length m m Well-watered bulk stomatal resistance 17.4 s m s m -1 Soil heat capacity in upper layers 5.25 x 10 5 J K -1 m x 10 5 J K -1 m -3 Soil heat capacity in lower layers 2.1 x 10 6 J K -1 m x 10 5 J K -1 m -3 Soil thermal diffusivity 5.8 x 10⁻⁷ m 2 s m 2 s Table 1: Land model parameters used in GRaM and AM2.1 simulations

47 891 Figures Figure 1: Zonal mean climatologies for the aquaplanet GRaM and AM2.1 simulations. Panel a shows the zonal mean precipitation and evaporation and panel b shows SST. The zonal-mean zonal wind (black contours) and overturning streamfunction (shading) are shown for both the GRaM (c) and AM2.1 (d) aquaplanet simulations, respectively. Wind contours are spaced every 5 m s -1 with the westerly wind in solid contours, easterly wind in dashed contours, and the zero wind as a thicker contour. Red (blue) streamfunction is clockwise (counterclockwise)
48 Figure 2: Change in dark and light GRaM simulations from aquaplanet. Panels a and b show the change in precipitation (shading) and surface temperature (contours) from an aquaplanet in the dark and light 47
49 simulations, respectively. Solid (dashed) contours indicate a positive (negative) surface temperature change; the first positive (negative) contour starts at 0.5K (-0.5K), with subsequent contours every 1K; the zero contour is omitted. Panel c shows the zonal mean change in precipitation (blue) and evaporation (orange) from adding a continent. Panel d shows the change in the mean meridional circulation component of moisture convergence due to changes in circulation (green) and due to changes in moisture (purple). The quantities for the dark (light) continent simulations are in the darker (lighter) shades of the colors. Panels e and f show the change in streamfunction (shading) and zonal wind (contours) for the dark and light continent simulations, respectively. Zonal wind is contoured every 1 m s -1 and the zero zonal wind contour is thickened, positive contours are solid, and negative contours are dashed
 in dark and light GRaM (a,b) and AM2.1 (c,d) simulations.")
50 Figure 3: Precipitation (shading), surface temperature (contours), and 10m wind (arrows) in dark and light GRaM (a,b) and AM2.1 (c,d) simulations
51 Figure 4: NH minus SH plots for dark and light albedo rectangular continents in GRaM and AM2.1 simulations. The NH-SH surface temperature (a), NH-SH SST (b), and TOA net radiation (c) are shown for the GRaM (blue) and AM2.1 (red) continent simulations. In panels a-c, the darker (lighter) colors refer to the dark (light) albedo simulation. The values printed are the area-weighted average of the hemispheric difference (NH-SH) for the quantity in that panel; font colors correspond to the same colors as the line for each simulation. Panels d-f show different zonal portions of the NH-SH TOA net radiation for the AM2.1 simulations with different land albedos. The darker the shade of the red line, the darker the albedo of that simulation. Panel d shows the portion of the TOA radiation budget between longitude where the continent is located. Panel e (f) shows the portion of the budget to the west (east) of the continent from ( ). The lines in panels d-f are weighted such that directly taking the mean of the three lines for one simulation would yield the mean hemispheric 931 difference in TOA radiation. Note that area-weighted latitude is used here. 50
52 Figure 5: Change in moisture transport across the equator by the MMC ([v ][q ]) with height due to meridional wind changes in GRaM continent simulations compared to an aquaplanet simulation. The dark blue line is for the dark albedo simulation while light blue line is for the light albedo simulation. 51
53 Figure 6: NH-SH tropical precipitation and NH-SH radiative imbalance for GRaM and AM2.1 continent simulations (panel a). The NH-SH tropical precipitation difference is defined here as the difference of area-weighted mean precipitation from 0-90 N and 0-90 S. The NH-SH difference in TOA radiation is decomposed into LW clear sky radiation (panel b), SW clear sky radiation (panel c), LW cloudy sky radiation (panel d), and SW cloudy sky radiation (panel e). Blue squares are rectangular GRaM continent simulations, while red circles are rectangular AM2.1 continent simulations. The darker the color of the marker, the lower the land albedo is. The blue (red) star is the aquaplanet GRaM (AM2.1) simulation. TOA SW and LW are defined to be positive when they add energy to the planet
54 946 53
55 Figure 7: Changes in the annual mean AM2.1 dark and light continent simulations. Quantities displayed are the same as in Figure 2. Note the larger range of the y-axes in panels c and d as compared to Figure 2c&d
56 Figure 8: Regional circulation changes in the dark AM2.1 simulation. Panel a shows the change in zonal mean meridional wind (contours) and omega (shading) for the region to the west of the continent ( ) from the aquaplanet AM2.1 simulation. Panels b and c show the same quantities for the continental region ( ) and the region to the east of the continent ( ). Wind is contoured every 1 m s -1 ; solid (dashed) contours indicate anomalous northward (southward) winds; the zero contour is omitted. 55
57 Figure 9: Changes in the hemispheric difference of zonal mean TOA radiation in dark (a) and light (b) albedo simulations compared to an aquaplanet AM2.1 simulation. NH-SH total TOA radiation (black), SW cloudy sky radiation (red), SW clear sky radiation (blue), LW cloudy sky radiation (green), and LW clear sky radiation (purple) are shown. TOA LW and SW are defined to be positive when they add energy to the planet. 56
58 964 57
59 Figure 10: Cloudy and clear sky decomposition of the TOA radiation budget for AM2.1 dark and light land albedo simulations. Panels a and b show the anomalous change in SW cloudy sky radiation from the aquaplanet simulation for the dark and light albedo continent, respectively. Panels c and d show the SW clear sky change, panels e and f show the LW cloudy sky change, and panels g and h show the LW clear sky change. Changes in radiation that heat the planet are defined as positive. 58
60 970 59
61 Figure 11: Precipitation, evaporation, surface temperature, and 10m wind changes in AM2.1 seasonal cycle simulations. Panel a shows the aquaplanet zonal mean precipitation (solid lines) and evaporation (dashed lines). The difference of the dark and light land albedo precipitation and evaporation from the aquaplanet are in panel b. Panels c and d show the difference in annual mean precipitation (shading), SST (contours), and 10m wind (arrows) of the dark and light albedo simulations from the aquaplanet simulation. Panels e and f show the same quantities for JJA precipitation, and panels g and h for DJF precipitation. Contouring intervals are the same as in Figure 2a and 7a. 60
 and the difference of dark (b) and light (c) land albedo simulations with a seasonal cycle")
62 Figure 12: The seasonal cycle of precipitation in an aquaplanet AM2.1 simulation (a) and the difference of dark (b) and light (c) land albedo simulations with a seasonal cycle from the aquaplanet

63 Figure 13: Circulation in the AM2.1 aquaplanet simulation with seasonal cycle. Quantities and shading intervals are the same as in Figure

64 Figure 14: Changes in streamfunction (shading) and zonal wind (contours) for dark (panel a) and light (panel b) continent simulations with a seasonal cycle as compared to the AM2.1 aquaplanet simulation with seasonal cycle. Panels a and b show annual mean differences for the dark and light albedo simulations, respectively. Panels c and d show the same quantities for JJA and panels e and f show DJF. 63
65 Blue (red) shading denotes counterclockwise (clockwise) circulation. Wind is contoured every 1 m s -1, with positive contours solid, negative contours dashed, and the zero-contour thickened
66 Figure 15: Changes in the hemispheric difference of zonal mean TOA radiation in dark (a) and light (b) albedo simulations with seasons compared to an aquaplanet AM2.1 simulation with seasons. Colored lines refer to the same quantities as in Figure 9. 65
67 66
Why is the ITCZ in the Northern Hemisphere? Role of the AMOC
 Why is the ITCZ in the Northern Hemisphere? Role of the AMOC DARGAN M. W. FRIERSON UNIVERSITY OF WASHINGTON YEN-TING HWANG NATIONAL TAIWAN UNIVERSITY NEVEN FUČKAR CATALAN INSTITUTE OF CLIMATE SCIENCE (IC3)
Tropical Circulation Changes Across Forcing Agents. Timothy M. Merlis McGill University
 Tropical Circulation Changes Across Forcing Agents Timothy M. Merlis McGill University Conclusions We cannot straightforwardly apply the energetic ITCZ framework to monsoons. Conclusions We cannot straightforwardly
Lecture 14. Heat lows and the TCZ
 Lecture 14 Heat lows and the TCZ ITCZ/TCZ and heat lows While the ITCZ/TCZ is associated with a trough at low levels, it must be noted that a low pressure at the surface and cyclonic vorticity at 850 hpa
Changes of The Hadley Circulation Since 1950
 Changes of The Hadley Circulation Since 1950 Xiao-Wei Quan, Henry F. Diaz, Martin P. Hoerling (NOAA-CIRES CDC, 325 Broadway, Boulder, CO 80305) Abstract The Hadley circulation is changing in response to
SUPPLEMENTARY INFORMATION
 doi: 1.138/nature877 Background The main sis of this paper is that topography produces a strong South Asian summer monsoon primarily by insulating warm and moist air over India from cold and dry extratropics.
Effect of Orography on Land and Ocean Surface Temperature
 Present and Future of Modeling Global Environmental Change: Toward Integrated Modeling, Eds., T. Matsuno and H. Kida, pp. 427 431. by TERRAPUB, 2001. Effect of Orography on Land and Ocean Surface Temperature
McKnight's Physical Geography 11e
 Chapter 2 Lecture McKnight's Physical Geography 11e Lectures Chapter 5 Atmospheric Pressure and Wind Michael Commons Ohio Northern University Atmospheric Pressure and Wind The Nature of Atmospheric Pressure
Atmospheric & Ocean Circulation-
 Atmospheric & Ocean Circulation- Overview: Atmosphere & Climate Atmospheric layers Heating at different latitudes Atmospheric convection cells (Hadley, Ferrel, Polar) Coriolis Force Generation of winds
Lornshill Academy. Geography Department Higher Revision Physical Environments - Atmosphere
 Lornshill Academy Geography Department Higher Revision Physical Environments - Atmosphere Physical Environments Atmosphere Global heat budget The earth s energy comes from solar radiation, this incoming
The atmospheric circulation system
 The atmospheric circulation system Key questions Why does the air move? Are the movements of the winds random across the surface of the Earth, or do they follow regular patterns? What implications do these
ATMS 310 Tropical Dynamics
 ATMS 310 Tropical Dynamics Introduction Throughout the semester we have focused on mid-latitude dynamics. This is not to say that the dynamics of other parts of the world, such as the tropics, are any
Dynamical constraints on the ITCZ extent in planetary atmospheres
 1 Dynamical constraints on the ITCZ extent in planetary atmospheres 2 Sean Faulk 3 Earth, Planetary, and Space Sciences, UCLA, Los Angeles, California, USA 4 5 6 Jonathan Mitchell Earth, Planetary, and
Evaluation of ACME coupled simulation Jack Reeves Eyre, Michael Brunke, and Xubin Zeng (PI) University of Arizona 4/19/3017
 University of Arizona 4/19/3017") Evaluation of ACME coupled simulation Jack Reeves Eyre, Michael Brunke, and Xubin Zeng (PI) University of Arizona 4/19/3017 1. Introduction We look at surface variables in the tropical Pacific from a coupled
Evaluation of ACME coupled simulation Jack Reeves Eyre, Michael Brunke, and Xubin Zeng (PI) University of Arizona 4/19/3017 1. Introduction We look at surface variables in the tropical Pacific from a coupled
The Role of the Wind-Evaporation-Sea Surface Temperature (WES) Feedback in Tropical Climate Variability
 Feedback in Tropical Climate Variability") The Role of the Wind-Evaporation-Sea Surface Temperature (WES) Feedback in Tropical Climate Variability R. Saravanan Depart ment of At mospheric Sciences, Texas A&M University, College Station Collaborators:
The Role of the Wind-Evaporation-Sea Surface Temperature (WES) Feedback in Tropical Climate Variability R. Saravanan Depart ment of At mospheric Sciences, Texas A&M University, College Station Collaborators:
Winds and Ocean Circulations
 Winds and Ocean Circulations AT 351 Lab 5 February 20, 2008 Sea Surface Temperatures 1 Temperature Structure of the Ocean Ocean Currents 2 What causes ocean circulation? The direction of most ocean currents
Meteorology. Circle the letter that corresponds to the correct answer
 Chapter 7 Worksheet 2 Meteorology Name: Circle the letter that corresponds to the correct answer 1) Which of the following factors contributes to the general subsidence in the latitude zone 20 degrees
c p t T + c p v T + ω p s = Q c + S net + R net + SH, (1)
") The EASM, unlike other tropical monsoons, is characterized by mixed tropical and midlatitude influences with frontal systems and jet stream effects (Ding and Chan, 2005; Molnar et al., 2010). Previous
The EASM, unlike other tropical monsoons, is characterized by mixed tropical and midlatitude influences with frontal systems and jet stream effects (Ding and Chan, 2005; Molnar et al., 2010). Previous
Atmosphere Circulation
 Atmosphere Circulation Winds What Causes Winds? Difference in air pressure due to unequal heating of the atmosphere. Temperatures vary according to the amount of sun it gets. Uneven heating of the Earth
Wednesday, September 20, 2017 Reminders. Week 3 Review is now available on D2L (through Friday) Exam 1, Monday, September 25, Chapters 1-4
 Exam 1, Monday, September 25, Chapters 1-4") Wednesday, September 20, 2017 Reminders Week 3 Review is now available on D2L (through Friday) Exam 1, Monday, September 25, Chapters 1-4 PLEASE don t memorize equations, but know how to recognize them
Wednesday, September 20, 2017 Reminders Week 3 Review is now available on D2L (through Friday) Exam 1, Monday, September 25, Chapters 1-4 PLEASE don t memorize equations, but know how to recognize them
Atmospheric & Ocean Circulation- I
 Atmospheric & Ocean Circulation- I First: need to understand basic Earth s Energy Balance 1) Incoming radiation 2) Albedo (reflectivity) 3) Blackbody Radiation Atm/ Ocean movement ultimately derives from
ENSO Cycle: Recent Evolution, Current Status and Predictions. Update prepared by Climate Prediction Center / NCEP 8 March 2010
 ENSO Cycle: Recent Evolution, Current Status and Predictions Update prepared by Climate Prediction Center / NCEP 8 March 2010 Outline Overview Recent Evolution and Current Conditions Oceanic Niño Index
The Air-Sea Interaction. Masanori Konda Kyoto University
 2 The Air-Sea Interaction Masanori Konda Kyoto University 2.1 Feedback between Ocean and Atmosphere Heat and momentum exchange between the ocean and atmosphere Atmospheric circulation Condensation heat
Nevis Hulme Gairloch High School John Smith Invergordon Academy. Gairloch High School / Invergordon Academy
 Nevis Hulme Gairloch High School John Smith Invergordon Academy 1 Gairloch High School / Invergordon Academy ATMOSPHERIC CIRCULATION The Three Cell Model Global Winds The ITCZ The purpose of this presentation
Understanding El Nino-Monsoon teleconnections
 Understanding El Nino-Monsoon teleconnections Dr Neena Joseph Mani Earth & Climate Science INSA Anniversary General meeting, Session: Science in IISER Pune 27 th December 2017 Mean State of the equatorial
Lecture 13 El Niño/La Niña Ocean-Atmosphere Interaction. Idealized 3-Cell Model of Wind Patterns on a Rotating Earth. Previous Lecture!
 Lecture 13 El Niño/La Niña Ocean-Atmosphere Interaction Previous Lecture! Global Winds General Circulation of winds at the surface and aloft Polar Jet Stream Subtropical Jet Stream Monsoons 1 2 Radiation
Lecture 24. El Nino Southern Oscillation (ENSO) Part 1
 Part 1") Lecture 24 El Nino Southern Oscillation (ENSO) Part 1 The most dominant phenomenon in the interannual variation of the tropical oceanatmosphere system is the El Nino Southern Oscillation (ENSO) over the
Lecture 24 El Nino Southern Oscillation (ENSO) Part 1 The most dominant phenomenon in the interannual variation of the tropical oceanatmosphere system is the El Nino Southern Oscillation (ENSO) over the
Review for the second quarter. Mechanisms for cloud formation
 Review for the second quarter Mechanisms for cloud formation 1 Rising air expands and cools; Sinking air compresses and warms. (18) (24) Dry adiabatic lapse rate (10 o C/km): the rate of temperature decrease
The relationship between ITCZ location and cross. equatorial atmospheric heat transport; from the. seasonal cycle to the last glacial maximum
 Generated using version 3.1 of the official AMS L A TEX template 1 2 3 The relationship between ITCZ location and cross equatorial atmospheric heat transport; from the seasonal cycle to the last glacial
SIO20 - Midterm Examination 2 v1 Winter Section A. Circle the letter corresponding to the best answer. (1 point each)
") NAME: Section A. Circle the letter corresponding to the best answer. (1 point each) 1. Rainbows result from: a. refraction and reflection of sunlight by water droplets b. reflection of sunlight by oceans
NAME: Section A. Circle the letter corresponding to the best answer. (1 point each) 1. Rainbows result from: a. refraction and reflection of sunlight by water droplets b. reflection of sunlight by oceans
Global Winds AOSC 200 Tim Canty
 Global Winds AOSC 200 Tim Canty Class Web Site: http://www.atmos.umd.edu/~tcanty/aosc200 Topics for today: Global Wind Patterns Deserts Jet Stream Monsoons Ocean transport Ocean cycles Lecture 16 Oct 24
Meteorology I Pre test for the Second Examination
 Meteorology I Pre test for the Second Examination MULTIPLE CHOICE 1. A primary reason why land areas warm up more rapidly than water areas is that a) on land, all solar energy is absorbed in a shallow
RECTIFICATION OF THE MADDEN-JULIAN OSCILLATION INTO THE ENSO CYCLE
 RECTIFICATION OF THE MADDEN-JULIAN OSCILLATION INTO THE ENSO CYCLE By William S. Kessler and Richard Kleeman Journal of Climate Vol.13, 1999 SWAP, May 2009, Split, Croatia Maristella Berta What does give
TROPICAL METEOROLOGY. Intertropical Convergence Zone. Introduction. Mean Structure
 TROPICAL METEOROLOGY / Intertropical Convergence Zone 1 TROPICAL METEOROLOGY 0417-P0005 0417-P0010 Intertropical Convergence Zone D E Waliser, State University of New York, Stony Brook, NY, USA Copyright
Goal: Develop quantitative understanding of ENSO genesis, evolution, and impacts
 The Delayed Oscillator Zebiak and Cane (1987) Model Other Theories Theory of ENSO teleconnections Goal: Develop quantitative understanding of ENSO genesis, evolution, and impacts The delayed oscillator
Influence of high latitude ice cover on the marine Intertropical Convergence Zone
 Climate Dynamics (25) DOI 1.17/s382-5-4-5 John C. H. Chiang Æ Cecilia M. Bitz Influence of high latitude ice cover on the marine Intertropical Convergence Zone Received: 16 August 24 / Accepted: 1 May
9/25/2014. Scales of Atmospheric Motion. Scales of Atmospheric Motion. Chapter 7: Circulation of the Atmosphere
 Chapter 7: Circulation of the Atmosphere The Atmosphere: An Introduction to Meteorology, 12 th Lutgens Tarbuck Lectures by: Heather Gallacher, Cleveland State University Scales of Atmospheric Motion Small-
UTLS Asian monsoon anticyclone
 UTLS Asian monsoon anticyclone Dynamics and transport in the monsoon anticyclone Chemical variability linked to the monsoon Instability and eddy shedding; PV diagnostics Transport to stratosphere Eruption
Isaac Newton ( )
") Introduction to Climatology GEOGRAPHY 300 Isaac Newton (1642-1727) Tom Giambelluca University of Hawai i at Mānoa Atmospheric Pressure, Wind, and The General Circulation Philosophiæ Naturalis Principia
Introduction to Climatology GEOGRAPHY 300 Isaac Newton (1642-1727) Tom Giambelluca University of Hawai i at Mānoa Atmospheric Pressure, Wind, and The General Circulation Philosophiæ Naturalis Principia
ESCI 107 The Atmosphere Lesson 11 Global Circulation
 Reading: Meteorology Today, Chapter 10 THE GLOBAL CIRCULATION ESCI 107 The Atmosphere Lesson 11 Global Circulation Latitudinal heat imbalance The tropics receive more radiation than they emit. The polar
Applied Earth Science Climate Exam Practice Questions Page 1
 Name: 1. Which combination of climate factors generally results in the coldest temperatures? A) low elevation and low latitude B) low elevation and high latitude C) high elevation and low latitude D) high
Lecture 7. The Indian monsoon: is it a gigantic land-sea breeze?
 Lecture 7 The Indian monsoon: is it a gigantic land-sea breeze? In the next set of lectures I am going to discuss the different hypotheses put forth for the basic system responsible for the monsoon. I
Additive effect of two solar forcing mechanisms and influences on. tropical Pacific climate. National Center for Atmospheric Research
 Additive effect of two solar forcing mechanisms and influences on tropical Pacific climate Gerald A. Meehl Julie Arblaster, Fabrizio Sassi, Katja Matthes, and Harry van Loon National Center for Atmospheric
ENSO Cycle: Recent Evolution, Current Status and Predictions. Update prepared by Climate Prediction Center / NCEP 4 September 2012
 ENSO Cycle: Recent Evolution, Current Status and Predictions Update prepared by Climate Prediction Center / NCEP 4 September 2012 Outline Overview Recent Evolution and Current Conditions Oceanic Niño Index
Topic 4 Temperature, Atmospheric Circulation and Climate. Temperature Concepts and Measurement 10/2/2017. Thermometer and Instrument Shelter
 Topic 4 Temperature, Atmospheric Circulation and Climate Temperature Controls Global Temp. Patterns Atmospheric Circulation Primary High and Low Pressure Areas Global Circulation Model Local Winds Ocean
Atmospheric Waves James Cayer, Wesley Rondinelli, Kayla Schuster. Abstract
 Atmospheric Waves James Cayer, Wesley Rondinelli, Kayla Schuster Abstract It is important for meteorologists to have an understanding of the synoptic scale waves that propagate thorough the atmosphere
A Tropical Influence on Global Climate
 15 MAY 1997 SCHNEIDER ET AL. 1349 A Tropical Influence on Global Climate EDWIN K. SCHNEIDER Center for Ocean Land Atmosphere Studies, Calverton, Maryland RICHARD S. LINDZEN Massachusetts Institute of Technology,
5. El Niño Southern Oscillation
 5. El Niño Southern Oscillation Copyright 2006 Emily Shuckburgh, University of Cambridge. Not to be quoted or reproduced without permission. EFS 5/1 Ocean-Atmosphere Coupling Tropical atmosphere/ocean,
Chapter 6: Atmospheric Pressure, Wind, and Global Circulation
 Discovering Physical Geography Third Edition by Alan Arbogast Chapter 6: Atmospheric Pressure, Wind, and Global Circulation Factors That Influence Air Pressure Air Pressure is the measured weight of air
APPENDIX B NOAA DROUGHT ANALYSIS 29 OCTOBER 2007
 APPENDIX B NOAA DROUGHT ANALYSIS 29 OCTOBER 2007 ENSO Cycle: Recent Evolution, Current Status and Predictions Update prepared by Climate Prediction Center / NCEP October 29, 2007 Outline Overview Recent
Atmospheric Circulation
 Atmospheric Circulation Why do we say Earth's temperature is moderate? It may not look like it, but various processes work to moderate Earth's temperature across the latitudes. Atmospheric circulation
The General Circulation and El Niño. Dr. Christopher M. Godfrey University of North Carolina at Asheville
 The General Circulation and El Niño Dr. Christopher M. Godfrey University of North Carolina at Asheville Global Circulation Model Air flow broken up into 3 cells Easterlies in the tropics (trade winds)
Wind is caused by differences in air pressure created by changes in temperature and water vapor content.
 Topic 8: Weather Notes, Continued Workbook Chapter 8 Wind is caused by differences in air pressure created by changes in temperature and water vapor content. Wind blows from high pressure areas to low
An Evolution of the Asian Summer Monsoon Associated with Mountain Uplift Simulation with the MRI Atmosphere-Ocean Coupled GCM
 Journal of the Meteorological Society of Japan, Vol. 81, No. 5, pp. 909--933, 2003 909 An Evolution of the Asian Summer Monsoon Associated with Mountain Uplift Simulation with the MRI Atmosphere-Ocean
The cloud radiative effect on the atmospheric energy budget and global mean precipitation
 The cloud radiative effect on the atmospheric energy budget and global mean precipitation F. Hugo Lambert 1, Mark J. Webb, Masa Yoshimori 3 and Tokuta Yokohata 1. University of Exeter. Met Office 3. Hokkaido
Assessment Schedule 2016 Earth and Space Science: Demonstrate understanding of processes in the ocean system (91413)
") NCEA Level 3 Earth & Space Science (91413) 2016 page 1 of 6 Assessment Schedule 2016 Earth and Space Science: Demonstrate processes in the ocean system (91413) Evidence Statement Q Evidence with with Excellence
NCEA Level 3 Earth & Space Science (91413) 2016 page 1 of 6 Assessment Schedule 2016 Earth and Space Science: Demonstrate processes in the ocean system (91413) Evidence Statement Q Evidence with with Excellence
Dependence of tropical precipitation on changes in cross-equatorial atmosphere and ocean heat transport in global warming simulations.
 Dependence of tropical precipitation on changes in cross-equatorial atmosphere and ocean heat transport in global warming simulations Ashly Spevacek A thesis submitted in partial fulfillment of the requirements
(20 points) 1. ENSO is a coupled climate phenomenon in the tropical Pacific that has both regional and global impacts.
 1. ENSO is a coupled climate phenomenon in the tropical Pacific that has both regional and global impacts.") SIO 210 Problem Set 4 Answer key December 1, 2014 Due Dec. 12, 2014 (20 points) 1. ENSO is a coupled climate phenomenon in the tropical Pacific that has both regional and global impacts. (2 points) a)
SIO 210 Problem Set 4 Answer key December 1, 2014 Due Dec. 12, 2014 (20 points) 1. ENSO is a coupled climate phenomenon in the tropical Pacific that has both regional and global impacts. (2 points) a)
Chapter 10: Global Wind Systems
 Chapter 10: Global Wind Systems Three-cell model of atmospheric circulation Intertropical Convergence Zone (ITCZ) Typical surface wind patterns Upper-level pressure and winds Climatological sea-level pressure
3. Climatic Variability. El Niño and the Southern Oscillation Madden-Julian Oscillation Equatorial waves
 Georges (1998) 3. Climatic Variability El Niño and the Southern Oscillation Madden-Julian Oscillation Equatorial waves ENVIRONMENTAL CONDITIONS FOR TROPICAL CYCLONES TO FORM AND GROW Ocean surface waters
CHAPTER 6 Air-Sea Interaction
 CHAPTER 6 Air-Sea Interaction What causes Earth s seasons? Tilt (23.5 ) responsible for seasons 2011 Pearson Education, Inc. Distribution of Solar Energy Distribution of Solar Energy Atmosphere absorbs
A new mechanism of oceanatmosphere coupling in midlatitudes
 A new mechanism of oceanatmosphere coupling in midlatitudes Arnaud Czaja & Nicholas Blunt Imperial College, London Grantham Institute for Climate Change 1. Motivation Two key questions By which mechanism(s)
Climate & Earth System Science. Introduction to Meteorology & Climate. Chapter 07. Lecture 14. Global Scale Winds. Simple Introductory Examples:
 Climate & Earth System Science Introduction to Meteorology & Climate MAPH 10050 Peter Lynch Peter Lynch Meteorology & Climate Centre School of Mathematical Sciences University College Dublin Meteorology
Horizontal movement of air between cooler and warmer regions. - horizontal movement of air Convection over areas where is
 Winds and Water Chapter 9 continued... Uneven Heating The various materials of the earth absorb and emit energy at different rates Convection Heated air expands; density reduced; air rises Upward movement
ATMOSPHERIC CIRCULATION. WIND = The horizontal movement of air. Results from the differences in air pressure. Always moves from HIGH to LOW.
 ATMOSPHERIC CIRCULATION WIND = The horizontal movement of air. Results from the differences in air pressure. Always moves from HIGH to LOW. Pressure differences result from variations in temperature. AIR
Section 1. Global Wind Patterns and Weather. What Do You See? Think About It. Investigate. Learning Outcomes
 Chapter 5 Winds, Oceans, Weather, and Climate Section 1 Global Wind Patterns and Weather What Do You See? Learning Outcomes In this section, you will Determine the effects of Earth s rotation and the uneven
Department of Physics, University of Toronto. Thanks: James Anstey, Stephen Beagley, Erich Becker, Michaela Hegglin, Paul Kushner
 Stratospheric Residual Circulation and Tropopause Structure Thomas Birner Theodore G. Shepherd Department of Physics, University of Toronto Thanks: James Anstey, Stephen Beagley, Erich Becker, Michaela
- wet tropical climate
 (1 of 13) Further Reading: Chapter 10 of the text book Outline - wet tropical climate - coastal trade wind climate - wet-dry and monsoon climate - dry tropical climate (2 of 13) Introduction Previously,
Higher Atmosphere. Earth s Heat Budget. Global Insolation. Global Transfer Of Energy. Global Temperatures. Inter Tropical Convergence Zone
 Higher Atmosphere Earth s Heat Budget Global Insolation Global Transfer Of Energy Global Temperatures Inter Tropical Convergence Zone Climate Graph Earth s Heat Budget Task 1 Use the Power Point to help
Investigation of Common Mode of Variability in Boreal Summer Intraseasonal Oscillation and Tropospheric Biennial Oscillation
 Investigation of Common Mode of Variability in Boreal Summer Intraseasonal Oscillation and Tropospheric Biennial Oscillation 5. Introduction The Asian summer monsoon is one of the most vigorous and energetic
AT350 EXAM #2 November 18, 2003
 AT350 EXAM #2 November 18, 2003 Name and ID: Enter your name and student ID number on the answer sheet and on this exam. Record your answers to the 50 questions by using a No. 2 pencil to completely fill
Lecture 5: Climate Tapestry. Sea/Land Breeze. Thermal Energy to Kinetic Energy
 Lecture 5: Climate Tapestry JS JP Thermal Energy to Kinetic Energy Hadley Cell Ferrel Cell (driven by eddies) Pressure and Wind Global Wind Patterns Polar Cell L H L H Effect of Earth s Rotation On Winds
Biennial Oscillation of Tropical Ocean-Atmosphere System Associated with Indian Summer Monsoon
 Biennial Oscillation of Tropical Ocean-Atmosphere System Associated with Indian Summer Monsoon 2.1 Introduction The Indian summer monsoon displays substantial interannual variability, which can have profound
Structure and Mechanisms of the Southern Hemisphere Summertime Subtropical Anticyclones
 15 APRIL 2010 M I Y A S A K A A N D N A K A M U R A 2115 Structure and Mechanisms of the Southern Hemisphere Summertime Subtropical Anticyclones TAKAFUMI MIYASAKA AND HISASHI NAKAMURA* Department of Earth
Goal: Describe the principal features and characteristics of monsoons
 Overview and description of major tropical monsoons Monsoon clouds near Kolkata India Goal: Describe the principal features and characteristics of monsoons Published Online March 25, 2010 Science DOI:
Chapter 10. Thermohaline Circulation
 Chapter 10. Thermohaline Circulation Main References: Schloesser, F., R. Furue, J. P. McCreary, and A. Timmermann, 2012: Dynamics of the Atlantic meridional overturning circulation. Part 1: Buoyancy-forced
Development and Effects of the Northward-Displaced ITCZ
 Development and Effects of the Northward-Displaced ITCZ Shang-Ping Xie IPRC, University of Hawaii First satellite cloud climatology (January 1967-70) WES & low-cloud feedback Northward displaced ITCZ Consequences:
Super-parameterization of boundary layer roll vortices in tropical cyclone models
 DISTRIBUTION STATEMENT A. Approved for public release; distribution is unlimited. Super-parameterization of boundary layer roll vortices in tropical cyclone models PI Isaac Ginis Graduate School of Oceanography
The Asian monsoon anticyclone and water vapor transport
 The Asian monsoon anticyclone and water vapor transport Bill Randel Atmospheric Chemistry Division NCAR Thanks to: Mijeong Park, Louisa Emmons 1 What is the monsoon anticyclone, and why is it interesting?
The Mechanical Impact of the Tibetan Plateau on the Seasonal Evolution of the South Asian Monsoon
 2394 J O U R N A L O F C L I M A T E VOLUME 25 The Mechanical Impact of the Tibetan Plateau on the Seasonal Evolution of the South Asian Monsoon HYO-SEOK PARK California Institute of Technology, Pasadena,
Recent Atmospheric and Oceanic Circulation Changes Affecting Winter Weather in North America. Dr. Art Douglas Professor Emeritus Creighton University
 Recent Atmospheric and Oceanic Circulation Changes Affecting Winter Weather in North America Dr. Art Douglas Professor Emeritus Creighton University Outline 1. The 2018 El Nino: A Northern Hemisphere induced
The Influence of Indian Ocean Warming and Soil Moisture Change on the Asian Summer Monsoon
 SUST Journal of Science and Technology, Vol. 20, No. 6, 2012; P:89-98 The Influence of Indian Ocean Warming and Soil Moisture Change on the Asian Summer Monsoon (Submitted: July 18, 2012; Accepted for
Mechanical impact of the Tibetan Plateau on the seasonal evolution. of the South Asian monsoon
 Mechanical impact of the Tibetan Plateau on the seasonal evolution of the South Asian monsoon Hyo-Seok Park California Institute of Technology, Pasadena CA John C.H. Chiang Department of Geography and
Length of day for a full year. Ocean Gyres. Wet. Adiabatic. lapse rate, starts at. dewpoint Dry Adiabatic lapse rate
 Vernal Equinox March 20, 11:57 AM, CDT Sun will rise exactly in the east and set exactly in the west. All latitudes get 12 hours of day and 12 hours of dark. Length of day for a full year Wet Adiabatic
Chapter 7: Circulation And The Atmosphere
 Chapter 7: Circulation And The Atmosphere Highly integrated wind system Main Circulation Currents: series of deep rivers of air encircling the planet Various perturbations or vortices (hurricanes, tornados,
THE ATMOSPHERE. WEATHER and CLIMATE. The Atmosphere 10/12/2018 R E M I N D E R S. PART II: People and their. weather. climate?
 R E M I N D E R S Two required essays are due by Oct. 30, 2018. (A third may be used for extra credit in place of a Think Geographically essay.) ESSAY TOPICS (choose any two): Contributions of a noted
Interference of the Equatorial Waves on the 2017 Indian Monsoon Northward Progression
 https://www.bing.com/images/search?view=detailv2&ccid=4gaj08ec&id=15b827d717e11e 07790F5BCC0A4E13BBD103123C&thid=OIP.4gaj08EcIqXuIdGNdiwwUAEsDI&q=monsoon+pi ctures&simid=608027853209010910&selectedindex=119&mode=overlay&first=1
Mechanism of the Asymmetric Monsoon Transition as Simulated in an AGCM
 15 APRIL 2008 N O T E S A N D C O R R E S P O N D E N C E 1829 Mechanism of the Asymmetric Monsoon Transition as Simulated in an AGCM ZHUO WANG Department of Meteorology, Naval Postgraduate School, Monterey,
The Monsoon and Its Variability Prof. Sulochana Gadgil Centre for Atmospheric & Oceanic Sciences Indian Institute of Science Bangalore
 The Monsoon and Its Variability Prof. Sulochana Gadgil Centre for Atmospheric & Oceanic Sciences Indian Institute of Science Bangalore Lecture 07 The Indian Monsoon: is it a gigantic land-sea breeze? (Refer
Lecture 15 General Circulation of the Atmosphere and Ocean
 Lecture 15 General Circulation of the Atmosphere and Ocean Non-rotating model of atmospheric general circulation Hadley (1735) Cell is induced by uneven distribution of solar heating. Conceptual models
Abrupt seasonal variation of the ITCZ and the Hadley circulation
 GEOPHYSICAL RESEARCH LETTERS, VOL. 34, L18814, doi:10.1029/2007gl030950, 2007 Abrupt seasonal variation of the ITCZ and the Hadley circulation Yongyun Hu, 1 Dawei Li, 1 and Jiping Liu 2 Received 16 June
Glacial Cooling in the Tropics: Exploring the Roles of Tropospheric Water Vapor, Surface Wind Speed, and Boundary Layer Processes*
 2144 JOURNAL OF THE ATMOSPHERIC SCIENCES VOLUME 57 Glacial Cooling in the Tropics: Exploring the Roles of Tropospheric Water Vapor, Surface Wind Speed, and Boundary Layer Processes* RICHARD SEAGER, AMY
Wednesday, September 27, 2017 Test Monday, about half-way through grading. No D2L Assessment this week, watch for one next week
 Wednesday, September 27, 2017 Test Monday, about half-way through grading No D2L Assessment this week, watch for one next week Homework 3 Climate Variability (due Monday, October 9) Quick comment on Coriolis
ATMOSPHERIC CIRCULATION
 Name ATMOSPHERIC CIRCULATION (adapted from Dr. S. Postawko, U. of Ok.) INTRODUCTION Why does the wind blow? Why do weather systems in the mid-latitudes typically move from west to east? Now that we've
Agronomy 406 World Climates
 Agronomy 406 World Climates January 30, 2018 Monsoons. Ocean properties and circulation. Review for today: Online textbook: 1.3.1 (Sea water) Composition and properties. For Thursday: Rahmstorf, S.: The
Wind Driven Circulation Indian Ocean and Southern Ocean
 Wind Driven Circulation Indian Ocean and Southern Ocean Lecture 18 MAR 350 Spring 2017 Reading: Knauss Chapter 7 ECCO2 model animation ecco2_sst_flow (2).mp4 Mean surface height and currents DPO Fig. 11.1
= y y. In meteorological parlance, terms such as the above are known as
 Mesoscale Meteorology: The Planetary Boundary Layer 8 March 017 Introduction The planetary boundary layer, sometimes referred to as the atmospheric boundary layer, is a layer of finite depth over which
Summary of Lecture 10, 04 March 2008 Introduce the Hadley circulation and examine global weather patterns. Discuss jet stream dynamics jet streams
 Summary of Lecture 10, 04 March 2008 Introduce the Hadley circulation and examine global weather patterns. Discuss jet stream dynamics jet streams arise because the Coriolis force prevents Hadley-type
ATOMOSPERIC PRESSURE, WIND & CIRCULATION
 ATOMOSPERIC PRESSURE, WIND & CIRCULATION A. INTRODUCTION Important because: pressure patterns drive wind patterns which in turn drive oceanic circulation patterns o atmospheric & oceanic circulation: major
Introduction to Oceanography OCE 1001
 Introduction to Oceanography OCE 1001 Lecture Notes Chantale Bégin & Jessica Fry Version 2.1 10. Ocean Circulation (Trujillo, Chapter 7) Major ocean currents are stable and predictable; they have been
THE QUASI-BIENNIAL OSCILLATION S INFLUENCE ON LIGHTNING PRODUCTION AND DEEP CONVECTION IN THE TROPICS. A Thesis CELINA ANNE HERNANDEZ
 THE QUASI-BIENNIAL OSCILLATION S INFLUENCE ON LIGHTNING PRODUCTION AND DEEP CONVECTION IN THE TROPICS A Thesis by CELINA ANNE HERNANDEZ Submitted to the Office of Graduate Studies of Texas A&M University