Pedestrian Level Wind Study. Château Laurier Hotel Addition. Ottawa, Ontario
|
|
|
- Melvin Norris
- 5 years ago
- Views:
Transcription
1 Pedestrian Level Wind Study Château Laurier Hotel Addition Ottawa, Ontario REPORT: GWE PLW Prepared For: Larco Investments Ltd. c/o Dennis Jacobs, MCIP, RPP Momentum Planning & Communications 1165 Greenlawn Crescent Ottawa, Ontario K2C 1Z4 Canada Prepared By: Justin Ferraro, B.Eng., EIT, Technical Project Manager Steven Hall, M.A.Sc., EIT, CFD Specialist Vincent Ferraro, M.Eng., P.Eng., Managing Principal December 8, Walgreen Road, Ottawa, Ontario K0A 1L0 T (613)
2 EXECUTIVE SUMMARY This report describes a Pedestrian Level Wind (PLW) study for the proposed hotel addition serving the Château Laurier, which is located at 1 Rideau Street in Ottawa, Ontario. The study involves simulation of wind speeds for selected wind directions in a three dimensional (3D) computer model using the Computational Fluid Dynamics (CFD) technique, combined with meteorological data integration, to assess pedestrian comfort and safety within and surrounding the development site. The results and recommendations derived from these considerations are summarized in the subsequent report. A complete summary of the predicted wind conditions across the study site is presented in Section 5 of this report. Based on CFD test results, interpretation, experience with similar developments, all gradelevel areas within and surrounding the development site will be acceptable for the intended pedestrian uses on a seasonal and annual basis. More specifically, surrounding sidewalks and building access points will continue to experience acceptable wind conditions throughout the year. Of particular importance, although wind conditions along Mackenzie Avenue are moderately windy they remain acceptable for the intended uses of the area. Regarding the rooftop patio serving the planned 3 storey podium, we recommend incorporating a 2.4 m tall wind barrier along the north perimeter of the roof to ensure the terrace achieves conditions suitable for sitting specifically during the summer season when demand is anticipated to be high. Wind comfort predictions incorporating this mitigating feature achieve acceptable conditions for sitting during the summer and shoulder months during spring and autumn. Excluding anomalous localized storm events such as tornadoes and downbursts, no areas over the study site were found to be uncomfortable or unsafe. Château Laurier Hotel Addition, Ottawa: Pedestrian Level Wind Study i
3 TABLE OF CONTENTS 1. INTRODUCTION 1 2. TERMS OF REFERENCE 1 3. OBJECTIVES 2 4. METHODOLOGY Computer Based Context Modelling Wind Speed Measurements Meteorological Data Analysis Pedestrian Comfort Guidelines 6 5. RESULTS AND DISCUSSION 9 6. SUMMARY AND RECOMMENDATIONS 11 FIGURES APPENDICES Appendix A Simulation of the Natural Wind Appendix B Pedestrian Level Wind Measurement Methodology Château Laurier Hotel Addition, Ottawa: Pedestrian Level Wind Study ii
4 1. INTRODUCTION Gradient Wind Engineering Inc. (GWE) was retained by Larco Investments Ltd. to undertake a Pedestrian Level Wind (PLW) study for the Château Laurier Hotel Addition, which is located at 1 Rideau Street in Ottawa, Ontario. Our mandate in this study, as outlined in GWE proposal #16 100P, dated June 6, 2016, is to investigate pedestrian wind comfort and safety within and surrounding the development site. Our work is based on industry standard Computational Fluid Dynamic (CFD) simulations and data analysis procedures, architectural drawings provided by architectsalliance in September and November of 2016, surrounding street layouts and existing and approved future building massing information obtained from the City of Ottawa, as well as recent site imagery. 2. TERMS OF REFERENCE The focus of this PLW study is the proposed expansion of the Château Laurier, which is located at 1 Rideau Street in Ottawa, Ontario. The redevelopment will constitute substituting the existing parking garage to the north for a hotel addition. Surrounding the site are Major s Hill Park to the north, Mackenzie Avenue to the east, Rideau Street to the south, and the national historic Ottawa Locks / Rideau Canal to the west. The proposed development comprises the addition of two buildings connected by a 3 storey podium with a rooftop terrace, a central courtyard at grade situated between the addition and the existing hotel, and five levels of below grade parking including a dual loading bay with access from Mackenzie Avenue. The proposed buildings adjacent to the podium are identified as the West Wing and East Wing rising twelve (12) floors and eleven (11) floors respectively above grade. The upper floors of the West and East Wings are set back from their perimeters for compatibility with the existing roofscape silhouette characterizing the existing Château Laurier. Extensive green roof areas are also planned for the upper roof surfaces serving the West and East Wings. A green roof is also planned for the south most roof area serving the existing hotel, while a landscaped amenity area is planned for the north most roof area. Of particular importance for wind comfort, the ground floor plan includes a court plaza fronting onto Mackenzie Avenue, designated sitting areas serving the suites along the north side, as well as canal promenades and upper and lower terraces along the west side of the development. Wind exposures affecting the site include the open fetch of green space and the Ottawa River from west to north, and low density urban exposures for remaining wind directions. Figure 1 illustrates the study Château Laurier Hotel Addition, Ottawa: Pedestrian Level Wind Study 1
5 site and surrounding context, while Figures 2A and 2B illustrate the computational model used to conduct the study. It is noteworthy that in wind engineering wind direction refers to wind origin, so that a north wind blows from north to south. 3. OBJECTIVES The principal objectives of this study are to: (i) determine pedestrian level comfort and safety conditions within and surrounding the development site; (ii) identify areas where future wind conditions may interfere with the intended uses of outdoor spaces; and (iii) recommend suitable mitigation measures, where required. 4. METHODOLOGY The approach followed to quantify pedestrian wind conditions over the site is based on Computational Fluid Dynamics (CFD) simulations of wind speeds across the study site within a virtual environment, meteorological analysis of the Ottawa area wind climate, and synthesis of computational data with industry accepted guidelines 1. The following sections describe the analysis procedures, including a discussion of the pedestrian comfort guidelines. 4.1 Computer Based Context Modelling A computer based PLW study is performed to determine the influence of the wind environment on pedestrian comfort over the proposed development site. Pedestrian comfort predictions, based on the mechanical effects of wind, are determined by combining measured wind speed data from CFD simulations with statistical weather data obtained from Ottawa s Macdonald Cartier International Airport. The general concept and approach to CFD modelling is to represent building and topographic details in the immediate vicinity of the study site on the surrounding model, and to create suitable atmospheric wind profiles at the model boundary. The wind profiles are designed to have similar mean and turbulent wind properties consistent with actual site exposures. 1 City of Ottawa Terms of Reference: Wind Analysis Château Laurier Hotel Addition, Ottawa: Pedestrian Level Wind Study 2
6 An industry standard practice is to omit trees, vegetation, and other existing and planned landscape elements from the wind tunnel model due to the difficulty of providing accurate seasonal representation of vegetation. The omission of trees and other landscaping elements produces slightly more conservative wind speed values. 4.2 Wind Speed Measurements The PLW analysis was performed by simulating wind flows and gathering velocity data over a CFD model of the site for 16 wind directions. The CFD simulation model was centered on the study building, complete with surrounding massing within a diameter of approximately 400 metres (m). Mean and peak wind speed data obtained over the study site for each wind direction were interpolated to 36 wind directions at 10 intervals, representing the full compass azimuth. Measured wind speeds approximately 1.5 m above local grade, as well as 1.5 m above roof amenity areas, were referenced to the wind speed at gradient height to generate mean and peak velocity ratios, which were used to calculate full scale values. The gradient height represents the theoretical depth of the boundary layer of the Earth s atmosphere, above which the mean wind speed remains constant. Appendices A and B provide greater detail of the theory behind wind speed measurements. Château Laurier Hotel Addition, Ottawa: Pedestrian Level Wind Study 3
7 4.3 Meteorological Data Analysis A statistical model for winds in Ottawa was developed from approximately 40 years of hourly meteorological wind data recorded at Macdonald Cartier International Airport, and obtained from the local branch of Atmospheric Environment Services of Environment Canada. Wind speed and direction data were analyzed for each month of the year in order to determine the statistically prominent wind directions and corresponding speeds, and to characterize similarities between monthly weather patterns. Based on this portion of the analysis, the four seasons are represented by grouping data from consecutive months based on similarity of weather patterns, and not according to the traditional calendar method. The statistical model of the Ottawa area wind climate, which indicates the directional character of local winds on a seasonal basis, is illustrated on the following page. The plots illustrate seasonal distribution of measured wind speeds and directions in metres per second (m/s). Probabilities of occurrence of different wind speeds are represented as stacked polar bars in sixteen azimuth divisions. The radial direction represents the percentage of time for various wind speed ranges per wind direction during the measurement period. The preferred wind speeds and directions can be identified by the longer length of the bars. For Ottawa, the most common winds occur for westerly wind directions, followed by those from the east, while the most common wind speeds are below 10 m/s. The directional preference and relative magnitude of wind speed changes somewhat from season to season. By convention in microclimate studies, wind direction refers to the wind origin (e.g., a north wind blows from north to south). Château Laurier Hotel Addition, Ottawa: Pedestrian Level Wind Study 4
 measured at 10 m above the ground. 3. Apply a factor of 3.6 to convert m/s to km/h (e.g., 10 m/s is equivalent to 36 km/h).")
8 SEASONAL DISTRIBUTION OF WINDS FOR VARIOUS PROBABILITIES MACDONALD CARTIER INTERNATIONAL AIRPORT, OTTAWA, ONTARIO Notes: 1. Radial distances indicate percentage of time of wind events. 2. Mean hourly wind speeds in metres per second (m/s) measured at 10 m above the ground. 3. Apply a factor of 3.6 to convert m/s to km/h (e.g., 10 m/s is equivalent to 36 km/h). Château Laurier Hotel Addition, Ottawa: Pedestrian Level Wind Study 5
9 4.4 Pedestrian Comfort Guidelines Pedestrian comfort guidelines are based on mechanical wind effects without consideration of other meteorological conditions (i.e., temperature, relative humidity). The guidelines provide an assessment of comfort, assuming that pedestrians are appropriately dressed for a specified outdoor activity during any given season. Five pedestrian comfort classes and corresponding gust wind speed ranges are used to assess pedestrian comfort, which include: (i) Sitting; (ii) Standing; (iii) Strolling; (iv) Walking; (v) Uncomfortable; and (vi) Dangerous. More specifically, the comfort classes, associated wind speed ranges, and limiting guidelines are summarized as follows: (i) Sitting: Mean wind speeds less than or equal to 10 kilometres per hour (km/h), occurring at least 80% of the time. The gust equivalent mean wind speed is approximately 14 km/h. (ii) Standing: Mean wind speeds less than or equal to 14 km/h, occurring at least 80% of the time. The gust equivalent mean wind speed is approximately 20 km/h. (iii) Strolling: Mean wind speeds less than or equal to 17 km/h, occurring at least 80% of the time. The gust equivalent mean wind speed is approximately 25 km/h. (iv) Walking: Mean wind speeds less than or equal to 20 km/h, occurring at least 80% of the time. The gust equivalent mean wind speed is approximately 30 km/h. (v) Uncomfortable: Uncomfortable conditions are characterized by predicted values that fall below the 80% target for walking. Brisk walking and exercise, such as jogging, would be acceptable for moderate excesses of this guideline. (vi) Dangerous: Gust equivalent mean wind speeds greater than or equal to 90 km/h, occurring more often than 0.1% of the time, are classified as dangerous. From calculations of stability, it can be shown that gust wind speeds of 90 km/h would be the approximate threshold wind speed that would cause an average elderly person in good health to fall. Gust speeds are used in the guidelines because people tend to be more sensitive to wind gusts than to steady winds for lower wind speed ranges. For strong winds approaching dangerous levels, this effect is less important because the mean wind can also cause problems for pedestrians. The mean gust speed ranges are selected based on The Beaufort Scale, which describes the effect of forces produced by varying wind speeds on levels on objects. Château Laurier Hotel Addition, Ottawa: Pedestrian Level Wind Study 6
10 THE BEAUFORT SCALE Number Description Wind Speed (km/h) Description 2 Light Breeze 4 8 Wind felt on faces. 3 Gentle Breeze Moderate Breeze Leaves and small twigs in constant motion; Wind extends light flags. Wind raises dust and loose paper; Small branches are moved. 5 Fresh Breeze Small trees in leaf begin to sway. 6 Strong Breeze Moderate Gale Gale Large branches in motion; Whistling heard in electrical wires; Umbrellas used with difficulty. Whole trees in motion; Inconvenient walking against wind. Breaks twigs off trees; Generally impedes progress. Experience and research on people s perception of mechanical wind effects has shown that if the wind speed levels are exceeded for more than 20% of the time, the activity level would be judged to be uncomfortable by most people. For instance, if wind speeds of 14 km/h were exceeded for more than 20% of the time, most pedestrians would judge that location to be too windy for sitting or more sedentary activities. Similarly, if 30 km/h at a location were exceeded for more than 20% of the time, walking or less vigorous activities would be considered uncomfortable. As most of these guidelines are based on subjective reactions of a population to wind forces, their application is partly based on experience and judgment. Once the pedestrian wind speed predictions have been established across the study site, the assessment of pedestrian comfort involves determining the suitability of the predicted wind conditions for their associated spaces. This step involves comparing the predicted comfort class to the desired comfort class, which is dictated by the location type. An overview of common pedestrian location types and their desired comfort classes are summarized on the following page. Château Laurier Hotel Addition, Ottawa: Pedestrian Level Wind Study 7
11 DESIRED PEDESTRIAN COMFORT CLASSES FOR VARIOUS LOCATION TYPES Location Types Major Building Entrances Secondary Building Access Points Primary Public Sidewalks Secondary Public Sidewalks / Bicycle Paths Outdoor Amenity Spaces Cafés / Patios / Benches / Gardens Transit Shelters Public Parks / Plazas Garage / Service Entrances Parking Lots Vehicular Drop Off Zones Desired Comfort Classes Standing Strolling/Walking Strolling/Walking Walking Sitting Sitting Standing Sitting/Standing Walking Walking Strolling/Walking Château Laurier Hotel Addition, Ottawa: Pedestrian Level Wind Study 8
12 5. RESULTS AND DISCUSSION The foregoing discussion of predicted pedestrian wind conditions for the study site is accompanied by Figures 3A through 6B (following the main text), which illustrate the seasonal wind conditions at both grade and roof levels. The colour contours indicate predicted regions of the various comfort classes. Wind conditions comfortable for sitting are represented by the colour green, standing by yellow, strolling by orange, while conditions suitable for walking are represented by blue. The colour magenta indicates wind conditions considered uncomfortable for walking. Rideau Street Sidewalk + Existing Lobby Entrance (Tags A and B): The large majority of the sidewalk area along Rideau Street, adjacent to the south side of the building (Tag A), will be comfortable for standing, or better, throughout the year, while conditions to the immediate southwest of the hotel will be mostly suitable for strolling during the three colder seasons. The main lobby entrance (Tag B) will be comfortable for sitting throughout the year. The noted conditions are acceptable for the intended uses of the spaces. Mackenzie Avenue Sidewalk + Existing Secondary Entrances (Tags C and D): The sidewalk area along the east side of the building (Tag C) will be comfortable for strolling, or better, throughout the year, except during the winter and early spring seasons when this region will be comfortable for walking, or better. Conditions in close proximity to the two existing entrances fronting onto Mackenzie Avenue (Tag D), which are both equipped with vestibules, are predicted to be comfortable for strolling, or better, throughout the year. The noted conditions are acceptable for the intended uses of the spaces. Court Plaza (Tag E): The planned plaza will be suitable for sitting during the summer and autumn seasons, and mostly suitable for sitting during the remaining colder seasons. The noted wind conditions are acceptable for plazas. East Wing Lobby Entrance (Tag F): Wind conditions in the vicinity of the main entrance will be suitable for sitting during the summer and autumn seasons, becoming suitable for standing, or better, during the spring and winter seasons. The noted wind conditions are acceptable for entrances. Château Laurier Hotel Addition, Ottawa: Pedestrian Level Wind Study 9
13 North Side Sitting Areas (Tag G): The sitting areas serving the suites along the north side of the development and fronting onto Major s Hill Park will be suitable for sitting during the summer season, and mostly suitable for sitting during the autumn season with only small areas adjacent to the West Wing becoming suitable for standing. Conditions during the colder seasons of spring and winter will be largely suitable for standing. Since the typical use period is widely accepted as occurring from late spring through early autumn, the noted conditions are considered acceptable. West Side Canal Promenade/Lower Terrace (Tag H): The existing pedestrian area is predicted to be suitable for sitting during the summer season, becoming suitable for standing during the remaining three colder seasons. The planned hotel addition does not influence pedestrian wind comfort within this area which remains acceptable. West Side Canal Promenade/Upper Terrace (Tag I): The existing pedestrian area is predicted to be mostly suitable for standing throughout the year, becoming calmer and suitable for sitting closer to the building. Although conditions become windier at greater distances from the building, wind comfort remains suitable for strolling, or better, at all times during the year. Regarding the north end of the existing upper terrace, both the geometry and massing of the West Wing benefits pedestrian comfort in this area as it acts to reduce wind flow and therefore slightly improves wind comfort. Amenity Green Roof Area serving Existing Hotel (Tag J): The existing roof area is protected from the statistically prominent winds by the new massing. As such, wind comfort within the north end will be suitable for standing during the summer and autumn seasons, becoming mostly suitable for standing during the spring season. Wind comfort during the winter season is suitable for strolling over approximately half the area and standing over the remaining half. Courtyard (Tag K): The central courtyard at grade, which is situated between the new addition and the existing hotel, is predicted to be suitable for sitting during the summer season. Conditions during the spring season are largely suitable for sitting with a smaller central area suitable for standing. Wind conditions during the autumn and winter seasons are similar to those predicted to occur during the spring season but with smaller and larger areas suitable for standing, respectively. Château Laurier Hotel Addition, Ottawa: Pedestrian Level Wind Study 10
14 Rooftop Terrace atop 3 Storey Podium (Tag L): The north perimeter of the terrace includes a 2.4 m tall wind barrier, which protects the area from strong northwest winds. More specifically, conditions with the barrier are suitable for sitting during the summer season with only a small region closest to the south perimeter suitable for standing. Conditions during the remaining colder seasons become increasingly suitable for standing between the autumn, spring, and winter seasons. Additionally, strolling conditions are predicted to impact the south area of the terrace during the winter season. As a result, we recommend maintaining a 2.4 m tall wind barrier to ensure the terrace achieves the noted acceptable conditions. Influence of the Proposed Development on Existing Wind Conditions: The introduction of the proposed hotel addition is expected to moderately influence pedestrian wind comfort over neighbouring areas at grade. However, although moderate changes to wind speeds may occur beyond the study site upon introduction of the proposed development, nearby building entrances, sidewalks, and other pedestrian areas will continue to experience wind conditions similar to those that presently exist without the proposed building in place. Of particular importance and within the context of typical weather patterns, which exclude anomalous localized storm events such as tornadoes and downbursts, no areas over the study site were found to experience wind conditions that are considered unsafe. 6. SUMMARY AND RECOMMENDATIONS This document summarizes the results of a pedestrian level wind study undertaken to assess wind comfort and safety conditions for the proposed expansion of Château Laurier, which is located at 1 Rideau Street in Ottawa, Ontario. This work is based on industry standard CFD simulation and data analysis procedures, architectural drawings provided by architectsalliance in September and November of 2016, surrounding street layouts and existing and approved future building massing information obtained from the City of Ottawa, as well as recent site imagery. Based on CFD test results, interpretation, experience with similar developments, all grade level areas within and surrounding the development site will be acceptable for the intended pedestrian uses on a seasonal and annual basis. More specifically, surrounding sidewalks and building access points will continue to experience acceptable wind conditions throughout the year. Of particular importance, although wind conditions along Mackenzie Avenue are moderately windy they remain acceptable for the intended uses of the area. Château Laurier Hotel Addition, Ottawa: Pedestrian Level Wind Study 11
15 Regarding the rooftop patio serving the planned 3 storey podium, we recommend incorporating a 2.4 m tall wind barrier along the north perimeter of the roof to ensure the terrace achieves conditions suitable for sitting specifically during the summer season when demand is anticipated to be high. Wind comfort predictions incorporating this mitigating feature achieve acceptable conditions for sitting during the summer and shoulder months of spring and autumn. Excluding anomalous localized storm events such as tornadoes and downbursts, no areas over the study site were found to be uncomfortable or unsafe. This concludes our pedestrian level wind report. Please advise the undersigned of any questions or comments. Sincerely, Gradient Wind Engineering Inc. Justin Ferraro. B.Eng., EIT Technical Project Manager Vincent Ferraro, M.Eng., P.Eng. Managing Principal Steven Hall, M.A.Sc., EIT CFD Specialist GWE PLW Château Laurier Hotel Addition, Ottawa: Pedestrian Level Wind Study 12


16


17 FIGURE 2A: COMPUTATIONAL MODEL, NORTHEAST PERSPECTIVE FIGURE 2B: COMPUTATIONAL MODEL, NORTHWEST PERSPECTIVE Château Laurier Hotel Addition, Ottawa: Pedestrian Level Wind Study 14


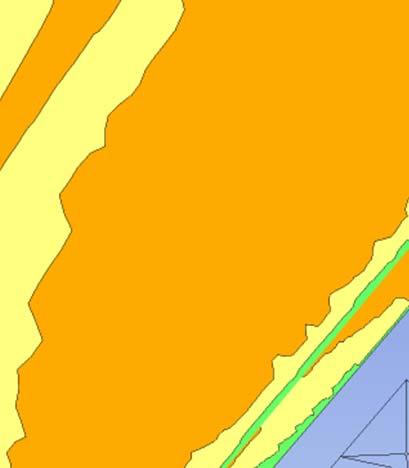
18 NORTH G H E F B C D A D GREEN SITTING YELLOW STANDING ORANGE STROLLING BLUE WALKING MAGENTA UNCOMFORTABLE RED DANGEROUS FIGURE 3A: SPRING GRADE LEVEL PEDESTRIAN WIND CONDITIONS NORTH I L K J GREEN SITTING YELLOW STANDING ORANGE STROLLING BLUE WALKING MAGENTA UNCOMFORTABLE RED DANGEROUS FIGURE 3B: SPRING ROOF LEVEL PEDESTRIAN WIND CONDITIONS Château Laurier Hotel Addition, Ottawa: Pedestrian Level Wind Study 15


19 NORTH G H E F B C D A D GREEN SITTING YELLOW STANDING ORANGE STROLLING BLUE WALKING MAGENTA UNCOMFORTABLE RED DANGEROUS FIGURE 4A: SUMMER GRADE LEVEL PEDESTRIAN WIND CONDITIONS NORTH I L K J GREEN SITTING YELLOW STANDING ORANGE STROLLING BLUE WALKING MAGENTA UNCOMFORTABLE RED DANGEROUS FIGURE 4B: SUMMER ROOF LEVEL PEDESTRIAN WIND CONDITIONS Château Laurier Hotel Addition, Ottawa: Pedestrian Level Wind Study 16


20 NORTH G H E F B C D A D GREEN SITTING YELLOW STANDING ORANGE STROLLING BLUE WALKING MAGENTA UNCOMFORTABLE RED DANGEROUS FIGURE 5A: AUTUMN GRADE LEVEL PEDESTRIAN WIND CONDITIONS NORTH I L K J GREEN SITTING YELLOW STANDING ORANGE STROLLING BLUE WALKING MAGENTA UNCOMFORTABLE RED DANGEROUS FIGURE 5B: AUTUMN ROOF LEVEL PEDESTRIAN WIND CONDITIONS Château Laurier Hotel Addition, Ottawa: Pedestrian Level Wind Study 17


21 NORTH G H E F B C D A D GREEN SITTING YELLOW STANDING ORANGE STROLLING BLUE WALKING MAGENTA UNCOMFORTABLE RED DANGEROUS FIGURE 6A: WINTER GRADE LEVEL PEDESTRIAN WIND CONDITIONS NORTH I L K J GREEN SITTING YELLOW STANDING ORANGE STROLLING BLUE WALKING MAGENTA UNCOMFORTABLE RED DANGEROUS FIGURE 6B: WINTER ROOF LEVEL PEDESTRIAN WIND CONDITIONS Château Laurier Hotel Addition, Ottawa: Pedestrian Level Wind Study 18
22 APPENDIX A SIMULATION OF THE NATURAL WIND The information contained within this appendix is offered to provide a greater understanding of the relationship between the physical wind tunnel testing method and virtual computer based simulations Château Laurier Hotel Addition, Ottawa: Pedestrian Level Wind Study A 1
23 WIND TUNNEL SIMULATION OF THE NATURAL WIND Wind flowing over the surface of the earth develops a boundary layer due to the drag produced by surface features such as vegetation and man made structures. Within this boundary layer, the mean wind speed varies from zero at the surface to the gradient wind speed at the top of the layer. The height of the top of the boundary layer is referred to as the gradient height, above which the velocity remains more or less constant for a given synoptic weather system. The mean wind speed is taken to be the average value over one hour. Superimposed on the mean wind speed are fluctuating (or turbulent) components in the longitudinal (i.e. along wind), vertical and lateral directions. Although turbulence varies according to the roughness of the surface, the turbulence level generally increases from nearly zero (smooth flow) at gradient height to maximum values near the ground. While for a calm ocean the maximum could be 20%, the maximum for a very rough surface such as the center of a city could be 100%, or equal to the local mean wind speed. The height of the boundary layer varies in time and over different terrain roughness within the range of 400 m to 600 m. Simulating real wind behaviour in a wind tunnel, or by computer models (CFD), requires simulating the variation of mean wind speed with height, simulating the turbulence intensity, and matching the typical length scales of turbulence. It is the ratio between wind tunnel turbulence length scales and turbulence scales in the atmosphere that determines the geometric scales that models can assume in a wind tunnel. Hence, when a 1:200 scale model is quoted, this implies that the turbulence scales in the wind tunnel and the atmosphere have the same ratios. Some flexibility in this requirement has been shown to produce reasonable wind tunnel predictions compared to full scale. In model scale the mean and turbulence characteristics of the wind are obtained with the use of spires at one end of the tunnel and roughness elements along the floor of the tunnel. The fan is located at the model end and wind is pulled over the spires, roughness elements and model. It has been found that, to a good approximation, the mean wind profile can be represented by a power law relation, shown below, giving height above ground versus wind speed. U U g Z Z g Where; U = mean wind speed, U g = gradient wind speed, Z = height above ground, Z g = depth of the boundary layer (gradient height) and is the power law exponent. Château Laurier Hotel Addition, Ottawa: Pedestrian Level Wind Study A 2
24 Figure A1 plots three such profiles for the open country, suburban and urban exposures. The exponent varies according to the type of terrain; = 0.14, 0.25 and 0.33 for open country, suburban and urban exposures respectively. Figure A2 illustrates the theoretical variation of turbulence in full scale and some wind tunnel measurement for comparison. The integral length scale of turbulence can be thought of as an average size of gust in the atmosphere. Although it varies with height and ground roughness, it has been found to generally be in the range of 100 m to 200 m in the upper half of the boundary layer. For a 1:300 scale, for example, the model value should be between 1/3 and 2/3 of a metre. Integral length scales are derived from power spectra, which describe the energy content of wind as a function of frequency. There are several ways of determining integral length scales of turbulence. One way is by comparison of a measured power spectrum in model scale to a non dimensional theoretical spectrum such as the Davenport spectrum of longitudinal turbulence. Using the Davenport spectrum, which agrees well with full scale spectra, one can estimate the integral scale by plotting the theoretical spectrum with varying L until it matches as closely as possible the measured spectrum: f U S( f ) 4 1 U 4 Lf Lf 2 10 Where, f is frequency, S(f) is the spectrum value at frequency f, U 10 is the wind speed 10 m above ground level, and L is the characteristic length of turbulence. Once the wind simulation is correct, the model, constructed to a suitable scale, is installed at the center of the working section of the wind tunnel. Different wind directions are represented by rotating the model to align with the wind tunnel center line axis. Château Laurier Hotel Addition, Ottawa: Pedestrian Level Wind Study A 3
25 REFERENCES 1. Teunissen, H.W., Characteristics Of The Mean Wind And Turbulence In The Planetary Boundary Layer, Institute For Aerospace Studies, University Of Toronto, UTIAS # 32, Oct Flay, R.G., Stevenson, D.C., Integral Length Scales In An Atmospheric Boundary Layer Near The Ground, 9 th Australian Fluid Mechanics Conference, Auckland, Dec ESDU, Characteristics of Atmospheric Turbulence Near the Ground, Bradley, E.F., Coppin, P.A., Katen, P.C., Turbulent Wind Structure Above Very Rugged Terrain, 9 th Australian Fluid Mechanics Conference, Auckland, Dec Château Laurier Hotel Addition, Ottawa: Pedestrian Level Wind Study A 4
26 1 0.8 A1) A) Normalized Wind Wind Speed Speed Profiles Profiles 0.6 suburban Z/Zg 0.4 urban 0.2 open U/Ug B) A2) Turbulence Intensity Profiles Profiles Z/Zg suburban urban open u'/u Figure A1 (Top): Mean Wind Speed Profiles Figure A2 (Bottom): Turbulence Intensity Profiles (u = fluctuation of mean velocity) Château Laurier Hotel Addition, Ottawa: Pedestrian Level Wind Study A 5
27 APPENDIX B PEDESTRIAN LEVEL WIND MEASUREMENT METHODOLOGY The information contained within this appendix is offered to provide a greater understanding of the relationship between the physical wind tunnel testing method and virtual computer based simulations Château Laurier Hotel Addition, Ottawa: Pedestrian Level Wind Study B 1
28 PEDESTRIAN LEVEL WIND MEASUREMENT METHODOLOGY Pedestrian level wind studies are performed in a wind tunnel on a physical model of the study buildings at a suitable scale. Instantaneous wind speed measurements are recorded at a model height corresponding to 1.5 m full scale using either a hot wire anemometer or a pressure based transducer. Measurements are performed at any number of locations on the model and usually for 36 wind directions. For each wind direction, the roughness of the upwind terrain is matched in the wind tunnel to generate the correct mean and turbulent wind profiles approaching the model. The hot wire anemometer is an instrument consisting of a thin metallic wire conducting an electric current. It is an omni directional device equally sensitive to wind approaching from any direction in the horizontal plane. By compensating for the cooling effect of wind flowing over the wire, the associated electronics produce an analog voltage signal that can be calibrated against velocity of the air stream. For all measurements, the wire is oriented vertically so as to be sensitive to wind approaching from all directions in a horizontal plane. The pressure sensor is a small cylindrical device that measures instantaneous pressure differences over a small area. The sensor is connected via tubing to a transducer that translates the pressure to a voltage signal that is recorded by computer. With appropriately designed tubing, the sensor is sensitive to a suitable range of fluctuating velocities. For a given wind direction and location on the model, a time history of the wind speed is recorded for a period of time equal to one hour in full scale. The analog signal produced by the hot wire or pressure sensor is digitized at a rate of 400 samples per second. A sample recording for several seconds is illustrated in Figure B. This data is analyzed to extract the mean, root mean square (rms) and the peak of the signal. The peak value, or gust wind speed, is formed by averaging a number of peaks obtained from sub intervals of the sampling period. The mean and gust speeds are then normalized by the wind tunnel gradient wind speed, which is the speed at the top of the model boundary layer, to obtain mean and gust ratios. At each location, the measurements are repeated for 36 wind directions to produce normalized polar plots, which will be provided upon request. In order to determine the duration of various wind speeds at full scale for a given measurement location the gust ratios are combined with a statistical (mathematical) model of the wind climate for the project site. This mathematical model is based on hourly wind data obtained from one or more meteorological Château Laurier Hotel Addition, Ottawa: Pedestrian Level Wind Study B 2
29 stations (usually airports) close to the project location. The probability model used to represent the data is the Weibull distribution expressed as: Where, P U g A exp U g K C P (> U g ) is the probability, fraction of time, that the gradient wind speed U g is exceeded; is the wind direction measured clockwise from true north, A, C, K are the Weibull coefficients, (Units: A dimensionless, C wind speed units [km/h] for instance, K dimensionless). A is the fraction of time wind blows from a 10 sector centered on. Analysis of the hourly wind data recorded for a length of time, on the order of 10 to 30 years, yields the A, C and K values. The probability of exceeding a chosen wind speed level, say 20 km/h, at sensor N is given by the following expression: P N P U N U g P N ( > 20 ) = P { > 20/(U N /Ug) } Where, U N /U g is the aforementioned normalized gust velocity ratios where the summation is taken over all 36 wind directions at 10 intervals. If there are significant seasonal variations in the weather data, as determined by inspection of the C and K values, then the analysis is performed separately for two or more times corresponding to the groupings of seasonal wind data. Wind speed levels of interest for predicting pedestrian comfort are based on the comfort guidelines chosen to represent various pedestrian activity levels as discussed in the main text. Château Laurier Hotel Addition, Ottawa: Pedestrian Level Wind Study B 3
30 FIGURE B: TIME VERSUS VELOCITY TRACE FOR A TYPICAL WIND SENSOR Pressure (Pascal) Time (milli-seconds) REFERENCES 1. Davenport, A.G., The Dependence of Wind Loading on Meteorological Parameters, Proc. of Int. Res. Seminar, Wind Effects On Buildings & Structures, NRC, Ottawa, 1967, University of Toronto Press. 2. Wu, S., Bose, N., An extended power law model for the calibration of hot wire/hot film constant temperature probes, Int. J. of Heat Mass Transfer, Vol.17, No.3, pp , Pergamon Press. Château Laurier Hotel Addition, Ottawa: Pedestrian Level Wind Study B 4
Pedestrian Level Wind Study Bank Street. Ottawa, Ontario
 Pedestrian Level Wind Study 890 900 Bank Street Ottawa, Ontario REPORT: GWE16 080 PLW Prepared For: Amica Mature Lifestyles & Canderel c/o Steven Cohen, Vice President Succession Development Corporation
Pedestrian Level Wind Study. 398, 402, 406 Roosevelt Avenue. Ottawa, Ontario
 Pedestrian Level Wind Study 398, 402, 406 Roosevelt Avenue Ottawa, Ontario REPORT: GWE17-179-CFDPLW Prepared For: David S. Renfroe Director of Business Development and Planning Domicile Developments Inc.
Pedestrian Level Wind Study. 383 Slater Street. Ottawa, Ontario
 Pedestrian Level Wind Study 383 Slater Street Ottawa, Ontario REPORT: GWE15-045-PLW Prepared For: James Beach, Development Manager Broccolini Construction 130 Slater Street Ottawa, Ontario K1P 6E2 Prepared
Pedestrian Level Wind Study. 979 Wellington Street West. Ottawa, Ontario
 Pedestrian Level Wind Study 979 Wellington Street West Ottawa, Ontario REPORT: GWE16-150-CFDPLW Prepared For: Charles Guilbault CDG Consulting 111 Albert Street #81062 Ottawa, ON K1P 1A5 Prepared By: Andrew
Pedestrian Level Wind Study. 383 Slater Street / 400 Albert Street. Ottawa, Ontario
 Pedestrian Level Wind Study 383 Slater Street / 400 Albert Street Ottawa, Ontario REPORT: GWE16-104-CFDPLW Prepared For: Anand Aggarwal 2507701 Ontario Inc. Manor Park Management 231 Brittany Drive, Suite
Pedestrian Level Wind Study. 83 East Street. Oakville, Ontario
 Pedestrian Level Wind Study 83 East Street Oakville, Ontario REPORT: GWE15-105-PLW Prepared For: Mr. Konstantine Simionopoulos Symel Group 23 Woodcliff Place Toronto, Ontario M3B 3A5 Prepared By: Andrew
Pedestrian Level Wind Study. 409 Brant Street. Burlington, Ontario
 Pedestrian Level Wind Study 409 Brant Street Burlington, Ontario REPORT: GWE17-195-CFDPLW Prepared For: Kelly Edwards Project Coordinator 110 Eglington Avenue East, Suite 500 Toronto, ON M4P 2Y1 Prepared
Pedestrian Level Wind Study. Greystone Village 10 Oblats Avenue. Ottawa, Ontario
 Pedestrian Level Wind Study Greystone Village 10 Oblats Avenue Ottawa, Ontario REPORT: GWE18-022-CFDPLW Prepared For: Erin O Connor Manager, Land Development 1737 Woodward Drive Ottawa, ON, K2C 0P9 Prepared
Pedestrian Level Wind Study. 350 Sparks Street. Ottawa, Ontario
 Pedestrian Level Wind Study 350 Sparks Street Ottawa, Ontario REPORT: GWE15-029-PLW Prepared For: Robert Sampson, OAA, MRAIC, Principal WZMH Architects 1500 95 St. Clair Ave. W. Toronto, Ontario M4V 1N6
Computer-Based Pedestrian Level Wind Study Scott Street. Ottawa, Ontario
 Computer-Based Pedestrian Level Wind Study 1960 Scott Street Ottawa, Ontario REPORT: GWE16-043-CFDPLW Prepared For: Kelly Rhodenizer Colonnade BridgePort 100 Argyle Avenue, Suite 100 Ottawa, Ontario K2P
Preliminary Pedestrian Level Wind Study. Elmvale Acres Shopping Centre Redevelopment. Ottawa, Ontario
 Preliminary Pedestrian Level Wind Study Elmvale Acres Shopping Centre Redevelopment Ottawa, Ontario REPORT: GWE15-067 CFD PLW Prepared For: Stuart Craig 2300 Yonge Street, Suite 500 Toronto, Ontario M4P
Pedestrian Level Wind Study. Westgate Shopping Centre Redevelopment, Phase 1. Ottawa, Ontario
 Pedestrian Level Wind Study Westgate Shopping Centre Redevelopment, Phase 1 Ottawa, Ontario REPORT: GWE15-067-CFDPLW-2018 Prepared For: Stuart Craig Catherine Truong 2300 Yonge Street, Suite 500 P.O Box
Dear Ms. Maw: Qualitative Pedestrian Level Wind Assessment St-Charles Market, 135 Barrette Street, Ottawa GWE File No.
 December 11, 2015 Jenna Maw LineBox Studio Inc. 126 York Street, Suite 502 Ottawa, Ontario K1N 5T2 Dear Ms. Maw: Re: Qualitative Pedestrian Level Wind Assessment St-Charles Market, 135 Barrette Street,
Preliminary Pedestrian Level Wind Study. Westgate Shopping Centre Redevelopment. Ottawa, Ontario
 Preliminary Pedestrian Level Wind Study Westgate Shopping Centre Redevelopment Ottawa, Ontario REPORT: GWE15-067 CFD PLW Prepared For: Stuart Craig 2300 Yonge Street, Suite 500 Toronto, Ontario M4P 1E4
Pedestrian Level Wind Study. 12 Stirling Avenue. Ottawa, Ontario
 Pedestrian Level Wind Study 12 Stirling Avenue Ottawa, Ontario REPORT: GWE13-009-CFPLW Prepared For: Ken Hoppner Morley Hoppner 1818 Bradley Side Road Carp, ON K0A 1L0 Prepared By: Andrew Sliasas, M.A.Sc.,
June 3, Mr. Steven Grandmont, Chief Operating Officer Richcraft Group of Companies 2280 St. Laurent Boulevard Ottawa, Ontario K1G 4K1
 June 3, 2013 Mr. Steven Grandmont, Chief Operating Officer Richcraft Group of Companies 2280 St. Laurent Boulevard Ottawa, Ontario K1G 4K1 Dear Mr. Grandmont: Re: Qualitative Pedestrian Wind Assessment
Dear Mr. Nicolini: Qualitative Pedestrian Level Wind Assessment Montreal Road, Ottawa GWE File No.: DTPLW
 August 17, 2015 Anthony Nicolini 2068358 Ontario Inc. (Darwin Group) 183 Michael Cowpland Drive Ottawa, Ontario K2M 0M3 Dear Mr. Nicolini: Re: Qualitative Pedestrian Level Wind Assessment 807-825 Montreal
March 25, Katherine Grechuta MCIP, RPP, LEED AP Planner FoTenn Planning & Urban Design 223 McLeod Street Ottawa, ON, K2P 0Z8. Dear Ms.
 March 25, 2013 Katherine Grechuta MCIP, RPP, LEED AP Planner FoTenn Planning & Urban Design 223 McLeod Street Ottawa, ON, K2P 0Z8 Dear Ms. Grechuta: Re: 845 Carling Avenue, Ottawa Qualitative Pedestrian
Brad Caco Group M8X 2X9. Mr. Caco: Gradient. for mitigation
 December 16, 2015 Brad Caco Trinity Development Group Sun Life Financial Center, East Tower 3250 Bloor Street West, Suite 1000 Toronto, Ontario M8X 2X9 Mr. Caco: Re: Qualitative Pedestrian Wind Assessment
31/10/17. October 31, HIP Developments Inc. 700 Rupert Street Waterloo, ON N2V 2B5
 University of Guelph Research Park 150 Research Lane, Suite 105 Guelph, ON, N1G 4T2 226.706.8080 www.novusenv.com 31/10/17 Date: To: HIP Developments Inc. 700 Rupert Street N2V 2B5 Re: Cambridge, Ontario
Pedestrian Wind Impact Study for Atlantic Yard Area & Redevelopment Project NEWMERICAL TECHNOLOGIES INTERNATIONAL.
 Pedestrian Wind Impact Study for Atlantic Yard Area & Redevelopment Project by NEWMERICAL TECHNOLOGIES INTERNATIONAL November 15, 2006 Atlantic Yards Report Preliminary Draft. 3-2006, November 2006, page
Wind Flow Validation Summary
 IBHS Research Center Validation of Wind Capabilities The Insurance Institute for Business & Home Safety (IBHS) Research Center full-scale test facility provides opportunities to simulate natural wind conditions
23/02/18. Pedestrian Wind Assessment Ladies Golf Club of Toronto Markham, Ontario Novus Project # February 23, 2018
 University of Guelph Research Park 150 Research Lane, Suite 105 Guelph, ON, N1G 4T2 226.706.8080 www.novusenv.com 23/02/18 Date: To: 2526574 Ontario Limited 4800 Dufferin Street Toronto, Ontario M3H 5S9
Urban Design Terms of Reference. Pedestrian. Wind Comfort and Safety Studies. June 2014
 Urban Design Terms of Reference Pedestrian June 2014 Wind Comfort and Safety Studies Table of contents 1 Introduction 1.1 Purpose 1.2 Who can conduct a wind study? 1.3 Consultation with Planning and Building
SITE AND BUILDING INFORMATION. March 28, 2018
 March 28, 2018 Mr. Carlos Ramirez Project Manager YORK Developments 303 Richmond St, Suite 201 London, ON N6B 2H8 carlos.ramirez@yorkdev.ca Re: Preliminary Pedestrian Wind Study 131 King Street - London,
Wind Tunnel Testing of Crossgrip Roof Walkway Matting
 School of Aerospace, Automotive & Design Engineering Consultancy Report No: 03/00015 Wind Tunnel Testing of Crossgrip Roof Walkway Matting Consultant: Dr. K.J. Hart June 2004 For: Plastic Extruders Ltd
Appendix 7. Wind and Comfort Impact Analysis
 Appendix 7 Wind and Comfort Impact Analysis Donald Ballanti Consulting Meteorologist 1424 Scott Street El Cerrito, CA 94530 (510) 234-6087 Abe Leider Rincon Consultants 449 15th Street, Suite 303 Oakland,
E. Agu, M. Kasperski Ruhr-University Bochum Department of Civil and Environmental Engineering Sciences
 EACWE 5 Florence, Italy 19 th 23 rd July 29 Flying Sphere image Museo Ideale L. Da Vinci Chasing gust fronts - wind measurements at the airport Munich, Germany E. Agu, M. Kasperski Ruhr-University Bochum
Wellington Street : Wind Impact Qualitative Assessment. To Whom It May Concern, RE: Proposed Wellington Street Wind Impact Qualitative Assessment
 March 19, 2018 Alex Halef, President, BANC Investments Ltd. Inverse Developments Ltd. BANC Group To Whom It May Concern, RE: Proposed Wellington Street Wind Impact Qualitative Assessment The proposed 8
1700 Webster Street Oakland, CA. Final Report. Pedestrian Wind Conditions Consultation Wind Tunnel Tests RWDI # July 16, 2015
 Tel: 519.823.1311 Fax: 519.823.1316 Rowan Williams Davies & Irwin Inc. 650 Woodlawn Road West Guelph, Ontario, Canada N1K 1B8 1700 Webster Street Oakland, CA Final Report Pedestrian Wind Conditions Consultation
School of Engineering & Technology University of Hertfordshire Hatfield, AL10 9AB. Wind Tunnel Testing of Crossgrip TPO Roof Walkway Matting
 School of Engineering & Technology University of Hertfordshire Hatfield, AL10 9AB Wind Tunnel ing of Crossgrip TPO Roof Walkway Matting Consultant: Dr. Ken Hart (k.j.hart@herts.ac.uk) Consultancy Report
Assembly Committee Document 7.5
 Assembly Committee Document 7.5 Proposed Section 21.07.130C., Tall Buildings, amending and replacing the Tall Buildings section content as it appeared in Assembly Document 7.4.A. May 6, 2010 C. Tall Buildings
Generation of an Annual Typical Daily Wind Speed for Heights Equal and Less than 10 meters for Urban Armidale NSW, Australia
 IOSR Journal of Engineering (IOSRJEN) ISSN (e): 2250-3021, ISSN (p): 2278-8719 Vol. 04, Issue 08 (August. 2014), VX PP 31-42 www.iosrjen.org Generation of an Annual Typical Daily Wind Speed for Heights
Effects of directionality on wind load and response predictions
 Effects of directionality on wind load and response predictions Seifu A. Bekele 1), John D. Holmes 2) 1) Global Wind Technology Services, 205B, 434 St Kilda Road, Melbourne, Victoria 3004, Australia, seifu@gwts.com.au
SITE AND BUILDING INFORMATION
 Page 1 Mr. Maneesh Poddar YORK Developments 303 Richmond St, Suite 201 London, ON N6B 2H8 Re: Preliminary Pedestrian Wind Assessment London, Ontario RWDI Reference Number: 1701848 Email: maneesh.poddar@yorkdev.ca
300 George Street, Brisbane Pedestrian Level Winds - Wind Tunnel Test
 Vipac Engineers & Scientists Ltd. Level 2, 146 Leichhardt Street, Spring Hill, QLD 4000 PO Box 436, Toowong, QLD 4066 t. +61 7 3377 0400 f. +61 7 3377 0499 e. brisbane@vipac.com.au w. www.vipac.com.au
AIRFLOW GENERATION IN A TUNNEL USING A SACCARDO VENTILATION SYSTEM AGAINST THE BUOYANCY EFFECT PRODUCED BY A FIRE
 - 247 - AIRFLOW GENERATION IN A TUNNEL USING A SACCARDO VENTILATION SYSTEM AGAINST THE BUOYANCY EFFECT PRODUCED BY A FIRE J D Castro a, C W Pope a and R D Matthews b a Mott MacDonald Ltd, St Anne House,
Wind Microclimate Assessment
 Australian Catholic University Pedestrian comfort at 115B Victoria Parade Pedestrian comfort at 115B Victoria Parade Quality Information Document 60519200 Client: Australian Catholic University ABN: 15050192660
FINAL REPORT. Wind Assessment for: NEW OFFICE BUILDING AT ESSENDON FIELDS Essendon, Victoria, Australia
 FINAL REPORT Wind Assessment for: NEW OFFICE BUILDING AT ESSENDON FIELDS Essendon, Victoria, Australia Prepared for: Essendon Fields Pty Ltd Essendon Fields House Level 2, 7 English Street Essendon Fields
Anemometry. Anemometry. Wind Conventions and Characteristics. Anemometry. Wind Variability. Anemometry. Function of an anemometer:
 Anemometry Anemometry Function of an anemometer: Measure some or all of the components of the wind vector In homogeneous terrain, vertical component is small express wind as -D horizontal vector For some
Critical Gust Pressures on Tall Building Frames-Review of Codal Provisions
 Dr. B.Dean Kumar Dept. of Civil Engineering JNTUH College of Engineering Hyderabad, INDIA bdeankumar@gmail.com Dr. B.L.P Swami Dept. of Civil Engineering Vasavi College of Engineering Hyderabad, INDIA
Wind Loading Code for Building Design in Thailand
 Wind Loading Code for Building Design in Thailand Virote Boonyapinyo a, Panitan Lukkunaprasit b Pennung Warnitchai c and Phoonsak Pheinsusom d a Associate Professor, Department of Civil Engineering, Thammasat
Techniques to achieve wind comfort & wind loads on buildings and appurtenances
 Vipac Engineers & Scientists Techniques to achieve wind comfort & wind loads on buildings and appurtenances including shades, verandahs, hoardings and walls. Mr Ian Jones, Managing Director Dr Seifu Bekele,
APPENDIX 11 WIND EFFECTS ASSESSMENT
 APPENDIX 11 WIND EFFECTS ASSESSMENT Summerset Villages (Lower Hutt) Ltd District Plan Change Request Prepared by Urban Perspectives Ltd 17 September 2014 341 49 342 Opus Research Report 14-529D84.00 Wind
Full scale measurements and simulations of the wind speed in the close proximity of the building skin
 Full scale measurements and simulations of the wind speed in the close proximity of the building skin Radoslav Ponechal 1,* and Peter Juras 1 1 University of Zilina, Faculty of Civil Engineering, Department
Wind Regimes 1. 1 Wind Regimes
 Wind Regimes 1 1 Wind Regimes The proper design of a wind turbine for a site requires an accurate characterization of the wind at the site where it will operate. This requires an understanding of the sources
RESILIENT INFRASTRUCTURE June 1 4, 2016
 RESILIENT INFRASTRUCTURE June 1 4, 2016 CASE STUDIES ON THE IMPACT OF SURROUNDING BUILDINGS ON WIND-INDUCED RESPONSE John Kilpatrick Rowan Williams Davies and Irwin, Guelph, Ontario, Canada ABSTRACT In
COMPARISONS OF COMPUTATIONAL FLUID DYNAMICS AND
 The Seventh Asia-Pacific Conference on Wind Engineering, November 8-12, 2009, Taipei, Taiwan COMPARISONS OF COMPUTATIONAL FLUID DYNAMICS AND WIND TUNNEL EXPERIMENTS FOR PEDESTRIAN WIND ENVIRONMENTS Chin-Hsien
Exploring Wind Energy
 2013-2014 Exploring Wind Energy Student Guide SECONDARY Introduction to Wind What is Wind? Wind is simply air in motion. It is produced by the uneven heating of the Earth s surface by energy from the sun.
Validation of Measurements from a ZephIR Lidar
 Validation of Measurements from a ZephIR Lidar Peter Argyle, Simon Watson CREST, Loughborough University, Loughborough, United Kingdom p.argyle@lboro.ac.uk INTRODUCTION Wind farm construction projects
INTERACTION BETWEEN WIND-DRIVEN AND BUOYANCY-DRIVEN NATURAL VENTILATION Bo Wang, Foster and Partners, London, UK
 INTERACTION BETWEEN WIND-DRIVEN AND BUOYANCY-DRIVEN NATURAL VENTILATION Bo Wang, Foster and Partners, London, UK ABSTRACT Ventilation stacks are becoming increasingly common in the design of naturally
Technical Brief - Wave Uprush Analysis Island Harbour Club, Gananoque, Ontario
 Technical Brief - Wave Uprush Analysis RIGGS ENGINEERING LTD. 1240 Commissioners Road West Suite 205 London, Ontario N6K 1C7 October 31, 2014 Table of Contents Section Page Table of Contents... i List
Measurement and simulation of the flow field around a triangular lattice meteorological mast
 Measurement and simulation of the flow field around a triangular lattice meteorological mast Matthew Stickland 1, Thomas Scanlon 1, Sylvie Fabre 1, Andrew Oldroyd 2 and Detlef Kindler 3 1. Department of
DOWNBURST CHARACTERISTICS
 The extratropical cyclones are low pressure systems, with diameters of around 1000km, which in the Southern Hemisphere rotate in the clockwise direction. When one of these systems intensifies during its
Atqasuk Wind Resource Report
 Atqasuk Wind Resource Report Report by: Douglas Vaught, P.E., V3 Energy LLC, Eagle River, Alaska Date of Report: August 26, 2010 Atqasuk met tower; D. Vaught photo Contents Summary... 2 Test Site Location...
Opus Research Report D Wind Tunnel Study of the Proposed Site 10 Development, Wellington
 Opus Research Report 14-529D91.00 Wind Tunnel Study of the Proposed Site 10 Development, Wellington Opus Research Report 14-529D91.00 Wind Tunnel Study of the Proposed Site 10 Development, Wellington Prepared
An Overview of Wind Engineering Where Climate Meets Design
 An Overview of Wind Engineering Where Climate Meets Design Presented by Derek Kelly, M.Eng., P.Eng. Principal/Project Manager www.rwdi.com RWDI Leadership & Consulting Expertise RWDI Consulting Engineers
Donald Ballanti, Certified Consulting Meteorologist, Wind Impact Evaluation for the Menlo Park Facebook Campus Project, August 26, 2011.
 3.4 WIND Introduction This section describes wind conditions in the Project area and at the Project site. This section provides a general discussion of the relationship between building design and wind
Wind tunnel acoustic testing of wind generated noise on building facade elements
 See discussions, stats, and author profiles for this publication at: https://www.researchgate.net/publication/307638896 Wind tunnel acoustic testing of wind generated noise on building facade elements
Fig$1.!Wind!Rose!Shearwater! ! August 7th, 2015
 August 7th, 2015 HRM Planning & Development Eastern Region, Alderney Gate 40 Alderney Drive, 2 nd Floor Dartmouth, NS To Whom It May Concern, RE: Proposed 6030 Pepperell Road Wind Impact Qualitative Assessment
NUMERICAL INVESTIGATION OF THE FLOW BEHAVIOUR IN A MODERN TRAFFIC TUNNEL IN CASE OF FIRE INCIDENT
 - 277 - NUMERICAL INVESTIGATION OF THE FLOW BEHAVIOUR IN A MODERN TRAFFIC TUNNEL IN CASE OF FIRE INCIDENT Iseler J., Heiser W. EAS GmbH, Karlsruhe, Germany ABSTRACT A numerical study of the flow behaviour
Available online at ScienceDirect. Procedia Engineering 161 (2016 )
") Available online at www.sciencedirect.com ScienceDirect Procedia Engineering 161 (216 ) 1845 1851 World Multidisciplinary Civil Engineering-Architecture-Urban Planning Symposium 216, WMCAUS 216 Experimental
Available online at www.sciencedirect.com ScienceDirect Procedia Engineering 161 (216 ) 1845 1851 World Multidisciplinary Civil Engineering-Architecture-Urban Planning Symposium 216, WMCAUS 216 Experimental
MEASUREMENTS ON THE SURFACE WIND PRESSURE CHARACTERISTICS OF TWO SQUARE BUILDINGS UNDER DIFFERENT WIND ATTACK ANGLES AND BUILDING GAPS
 BBAA VI International Colloquium on: Bluff Bodies Aerodynamics & Applications Milano, Italy, July, 2-24 28 MEASUREMENTS ON THE SURFACE WIND PRESSURE CHARACTERISTICS OF TWO SQUARE BUILDINGS UNDER DIFFERENT
PROPAGATION OF LONG-PERIOD WAVES INTO AN ESTUARY THROUGH A NARROW INLET
 PROPAGATION OF LONG-PERIOD WAVES INTO AN ESTUARY THROUGH A NARROW INLET Takumi Okabe, Shin-ichi Aoki and Shigeru Kato Department of Civil Engineering Toyohashi University of Technology Toyohashi, Aichi,
Turbulence and How to Avoid It
 Turbulence and How to Avoid It Lesson Overview Wind turbines work best when they are exposed to consistent winds moving with constant speed and direction. Turbulence ( swirling winds ) causes problems.
External Pressure Coefficients on Saw-tooth and Mono-sloped Roofs
 External Pressure Coefficients on Saw-tooth and Mono-sloped Roofs Authors: Bo Cui, Ph.D. Candidate, Clemson University, 109 Lowry Hall, Clemson, SC 9634-0911, boc@clemson.edu David O. Prevatt, Assistant
The Corporation of the City of Sarnia. School Crossing Guard Warrant Policy
 The Corporation of the City of Sarnia School Crossing Guard Warrant Policy Table of Contents Overview And Description... 2 Role of the School Crossing Guard... 2 Definition of a Designated School Crossing...
Meteorology 2/6/2017. Wind, and its Interaction with Particle Plumes. Variation of wind speed with elevation. Variation of wind speed during the day
 Meteorology The effect of wind, weather, and temperature conditions on the behavior of particle plumes Wind, and its Interaction with Particle Plumes Variation of wind speed with elevation Variation of
EFFECTS OF SIDEWALL OPENINGS ON THE WIND LOADS ON PIPE-FRAMED GREENHOUSES
 The Seventh Asia-Pacific Conference on Wind Engineering, November 8-12, 29, Taipei, Taiwan EFFECTS OF SIDEWALL OPENINGS ON THE WIND LOADS ON PIPE-FRAMED GREENHOUSES Yasushi Uematsu 1, Koichi Nakahara 2,
Quantification of the Effects of Turbulence in Wind on the Flutter Stability of Suspension Bridges
 Quantification of the Effects of Turbulence in Wind on the Flutter Stability of Suspension Bridges T. Abbas 1 and G. Morgenthal 2 1 PhD candidate, Graduate College 1462, Department of Civil Engineering,
EXPERIMENTAL STUDY OF WIND PRESSURES ON IRREGULAR- PLAN SHAPE BUILDINGS
 BBAA VI International Colloquium on: Bluff Bodies Aerodynamics & Applications Milano, Italy, July, 2-24 8 EXPERIMENTAL STUDY OF WIND PRESSURES ON IRREGULAR- PLAN SHAPE BUILDINGS J. A. Amin and A. K. Ahuja
Subject: Wind Impact Evaluation for the Facebook Campus Project, Menlo Park
 Donald Ballanti Certified Consulting Meteorologist 1424 Scott Street El Cerrito, CA 94530 (510) 234-6087 Fax: (510) 234-6087 Justin Murphy, AICP Community Development Department City of Menlo Park 701
Application of Simulation Technology to Mitsubishi Air Lubrication System
 50 Application of Simulation Technology to Mitsubishi Air Lubrication System CHIHARU KAWAKITA *1 SHINSUKE SATO *2 TAKAHIRO OKIMOTO *2 For the development and design of the Mitsubishi Air Lubrication System
Buckland Wind Resource Report
 Buckland Wind Resource Report By: Douglas Vaught, P.E., V3 Energy LLC, Eagle River, Alaska Date: September 17, 2010 Buckland met tower; D. Vaught photo Contents Summary... 2 Test Site Location... 2 Photographs...
Wind Resource Assessment for FALSE PASS, ALASKA Site # 2399 Date last modified: 7/20/2005 Prepared by: Mia Devine
 813 W. Northern Lights Blvd. Anchorage, AK 99503 Phone: 907-269-3000 Fax: 907-269-3044 www.aidea.org/wind.htm Wind Resource Assessment for FALSE PASS, ALASKA Site # 2399 Date last modified: 7/20/2005 Prepared
Site Summary. Wind Resource Summary. Wind Resource Assessment For King Cove Date Last Modified: 8/6/2013 By: Rich Stromberg & Holly Ganser
 Site Summary Wind Resource Assessment For King Cove Date Last Modified: 8/6/2013 By: Rich Stromberg & Holly Ganser Station ID: 2857 Latitude: 55 7 45.8 N Longitude: 162 16 10.6 W Tower Type: 30 m NRG Tall
Wind Resource Assessment for NOME (ANVIL MOUNTAIN), ALASKA Date last modified: 5/22/06 Compiled by: Cliff Dolchok
, ALASKA Date last modified: 5/22/06 Compiled by: Cliff Dolchok") 813 W. Northern Lights Blvd. Anchorage, AK 99503 Phone: 907-269-3000 Fax: 907-269-3044 www.akenergyauthority.org SITE SUMMARY Wind Resource Assessment for NOME (ANVIL MOUNTAIN), ALASKA Date last modified:
813 W. Northern Lights Blvd. Anchorage, AK 99503 Phone: 907-269-3000 Fax: 907-269-3044 www.akenergyauthority.org SITE SUMMARY Wind Resource Assessment for NOME (ANVIL MOUNTAIN), ALASKA Date last modified:
PRESSURE DISTRIBUTION OF SMALL WIND TURBINE BLADE WITH WINGLETS ON ROTATING CONDITION USING WIND TUNNEL
 International Journal of Mechanical and Production Engineering Research and Development (IJMPERD ) ISSN 2249-6890 Vol.2, Issue 2 June 2012 1-10 TJPRC Pvt. Ltd., PRESSURE DISTRIBUTION OF SMALL WIND TURBINE
Currents measurements in the coast of Montevideo, Uruguay
 Currents measurements in the coast of Montevideo, Uruguay M. Fossati, D. Bellón, E. Lorenzo & I. Piedra-Cueva Fluid Mechanics and Environmental Engineering Institute (IMFIA), School of Engineering, Research
APPENDIX G WEATHER DATA SELECTED EXTRACTS FROM ENVIRONMENTAL DATA FOR BCFS VESSEL REPLACEMENT PROGRAM DRAFT REPORT
 APPENDIX G WEATHER DATA SELECTED EXTRACTS FROM ENVIRONMENTAL DATA FOR BCFS VESSEL REPLACEMENT PROGRAM DRAFT REPORT Prepared for: B.C. Ferries Services Inc. Prepared by: George Roddan, P.Eng. Roddan Engineering
Remote sensing standards: their current status and significance for offshore projects
 Remote sensing standards: their current status and significance for offshore projects Peter J M Clive Technical Development Consultant SgurrEnergy Ltd 225 Bath Street Glasgow G2 4GZ E: peter.clive@sgurrenergy.com
Wind tunnel tests of a non-typical stadium roof
 Wind tunnel tests of a non-typical stadium roof G. Bosak 1, A. Flaga 1, R. Kłaput 1 and Ł. Flaga 1 1 Wind Engineering Laboratory, Cracow University of Technology, 31-864 Cracow, Poland. liwpk@windlab.pl
Wind effects on tall building frames-influence of dynamic parameters
 Indian Journal of Science and Technology Vol. 3 No. 5 (May 21) ISSN: 974-6846 583 Wind effects on tall building frames-influence of dynamic parameters B. Dean Kumar 1 and B.L.P. Swami 2 1 Department of
2 Bowen Crescent Residential Development, Melbourne
 WUZHONG INTERNATIONAL 2 Bowen Crescent Residential Development, Melbourne Desktop Pedestrian Level Wind Report Document No. GWTS-DPR-1024-2015-2 Bowen Crescent Residential Development, Melbourne PREPARED
Determination of the wind pressure distribution on the facade of the triangularly shaped high-rise building structure
 Determination of the wind pressure distribution on the facade of the triangularly shaped high-rise building structure Norbert Jendzelovsky 1,*, Roland Antal 1 and Lenka Konecna 1 1 STU in Bratislava, Faculty
Pedestrian Level Wind Study. 159 Parkdale Avenue. Ottawa, Ontario
 Pedestrian Level ind tudy 159 Parkdale Avenue Ottawa, Ontario RPORT: Gm 12-86-PL Prepared For: Phil Castro, MCIP, RPP Planning and Land Development 228 t. Laurent Boulevard Ottawa, Ontario K1G 4K1 Prepared
Pressure distribution of rotating small wind turbine blades with winglet using wind tunnel
 Journal of Scientific SARAVANAN & Industrial et al: Research PRESSURE DISTRIBUTION OF SMALL WIND TURBINE BLADES WITH WINGLET Vol. 71, June 01, pp. 45-49 45 Pressure distribution of rotating small wind
Investigation on Atmospheric Boundary Layers: Field Monitoring and Wind Tunnel Simulation
 Investigation on Atmospheric Boundary Layers: Field Monitoring and Wind Tunnel Simulation Chii-Ming Cheng 1, 2, Ming-Shu Tsai 2, Yuan-Lung Lo 1, 2, Chun-Han Wang 2 1 Department of Civil Engineering, Tamkang
Aspects of Using CFD for Wind Comfort Modeling Around Tall Buildings
 8 th International Congress on Advances in Civil Engineering, 15-17 September 2008 Eastern Mediterranean University, Famagusta, North Cyprus Aspects of Using CFD for Wind Comfort Modeling Around Tall Buildings
Evaluation of the Wisconsin DOT Walking Profiler
 Final Report Evaluation of the Wisconsin DOT Walking Profiler March 2007 U.S. Department of Transportation Federal Highway Administration Notice This document is disseminated under the sponsorship of the
Pressure coefficient on flat roofs of rectangular buildings
 Pressure coefficient on flat roofs of rectangular buildings T. Lipecki 1 1 Faculty of Civil Engineering and Architecture, Lublin University of Technology, Poland. t.lipecki@pollub.pl Abstract The paper
Draft Kivalina Wind Resource Report
 Draft Kivalina Wind Resource Report Kivalina aerial photo by Doug Vaught, July 2011 May 31, 2012 Douglas Vaught, P.E. dvaught@v3energy.com V3 Energy, LLC Eagle River, Alaska Draft Kivalina Wind Resource
Wave Generation. Chapter Wave Generation
 Chapter 5 Wave Generation 5.1 Wave Generation When a gentle breeze blows over water, the turbulent eddies in the wind field will periodically touch down on the water, causing local disturbances of the
COMPUTATIONAL FLOW MODEL OF WESTFALL'S LEADING TAB FLOW CONDITIONER AGM-09-R-08 Rev. B. By Kimbal A. Hall, PE
 COMPUTATIONAL FLOW MODEL OF WESTFALL'S LEADING TAB FLOW CONDITIONER AGM-09-R-08 Rev. B By Kimbal A. Hall, PE Submitted to: WESTFALL MANUFACTURING COMPANY September 2009 ALDEN RESEARCH LABORATORY, INC.
Surrounding buildings and wind pressure distribution on a high rise building
 Surrounding buildings and wind pressure distribution on a high rise building Conference or Workshop Item Accepted Version Luo, Z. (2008) Surrounding buildings and wind pressure distribution on a high rise
Basis of Structural Design
 Basis of Structural Design Course 10 Actions on structures: Wind loads Other loads Course notes are available for download at http://www.ct.upt.ro/users/aurelstratan/ Wind loading: normative references
Wind shear and its effect on wind turbine noise assessment Report by David McLaughlin MIOA, of SgurrEnergy
 Wind shear and its effect on wind turbine noise assessment Report by David McLaughlin MIOA, of SgurrEnergy Motivation Wind shear is widely misunderstood in the context of noise assessments. Bowdler et
Effect of airflow direction on human perception of draught
 Effect of airflow direction on human perception of draught J. Toftum, G. Zhou, A. Melikov Laboratory of Indoor Environment and Energy Department of Energy Engineering Technical University of Denmark Abstract
Scales of Atmospheric Motion Scale Length Scale (m) Time Scale (sec) Systems/Importance Molecular (neglected)
 Time Scale (sec) Systems/Importance Molecular (neglected)") Supplement Wind, Fetch and Waves Scales of Atmospheric Motion Scale Length Scale (m) Time Scale (sec) Systems/Importance Molecular 10-7 - 10-2 10-1 (neglected) Coriolis not important Turbulent 10-2 10
Supplement Wind, Fetch and Waves Scales of Atmospheric Motion Scale Length Scale (m) Time Scale (sec) Systems/Importance Molecular 10-7 - 10-2 10-1 (neglected) Coriolis not important Turbulent 10-2 10
Effects of seam and surface texture on tennis balls aerodynamics
 Available online at www.sciencedirect.com Procedia Engineering 34 (2012 ) 140 145 9 th Conference of the International Sports Engineering Association (ISEA) Effects of seam and surface texture on tennis