Figure 1 GE image of the Costa Sur & EcoEléctrica power plants, located inside Guayanilla and Tallaboa bay.
|
|
|
- Regina Allen
- 5 years ago
- Views:
Transcription
 resolution Ponce DEM prepared by NGDC/NOAA.")
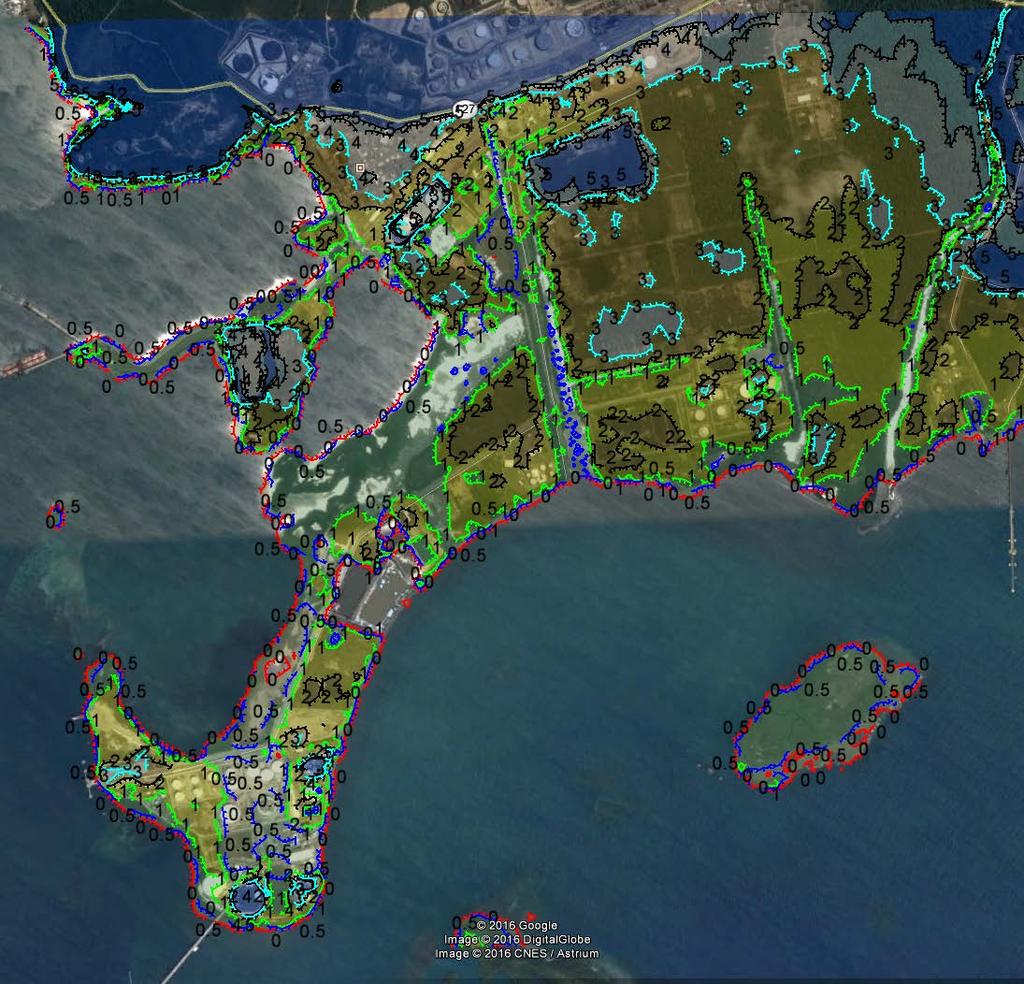
1 1 7 - STORM SURGES IN PUERTO RICO_Power Plants-Costa Sur & EcoElectrica Costa Sur & EcoEléctrica Figure 1 shows a GE image of the Costa Sur (Guayanilla) and EcoElectrica site. Figure 2 shows the topographic map for the site, using the 1/3 arc-seconds (10 M) resolution Ponce DEM prepared by NGDC/NOAA. In Figure 2 we note the following: Figure 1 GE image of the Costa Sur & EcoEléctrica power plants, located inside Guayanilla and Tallaboa bay. All areas seaward of the blue contour would be flooded by a sea level rise (SLR) of +0.5 m, while areas seaward of the green contour would be flooded by a SLR of +1.0 m. Note that the Costa Sur turbines lie below an elevation equal to, or smaller, than 3 m. The EcoEléctrica property seems to lie not higher than 2 m above MSL (green contour). Many large tanks lie below +2 m relative to MSL. Figure 3 shows the FEMA map for the area. We can see that: A large part of Punta Gotay (the peninsula sticking out, where EcoEléctrica is located) appears as Other Flood Areas, especially where the large tanks are. From the FEMA map it looks as if the seaward end of Punta Gotay could become isolated from the mainland during a hurricane event.
2 There is a small coastal strip in front of the Costa Sur turbines that gets flooded by the 100-year event. Almost all of the area east of the Punta Gotay peninsula seems to be floodable either by the 100-year storm surge or the Rio Tallaboa. 2
3 3
, blue (0.5 m), green (1.0 m), and cyan (3.0 m). The rest of the contours are black.")
4 4 Figure 2 Costa Sur & EcoEléctrica site with elevation contours superimposed. Data source is the 1/3 arc-seconds (10 m resolution) Ponce DEM prepared by NGDC/NOAA for tsunami flood mapping. Colored contours are as follows: red (z=0 m), blue (0.5 m), green (1.0 m), and cyan (3.0 m). The rest of the contours are black. All contour lines have hachures (rayados) pointing towards lower elevation. All areas seaward of the blue contour (towards which the hachures point) would be flooded by a sea level rise (SLR) of +0.5 m. All seaward of the green contour (towards which the hachures point) would be flooded by a SLR of +1.0 m. Figure 4 shows the transect locations used to run the WHAFIS/RUNUP models in order to determine the inland extent of the VE zone. Only two of them fall in the power plant complex, #179 and 180. I may be wrong, but it is my understanding that in-between transects an interpolation of the wave heights is used based on the two nearest transects. That could be understandable in open coastlines, which are very homogeneous laterally. But how FEMA consultants could come out with VE zone, and BFE estimates in

5 5 Figure 3 FEMA map (tiles 1620, 1640, 1985, and 2005) for the Costa Sur/EcoEléctrica complex. such a complex environment, based on just two transects, without running a two-dimensional wave model, is beyond my comprehension. Below we will see the distribution of significant wave height, Hs, values based on the SWAN model for comparison purposes. Figure 5 shows the location of the computational nodes inside Guayanilla and Tallaboa bays. The node spacing near the power plants varies between 70 and 80 meters. We will next start to show the flood maps for the different hurricane categories and under three sea level rise scenarios. For each case we will first show (almost) the whole bay, followed by zooms into Costa Sur and EcoEléctrica. Figures 6 to 20 show the flood maps for category 1 to 5 hurricanes. Recall the discussion for the Aguirre power plant about the displacement noticed between the GE shoreline and the DEM shoreline. As Figure 7 shows, here it is about 35 meters, so that the painted area (flooding) seen in the figure should
6 6 Figure 4 Transect locations for WHAFIS/RUNUP models for FEMA study. be displaced landward approximately that distance in order to assess the inland extension of the flooding. And recall that we are showing flood depth, or Inundation Depth. That is, the height of the water column above the local terrain elevation. Figure 7 shows that even for the lowest category (a 1) passing through the most critical track for Costa Sur floods the first row of infrastructure, and almost reaching the second row of structures. And that happens with no wave runup. The same holds for EcoEléctrica. Figures 21 to 34 show what can be expected for the five hurricane categories under a sea level rise of +0.5 m. By now we can start to see that under some scenarios the SWE has reached, and surpassed the location of the Costa Sur turbines. As for EcoEléctrica, the flooding is such that wind waves can propagate inland and directly impact the tanks and other infrastructure. Figures 35 to 63 show results for a sea level rise of +1.0 m. Please recall that we have not included wave runup in these maps and that, historically, wave runup can increase the inland flooding by a factor of two.


7 7 Figure 5 Costa Sur and EcoEléctrica nodes (white crosses) of computational mesh used in the ADCIRC+SWAN study referenced in this study. Near the power plants the node spacing varies between meters. Figure 6 Inundation Depth for category 1 hurricane under SLR = 0 m. EcoEléctrica and Costa Sur.


8 8 Figure 7 Inundation Depth for category 1 hurricane under SLR = 0 m. Costa Sur. Figure 8 Inundation Depth for category 1 hurricane under SLR = 0 m. EcoEléctrica and Costa Sur.


9 9 Figure 9 Inundation Depth for category 2 hurricane under SLR = 0 m. EcoEléctrica and Costa Sur. Figure 10 Inundation Depth for category 2 hurricane under SLR = 0 m. Costa Sur.


10 10 Figure 11 Inundation Depth for category 2 hurricane under SLR = 0 m. EcoEléctrica. Figure 12 Inundation Depth for category 3 hurricane under SLR = 0 m. EcoEléctrica and Costa Sur.


11 11 Figure 13 Inundation Depth for category 3 hurricane under SLR = 0 m. Costa Sur. Figure 14 - Inundation Depth for category 3 hurricane under SLR = 0 m. EcoEléctrica.


12 12 Figure 15 - Inundation Depth for category 4 hurricane under SLR = 0 m. EcoEléctrica and Costa Sur. Figure 16 - Inundation Depth for category 3 hurricane under SLR = 0 m. Costa Sur. Note that if we displace landward the painted contours in order to account for the DEM displacement, it looks as if the stillwater is close to, or has, reached the turbines.


13 13 Figure 17 - Inundation Depth for category 4 hurricane under SLR = 0 m. EcoEléctrica Figure 18 - Inundation Depth for category 5 hurricane under SLR = 0 m. EcoEléctrica and Costa Sur.

14 14 Figure 19 - Inundation Depth for category 5 hurricane under SLR = 0 m. Costa Sur. Note that if we displace landward the painted contours in order to account for the DEM displacement, it looks as if the stillwater is close to, or has, reached the turbines. Figure 20 - Inundation Depth for category 5 hurricane under SLR = 0 m. EcoEléctrica


15 15 Figure 21 - Inundation Depth for category 1 hurricane under SLR = +0.5 m. EcoEléctrica and Costa Sur. Figure 22 - Inundation Depth for category 1 hurricane under SLR = +0.5 m. Costa Sur.

16 16 Figure 23 - Inundation Depth for category 1 hurricane under SLR = +0.5 m. EcoEléctrica. Figure 24 - Inundation Depth for category 2 hurricane under SLR = +0.5 m. EcoEléctrica and Costa Sur.


17 17 Figure 25 - Inundation Depth for category 2 hurricane under SLR = +0.5 m. Costa Sur. Figure 26 - Inundation Depth for category 2 hurricane under SLR = +0.5 m. EcoEléctrica.


18 18 Figure 27 - Inundation Depth for category 3 hurricane under SLR = +0.5 m. EcoEléctrica and Costa Sur. Figure 28 - Inundation Depth for category 3 hurricane under SLR = +0.5 m. Costa Sur.


19 19 Figure 29 - Inundation Depth for category 4 hurricane under SLR = +0.5 m. EcoEléctrica and Costa Sur. Figure 30 - Inundation Depth for category 4 hurricane under SLR = +0.5 m. Costa Sur. Note the flooding has reached some of the turbines (after shifting landward the painted contours).


20 20 Figure 31 - Inundation Depth for category 4 hurricane under SLR = +0.5 m. EcoEléctrica. Figure 32 - Inundation Depth for category 5 hurricane under SLR = +0.5 m. EcoEléctrica and Costa Sur.
.")
21 21 Figure 33 - Inundation Depth for category 5 hurricane under SLR = +0.5 m. Costa Sur. Note the flooding has surpassed the turbines (even without shifting landward the painted contours). Figure 34 - Inundation Depth for category 5 hurricane under SLR = +0.5 m. EcoEléctrica.


22 22 Figure 35 - Inundation Depth for category 1 hurricane under SLR = +1.0 m. EcoEléctrica and Costa Sur. Figure 36 - Inundation Depth for category 1 hurricane under SLR = +1.0 m. Costa Sur.


23 23 Figure 37 - Inundation Depth for category 1 hurricane under SLR = +1.0 m. EcoEléctrica. Figure 38 - Inundation Depth for category 2 hurricane under SLR = +1.0 m. EcoEléctrica and Costa Sur.


24 24 Figure 39 - Inundation Depth for category 2 hurricane under SLR = +1.0 m. Costa Sur. Figure 40 - Inundation Depth for category 2 hurricane under SLR = +1.0 m. EcoEléctrica.


25 25 Figure 41 - Inundation Depth for category 3 hurricane under SLR = +1.0 m. EcoEléctrica and Costa Sur. Figure 42 - Inundation Depth for category 3 hurricane under SLR = +1.0 m. Costa Sur.


26 26 Figure 43 - Inundation Depth for category 3 hurricane under SLR = +1.0 m. EcoEléctrica. Figure 44 - Inundation Depth for category 4 hurricane under SLR = +1.0 m. EcoEléctrica and Costa Sur.


27 27 Figure 45 - Inundation Depth for category 4 hurricane under SLR = +1.0 m. Costa Sur. Note the flooding of two of the turbines. Figure 46 - Inundation Depth for category 4 hurricane under SLR = +1.0 m. EcoEléctrica.


28 28 Figure 47 - Inundation Depth for category 5 hurricane under SLR = +1.0 m. EcoEléctrica and Costa Sur. Figure 48 - Inundation Depth for category 5 hurricane under SLR = +1.0 m. Costa Sur.


29 29 Figure 49 - Inundation Depth for category 5 hurricane under SLR = +1.0 m. EcoEléctrica. Figure 50 Significant Wave Height, Hs, in meters for Category 1 hurricane. SLR = 0.0 m. EcoEléctrica and Costa Sur.


30 30 Figure 51 - Significant Wave Height, Hs, in meters for Category 2 hurricane. SLR = 0.0 m. EcoEléctrica and Costa Sur. Figure 52 - Significant Wave Height, Hs, in meters for Category 3 hurricane. SLR = 0.0 m. EcoEléctrica and Costa Sur.


31 31 Figure 53 - Significant Wave Height, Hs, in meters for Category 4 hurricane. SLR = 0.0 m. EcoEléctrica and Costa Sur. Figure 54 - Significant Wave Height, Hs, in meters for Category 4 hurricane. SLR = 0.0 m. EcoEléctrica and Costa Sur.


32 32 Figure 55 - Significant Wave Height, Hs, in meters for Category 1 hurricane. SLR = +0.5 m. EcoEléctrica and Costa Sur. Figure 56 - Significant Wave Height, Hs, in meters for Category 2 hurricane. SLR = +0.5 m. EcoEléctrica and Costa Sur.


33 33 Figure 57 - Significant Wave Height, Hs, in meters for Category 3 hurricane. SLR = +0.5 m. EcoEléctrica and Costa Sur. Figure 58 - Significant Wave Height, Hs, in meters for Category 4 hurricane. SLR = +0.5 m. EcoEléctrica and Costa Sur.


34 34 Figure 59 - Significant Wave Height, Hs, in meters for Category 5 hurricane. SLR = +0.5 m. EcoEléctrica and Costa Sur. Figure 60 - Significant Wave Height, Hs, in meters for Category 1 hurricane. SLR = +1.0 m. EcoEléctrica and Costa Sur.


35 35 Figure 61 - Significant Wave Height, Hs, in meters for Category 3 hurricane. SLR = +1.0 m. EcoEléctrica and Costa Sur. Figure 62 - Significant Wave Height, Hs, in meters for Category 4 hurricane. SLR = +1.0 m. EcoEléctrica and Costa Sur.

36 Figure 63 - Significant Wave Height, Hs, in meters for Category 5 hurricane. SLR = +1.0 m. EcoEléctrica and Costa Sur. 36
2016 NC Coastal Local Governments Annual Meeting
 2016 NC Coastal Local Governments Annual Meeting Coastal Flood Study Modeling and Mapping 101 April 21, 2016 Tom Langan, PE, CFM Engineering Supervisor NCEM Floodplain Mapping Program FEMA Coastal Flood
Bay County, MI Coastal Hazard Analysis Flood Risk Review Meeting. May 14, 2018
 Bay County, MI Coastal Hazard Analysis Flood Risk Review Meeting May 14, 2018 Agenda Introductions Coastal Flood Risk Study and Mapping Program Current Status Technical Overview of Study and Mapping Floodplain
Door County, WI Coastal Hazard Analysis Flood Risk Review Meeting. August 21, 2017
 Door County, WI Coastal Hazard Analysis Flood Risk Review Meeting August 21, 2017 Agenda Introductions Coastal Flood Risk Study and Mapping Program Current Status Technical Overview of Study and Mapping
Sussex County, DE Preliminary Study Overview
 Sussex County, DE Preliminary Study Overview Coastal study scope: 102 miles of entire County shoreline Revised 102 panels for coastal study Riverine study scope: 14 streams, 67.1 miles, within the Nanticoke
Baraga County, MI Coastal Hazard Analysis Flood Risk Review Meeting. July 12, 2018
 Baraga County, MI Coastal Hazard Analysis Flood Risk Review Meeting July 12, 2018 Agenda Introductions Coastal Flood Risk Study and Mapping Program Current Status Technical Overview of Study and Mapping
Citrus, Hernando, and Pasco Coastal Hazard Analysis. Flood Risk Review Meeting Citrus, Hernando, and Pasco Counties, Florida December 14, 2017
 Citrus, Hernando, and Pasco Coastal Hazard Analysis Flood Risk Review Meeting Citrus, Hernando, and Pasco Counties, Florida December 14, 2017 Introductions Risk MAP Project Team FEMA Region IV RAMPP (study
St. Louis County, MN Coastal Hazard Analysis Flood Risk Review Meeting. May 2, 2018
 St. Louis County, MN Coastal Hazard Analysis Flood Risk Review Meeting May 2, 2018 Agenda Introductions Coastal Flood Risk Study and Mapping Program Current Status Technical Overview of Study and Mapping
Bayfield & Ashland Counties, WI Coastal Hazard Analysis Flood Risk Review Meeting. June 05, 2018
 Bayfield & Ashland Counties, WI Coastal Hazard Analysis Flood Risk Review Meeting June 05, 2018 Agenda Introductions Coastal Flood Risk Study and Mapping Program Current Status Technical Overview of Study
City of Del Mar Local Coastal Plan (LCP) Amendment for Sea Level Rise and Coastal Flooding
 Amendment for Sea Level Rise and Coastal Flooding") City of Del Mar Local Coastal Plan (LCP) Amendment for Sea Level Rise and Coastal Flooding 6/22/17 Presentation to Sea Level Rise Stakeholder- Technical Advisory Committee (STAC) Nick Garrity, P.E. Lindsey
City of Del Mar Local Coastal Plan (LCP) Amendment for Sea Level Rise and Coastal Flooding 6/22/17 Presentation to Sea Level Rise Stakeholder- Technical Advisory Committee (STAC) Nick Garrity, P.E. Lindsey
Evaluation of June 9, 2014 Federal Emergency Management Agency Flood Insurance Study for Town of Weymouth, Norfolk, Co, MA
 Evaluation of June 9, 2014 Federal Emergency Management Agency Flood Insurance Study for Town of Weymouth, Norfolk, Co, MA Prepared For: Woodard & Curran 95 Cedar Street, Suite 100 Providence, RI 02903
The History of Coastal Flood Hazard Assessments in the Great Lakes
 The History of Coastal Flood Hazard Assessments in the Great Lakes Brian A. Caufield, P.E., CFM June 23, 2016 2 The Great Lakes Some Statistics Courtesy of Great Lakes Information Network One-fifth of
Photo by: Darryl Hatheway, 2011
 Photo by: Darryl Hatheway, 2011 September 11, 2015 Presentation Discussion Examine PFD V-Zone Mapping in Wave Runup Dominated West Coast Application of PFD V-Zone Mapping Criteria in Pacific G&S PFD V-Zone
Boothbay Harbor Rotary Club May 12, 2016
 Mapping Potential Sea Level Rise and Storm Surge in Boothbay Harbor, ME Boothbay Harbor Rotary Club May 12, 2016 Peter A. Slovinsky, Marine Geologist Maine Geological Survey S.M. Dickson, MGS Quickly,
SUPPLEMENTAL DOCUMENT SEA LEVEL RISE SCENARIO SELECTION AND DESIGN TIDE CALCULATION
 SUPPLEMENTAL DOCUMENT SEA LEVEL RISE SCENARIO SELECTION AND DESIGN TIDE CALCULATION FOR THE GUIDANCE FOR INCORPORATING SEA LEVEL RISE INTO CAPITAL PLANNING IN SAN FRANCISCO: ASSESSING VULNERABILITY AND
Phase-Resolving Wave Runup for Storm Inundation Assessment
 Phase-Resolving Wave Runup for Storm Inundation Assessment Jane Smith, Andrew Kennedy, Alexandros Taflanidis, Joannes Westerink, Kwok Fai Cheung, Seizo Tanaka, Aina Ota, Madeleine Hamman, Masashi Minamide,
FEMA West Coast Sea Level Rise Pilot Study
 FEMA West Coast Sea Level Rise Pilot Study Ed Curtis, P.E., CFM FEMA Region IX June 4, 2014 Presentation Objectives Present the goals of the FEMA West Coast Sea Level Rise Pilot Study Review the SLR Pilot
HURRICANE SANDY LIMITED REEVALUATION REPORT UNION BEACH, NEW JERSEY DRAFT ENGINEERING APPENDIX SUB APPENDIX D SBEACH MODELING
 HURRICANE SANDY LIMITED REEVALUATION REPORT UNION BEACH, NEW JERSEY DRAFT ENGINEERING APPENDIX SUB APPENDIX D SBEACH MODELING Rev. 18 Feb 2015 1 SBEACH Modeling 1.0 Introduction Following the methodology
Coastal Inundation. An Overview for TCDC
 Coastal Inundation An Overview for TCDC Rick Liefting Team Leader Regional Hazards and Environmental Compliance Integrated Catchment Management Waikato Regional Council Photo: Sugar Loaf Wharf, Coromandel.
2017 Preliminary FEMA Flood Maps Old Orchard Beach Town Council Meeting. Old Orchard Beach, Town Hall July 18, 2017
 2017 Preliminary FEMA Flood Maps Old Orchard Beach Town Council Meeting Old Orchard Beach, Town Hall July 18, 2017 Overview Potential impacts of inaccurate Flood Insurance Rate Maps (FIRM) Why is appealing
Taranaki Tsunami Inundation Analysis. Prepared for Taranaki Civil Defence Emergency Management Group. Final Version
 Taranaki Tsunami Inundation Analysis Prepared for Taranaki Civil Defence Emergency Management Group Final Version June 2012 AM 12/07 HBRC Plan Number 4362 Asset Management Group Technical Report Prepared
FEMA Region V. Great Lakes Coastal Flood Study. Pilot Study Webinar. Berrien County, Michigan. February 26, 2014
 FEMA Region V Great Lakes Coastal Flood Study Pilot Study Webinar Berrien County, Michigan February 26, 2014 2 Pilot Study Webinar Agenda Great Lakes Coastal Flood Study Background Demonstration Project
New Orleans Municipal Yacht Harbor
 New Orleans Municipal Yacht Harbor Marina Schematic Design Update 601 Poydras St., Suite 1860 New Orleans, LA, 70130 504-648-3560 Post-Katrina Municipal Yacht Harbor: Introduction The MYH was an approximate
We Make a Difference. New Maps, Now What? Updated Coastal Flood Hazard Information for Southern Georgia
 New Maps, Now What? Updated Coastal Flood Hazard Information for Southern Georgia New Maps, Now What? Risk MAP Project Team FEMA Region IV BakerAECOM, FEMA Mapping Partner GA DNR (CTP) NEFL Duval Flagler
Hydrodynamic Modeling of Tides and Hurricane Storm Surge for Pre- and Post-Dredging Conditions in the Lower St. Johns River, Florida
 Hydrodynamic Modeling of Tides and Hurricane Storm Surge for Pre- and Post-Dredging Conditions in the Lower St. Johns River, Florida Matthew V. Bilskie 1 1 PhD Student, University of Central Florida, Department
Fortified For Safer Living
 Fortified For Safer Living Module 15: Protecting Homes Against Floods and Storm Surge An important part of trying to reduce the damage and losses from storm events is to make sure that the home doesn t
UPPER BEACH REPLENISHMENT PROJECT RELATED
 ASSESSMENT OF SAND VOLUME LOSS at the TOWNSHIP of UPPER BEACH REPLENISHMENT PROJECT RELATED to the LANDFALL OF HURRICANE SANDY - PURSUANT TO NJ-DR 4086 This assessment is in response to Hurricane Sandy
RE: Hurricane Matthew Beach Damage Assessment and Recommendations [CSE 2416]
![RE: Hurricane Matthew Beach Damage Assessment and Recommendations [CSE 2416]](/thumbs/83/87675702.jpg "RE: Hurricane Matthew Beach Damage Assessment and Recommendations [CSE 2416]") October 25, 2016 Iris Hill Town Administrator Town of Edisto Beach 2414 Murray St Edisto Beach SC 29438 RE: Hurricane Matthew Beach Damage Assessment and Recommendations [CSE 2416] Dear Iris, Hurricane
October 25, 2016 Iris Hill Town Administrator Town of Edisto Beach 2414 Murray St Edisto Beach SC 29438 RE: Hurricane Matthew Beach Damage Assessment and Recommendations [CSE 2416] Dear Iris, Hurricane
Leaning Into Adaptation
 www.marinslr.org Leaning Into Adaptation GFNMS Ocean Summit, May 17, 2016 Jack Liebster, Planning Manager, Marin County Marin County C-SMART Sea Level Rise Adaptation Process Evaluate Science Info. Implement
A Coastal Storm Modeling System for determination of flood hazards along a high energy coast in response to SLR and 21 st century storms
 Li Erikson, Patrick Barnard, Andrea O Neill, Jodi Eshleman, Amy Foxgrover, Michael Fitzgibbon 2, Grant Ballard 2, Kelly Higgason 3 A Coastal Storm Modeling System for determination of flood hazards along
U.S. Army Engineer Institute for Water Resources
 Sea Level Change Curve Calculator (2014.88) (DRAFT) U.S. Army Engineer Institute for Water Resources Table of Contents 1. INTRODUCTION... 2 1.1 BACKGROUND... 2 1.1.1 INFORMATION QUALITY ACT... 2 1.2 OVERVIEW...
APPENDIX D-2. Sea Level Rise Technical Memo
 APPENDIX D-2 Sea Level Rise Technical Memo 2185 N. California Blvd., Suite 500 Walnut Creek, CA 94596 (925) 944-5411 Fax: (925) 944-4732 www.moffattnichol.com DRAFT MEMORANDUM To: From: Neil Nichols,
Physical Map Revisions in Connecticut due to Updated Coastal Flood Hazards F8: Maps in Transition
 Physical Map Revisions in Connecticut due to Updated Coastal Flood Hazards F8: Maps in Transition Brian Caufield, P.E., CFM Principal Engineer CDM Smith Kerry Bogdan, CFM Senior Engineer FEMA Region I
Open Pacific Coast Study. California Coastal Analysis and Mapping Project
 Open Pacific Coast Study California Coastal Analysis and Mapping Project September 2012 California Open Coast Counties California Coastal Analysis and Mapping Project This publication is an initiative
CALCASIEU SALINITY STRUCTURES. HYDRODYNAMIC MODELING (To Support Design of Salinity Barriers)
") CALCASIEU SALINITY STRUCTURES HYDRODYNAMIC MODELING (To Support Design of Salinity Barriers) Presentation Overview 1 2 3 4 5 Project Overview and CEA Circulation Modeling Vessel Hydrodynamics Modeling
CALCASIEU SALINITY STRUCTURES HYDRODYNAMIC MODELING (To Support Design of Salinity Barriers) Presentation Overview 1 2 3 4 5 Project Overview and CEA Circulation Modeling Vessel Hydrodynamics Modeling
WIND SPEED LENGTH OF TIME WIND BLOWS (Duration) DISTANCE OVER WHICH IT BLOWS (Fetch)
 DISTANCE OVER WHICH IT BLOWS (Fetch)") WAVES Up and down movement of ocean surface Transportation of energy across the water over vast distances If not stopped by anything, waves can travel entire oceans Size and speed depend upon: WIND SPEED
WAVES Up and down movement of ocean surface Transportation of energy across the water over vast distances If not stopped by anything, waves can travel entire oceans Size and speed depend upon: WIND SPEED
SURGE SUPPRESSION ACHIEVED BY DIFFERENT COASTAL SPINE (IKE DIKE) ALIGNMENTS. Bruce A. Ebersole, Thomas W. Richardson and Robert W.
 ALIGNMENTS. Bruce A. Ebersole, Thomas W. Richardson and Robert W.") SURGE SUPPRESSION ACHIEVED BY DIFFERENT COASTAL SPINE (IKE DIKE) ALIGNMENTS Abstract Bruce A. Ebersole, Thomas W. Richardson and Robert W. Whalin, Jackson State University, Jackson, Mississippi The primary
SURGE SUPPRESSION ACHIEVED BY DIFFERENT COASTAL SPINE (IKE DIKE) ALIGNMENTS Abstract Bruce A. Ebersole, Thomas W. Richardson and Robert W. Whalin, Jackson State University, Jackson, Mississippi The primary
SEA LEVEL RISE IMPACT ASSESSMENT AND MITIGATION ALTERNATIVES DEVELOPMENT FOR BALBOA ISLANDS, CITY OF NEWPORT BEACH, CALIFORNIA
 SEA LEVEL RISE IMPACT ASSESSMENT AND MITIGATION ALTERNATIVES DEVELOPMENT FOR BALBOA ISLANDS, CITY OF NEWPORT BEACH, CALIFORNIA Ying Poon 1, Brett Sanders 2, Randy Mason 3 and Robert Stein 4 The City of
Bob Battalio, PE Chief Engineer, ESA September 8, 2016
 RELATING FUTURE COASTAL CONDITIONS TO EXISTING FEMA FLOOD HAZARD MAPS Technical Methods Manual Bob Battalio, PE Chief Engineer, ESA September 8, 2016 FMA 2016 Sacramento, California DWR-OST-SIO PILOTING
Appendix D: SWAN Wave Modelling
 Appendix D: SWAN Wave Modelling D.1 Preamble The Eurobodalla Shire Council area is subject to extreme waves originating from offshore storms. When swell waves approach the coast, they are modified by the
San Luis Obispo County December 2, 2014
 Flood Risk Review Meeting: Open Pacific Coast Study San Luis Obispo County December 2, 2014 Welcome and Introductions Flood Risk Review Meeting San Luis Obispo County California Coastal Analysis and Mapping
COASTAL MORPHODYNAMICS
 COASTAL MORPHODYNAMICS PATRICIA CHARDÓN-MALDONADO, PHD, EIT Miguel Canals, Jack A. Puleo, Alec Torres-Freyermuth & Jens Figlus March 9, 2017 OUTLINE INTRODUCTION Meteorological Phenomena Forcing Conditions
2 How do I use the Coastal Inundation Tool?
 Coastal Inundation Tool Guidance 1 Overview The Coastal Inundation Tool provides users with a tool to quickly understand the susceptibility of coastal areas to coastal inundation due to tides, storms and
Monterey County December 3, 2014
 Flood Risk Review Meeting: Open Pacific Coast Study Monterey County December 3, 2014 Welcome and Introductions Flood Risk Review Meeting Monterey County California Coastal Analysis and Mapping Project
COASTAL HAZARDS. What are Coastal Hazards?
 COASTAL HAZARDS What are Coastal Hazards? Hazards in the New Jersey coastal zone include unavoidable risks to life and property generated by: coastal flooding, waves, high winds and waves, short-term and
UNDERSTANDING STORM SURGE
 The Education Program at the New Jersey Sea Grant Consortium 22 Magruder Road, Fort Hancock, NJ 07732 (732) 872-1300 www.njseagrant.org UNDERSTANDING STORM SURGE ACTIVITY 6 SURGE OF THE STORM http://secoora.org/classroom/virtual_hurricane/surge_of_the_storm>
To: William Woods, Jenni Austin Job No: CentrePort Harbour Deepening Project - Comments on community queries
 Memo To: William Woods, Jenni Austin From: Richard Reinen-Hamill Date: Subject: cc: 1 Purpose This memo sets out our response to issues raised at and after Seatoun community consultation sessions held
Tidal regime along Vietnam coast under impacts of sea level rise
 VNU Journal of Science, Earth Sciences 28 (2012) 133-139 Tidal regime along Vietnam coast under impacts of sea level rise Tran Thuc, Duong Hong Son* Vietnam Institute of Meteorology, Hydrology and Environment
Cyclone Hazards: waves and storm tide
 Cyclone Hazards: waves and storm tide 1/32 HIGH WAVES TORRENTIAL RAIN (FLOODING) SURGE ON COAST AT CROSSING GALE FORCE WINDS 2/32 Waves and Swell MetEd Comet Program Wind and Wave forecasting https://www.meted.ucar.edu/training_course.php?id=8
Technical Brief - Wave Uprush Analysis Island Harbour Club, Gananoque, Ontario
 Technical Brief - Wave Uprush Analysis RIGGS ENGINEERING LTD. 1240 Commissioners Road West Suite 205 London, Ontario N6K 1C7 October 31, 2014 Table of Contents Section Page Table of Contents... i List
VOLUME 2 OF 5 VOLUSIA COUNTY, FLORIDA AND INCORPORATED AREAS COMMUNITY NAME NUMBER COMMUNITY NAME NUMBER
 VOLUME 2 OF 5 VOLUSIA COUNTY, FLORIDA AND INCORPORATED AREAS COMMUNITY NAME NUMBER COMMUNITY NAME NUMBER DAYTONA BEACH, CITY OF 125099 NEW SMYRNA BEACH, CITY OF 125132 DAYTONA BEACH SHORES, CITY OF 125100
Monterey Peninsula College
 Introduction to Google Earth Name Goals 1. To become proficient at using the basic features of Google Earth. 2. To recognize differences in coastal features between the east and west coast of North America.
COASTAL ENVIRONMENTS. 454 lecture 12
 COASTAL ENVIRONMENTS Repeated movement of sediment & water constructs a beach profile reflecting the balance between average daily or seasonal wave forces and resistance of landmass to wave action Coasts
Time Dependent Wave Setup During Hurricanes on the Mississippi Coast. D. Slinn, A. Niedoroda,, R. Dean, R. Weaver, C. Reed, and J. Smith.
 Time Dependent Wave Setup During Hurricanes on the Mississippi Coast D. Slinn, A. Niedoroda,, R. Dean, R. Weaver, C. Reed, and J. Smith. 1 Motivation TO UNDERSTAND THE APPARENT DIFFERENCE IN WAVE SET-UP
Limited Data, Complex Coastline and Successful Wave Modeling Challenges, Solutions and Lessons Learned
 Limited Data, Complex Coastline and Successful Wave Challenges, Solutions and Lessons Learned Paula Kulis, PhD Nader Mahmoudpour, PhD Lauren Klonsky June 11, 2013 Purpose Objectives Wave Procedure Challenges
LOCAL COASTAL PROGRAM UPDATE
 LOCAL COASTAL PROGRAM UPDATE Agenda Meeting #1 General Information (1 1:45 pm) Introductions and Background Grants involved What is a Local Coastal Program? What is required? LCP Update tasks and schedule
COMMENTS FOR THE NSF TSUNAMI WORKSHOP AT HILO, HAWAII, DECEMBER 2006 By Robert L. Wiegel
 COMMENTS FOR THE NSF TSUNAMI WORKSHOP AT HILO, HAWAII, 26-28 DECEMBER 2006 By Robert L. Wiegel 1. Introduction 2. Risk, Adjustment, Mitigation 3. Hilo, Hawaii 4. Designing for Tsunamis: Seven Principles
consulting engineers and scientists
 consulting engineers and scientists Coastal Processes Presented by: January 9, 2015 Varoujan Hagopian, P.E. F.ASCE Senior Consultant, Waterfront Engineer Living Shoreline Workshop Lets Remember Why We
FEMA's new flood plain mapping could cost coastal Mainers dearly
 July 5 FEMA's new flood plain mapping could cost coastal Mainers dearly Some communities in York and Cumberland counties hire a consultant to challenge the agency's findings. By Tux Turkeltturkel@mainetoday.com
Assessing Tidal Flood Risk in Ireland: Modelling, Mapping & Forecasting Coastal and Tidal Flood Risk for Irish APSFRs
 Assessing Tidal Flood Risk in Ireland: Modelling, Mapping & Forecasting Coastal and Tidal Flood Risk for Irish APSFRs Dr. John Martin C.Eng. OPW Flood Risk Assessment & Management Section, Ireland WG-F
Currents measurements in the coast of Montevideo, Uruguay
 Currents measurements in the coast of Montevideo, Uruguay M. Fossati, D. Bellón, E. Lorenzo & I. Piedra-Cueva Fluid Mechanics and Environmental Engineering Institute (IMFIA), School of Engineering, Research
Ivan-like hurricane storm surge simulations for Tampa Bay, FL with 3-D and 2-D models
 Ivan-like hurricane storm surge simulations for Tampa Bay, FL with 3-D and 2-D models R.H. Weisberg and L. Zheng Storm Surge Workshop St. Pete Beach 2/11/09 Potential for Tampa Bay area inundation is large
Municipal Adaptation to Sea Level Rise in Saco Bay, Ogunquit, and Seabrook
 Municipal Adaptation to Sea Level Rise in Saco Bay, Ogunquit, and Seabrook Changing Environments Symposium Bowdoin College October 24, 2009 Climate Change Adaptation Panel 1:45 to 3:00 PM Jonathan T. Lockman,
Sea Level Rise and Coastal Flooding Why Waves Matter!
 Sea Level Rise and Coastal Flooding Why Waves Matter! Jason D. Burtner Massachusetts Office of Coastal Zone Management South Shore Regional Coordinator Sea Level Rise and Coastal Storm Damage and Flooding
TITLE: North Carolina s Changing Shorelines. KEYWORDS: erosion - shorelines - mapping - sustainability
 UNC Coastal Studies Institute Teacher Resources 1 TITLE: North Carolina s Changing Shorelines KEYWORDS: erosion - shorelines - mapping - sustainability Changing shorelines impact coastal infrastructure.
ST LEONARDS COASTAL HAZARD VULNERABILITY ASSESSMENT
 Level 12, 333 Collins Street Melbourne VIC 3000 Australia Telephone: +61 3 8676 3500 Facsimile: +61 3 8676 3505 www.worleyparsons.com WorleyParsons Services Pty Ltd ABN 61 001 279 812 23 November 2011
Tsunami Preparedness in the Capital Region
 Tsunami Preparedness in the Capital Region A presentation by: the CRD Local Government Emergency Program Advisory Commission (LG EPAC) and your community emergency programs What is a tsunami? A tsunami
Coastal Hazards Study
 Coastal Hazards Study 2212 Beach Boulevard, Pacifica Prepared for: EXECUTIVE SUMMARY City of Pacifica 170 Santa Maria Ave Pacifica, CA 94044 Prepared by: moffatt & nichol 2185 N. California Blvd. Walnut
The Surge of the Storm By Margaret Olsen and Katie Greganti
 The Surge of the Storm By Margaret Olsen and Katie Greganti Grade Level: 5-12 Type of Activity: Hands on Focus Question: How does a hurricane s storm surge of a hurricane affect the low-lying areas along
April 7, Prepared for: The Caribbean Disaster Emergency Response Agency Prepared by: CEAC Solutions Co. Ltd.
 April 7, 2006 Prepared for: The Caribbean Disaster Emergency Response Agency Prepared by: Introduction CEAC Solutions Co. Ltd was commissioned in May 2005 to prepare coastal beach erosion hazard maps for
Oceans - Laboratory 12
 Oceans - Laboratory 12 (Name) How do ocean waves form? All waves are disturbances of a fluid medium through which energy is moved (Davis, 1997). Ocean waves travel on the interface between oceans and the
Pathways Interns: Annika O Dea, Ian Conery, Andrea Albright
 1 REMOTE SENSING OF COASTAL MORPHODYNAMICS 237 237 237 217 217 217 2 2 2 8 119 27 252 174.59 255 255 255 163 163 163 131 132 122 239 65 53 11 135 12 112 92 56 62 12 13 12 56 48 13 12 111 Kate Brodie Brittany
Tsunamis. Tsunamis COMMUNITY EMERGENCY RESPONSE TEAM TSUNAMIS
 Tsunamis Tsunamis Tell the participants that tsunamis are ocean waves that are produced by underwater earthquakes or landslides. The word is Japanese and means harbor wave because of the devastating effects
WMS 8.4 Tutorial Hydraulics and Floodplain Modeling HY-8 Modeling Wizard Learn how to model a culvert using HY-8 and WMS
 v. 8.4 WMS 8.4 Tutorial Hydraulics and Floodplain Modeling HY-8 Modeling Wizard Learn how to model a culvert using HY-8 and WMS Objectives Define a conceptual schematic of the roadway, invert, and downstream
New Jersey Coastal Zone Overview. The New Jersey Beach Profile Network (NJBPN) 3 Dimensional Assessments. Quantifying Shoreline Migration
 3 Dimensional Assessments. Quantifying Shoreline Migration") New Jersey Coastal Zone Overview The New Jersey Beach Profile Network (NJBPN) Objectives Profile Locations Data Collection Analyzing NJBPN Data Examples 3 Dimensional Assessments Methodology Examples Quantifying
New Jersey Coastal Zone Overview The New Jersey Beach Profile Network (NJBPN) Objectives Profile Locations Data Collection Analyzing NJBPN Data Examples 3 Dimensional Assessments Methodology Examples Quantifying
APPENDIX A APPENDIX B APPENDIX C APPENDIX D APPENDIX E APPENDIX F APPENDIX G SEDIMENT ANALYSIS APPENDIX A WAVE & SEDIMENT MODELS CRYSTAL BALL ANALYSIS
 APPENDIX A WAVE & SEDIMENT MODELS APPENDIX B SEDIMENT ANALYSIS APPENDIX A WAVE & SEDIMENT MODELS APPENDIX C CRYSTAL BALL ANALYSIS APPENDIX D SBEACH ANALYSIS APPENDIX E GENESIS ANALYSIS APPENDIX F PREFERRED
Technical Brief - Wave Uprush Analysis 129 South Street, Gananoque
 Technical Brief - Wave Uprush Analysis 129 South Street, Gananoque RIGGS ENGINEERING LTD. 1240 Commissioners Road West Suite 205 London, Ontario N6K 1C7 June 12, 2013 Table of Contents Section Page Table
SPO Regional Challenge Grant Creation of a Sea Level Adaption Working Group for Biddeford, Saco, OOB and Scarborough J.T. Lockman, AICP, Planning
 SPO Regional Challenge Grant Creation of a Sea Level Adaption Working Group for Biddeford, Saco, OOB and Scarborough J.T. Lockman, AICP, Planning Director Southern Maine Regional Planning Commission jlockman@smrpc.org
Waves. Swell, Surf, and Tides
 Waves Swell, Surf, and Tides Tsunamis Tsunamis Waves of Destruction Seismic Sea Waves Seismic Sea Waves Most tsunamis are generated by earthquakes Seismic Sea Waves Most tsunamis are generated by earthquakes
Effectiveness of Beach Nourishment in Response to Sea Level Rise
 2014 FSBPA Annual Conference Effectiveness of Beach Nourishment in Response to Sea Level Rise Navarre Beach Santa Rosa County July 18, 2005 Lovers Key Lee County April 23, 2012 South County St. Lucie County
Town of Duck, North Carolina
 Tracking No. 00.00.2010 Erosion Mitigation And Shoreline Management Feasibility Study Town of Duck, North Carolina Coastal Planning & Engineering of North Carolina August 15, 2012 Tom Jarrett Robert Neal
Tsunami Preparedness in the Capital Region
 Tsunami Preparedness in the Capital Region A presentation by: the CRD Local Government Emergency Program Advisory Commission (LG EPAC) and your community emergency programs What is a tsunami? A tsunami
Future Condi,ons coastal hazard modeling and mapping
 Future Condi,ons coastal hazard modeling and mapping Presented by Bob Ba:alio, PE Environmental Science Associates, Inc. (ESA) On behalf of the physical processes team (USGS, TerraCosta- Scripps, ESA)
Name: Unit 5-6 Pretest. 28. Circle the picture(s) that show erosion.
 that show erosion.") Name: 28. Circle the picture(s) that show erosion. ATEP 2009 UAF Geophysical Institute 10 29. Write or draw what a ghost forest is. soil 30. These are layers from the soil. Circle the oldest layer. sand
Name: 28. Circle the picture(s) that show erosion. ATEP 2009 UAF Geophysical Institute 10 29. Write or draw what a ghost forest is. soil 30. These are layers from the soil. Circle the oldest layer. sand
A PRACTICAL APPROACH TO MAPPING EXTREME WAVE INUNDATION: CONSEQUENCES OF SEA-LEVEL RISE AND COASTAL EROSION.
 A PRACTICAL APPROACH TO MAPPING EXTREME WAVE INUNDATION: CONSEQUENCES OF SEA-LEVEL RISE AND COASTAL EROSION. Sean Vitousek 1, Charles H. Fletcher 1, Matthew M. Barbee 1 1. Department of Geology and Geophysics,
SACO RIVER AND CAMP ELLIS BEACH SACO, MAINE SECTION 111 SHORE DAMAGE MITIGATION PROJECT APPENDIX F ECONOMIC ASSESSMENT
 SACO RIVER AND CAMP ELLIS BEACH SACO, MAINE SECTION 111 SHORE DAMAGE MITIGATION PROJECT APPENDIX F ECONOMIC ASSESSMENT Department of the Army New England District, Corps of Engineers 696 Virginia Road
Preliminary Wake Wash Impact Analysis Redwood City Ferry Terminal, Redwood City, CA
 Technical Memorandum Preliminary Wake Wash Impact Analysis Redwood City Ferry Terminal, Redwood City, CA 1. Introduction The following preliminary wake wash impact analysis was initiated by the Port of
VENICE LOCAL COASTAL PROGRAM UPDATE: COASTAL HAZARDS WELCOME
 VENICE LOCAL COASTAL PROGRAM UPDATE: COASTAL HAZARDS WELCOME 1 Introducing the Team Hosted by the Department of City Planning and grant funded in part by the California Coastal Commission 2 Workshop Purpose
Assessment of flooding on low-elevation reef-lined coasts
 Assessment of flooding on low-elevation reef-lined coasts Ap van Dongeren, Deltares, Delft, The Netherlands With Curt Storlazzi, USGS, Santa Cruz, USA Impact on coral reef-lined islands and coasts Coral
FINAL Sea Level Rise Existing Data and Analyses Technical Memorandum
 Planning Department FINAL Sea Level Rise Existing Data and Analyses Technical Memorandum May 6, 2016 Prepared For: City and County of San Francisco Planning Department 1650 Mission Street, Suite 400 San
Influence of oceanographic processes on coastal erosion, morphology and inundation
 FACULTY OF ENGINEERING, COMPUTING AND MATHEMATICS Influence of oceanographic processes on coastal erosion, morphology and inundation Charitha Pattiaratchi School of Civil, Environmental and Mining Engineering
NTHMP - Mapping & Modeling Benchmarking Workshop: Tsunami Currents
 NTHMP - Mapping & Modeling Benchmarking Workshop: Tsunami Currents Ahmet Cevdet Yalçıner, Andrey Zaytsev, Utku Kanoğlu Deniz Velioglu, Gozde Guney Dogan, Rozita Kian, Naeimeh Shaghrivand, Betul Aytore
MODELING OF CLIMATE CHANGE IMPACTS ON COASTAL STRUCTURES - CONTRIBUTION TO THEIR RE-DESIGN
 Proceedings of the 14 th International Conference on Environmental Science and Technology Rhodes, Greece, 3-5 September 2015 MODELING OF CLIMATE CHANGE IMPACTS ON COASTAL STRUCTURES - CONTRIBUTION TO THEIR
Matt Niles. Research Report. Submitted To
 Shoreline Setbacks on the Island of Maui, Hawaii An Analysis of Shoreline Variability, Existing Policy, and Recommended Alternatives by Matt Niles Research Report Submitted To Marine Resource Management
City of Port Aransas Shoreline Analysis and Improvements
 City of Port Aransas Shoreline Analysis and Improvements FINAL Technical Report August 24, 2016 Submitted To: City of Port Aransas Prepared for: City of Port Aransas This document is intended for planning
Coastal Risk Assesment for Ebeye. Technical report
 Coastal Risk Assesment for Ebeye Technical report Coastal Risk Assessment for Ebeye Technical report Alessio Giardino Kees Nederhoff Matthijs Gawehn Ellen Quataert Alex Capel 1230829-001 Deltares, 2017,
Chuki Hongo 1, Haruko Kurihara 1, Yimnang Golbuu 2. PICRC Technical Report No
 Projecting the effectiveness of coral reefs in mitigating the impact from sea-level rise and tropical cyclones on the coastline of Melekeok, Palau to the end of the 21 st Century Chuki Hongo 1, Haruko
SANTA ROSA COUNTY, FLORIDA AND INCORPORATED AREAS
 VOLUME 1 OF 1 SANTA ROSA COUNTY, FLORIDA AND INCORPORATED AREAS COMMUNITY NAME GULF BREEZE, CITY OF 120275 JAY, TOWN OF 120339 MILTON, CITY OF 120276 SANTA ROSA COUNTY, UNINCORPORATED AREAS COMMUNITY NUMBER
Shorelines Earth - Chapter 20 Stan Hatfield Southwestern Illinois College
 Shorelines Earth - Chapter 20 Stan Hatfield Southwestern Illinois College The Shoreline A Dynamic Interface The shoreline is a dynamic interface (common boundary) among air, land, and the ocean. The shoreline
The Pillowcase Project Learn. Practice. Share.
 The Pillowcase Project Learn. Practice. Share. local hazard resource Tsunami Preparedness Learning Objectives Students will be able to explain what causes tsunamis and what happens during a tsunami. Students
Reply of Guyana Annex R2
 Summary of Findings: Analysis of Recent Shoreline Revisions to the This report assesses recent shoreline changes made to the 2005 edition of Dutch nautical chart NL 2218. This new edition is credited jointly