SANTA ROSA COUNTY, FLORIDA AND INCORPORATED AREAS
|
|
|
- Vincent Blair
- 6 years ago
- Views:
Transcription


1 VOLUME 1 OF 1 SANTA ROSA COUNTY, FLORIDA AND INCORPORATED AREAS COMMUNITY NAME GULF BREEZE, CITY OF JAY, TOWN OF MILTON, CITY OF SANTA ROSA COUNTY, UNINCORPORATED AREAS COMMUNITY NUMBER PRELIMINARY: July 18, 2016 REVISED: TBD FLOOD INSURANCE STUDY NUMBER 12113CV000B Version Number
2 TABLE OF CONTENTS Volume 1 Page SECTION 1.0 INTRODUCTION The National Flood Insurance Program Purpose of this Flood Insurance Study Report Jurisdictions Included in the Flood Insurance Study Project Considerations for using this Flood Insurance Study Report 5 SECTION 2.0 FLOODPLAIN MANAGEMENT APPLICATIONS Floodplain Boundaries Floodways Base Flood Elevations Non-Encroachment Zones Coastal Flood Hazard Areas Water Elevations and the Effects of Waves Floodplain Boundaries and BFEs for Coastal Areas Coastal High Hazard Areas Limit of Moderate Wave Action 24 SECTION 3.0 INSURANCE APPLICATIONS National Flood Insurance Program Insurance Zones Coastal Barrier Resources System 25 SECTION 4.0 AREA STUDIED Basin Description Principal Flood Problems Non-Levee Flood Protection Measures Levees 29 SECTION 5.0 ENGINEERING METHODS Hydrologic Analyses Hydraulic Analyses Coastal Analyses Total Stillwater Elevations Waves Coastal Erosion Wave Hazard Analyses Alluvial Fan Analyses 73 SECTION 6.0 MAPPING METHODS Vertical and Horizontal Control Base Map Floodplain and Floodway Delineation Coastal Flood Hazard Mapping FIRM Revisions 93 i
3 6.5.1 Letters of Map Amendment Letters of Map Revision Based on Fill Letters of Map Revision Physical Map Revisions Contracted Restudies Community Map History 95 SECTION 7.0 CONTRACTED STUDIES AND COMMUNITY COORDINATION Contracted Studies Community Meetings 96 SECTION 8.0 ADDITIONAL INFORMATION 99 SECTION 9.0 BIBLIOGRAPHY AND REFERENCES 100 Figures Page Figure 1: FIRM Panel Index 7 Figure 2: FIRM Notes to Users 8 Figure 3: Map Legend for FIRM 11 Figure 4: Floodway Schematic 19 Figure 5: Wave Runup Transect Schematic 22 Figure 6: Coastal Transect Schematic 24 Figure 7: Frequency Discharge-Drainage Area Curves 36 Figure 8: 1% Total Stillwater Elevations for Coastal Areas 53 Figure 9: Transect Location Map 72 Tables Page Table 1: Listing of NFIP Jurisdictions 2 Table 2: Flooding Sources Included in this FIS Report 16 Table 3: Flood Zone Designations by Community 25 Table 4: Coastal Barrier Resources System Information 26 Table 5: Basin Characteristics 27 Table 6: Principal Flood Problems 28 Table 7: Historic Flooding Elevations 28 Table 8: Non-Levee Flood Protection Measures 29 Table 9: Levees 29 Table 10: Summary of Discharges 31 Table 11: Summary of Non-Coastal Stillwater Elevations 36 Table 12: Stream Gage Information used to Determine Discharges 47 Table 13: Summary of Hydrologic and Hydraulic Analyses 48 Table 14: Roughness Coefficients 51 Table 15: Summary of Coastal Analyses 52 ii
4 Table 16: Tide Gage Analysis Specifics 53 Table 17: Coastal Transect Parameters 56 Table 18: Summary of Alluvial Fan Analyses 73 Table 19: Results of Alluvial Fan Analyses 73 Table 20: Countywide Vertical Datum Conversion 74 Table 21: Stream-Based Vertical Datum Conversion 74 Table 22: Base Map Sources 74 Table 23: Summary of Topographic Elevation Data used in Mapping 75 Table 24: Floodway Data 76 Table 25: Flood Hazard and Non-Encroachment Data for Selected Streams 84 Table 26: Summary of Coastal Transect Mapping Considerations 89 Table 27: Incorporated Letters of Map Change 94 Table 28: Community Map History 96 Table 29: Summary of Contracted Studies Included in this FIS Report 96 Table 30: Community Meetings 98 Table 31: Map Repositories 99 Table 32: Additional Information 100 Table 33: Bibliography and References 101 Volume 1 Exhibits Flood Profiles Blackwater River East Bay River Escambia River Pace Mill Creek Pond Creek Yellow River Panel P 08 P P P P P Published Separately Flood Insurance Rate Map (FIRM) iii
5 FLOOD INSURANCE STUDY REPORT SANTA ROSA COUNTY, FLORIDA SECTION 1.0 INTRODUCTION 1.1 The National Flood Insurance Program The National Flood Insurance Program (NFIP) is a voluntary Federal program that enables property owners in participating communities to purchase insurance protection against losses from flooding. This insurance is designed to provide an alternative to disaster assistance to meet the escalating costs of repairing damage to buildings and their contents caused by floods. For decades, the national response to flood disasters was generally limited to constructing floodcontrol works such as dams, levees, sea-walls, and the like, and providing disaster relief to flood victims. This approach did not reduce losses nor did it discourage unwise development. In some instances, it may have actually encouraged additional development. To compound the problem, the public generally could not buy flood coverage from insurance companies, and building techniques to reduce flood damage were often overlooked. In the face of mounting flood losses and escalating costs of disaster relief to the general taxpayers, the U.S. Congress created the NFIP. The intent was to reduce future flood damage through community floodplain management ordinances, and provide protection for property owners against potential losses through an insurance mechanism that requires a premium to be paid for the protection. The U.S. Congress established the NFIP on August 1, 1968, with the passage of the National Flood Insurance Act of The NFIP was broadened and modified with the passage of the Flood Disaster Protection Act of 1973 and other legislative measures. It was further modified by the National Flood Insurance Reform Act of 1994 and the Flood Insurance Reform Act of The NFIP is administered by the Federal Emergency Management Agency (FEMA), which is a component of the Department of Homeland Security (DHS). Participation in the NFIP is based on an agreement between local communities and the Federal Government. If a community adopts and enforces floodplain management regulations to reduce future flood risks to new construction and substantially improved structures in Special Flood Hazard Areas (SFHAs), the Federal Government will make flood insurance available within the community as a financial protection against flood losses. The community s floodplain management regulations must meet or exceed criteria established in accordance with Title 44 Code of Federal Regulations (CFR) Part 60.3, Criteria for Land Management and Use. SFHAs are delineated on the community s Flood Insurance Rate Maps (FIRMs). Under the NFIP, buildings that were built before the flood hazard was identified on the community s FIRMs are generally referred to as Pre-FIRM buildings. When the NFIP was created, the U.S. Congress recognized that insurance for Pre-FIRM buildings would be prohibitively expensive if the premiums were not subsidized by the Federal Government. Congress also recognized that most of these floodprone buildings were built by individuals who did not have sufficient knowledge of the flood hazard to make informed decisions. The NFIP requires that full actuarial rates reflecting the complete flood risk be charged on all buildings constructed or substantially improved on or after 1
6 the effective date of the initial FIRM for the community or after December 31, 1974, whichever is later. These buildings are generally referred to as Post-FIRM buildings. 1.2 Purpose of this Flood Insurance Study Report This Flood Insurance Study (FIS) Report revises and updates information on the existence and severity of flood hazards for the study area. The studies described in this report developed flood hazard data that will be used to establish actuarial flood insurance rates and to assist communities in efforts to implement sound floodplain management. In some states or communities, floodplain management criteria or regulations may exist that are more restrictive than the minimum Federal requirements. Contact your State NFIP Coordinator to ensure that any higher State standards are included in the community s regulations. 1.3 Jurisdictions Included in the Flood Insurance Study Project This FIS Report covers the entire geographic area of Santa Rosa County, Florida. The jurisdictions that are included in this project area, along with the Community Identification Number (CID) for each community and the 8-digit Hydrologic Unit Codes (HUC-8) sub-basins affecting each, are shown in Table 1. The Flood Insurance Rate Map (FIRM) panel numbers that affect each community are listed. If the flood hazard data for the community is not included in this FIS Report, the location of that data is identified. The location of flood hazard data for participating communities in multiple jurisdictions is also indicated in the table. Jurisdictions that have no identified SFHAs as of the effective date of this study are indicated in the table. Changed conditions in these communities (such as urbanization or annexation) or the availability of new scientific or technical data about flood hazards could make it necessary to determine SFHAs in these jurisdictions in the future. Community CID Table 1: Listing of NFIP Jurisdictions HUC-8 Sub- Basin(s) Located on FIRM Panel(s) If Not Included, Location of Flood Hazard Data Gulf Breeze, City of C0518H C0538H 12113C0606H 12113C0608H 12113C0519H 12113C0602H 12113C0607H 12113C0626H Jay, Town of C0035H 2
7 Community CID Table 1: Listing of NFIP Jurisdictions HUC-8 Sub- Basin(s) Milton, City of Located on FIRM Panel(s) 12113C0314G C0427H 12113C0435H 12113C0320H 12113C0431H If Not Included, Location of Flood Hazard Data Santa Rosa County, Unincorporated Areas C0010G 12113C0030H 12113C0040G 12113C0055H 12113C0065H 12113C0080H 12113C0090G 12113C0105H 12113C0115G 12113C0130G 12113C0140G 12113C0155H 12113C0165H 12113C0180H 12113C0190H 12113C0205H 12113C0215H 12113C0230G 12113C0240G 12113C0255G 12113C0270H 12113C0285H 12113C0291G C0293H 12113C0305H 12113C0311H 12113C0313H 12113C0320H 12113C0335H 12113C0355H 12113C0360H 12113C0370H 12113C0405H 12113C0408H 12113C0415H 12113C0020G 12113C0035H 12113C0045H 12113C0060H 12113C0070H 12113C0085H 12113C0095G 12113C0110H 12113C0120G 12113C0135G 12113C0145G 12113C0160H 12113C0170H 12113C0185H 12113C0195H 12113C0210G 12113C0220G 12113C0235H 12113C0245H 12113C0260G 12113C0280G 12113C0290H 12113C0292H 12113C0294H 12113C0310H 12113C0312G C0314G C0330H 12113C0340H 12113C0345H 12113C0365H 12113C0385H 12113C0406H 12113C0410H 3
8 Community Santa Rosa County, Unincorporated Areas CID Table 1: Listing of NFIP Jurisdictions HUC-8 Sub- Basin(s) Located on FIRM Panel(s) 12113C0426H 12113C0428G C0431H 12113C0440H 12113C0455H 12113C0465H 12113C0480H 12113C0490H 12113C0510G C0514G C0518H C0526H 12113C0528H 12113C0531H 12113C0533G C0536H C0538H 12113C0541G C0543H 12113C0551H 12113C0553G C0558H 12113C0561H 12113C0563H 12113C0568H 12113C0570H 12113C0585H 12113C0587H 12113C0589H 12113C0593H 12113C0602H 12113C0604H C0420H 12113C0427H 12113C0429G C0435H 12113C0445H 12113C0460H 12113C0470H 12113C0485H 12113C0495H 12113C0513G C0517G C0519H 12113C0527H 12113C0529H 12113C0532H 12113C0534G C0537H 12113C0539H 12113C0542H 12113C0544H 12113C0552H 12113C0554H 12113C0560H 12113C0562H 12113C0564H 12113C0569H 12113C0580H 12113C0586H 12113C0588H 12113C0591H 12113C0601G C0603G C0606H 12113C0608H 12113C0627H 12113C0632G C0656H 12113C0607H 12113C0626H 12113C0631G C0651G C0657H If Not Included, Location of Flood Hazard Data 1 Panel Not Printed 4
9 1.4 Considerations for using this Flood Insurance Study Report The NFIP encourages State and local governments to implement sound floodplain management programs. To assist in this endeavor, each FIS Report provides floodplain data, which may include a combination of the following: 10-, 4-, 2-, 1-, and 0.2-percent annual chance flood elevations (the 1% annual chance flood elevation is also referred to as the Base Flood Elevation (BFE)); delineations of the 1% annual chance and 0.2% annual chance floodplains; and 1% annual chance floodway. This information is presented on the FIRM and/or in many components of the FIS Report, including Flood Profiles, Floodway Data tables, Summary of Non-Coastal Stillwater Elevations tables, and Coastal Transect Parameters tables (not all components may be provided for a specific FIS). This section presents important considerations for using the information contained in this FIS Report and the FIRM, including changes in format and content. Figures 1, 2, and 3 present information that applies to using the FIRM with the FIS Report. Part or all of this FIS Report may be revised and republished at any time. In addition, part of this FIS Report may be revised by a Letter of Map Revision (LOMR), which does not involve republication or redistribution of the FIS Report. Refer to Section 6.5 of this FIS Report for information about the process to revise the FIS Report and/or FIRM. It is, therefore, the responsibility of the user to consult with community officials by contacting the community repository to obtain the most current FIS Report components. Communities participating in the NFIP have established repositories of flood hazard data for floodplain management and flood insurance purposes. Community map repository addresses are provided in Table 31, Map Repositories, within this FIS Report. New FIS Reports are frequently developed for multiple communities, such as entire counties. A countywide FIS Report incorporates previous FIS Reports for individual communities and the unincorporated area of the county (if not jurisdictional) into a single document and supersedes those documents for the purposes of the NFIP. The initial Countywide FIS Report for Santa Rosa County became effective on December 19, Refer to Table 28 for information about subsequent revisions to the FIRMs. FEMA does not impose floodplain management requirements or special insurance ratings based on Limit of Moderate Wave Action (LiMWA) delineations at this time. The LiMWA represents the approximate landward limit of the 1.5-foot breaking wave. If the LiMWA is shown on the FIRM, it is being provided by FEMA as information only. For communities that do adopt Zone VE building standards in the area defined by the LiMWA, additional Community Rating System (CRS) credits are available. Refer to Section for additional information about the LiMWA. The CRS is a voluntary incentive program that recognizes and encourages community floodplain management activities that exceed the minimum NFIP requirements. Visit the FEMA Web site at 5
10 system or contact your appropriate FEMA Regional Office for more information about this program. Previous FIS Reports and FIRMs may have included levees that were accredited as reducing the risk associated with the 1% annual chance flood based on the information available and the mapping standards of the NFIP at that time. For FEMA to continue to accredit the identified levees, the levees must meet the criteria of the Code of Federal Regulations, Title 44, Section (44 CFR 65.10), titled Mapping of Areas Protected by Levee Systems. Since the status of levees is subject to change at any time, the user should contact the appropriate agency for the latest information regarding levees presented in Table 9 of this FIS Report. For levees owned or operated by the U.S. Army Corps of Engineers (USACE), information may be obtained from the USACE National Levee Database (nld.usace.army.mil). For all other levees, the user is encouraged to contact the appropriate local community. FEMA has developed a Guide to Flood Maps (FEMA 258) and online tutorials to assist users in accessing the information contained on the FIRM. These include how to read panels and step-by-step instructions to obtain specific information. To obtain this guide and other assistance in using the FIRM, visit the FEMA Web site at The FIRM Index in Figure 1 shows the overall FIRM panel layout within Santa Rosa County, and also displays the panel number and effective date for each FIRM panel in the county. Other information shown on the FIRM Index includes community boundaries, flooding sources, watershed boundaries, and United States Geological Survey (USGS) Hydrologic Unit Code 8 (HUC-8) codes. 6
11 Figure 1: FIRM Panel Index 0130G 12/19/2006 Escambia River 0010G 12/19/ G 12/19/ G 12/19/2006 Mcdavid Creek 0155H 0030H «4 TOWN OF JAY G 0040G 0065H 12/19/ /19/ H 0070H 0090G 12/19/ G 12/19/ G 12/19/2006 Moore Creek HUC LOWER CONECUH WATERSHED 0160H 0035H Cobb Branch «89 Malloy Branch West Fork Big Coldwater Creek 0180H 0055H Juniper Creek Manning Creek 0060H Wolfe Creek 0185H Dixon Creek 0080H Long Branch 0205H Turkey Creek 0085H 0210G 12/19/ H 0230G 12/19/2006 Ready Creek Sweetwater Creek 0110H 0235H 0140G 12/19/ G 12/19/ G 12/19/ H Danley Branch 0145G 12/19/2006 HUC ESCAMBIA WATERSHED Dead River Thomas Creek Crooked Creek 0165H 0280G 12/19/2006 Buffalo Mill Creek White River Sevenmile Creek 0290H 0291G** 12/19/ H 0285H 0170H 0292H Pond Creek 0294H 0190H 0311H 0313H 0305H 0312G** 12/19/ G** 12/19/2006 «87 Clear Creek « H 0310H 0320H CITY OF MILTON H 0215H 0330H 0220G 12/19/2006 HUC BLACKWATER WATERSHED Big Coldwater Creek Pittman Creek SANTA ROSA COUNTY H Blackwater River 90 Big Juniper Creek 0345H Alligator Creek 0240G 12/19/ H 0365H 10 Ates Creek 0245H 0360H 0370H 0385H 0405H 0415H Simpson River 0406H 0426H 0427H 0431H 0408H Pace Mill Creek 0420H 0410H 0428G** 12/19/2006 Mulatto Bayou 0440H « G** 12/19/ H HUC PENSACOLA BAY WATERSHED 0445H Blackwater Bay 0455H «87 Weaver River 0460H Weaver Creek Yellow River Boiling Creek 0470H 0465H 0480H Bear Creek 0490H Wolf Creek 0485H HUC YELLOW WATERSHED 0495H 0510G* 12/19/ H Escambia Bay 0528H 0527H 0529H 0531H 0533G* 12/19/ H East Bay 0534G* 12/19/ H 0553G* 12/19/ H 0554H 0560H 0558H Dean Creek 0580H Panther Creek 0585H East Bay River 0513G* 12/19/ G* 12/19/2006 Pensacola Bay 0517G* 12/19/ G* 0536H* 0537H 12/19/ H 0561H 0538H 0518H* 0519H 0539H 0563H 0588H 0589H 0543H 0544H 0564H 0568H 0569H G* 12/19/ G* 0632G* 0606H 0626H 0627H 12/19/ H 0607H 12/19/2006 Santa Rosa Sound 0651G* 12/19/ H 0656H 0570H 0657H 0586H 0587H 0591H 0593H Gulf Of Mexico ESCAMBIA COUNTY (AREA NOT INCLUDED) 0603G* 12/19/ H* 0608H CITY OF GULF BREEZE in = 4 miles Miles COUNTY LOCATOR NATIONAL FLOOD INSURANCE PROGRAM FLOOD INSURANCE RATE MAP INDEX Map Projection: Florida State Plane North Zone (FIPS Zone 0903); North American Datum 1983 HARN THE INFORMATION DEPICTED ON THIS MAP AND SUPPORTING DOCUMENTATION ARE ALSO AVAILABLE IN DIGITAL FORMAT AT SEE FLOOD INSURANCE STUDY FOR ADDITIONAL INFORMATION *PANEL NOT PRINTED - OPEN WATER AREA **PANEL NOT PRINTED - NO SPECIAL FLOOD HAZARD AREAS 7 SANTA ROSA COUNTY, FLORIDA PANELS PRINTED: 0010, 0020, 0030, 0035, 0040, 0045, 0055, 0060, 0065, 0070, 0080, 0085, 0090, 0095, 0105, 0110, 0115, 0120, 0130, 0135, 0140, 0145, 0155, 0160, 0165, 0170, 0180, 0185, 0190, 0195,0205, 0210, 0215, 0220, 0230, 0235, 0240, 0245, 0255, 0260, 0270, 0280, 0285, 0290, 0292, 0293, 0294, 0305, 0310, 0311, 0313, 0320, 0330, 0335, 0340, 0345, 0355, 0360, 0365, 0370, 0385, 0405, 0406, 0408, 0410, 0415, 0420, 0426, 0427, 0431, 0435, 0440, 0445, 0455, 0460, 0465, 0470, 0480, 0485, 0490, 0495, 0519, 0526, 0527, 0528, 0529, 0531, 0532, 0537, 0538, 0539, 0542, 0543, 0544, 0551, 0552, 0554, 0558, 0560, 0561, 0562, 0563, 0564, 0568, 0569, 0570, 0580, 0585, 0586, 0587, 0588, 0589, 0591, 0593, 0602, 0606, 0607, 0608, 0626, 0627, 0656, 0657 and Incorporated Areas PRELIMINARY JULY 18, 2016 FEMA MAP NUMBER 12113CIND0B MAP REVISED
12 Each FIRM panel may contain specific notes to the user that provide additional information regarding the flood hazard data shown on that map. However, the FIRM panel does not contain enough space to show all the notes that may be relevant in helping to better understand the information on the panel. Figure 2 contains the full list of these notes. Figure 2: FIRM Notes to Users NOTES TO USERS For information and questions about this map, available products associated with this FIRM including historic versions of this FIRM, how to order products, or the National Flood Insurance Program in general, please call the FEMA Map Information exchange at FEMA-MAP ( ) or visit the FEMA Flood Map Service Center website at msc.fema.gov. Available products may include previously issued Letters of Map Change, a Flood Insurance Study Report, and/or digital versions of this map. Many of these products can be ordered or obtained directly from the website. Users may determine the current map date for each FIRM panel by visiting the FEMA Flood Map Service Center website or by calling the FEMA Map Information exchange. Communities annexing land on adjacent FIRM panels must obtain a current copy of the adjacent panel as well as the current FIRM Index. These may be ordered directly from the Flood Map Service Center at the number listed above. For community and countywide map dates, refer to Table 28 in this FIS Report. To determine if flood insurance is available in the community, contact your insurance agent or call the National Flood Insurance Program at PRELIMINARY FIS REPORT: FEMA maintains information about map features, such as street locations and names, in or near designated flood hazard areas. Requests to revise information in or near designated flood hazard areas may be provided to FEMA during the community review period, at the final Consultation Coordination Officer's meeting, or during the statutory 90-day appeal period. Approved requests for changes will be shown on the final printed FIRM. The map is for use in administering the NFIP. It may not identify all areas subject to flooding, particularly from local drainage sources of small size. Consult the community map repository to find updated or additional flood hazard information. BASE FLOOD ELEVATIONS: For more detailed information in areas where Base Flood Elevations (BFEs) and/or floodways have been determined, consult the Flood Profiles and Floodway Data and/or Summary of Non-Coastal Stillwater Elevations tables within this FIS Report. Use the flood elevation data within the FIS Report in conjunction with the FIRM for construction and/or floodplain management. Coastal Base Flood Elevations shown on the map apply only landward of 0.0' North American Vertical Datum of 1988 (NAVD88). Coastal flood elevations are also provided in the Coastal Transect Parameters table in the FIS Report for this jurisdiction. Elevations shown in the Coastal Transect Parameters table should be used for construction and/or floodplain management purposes when they are higher than the elevations shown on the FIRM. 8
13 Figure 2: FIRM Notes to Users FLOODWAY INFORMATION: Boundaries of the floodways were computed at cross sections and interpolated between cross sections. The floodways were based on hydraulic considerations with regard to requirements of the National Flood Insurance Program. Floodway widths and other pertinent floodway data are provided in the FIS Report for this jurisdiction. FLOOD CONTROL STRUCTURE INFORMATION: Certain areas not in Special Flood Hazard Areas may be protected by flood control structures. Refer to Section 4.3 "Non-Levee Flood Protection Measures" of this FIS Report for information on flood control structures for this jurisdiction. PROJECTION INFORMATION: The projection used in the preparation of the map was Florida State Plane North Zone (FIPS Zone 0903), North American Datum of 1983 (NAD83). The horizontal datum was NAD83. Differences in datum, spheroid, projection or State Plane zones used in the production of FIRMs for adjacent jurisdictions may result in slight positional differences in map features across jurisdiction boundaries. These differences do not affect the accuracy of the FIRM. ELEVATION DATUM: Flood elevations on the FIRM are referenced to the North American Vertical Datum of These flood elevations must be compared to structure and ground elevations referenced to the same vertical datum. For information regarding conversion between the National Geodetic Vertical Datum of 1929 and the North American Vertical Datum of 1988, visit the National Geodetic Survey website at or contact the National Geodetic Survey at the following address: NGS Information Services NOAA, N/NGS12 National Geodetic Survey SSMC-3, # East-West Highway Silver Spring, Maryland (301) Local vertical monuments may have been used to create the map. To obtain current monument information, please contact the appropriate local community listed in Table 31 of this FIS Report. BASE MAP INFORMATION: Base map information shown on the FIRM was provided by Florida Department of Transportation (FDOT). This information was derived from digital orthophotography at a 0.9 foot resolution from photography dated For information about base maps, refer to Section 6.2 Base Map in this FIS Report. The map reflects more detailed and up-to-date stream channel configurations than those shown on the previous FIRM for this jurisdiction. The floodplains and floodways that were transferred from the previous FIRM may have been adjusted to conform to these new stream channel configurations. As a result, the Flood Profiles and Floodway Data tables may reflect stream channel distances that differ from what is shown on the map. Corporate limits shown on the map are based on the best data available at the time of publication. Because changes due to annexations or de-annexations may have occurred after the map was published, map users should contact appropriate community officials to verify current corporate limit locations. 9
14 Figure 2: FIRM Notes to Users NOTES FOR FIRM INDEX REVISIONS TO INDEX: As new studies are performed and FIRM panels are updated within Santa Rosa County, FL, corresponding revisions to the FIRM Index will be incorporated within the FIS Report to reflect the effective dates of those panels. Please refer to Table 28 of this FIS Report to determine the most recent FIRM revision date for each community. The most recent FIRM panel effective date will correspond to the most recent index date. SPECIAL NOTES FOR SPECIFIC FIRM PANELS This Notes to Users section was created specifically for Santa Rosa County, FL, effective TBD. COASTAL BARRIER RESOURCES SYSTEM (CBRS): This map includes approximate boundaries of the CBRS for informational purposes only. Flood insurance is not available within CBRS areas for structures that are newly built or substantially improved on or after the date(s) indicated on the map. For more information see the FIS Report, or call the U.S. Fish and Wildlife Service Customer Service Center at WILD. LIMIT OF MODERATE WAVE ACTION: Zone AE has been divided by a Limit of Moderate Wave Action (LiMWA). The LiMWA represents the approximate landward limit of the 1.5-foot breaking wave. The effects of wave hazards between Zone VE and the LiMWA (or between the shoreline and the LiMWA for areas where Zone VE is not identified) will be similar to, but less severe than, those in Zone VE. FLOOD RISK REPORT: A Flood Risk Report (FRR) may be available for many of the flooding sources and communities referenced in this FIS Report. The FRR is provided to increase public awareness of flood risk by helping communities identify the areas within their jurisdictions that have the greatest risks. Although non-regulatory, the information provided within the FRR can assist communities in assessing and evaluating mitigation opportunities to reduce these risks. It can also be used by communities developing or updating flood risk mitigation plans. These plans allow communities to identify and evaluate opportunities to reduce potential loss of life and property. However, the FRR is not intended to be the final authoritative source of all flood risk data for a project area; rather, it should be used with other data sources to paint a comprehensive picture of flood risk. 10
15 Each FIRM panel contains an abbreviated legend for the features shown on the maps. However, the FIRM panel does not contain enough space to show the legend for all map features. Figure 3 shows the full legend of all map features. Note that not all of these features may appear on the FIRM panels in Santa Rosa County. Figure 3: Map Legend for FIRM SPECIAL FLOOD HAZARD AREAS: The 1% annual chance flood, also known as the base flood or 100-year flood, has a 1% chance of happening or being exceeded each year. Special Flood Hazard Areas are subject to flooding by the 1% annual chance flood. The Base Flood Elevation is the water surface elevation of the 1% annual chance flood. The floodway is the channel of a stream plus any adjacent floodplain areas that must be kept free of encroachment so that the 1% annual chance flood can be carried without substantial increases in flood heights. See note for specific types. If the floodway is too narrow to be shown, a note is shown. Zone A Zone AE Zone AH Special Flood Hazard Areas subject to inundation by the 1% annual chance flood (Zones A, AE, AH, AO, AR, A99, V and VE) The flood insurance rate zone that corresponds to the 1% annual chance floodplains. No base (1% annual chance) flood elevations (BFEs) or depths are shown within this zone. The flood insurance rate zone that corresponds to the 1% annual chance floodplains. Base flood elevations derived from the hydraulic analyses are shown within this zone. The flood insurance rate zone that corresponds to the areas of 1% annual chance shallow flooding (usually areas of ponding) where average depths are between 1 and 3 feet. Whole-foot BFEs derived from the hydraulic analyses are shown at selected intervals within this zone. Zone AO The flood insurance rate zone that corresponds to the areas of 1% annual chance shallow flooding (usually sheet flow on sloping terrain) where average depths are between 1 and 3 feet. Average whole-foot depths derived from the hydraulic analyses are shown within this zone. Zone AR The flood insurance rate zone that corresponds to areas that were formerly protected from the 1% annual chance flood by a flood control system that was subsequently decertified. Zone AR indicates that the former flood control system is being restored to provide protection from the 1% annual chance or greater flood. Zone A99 The flood insurance rate zone that corresponds to areas of the 1% annual chance floodplain that will be protected by a Federal flood protection system where construction has reached specified statutory milestones. No base flood elevations or flood depths are shown within this zone. Zone V The flood insurance rate zone that corresponds to the 1% annual chance coastal floodplains that have additional hazards associated with storm waves. Base flood elevations are not shown within this zone. Zone VE Zone VE is the flood insurance rate zone that corresponds to the 1% annual chance coastal floodplains that have additional hazards associated with storm waves. Base flood elevations derived from the coastal analyses are shown within this zone as static whole-foot elevations that apply throughout the zone. 11
16 Figure 3: Map Legend for FIRM Regulatory Floodway determined in Zone AE. FLOOD INSURANCE IS NOT AVAILABLE FOR STRUCTURES NEWLY BUILT OR SUBSTANTIALLY IMPROVED ON OR AFTER APRIL 8, 1987, IN THE DESIGNATED COLORADO RIVER FLOODWAY OTHER AREAS OF FLOOD HAZARD OTHER AREAS NO SCREEN FLOOD HAZARD AND OTHER BOUNDARY LINES Non-encroachment zone (see Section 2.4 of this FIS Report for more information) The Colorado River Floodway was established by Congress in the Colorado River Floodway Protection Act of 1986, Public Law (100 Statute 1129). The Act imposes certain restrictions within the Floodway. Shaded Zone X: Areas of 0.2% annual chance flood hazards and areas of 1% annual chance flood hazards with average depths of less than 1 foot or with drainage areas less than 1 square mile. Future Conditions 1% Flood Hazard Zone X: The flood insurance rate zone that corresponds to the 1% annual chance floodplains that are determined based on future-conditions hydrology. No base flood elevations or flood depths are shown within this zone. Area with Reduced Flood Risk due to Levee: Areas where an accredited levee, dike, or other flood control structure has reduced the flood risk from the 1% annual chance flood. See Notes to Users for important information. Zone D (Areas of Undetermined Flood Hazard): The flood insurance rate zone that corresponds to unstudied areas where flood hazards are undetermined, but possible. Unshaded Zone X: Areas of minimal flood hazard. (ortho) (vector) Flood Zone Boundary (white line on ortho-photography-based mapping; gray line on vector-based mapping) Limit of Study Jurisdiction Boundary Limit of Moderate Wave Action (LiMWA): Indicates the inland limit of the area affected by waves greater than 1.5 feet 12
17 Figure 3: Map Legend for FIRM GENERAL STRUCTURES Aqueduct Channel Culvert Storm Sewer Dam Jetty Weir Channel, Culvert, Aqueduct, or Storm Sewer Dam, Jetty, Weir Levee, Dike, or Floodwall Bridge Bridge COASTAL BARRIER RESOURCES SYSTEM (CBRS) AND OTHERWISE PROTECTED AREAS (OPA): CBRS areas and OPAs are normally located within or adjacent to Special Flood Hazard Areas. See Notes to Users for important information. CBRS AREA 09/30/2009 Coastal Barrier Resources System Area: Labels are shown to clarify where this area shares a boundary with an incorporated area or overlaps with the floodway. OTHERWISE PROTECTED AREA 09/30/2009 Otherwise Protected Area REFERENCE MARKERS River mile Markers CROSS SECTION & TRANSECT INFORMATION Lettered Cross Section with Regulatory Water Surface Elevation (BFE) Numbered Cross Section with Regulatory Water Surface Elevation (BFE) Unlettered Cross Section with Regulatory Water Surface Elevation (BFE) Coastal Transect 13
18 Figure 3: Map Legend for FIRM Profile Baseline: Indicates the modeled flow path of a stream and is shown on FIRM panels for all valid studies with profiles or otherwise established base flood elevation. Coastal Transect Baseline: Used in the coastal flood hazard model to represent the 0.0-foot elevation contour and the starting point for the transect and the measuring point for the coastal mapping. Base Flood Elevation Line ZONE AE (EL 16) ZONE AO (DEPTH 2) ZONE AO (DEPTH 2) (VEL 15 FPS) BASE MAP FEATURES Missouri Creek Static Base Flood Elevation value (shown under zone label) Zone designation with Depth Zone designation with Depth and Velocity River, Stream or Other Hydrographic Feature Interstate Highway U.S. Highway State Highway County Highway MAPLE LANE Street, Road, Avenue Name, or Private Drive if shown on Flood Profile RAILROAD Railroad Horizontal Reference Grid Line Horizontal Reference Grid Ticks Secondary Grid Crosshairs Land Grant Name of Land Grant 7 Section Number R. 43 W. T. 22 N. Range, Township Number m E Horizontal Reference Grid Coordinates (UTM) FT Horizontal Reference Grid Coordinates (State Plane) Corner Coordinates (Latitude, Longitude) 14
19 SECTION 2.0 FLOODPLAIN MANAGEMENT APPLICATIONS 2.1 Floodplain Boundaries To provide a national standard without regional discrimination, the 1% annual chance (100-year) flood has been adopted by FEMA as the base flood for floodplain management purposes. The 0.2% annual chance (500-year) flood is employed to indicate additional areas of flood hazard in the community. Each flooding source included in the project scope has been studied and mapped using professional engineering and mapping methodologies that were agreed upon by FEMA and Santa Rosa County as appropriate to the risk level. Flood risk is evaluated based on factors such as known flood hazards and projected impact on the built environment. Engineering analyses were performed for each studied flooding source to calculate its 1% annual chance flood elevations; elevations corresponding to other floods (e.g. 10-, 4-, 2-, 0.2-percent annual chance, etc.) may have also been computed for certain flooding sources. Engineering models and methods are described in detail in Section 5.0 of this FIS Report. The modeled elevations at cross sections were used to delineate the floodplain boundaries on the FIRM; between cross sections, the boundaries were interpolated using elevation data from various sources. More information on specific mapping methods is provided in Section 6.0 of this FIS Report. Depending on the accuracy of available topographic data (Table 23), study methodologies employed (Section 5.0), and flood risk, certain flooding sources may be mapped to show both the 1% and 0.2% annual chance floodplain boundaries, regulatory water surface elevations (BFEs), and/or a regulatory floodway. Similarly, other flooding sources may be mapped to show only the 1% annual chance floodplain boundary on the FIRM, without published water surface elevations. In cases where the 1% and 0.2% annual chance floodplain boundaries are close together, only the 1% annual chance floodplain boundary is shown on the FIRM. Figure 3, Map Legend for FIRM, describes the flood zones that are used on the FIRMs to account for the varying levels of flood risk that exist along flooding sources within the project area. Table 2 and Table 3 indicate the flood zone designations for each flooding source and each community within Santa Rosa County, FL, respectively. Table 2, Flooding Sources Included in this FIS Report, lists each flooding source, including its study limits, affected communities, mapped zone on the FIRM, and the completion date of its engineering analysis from which the flood elevations on the FIRM and in the FIS Report were derived. Descriptions and dates for the latest hydrologic and hydraulic analyses of the flooding sources are shown in Table 13. Floodplain boundaries for these flooding sources are shown on the FIRM (published separately) using the symbology described in Figure 3. On the map, the 1% annual chance floodplain corresponds to the SFHAs. The 0.2% annual chance floodplain shows areas that, although out of the regulatory floodplain, are still subject to flood hazards. Small areas within the floodplain boundaries may lie above the flood elevations but cannot be shown due to limitations of the map scale and/or lack of detailed topographic data. The procedures to remove these areas from the SFHA are described in Section 6.5 of this FIS Report. 15
20 Table 2: Flooding Sources Included in this FIS Report Flooding Source Beale Creek Big Coldwater Creek Blackwater Bay Blackwater River Bray Mill Creek Clear Creek East Bay East Bay River East Fork Big Coldwater Creek Escambia Bay Community Santa Rosa County, Unincorporated Areas Santa Rosa County, Unincorporated Areas Santa Rosa County, Unincorporated Areas City of Milton, Santa Rosa County, Unincorporated Areas Santa Rosa County, Unincorporated Areas, Town of Jay Santa Rosa County, Unincorporated Areas Santa Rosa County, Unincorporated Areas Santa Rosa County, Unincorporated Areas Santa Rosa County, Unincorporated Areas Santa Rosa County, Unincorporated Areas Downstream Limit At confluence with White River At confluence with White River Upstream Limit Approximately 800 feet southwest of Curtis Road Approximately 800 feet southwest of Curtis Road Entire Coastline Entire Coastline At County Boundary At confluence with Escambia River At confluence with Blackwater River At Interstate 10 At Town of Jay Boundary Approximately 1,400 feet southeast of Forrest Hills Rd HUC-8 Sub- Basin(s) Length (mi) (streams or coastlines) Area (mi 2 ) (estuaries or ponding) Floodway (Y/N) Zone shown on FIRM Date of Analysis N AE N A, AE N AE, VE Y AE, VE N A N A, AE 2012 Entire Coastline Entire Coastline N AE, VE 2015 At confluence with East Bay At confluence with Big Coldwater Creek and West Fork Big Coldwater Creek At County Boundary Y AE, VE 2012 Approximately 0.5 miles east of Gordon Land Rd N AE 2012 Entire Coastline Entire Coastline N AE, VE
21 Table 2: Flooding Sources Included in this FIS Report Flooding Source Escambia River Gulf of Mexico Jacobs Creek Juniper Creek Long Branch Malloy Branch Manning Creek Pace Mill Creek Pensacola Bay Community Santa Rosa County, Unincorporated Areas Santa Rosa County, Unincorporated Areas Santa Rosa County, Unincorporated Areas Santa Rosa County, Unincorporated Areas Santa Rosa County, Unincorporated Areas Santa Rosa County, Unincorporated Areas Santa Rosa County, Unincorporated Areas Santa Rosa County, Unincorporated Areas City of Gulf Breeze, Santa Rosa County, Unincorporated Areas Downstream Limit At US 10 Upstream Limit At Florida/Alabama state line HUC-8 Sub- Basin(s) Length (mi) (streams or coastlines) Area (mi 2 ) (estuaries or ponding) Floodway (Y/N) Zone shown on FIRM Date of Analysis 58.4 Y A, AE, VE 2005 Entire Coastline Entire Coastline N AE, VE 2015 At confluence with Pace Mill Creek At confluence with West Fork Big Coldwater Creek At confluence with Pond Creek At confluence with West Fork Big Coldwater Creek At confluence with West Fork Big Coldwater Creek At confluence with Escambia Bay At Becky Ln N AE 2012 At confluence with West Fork Big Coldwater Creek N A, AE 2012 At Long Branch Pond N A, AE 2012 At Town of Jay Boundary N A 2012 At Van Jernigan Road N A, AE 2012 At Chumuckla Hwy Y AE 2005 Entire Coastline Entire Coastline N AE, VE
22 Table 2: Flooding Sources Included in this FIS Report Flooding Source Community City of Milton, Santa Pond Creek Rosa County, Unincorporated Areas Reader Creek Rocky Creek Santa Rosa Sound Unnamed Tributary to Beale Creek Unnamed Tributary to Bray Mill Creek Unnamed Tributary to Escambia River West Fork Big Coldwater Creek Yellow River Santa Rosa County, Unincorporated Areas Santa Rosa County, Unincorporated Areas City of Gulf Breeze, Santa Rosa County, Unincorporated Areas Santa Rosa County, Unincorporated Areas Santa Rosa County, Unincorporated Areas Santa Rosa County, Unincorporated Areas Santa Rosa County, Unincorporated Areas Santa Rosa County, Unincorporated Areas Downstream Limit At confluence with Blackwater River At confluence with Pond Creek At Confluence with Escambia River Upstream Limit Approximately 1,700 feet north of Forty Acre Pond HUC-8 Sub- Basin(s) Length (mi) (streams or coastlines) Area (mi 2 ) (estuaries or ponding) Floodway (Y/N) Zone shown on FIRM Date of Analysis Y AE 2005 At Fairway Dr N AE 2012 At Rowe Trl N AE 2012 Entire Coastline Entire Coastline N AE, VE 2015 At confluence with Escambia River At confluence with Bray Mill Creek At confluence with Big Coldwater Creek and East Fork Big Coldwater Creek Approximately 300 feet north of Highway 4 Approximately 3,000 feet north of Highway 4 Approximately 1,300 feet southwest of County Mill Rd N AE N A N A 2012 At confluence with Blackwater County Boundary N A, AE 2012 Bay At confluence with Escambia River Approximately 300 feet north of Highway Y AE, VE
23 2.2 Floodways Encroachment on floodplains, such as structures and fill, reduces flood-carrying capacity, increases flood heights and velocities, and increases flood hazards in areas beyond the encroachment itself. One aspect of floodplain management involves balancing the economic gain from floodplain development against the resulting increase in flood hazard. For purposes of the NFIP, a floodway is used as a tool to assist local communities in balancing floodplain development against increasing flood hazard. With this approach, the area of the 1% annual chance floodplain on a river is divided into a floodway and a floodway fringe based on hydraulic modeling. The floodway is the channel of a stream, plus any adjacent floodplain areas, that must be kept free of encroachment in order to carry the 1% annual chance flood. The floodway fringe is the area between the floodway and the 1% annual chance floodplain boundaries where encroachment is permitted. The floodway must be wide enough so that the floodway fringe could be completely obstructed without increasing the water surface elevation of the 1% annual chance flood more than 1 foot at any point. Typical relationships between the floodway and the floodway fringe and their significance to floodplain development are shown in Figure 4. To participate in the NFIP, Federal regulations require communities to limit increases caused by encroachment to 1.0 foot, provided that hazardous velocities are not produced. The floodways in this project are presented to local agencies as minimum standards that can be adopted directly or that can be used as a basis for additional floodway projects. Figure 4: Floodway Schematic 19
24 Floodway widths presented in this FIS Report and on the FIRM were computed at cross sections. Between cross sections, the floodway boundaries were interpolated. For certain stream segments, floodways were adjusted so that the amount of floodwaters conveyed on each side of the floodplain would be reduced equally. The results of the floodway computations have been tabulated for selected cross sections and are shown in Table 24, Floodway Data. All floodways that were developed for this Flood Risk Project are shown on the FIRM using the symbology described in Figure 3. In cases where the floodway and l% annual chance floodplain boundaries are either close together or collinear, only the floodway boundary has been shown on the FIRM. For information about the delineation of floodways on the FIRM, refer to Section Base Flood Elevations The hydraulic characteristics of flooding sources were analyzed to provide estimates of the elevations of floods of the selected recurrence intervals. The Base Flood Elevation (BFE) is the elevation of the 1% annual chance flood. These BFEs are most commonly rounded to the whole foot, as shown on the FIRM, but in certain circumstances or locations they may be rounded to 0.1 foot. Cross section lines shown on the FIRM may also be labeled with the BFE rounded to 0.1 foot. Whole-foot BFEs derived from engineering analyses that apply to coastal areas, areas of ponding, or other static areas with little elevation change may also be shown at selected intervals on the FIRM. Cross sections with BFEs shown on the FIRM correspond to the cross sections shown in the Floodway Data table and Flood Profiles in this FIS Report. BFEs are primarily intended for flood insurance rating purposes. For construction and/or floodplain management purposes, users are cautioned to use the flood elevation data presented in this FIS Report in conjunction with the data shown on the FIRM. 2.4 Non-Encroachment Zones Some States and communities use non-encroachment zones to manage floodplain development. For flooding sources with medium flood risk, field surveys are often not collected and surveyed bridge and culvert geometry is not developed. Standard hydrologic and hydraulic analyses are still performed to determine BFEs in these areas. However, floodways are not typically determined, since specific channel profiles are not developed. To assist communities with managing floodplain development in these areas, a non-encroachment zone may be provided. While not a FEMA designated floodway, the non-encroachment zone represents that area around the stream that should be reserved to convey the 1% annual chance flood event. As with a floodway, all surcharges must fall within the acceptable range in the non-encroachment zone. General setbacks can be used in areas of lower risk (e.g. unnumbered Zone A), but these are not considered sufficient where unnumbered Zone A is replaced by Zone AE. The NFIP requires communities to ensure that any development in a non-encroachment area causes no increase in BFEs. Communities must generally prohibit development within the area defined by the nonencroachment width to meet the NFIP requirement. Non-encroachment determinations may be delineated where it is not possible to delineate floodways because specific channel profiles with bridge and culvert geometry were not developed. Any non-encroachment determinations for this Flood Risk Project have been tabulated for selected cross sections and are shown in Table 25, Flood Hazard and Non-Encroachment 20
25 Data for Selected Streams. Areas for which non-encroachment zones are provided show BFEs and the 1% annual chance floodplain boundaries mapped as zone AE on the FIRM but no floodways. 2.5 Coastal Flood Hazard Areas For most areas along rivers, streams, and small lakes, BFEs and floodplain boundaries are based on the amount of water expected to enter the area during a 1% annual chance flood and the geometry of the floodplain. Floods in these areas are typically caused by storm events. However, for areas on or near ocean coasts, large rivers, or large bodies of water, BFE and floodplain boundaries may need to be based on additional components, including storm surges and waves. Communities on or near ocean coasts face flood hazards caused by offshore seismic events as well as storm events. Coastal flooding sources that are included in this Flood Risk Project are shown in Table Water Elevations and the Effects of Waves Specific terminology is used in coastal analyses to indicate which components have been included in evaluating flood hazards. The stillwater elevation (SWEL or still water level) is the surface of the water resulting from astronomical tides, storm surge, and freshwater inputs, but excluding wave setup contribution or the effects of waves. Astronomical tides are periodic rises and falls in large bodies of water caused by the rotation of the earth and by the gravitational forces exerted by the earth, moon and sun. Storm surge is the additional water depth that occurs during large storm events. These events can bring air pressure changes and strong winds that force water up against the shore. Freshwater inputs include rainfall that falls directly on the body of water, runoff from surfaces and overland flow, and inputs from rivers. The 1% annual chance stillwater elevation is the stillwater elevation that has been calculated for a storm surge from a 1% annual chance storm. The 1% annual chance storm surge can be determined from analyses of tidal gage records, statistical study of regional historical storms, or other modeling approaches. Stillwater elevations for storms of other frequencies can be developed using similar approaches. The total stillwater elevation (also referred to as the mean water level) is the stillwater elevation plus wave setup contribution but excluding the effects of waves. Wave setup is the increase in stillwater elevation at the shoreline caused by the reduction of waves in shallow water. It occurs as breaking wave momentum is transferred to the water column. Like the stillwater elevation, the total stillwater elevation is based on a storm of a particular frequency, such as the 1% annual chance storm. Wave setup is typically estimated using standard engineering practices or calculated using models, since tidal gages are often sited in areas sheltered from wave action and do not capture this information. 21
26 Coastal analyses may examine the effects of overland waves by analyzing storm-induced erosion, overland wave propagation, wave runup, and/or wave overtopping. Storm-induced erosion is the modification of existing topography by erosion caused by a specific storm event, as opposed to general erosion that occurs at a more constant rate. Overland wave propagation describes the combined effects of variation in ground elevation, vegetation, and physical features on wave characteristics as waves move onshore. Wave runup is the uprush of water from wave action on a shore barrier. It is a function of the roughness and geometry of the shoreline at the point where the stillwater elevation intersects the land. Wave overtopping refers to wave runup that occurs when waves pass over the crest of a barrier. Figure 5: Wave Runup Transect Schematic Floodplain Boundaries and BFEs for Coastal Areas For coastal communities along the Atlantic and Pacific Oceans, the Gulf of Mexico, the Great Lakes, and the Caribbean Sea, flood hazards must take into account how storm surges, waves, and extreme tides interact with factors such as topography and vegetation. Storm surge and waves must also be considered in assessing flood risk for certain communities on rivers or large inland bodies of water. Beyond areas that are affected by waves and tides, coastal communities can also have riverine floodplains with designated floodways, as described in previous sections. Floodplain Boundaries In many coastal areas, storm surge is the principle component of flooding. The extent of the 1% annual chance floodplain in these areas is derived from the total stillwater elevation (stillwater elevation including storm surge plus wave setup) for the 1% annual chance storm. The methods that were used for calculation of total stillwater elevations for coastal areas are described in Section 5.3 of this FIS Report. Location of total stillwater elevations for coastal areas are shown in Figure 8, 1% Total Stillwater Levels for Coastal Areas. 22
27 In some areas, the 1% annual chance floodplain is determined based on the limit of wave runup or wave overtopping for the 1% annual chance storm surge. The methods that were used for calculation of wave hazards are described in Section 5.3 of this FIS Report. Table 26 presents the types of coastal analyses that were used in mapping the 1% annual chance floodplain in coastal areas. Coastal BFEs Coastal BFEs are calculated as the total stillwater elevation (stillwater elevation including storm surge plus wave setup) for the 1% annual chance storm plus the additional flood hazard from overland wave effects (storm-induced erosion, overland wave propagation, wave runup and wave overtopping). Where they apply, coastal BFEs are calculated along transects extending from offshore to the limit of coastal flooding onshore. Results of these analyses are accurate until local topography, vegetation, or development type and density within the community undergoes major changes. Parameters that were included in calculating coastal BFEs for each transect included in this FIS Report are presented in Table 17, Coastal Transect Parameters. The locations of transects are shown in Figure 9, Transect Location Map. More detailed information about the methods used in coastal analyses and the results of intermediate steps in the coastal analyses are presented in Section 5.3 of this FIS Report. Additional information on specific mapping methods is provided in Section 6.4 of this FIS Report Coastal High Hazard Areas Certain areas along the open coast and other areas may have higher risk of experiencing structural damage caused by wave action and/or high-velocity water during the 1% annual chance flood. These areas will be identified on the FIRM as Coastal High Hazard Areas. Coastal High Hazard Area (CHHA) is a SFHA extending from offshore to the inland limit of the primary frontal dune (PFD) or any other area subject to damages caused by wave action and/or high-velocity water during the 1% annual chance flood. Primary Frontal Dune (PFD) is a continuous or nearly continuous mound or ridge of sand with relatively steep slopes immediately landward and adjacent to the beach. The PFD is subject to erosion and overtopping from high tides and waves during major coastal storms. CHHAs are designated as V zones (for velocity wave zones ) and are subject to more stringent regulatory requirements and a different flood insurance rate structure. The areas of greatest risk are shown as VE on the FIRM. Zone VE is further subdivided into elevation zones and shown with BFEs on the FIRM. The landward limit of the PFD occurs at a point where there is a distinct change from a relatively steep slope to a relatively mild slope; this point represents the landward extension of Zone VE. Areas of lower risk in the CHHA are designated with Zone V on the FIRM. More detailed information about the identification and designation of Zone VE is presented in Section 6.4 of this FIS Report. 23
28 Areas that are not within the CHHA but are SFHAs may still be impacted by coastal flooding and damaging waves; these areas are shown as A zones on the FIRM. Figure 6, Coastal Transect Schematic, illustrates the relationship between the base flood elevation, the 1% annual chance stillwater elevation, and the ground profile as well as the location of the Zone VE and Zone AE areas in an area without a PFD subject to overland wave propagation. This figure also illustrates energy dissipation and regeneration of a wave as it moves inland. Figure 6: Coastal Transect Schematic Methods used in coastal analyses in this Flood Risk Project are presented in Section 5.3 and mapping methods are provided in Section 6.4 of this FIS Report. Coastal floodplains are shown on the FIRM using the symbology described in Figure 3, Map Legend for FIRM. In many cases, the BFE on the FIRM is higher than the stillwater elevations shown in Table 17 due to the presence of wave effects. The higher elevation should be used for construction and/or floodplain management purposes Limit of Moderate Wave Action Laboratory tests and field investigations have shown that wave heights as little as 1.5 feet can cause damage to and failure of typical Zone AE building construction. Wood-frame, light gage steel, or masonry walls on shallow footings or slabs are subject to damage when exposed to waves less than 3 feet in height. Other flood hazards associated with coastal waves (floating debris, high velocity flow, erosion, and scour) can also damage Zone AE construction. Therefore, a LiMWA boundary may be shown on the FIRM as an informational layer to assist coastal communities in safe rebuilding practices. The LiMWA represents the approximate landward limit of the 1.5-foot breaking wave. The location of the LiMWA relative to Zone VE and Zone AE is shown in Figure 6. The effects of wave hazards in Zone AE between Zone VE (or the shoreline where Zone VE is not identified) and the limit of the LiMWA boundary are similar to, but less severe than, those in 24
29 Zone VE where 3-foot or greater breaking waves are projected to occur during the 1% annual chance flooding event. Communities are therefore encouraged to adopt and enforce more stringent floodplain management requirements than the minimum NFIP requirements in the LiMWA. The NFIP Community Rating System provides credits for these actions. Where wave runup elevations dominate over wave heights, there is no evidence to date of significant damage to residential structures by runup depths less than 3 feet. Examples of these areas include areas with steeply sloped beaches, bluffs, or flood protection structures that lie parallel to the shore. In these areas, the FIRM shows the LiMWA immediately landward of the VE/AE boundary. Similarly, in areas where the zone VE designation is based on the presence of a primary frontal dune or wave overtopping, the LiMWA is delineated immediately landward of the Zone VE/AE boundary. SECTION 3.0 INSURANCE APPLICATIONS 3.1 National Flood Insurance Program Insurance Zones For flood insurance applications, the FIRM designates flood insurance rate zones as described in Figure 3, Map Legend for FIRM. Flood insurance zone designations are assigned to flooding sources based on the results of the hydraulic or coastal analyses. Insurance agents use the zones shown on the FIRM and depths and base flood elevations in this FIS Report in conjunction with information on structures and their contents to assign premium rates for flood insurance policies. The 1% annual chance floodplain boundary corresponds to the boundary of the areas of special flood hazards (e.g. Zones A, AE, V, VE, etc.), and the 0.2% annual chance floodplain boundary corresponds to the boundary of areas of additional flood hazards. Table 3 lists the flood insurance zones in Santa Rosa County. Table 3: Flood Zone Designations by Community Community Gulf Breeze, City of Jay, Town of Milton, City of Santa Rosa County, Unincorporated Areas Flood Zone(s) A, AE, VE, AO, X A, X AE, X A, AE, VE, X 3.2 Coastal Barrier Resources System The Coastal Barrier Resources Act (CBRA) of 1982 was established by Congress to create areas along the Atlantic and Gulf coasts and the Great Lakes, where restrictions for Federal financial assistance including flood insurance are prohibited. In 1990, Congress passed the Coastal Barrier Improvement Act (CBIA), which increased the extent of areas established by the CBRA and added Otherwise Protected Areas (OPA) to the system. These areas are collectively referred to as the John. H Chafee Coastal Barrier Resources System (CBRS). The CBRS boundaries that have been identified in the project area are in Table 4, Coastal Barrier Resource System Information. 25
30 Table 4: Coastal Barrier Resources System Information Primary Flooding Source CBRS/OPA Type Date CBRS Area Established FIRM Panel Number(s) East Bay CBRS 2/24/1997 East Bay CBRS 11/16/1990 Escambia Bay CBRS 11/16/ C0527H 12113C0529H 12113C0531H 12113C0533G C0554H 12113C0558H 12113C0528H 12113C0529H 12113C0533G C0536H C0537H 12113C0554H 12113C0558H 12113C0526H 12113C0527H Gulf of Mexico CBRS 11/16/ C0588H 12113C0514G C0518H 1 Pensacola Bay CBRS 11/16/ C0528H 12113C0529H 12113C0602H 12113C0606H Pensacola Bay OPA 11/16/1991 Santa Rosa Sound OPA 11/16/ C0519H 12113C0538H 12113C0606H 12113C0607H 12113C0608H 12113C0607H 12113C0626H Santa Rosa Sound CBRS 11/16/ C0588H 1 Panel Not Printed 26
31 SECTION 4.0 AREA STUDIED 4.1 Basin Description Table 5 contains a description of the characteristics of the HUC-8 sub-basins within which each community falls. The table includes the main flooding sources within each basin, a brief description of the basin, and its drainage area. HUC-8 Sub- Basin Name Blackwater Watershed Escambia Watershed Lower Conecuh Watershed Pensacola Bay Watershed Yellow Watershed HUC-8 Sub- Basin Number Table 5: Basin Characteristics Primary Flooding Source Blackwater River Escambia River Escambia River Pensacola Bay, Gulf of Mexico and Santa Rosa Sound Yellow River Description of Affected Area The Blackwater River is approximately 68 miles in length with a drainage area of approximately 865 square miles. Escambia Watershed drains from Alabama south ultimately discharging into Escambia Bay. The Lower Conecuh watershed is predominantly within Alabama with only approximately 12 square miles in Florida. The Pensacola Bay watershed includes numerous contributing creeks and streams. The Yellow River is a 92-mile long river of which 61 miles occur in Florida s Okaloosa, Santa Rosa and Walton Counties. The Yellow River flows in a southwesterly direction into the Blackwater Bay. Drainage Area (square miles) , , Principal Flood Problems Table 6 contains a description of the principal flood problems that have been noted for Santa Rosa County by flooding source. 27
32 Table 6: Principal Flood Problems Flooding Source Blackwater River Description of Flood Problems Flooding in the Blackwater River Basin is caused by stream overbank flow and hurricane storm surges, and sometimes a combination of both. Riverine flooding occurs frequently and is prevalent throughout the reach of the river where the riverbanks are low and the floodplain is wide. The flat slopes and wide, heavily vegetated floodplains aggravate the flood problem by preventing the rapid drainage of floodwaters. At flood stage, the Blackwater River covers large areas, flooding forest land, farmland, fishing resorts, and other businesses built on the floodplain. Coastal Areas The coastal areas of Santa Rosa County are subject to widespread flooding resulting from storm surges that accompany hurricanes and other severe storms from one or more of the following flooding sources: the Gulf of Mexico, East Bay, Escambia Bay, Pensacola Bay, Blackwater Bay, and Santa Rosa Sound. Present conclusions about recurrent coastal flood elevations rely heavily on historical evidence from the continuous tidal records identified in Table 5. Areas near the beach may be subject to wave action and high velocity surges that can cause erosion and property damage. All Sources Some of the worst floods to occur in northwestern Florida were caused by high intensity rainfall during hurricanes. The time of concentration of runoff for large basin rivers in northwestern Florida may be several days; consequently, peak flows do not, as a rule, coincide with hurricane tides at the coast. The smaller streams, however, have a shorter period of concentration of runoff and flood flow occurring concurrently with storm surge is more likely. This greatly increases the likelihood of inundation of low-lying areas along the coast. Maximum rainfall ordinarily occurs in the eastern half of the storm system. As the storm passes inland its intensity decreases, but heavy rainfall continues. Total precipitation of 12 inches recorded at a single station during a hurricane is not uncommon, and in northwestern Florida, rainfall has been as high as 24 inches for the duration of the storm. Table 7 contains information about historic flood elevations in the communities within Santa Rosa County. Table 7: Historic Flooding Elevations (Not Applicable to this Flood Risk Project) 4.3 Non-Levee Flood Protection Measures Table 8 contains information about non-levee flood protection measures within Santa Rosa County such as dams, jetties, and or dikes. Levees are addressed in Section 4.4 of this FIS Report. 28
33 Flooding Source Albert Gordon Pond Table 8: Non-Levee Flood Protection Measures Structure Name Type of Measure Location N/A Dam Outfall of pond N/A Bear Creek Bear Lake Dam Dam Outfall of Beak Lake N/A N/A N/A Dam Jacobs Creek N/A Dam Reader Creek N/A Dam Rocky Creek Braden Ball Dam #1 Approximately 500 southeast of intersection with Steeplehead Rd and Alligator Creek Approximately 240 feet north of Riverview Ct. Approximately 280 feet east of Par Lane N/A N/A N/A Dam At Abel Avenue N/A Description of Measure 4.4 Levees This section is not applicable to this Flood Risk Project. Table 9: Levees (Not Applicable to this Flood Risk Project) SECTION 5.0 ENGINEERING METHODS For the flooding sources in the community, standard hydrologic and hydraulic study methods were used to determine the flood hazard data required for this study. Flood events of a magnitude that are expected to be equaled or exceeded at least once on the average during any 10-, 25-, 50-, 100-, or 500-year period (recurrence interval) have been selected as having special significance for floodplain management and for flood insurance rates. These events, commonly termed the 10-, 25-, 50-, 100-, and 500-year floods, have a 10-, 4-, 2-, 1-, and 0.2% annual chance, respectively, of being equaled or exceeded during any year. Although the recurrence interval represents the long-term, average period between floods of a specific magnitude, rare floods could occur at short intervals or even within the same year. The risk of experiencing a rare flood increases when periods greater than 1 year are considered. For example, the risk of having a flood that equals or exceeds the 100-year flood (1-percent chance of annual exceedance) during the term of a 30-year mortgage is approximately 26 percent (about 3 in 10); for any 90-year period, the risk increases to approximately 60 percent (6 in 10). The analyses reported herein reflect flooding potentials based on conditions existing in the community at the time of completion of this study. Maps and flood elevations will be amended periodically to reflect future changes. 29
34 In addition to these flood events, the 1-percent-plus, or 1%+, annual chance flood elevation has been modeled and included on the flood profile for certain flooding sources in this FIS Report. While not used for regulatory or insurance purposes, this flood event has been calculated to help illustrate the variability range that exists between the regulatory 1% annual chance flood elevation and a 1% annual chance elevation that has taken into account an additional amount of uncertainty in the flood discharges (thus, the 1% plus ). For flooding sources whose discharges were estimated using regression equations, the 1%+ flood elevations are derived by taking the 1% annual chance flood discharges and increasing the modeled discharges by a percentage equal to the average predictive error for the regression equation. For flooding sources with gage- or rainfall-runoff-based discharge estimates, the upper 84-percent confidence limit of the discharges is used to compute the 1%+ flood elevations. 5.1 Hydrologic Analyses Hydrologic analyses were carried out to establish the peak elevation-frequency relationships for floods of the selected recurrence intervals for each flooding source studied. Hydrologic analyses are typically performed at the watershed level. Depending on factors such as watershed size and shape, land use and urbanization, and natural or man-made storage, various models or methodologies may be applied. A summary of the hydrologic methods applied to develop the discharges used in the hydraulic analyses for each stream is provided in Table 13. Greater detail (including assumptions, analysis, and results) is available in the archived project documentation. A summary of the discharges is provided in Table 10. Frequency Discharge-Drainage Area Curves used to develop the hydrologic models may also be shown in Figure 7 for selected flooding sources. A summary of stillwater elevations developed for non-coastal flooding sources is provided in Table 11. (Coastal stillwater elevations are discussed in Section 5.3 and shown in Table 17.) Stream gage information is provided in Table
35 Table 10: Summary of Discharges Flooding Source Beale Creek Big Coldwater Creek Blackwater River Clear Creek Location At confluence with Escambia River Approximately 500 feet north of Tunnel Road Approximately 500 feet south of Dunridge Drive Approximately 1 mile northwest of confluence with Earnest Mill Creek Drainage Area (Square Miles) 10% 4% Peak Discharge (cfs) 2% 1% Existing 1% Future 0.2% * 1,208 1,483 * 2, * * 1, * * ,945 * 18,098 22,484 * 35,304 At confluence with East Fork and West Fork Big Coldwater Creek ,577 * 17,399 21,601 * 33,872 Approximately 1 mile northeast of U.S ,900 * 69,900 89,900 * 152,900 Highway 90 At Deaton Bridge Road ,777 * 40,897 53,552 * 93,589 At County Boundary ,900 * 69,900 89,900 * 152,900 Approximately 1,500 feet northeast of Old West Lane ,844 * 3,209 3,914 * 5,910 31
36 Table 10: Summary of Discharges Flooding Source East Bay River East Fork Big Coldwater Creek Escambia River Location Approximately 1,200 feet east of Highway 87 Drainage Area (Square Miles) 10% 4% Peak Discharge (cfs) 2% 1% Existing 1% Future 0.2% ,600 * 2,764 3,362 * 5,045 At Clear Creek Road 8.4 1,046 * 1,799 2,184 * 3,264 Approximately 1,500 feet southeast of Forest Hills Lane Approximately 0.5 mile upstream of the confluence with Panther Creek Approximately 0.5 mile north of Springhill Road At confluence with Wolt Creek Approximately 1,000 feet northeast of Horseshoe Loop Road Just upstream of U.S. Route * 1,319 1,616 * 2, ,069 * 8,563 10,385 * 15, ,096 * 11,349 14,215 * 22, ,039 * 11,358 14,281 * 22, ,707 * 10,813 13,634 * 22,030 4,084 83,665 * 163, ,605 * 356,680 At State Route 184 4,147 82,153 * 134, ,087 * 237,286 At State Route 4 3,817 76,322 * 121, ,039 * 208,946 32
37 Table 10: Summary of Discharges Flooding Source Jacobs Creek Juniper Creek Manning Creek Pace Mill Creek Location Approximately 900 feet north of confluence with Pace Mill Creek Approximately 100 feet north of Riverview Court Approximately 250 feet west of Becky Lane Approximately 0.5 mile southeast of Dupree Road Approximately 2,000 feet south of County Mill Road Approximately 1,500 feet south of Highway 87 Approximately 0.5 mile northeast of Highway 87 Drainage Area (Square Miles) 10% 4% Peak Discharge (cfs) 2% 1% Existing 1% Future 0.2% * * * * * * ,914 * 3,434 4,238 * 6, ,537 * 2,797 3,468 * 5, ,305 * 2,210 2,666 * 3, ,241 * 2,099 2,532 * 3,736 At Van Jerigan Road ,123 * 1,884 2,265 * 3,321 Approximately 2,000 feet downstream of U.S. Route ,838 * 3,540 4,091 * 5,881 33
38 Table 10: Summary of Discharges Flooding Source Pond Creek Reader Creek Rocky Creek Location Drainage Area (Square Miles) 10% 4% Peak Discharge (cfs) 2% 1% Existing 1% Future 0.2% At Willard Norris Road ,500 * 8,155 10,109 * 15,781 Approximately 400 feet west of Oser Road Approximately 900 feet northeast of confluence with Three Hollow Creek Approximately 450 feet east of Wendt Farm Road Approximately 2,000 feet north of Forty Acre Pond Approximately 1,000 feet southwest of Martin Road Approximately 100 feet northwest of Fairway Drive Approximately 400 feet south of Pattock Place Approximately 370 feet south of Abel Avenue ,919 * 7,049 8,712 * 13, ,050 * 5,401 6,634 * 10, ,776 * 3,102 3,788 * 5, * 1,546 1,891 * 2, ,437 * 2,646 3,296 * 5, ,069 * 1,946 2,414 * 3, * * * *
39 Table 10: Summary of Discharges Flooding Source Unnamed Tributary to Beale Creek West Fork Big Coldwater Creek Yellow River Location Approximately 150 feet south of Rowe Trail At Confluence with Beale Creek Approximately 400 feet south of Twin Creek Circle Approximately 1,000 feet from confluence with East Fork Bigh Coldwater Creek At confluence with Juniper Creek At confluence with Blackwater Bay Approximately 1.2 miles southeast of County Boundary *Not calculated for this Flood Risk Project Drainage Area (Square Miles) 10% 4% Peak Discharge (cfs) 2% 1% Existing 1% Future 0.2% * * * * 1, * * ,921 * 10,503 12,916 * 19, ,129 * 7,333 9,020 * 13,866 1,344 33,600 * 65,550 84,240 * 143,350 1,246 31,450 * 61,230 78,790 * 134,080 35
40 Figure 7: Frequency Discharge-Drainage Area Curves (Not Applicable to this Flood Risk Project) Table 11: Summary of Non-Coastal Stillwater Elevations Elevations (feet NAVD88) Flooding Source Location 10% 4% 2% 1% 0.2% B0020N At Ponding Area 139 * * * B0060N At Ponding Area 67 * * * B0080N At Ponding Area 160 * * * B0100N At Ponding Area 71 * * * B0130N At Ponding Area 172 * * * B0180N At Ponding Area 170 * * * B0240N At Ponding Area 70 * * * B0245N At Ponding Area 173 * * * B1040N At Ponding Area 5 * * * I0020N At Ponding Area 1 * * * I0040N At Ponding Area 151 * * * I0080N At Ponding Area 150 * * * I0100N At Ponding Area 149 * * * I0110N At Ponding Area 29 * * *
41 Table 11: Summary of Non-Coastal Stillwater Elevations Elevations (feet NAVD88) Flooding Source Location 10% 4% 2% 1% 0.2% I0115N At Ponding Area 12 * * * I0120N At Ponding Area 31 * * * I0130N At Ponding Area 95 * * * I0150N At Ponding Area 99 * * * I0170N At Ponding Area 76 * * * I0210N At Ponding Area 107 * * * I0230N At Ponding Area 83 * * * I0250N At Ponding Area 82 * * * I0270N At Ponding Area 84 * * * I0290N At Ponding Area 128 * * * I0330N At Ponding Area 50 * * * I0340N At Ponding Area 54 * * * I0342PN At Ponding Area 24 * * * I0350N At Ponding Area 57 * * * I0370N At Ponding Area 26 * * * I0420N At Ponding Area 53 * * *
42 Table 11: Summary of Non-Coastal Stillwater Elevations Elevations (feet NAVD88) Flooding Source Location 10% 4% 2% 1% 0.2% I0460N At Ponding Area 102 * * * I0480N At Ponding Area 104 * * * I0500N At Ponding Area 109 * * * I0520N At Ponding Area 115 * * * I0540N At Ponding Area 118 * * * I0590N At Ponding Area 80 * * * I0610N At Ponding Area 119 * * * I0640N At Ponding Area 75 * * * I0660N At Ponding Area 168 * * * I0670N At Ponding Area 108 * * * I0700N At Ponding Area 120 * * * I0740N At Ponding Area 78 * * * I0760N At Ponding Area 85 * * * I0780N At Ponding Area 87 * * * I0800N At Ponding Area 129 * * * I0820N At Ponding Area 46 * * *
43 Table 11: Summary of Non-Coastal Stillwater Elevations Elevations (feet NAVD88) Flooding Source Location 10% 4% 2% 1% 0.2% I0840N At Ponding Area 21 * * * I0870N At Ponding Area 88 * * * I0875N At Ponding Area 165 * * * I0940N At Ponding Area 123 * * * I1030N At Ponding Area 72 * * * I1050N At Ponding Area 98 * * * I1070N At Ponding Area 39 * * * I3000N At Ponding Area 56 * * * I3001N At Ponding Area 114 * * * I3002N At Ponding Area 106 * * * I3003N At Ponding Area 55 * * * I3004N At Ponding Area 163 * * * I3005N At Ponding Area 164 * * * I3010N At Ponding Area 92 * * * I3040N At Ponding Area 130 * * * I3060N At Ponding Area 25 * * *
44 Table 11: Summary of Non-Coastal Stillwater Elevations Elevations (feet NAVD88) Flooding Source Location 10% 4% 2% 1% 0.2% I3070N At Ponding Area 135 * * * I3090N At Ponding Area 52 * * * I3130N At Ponding Area 134 * * * I3200N At Ponding Area 133 * * * I4020N At Ponding Area 51 * * * I4040N At Ponding Area 59 * * * I4080N At Ponding Area 58 * * * I4140N At Ponding Area 136 * * * I5020N At Ponding Area 86 * * * I5050N At Ponding Area 127 * * * I8030N At Ponding Area 79 * * * I9000N At Ponding Area 111 * * * I9002N At Ponding Area 126 * * * I9003N At Ponding Area 132 * * * I9004N At Ponding Area 162 * * * I9005N At Ponding Area 110 * * *
45 Table 11: Summary of Non-Coastal Stillwater Elevations Elevations (feet NAVD88) Flooding Source Location 10% 4% 2% 1% 0.2% I9006N At Ponding Area 117 * * * I9007N At Ponding Area 161 * * * J0015N At Ponding Area 13 * * * J0020N At Ponding Area 33 * * * J0040N At Ponding Area 36 * * * J0050N At Ponding Area 105 * * * J0080N At Ponding Area 174 * * * J0110N At Ponding Area 113 * * * J0130N At Ponding Area 116 * * * J0150N At Ponding Area 122 * * * J0170N At Ponding Area 89 * * * J0190N At Ponding Area 23 * * * J0210N At Ponding Area 90 * * * J0230N At Ponding Area 91 * * * J0260N At Ponding Area 131 * * * J0270N At Ponding Area 49 * * *
46 Table 11: Summary of Non-Coastal Stillwater Elevations Elevations (feet NAVD88) Flooding Source Location 10% 4% 2% 1% 0.2% J0340N At Ponding Area 37 * * * J0380N At Ponding Area 101 * * * J0400N At Ponding Area 18 * * * J0410N At Ponding Area 42 * * * J0450N At Ponding Area 81 * * * J0460N At Ponding Area 125 * * * J0470N At Ponding Area 22 * * * J0490N At Ponding Area 48 * * * J0570N At Ponding Area 44 * * * J0580N At Ponding Area 45 * * * J0590N At Ponding Area 156 * * * J0600N At Ponding Area 155 * * * J0630N At Ponding Area 19 * * * J0660N At Ponding Area 20 * * * J0700N At Ponding Area 41 * * * J0750N At Ponding Area 43 * * *
47 Table 11: Summary of Non-Coastal Stillwater Elevations Elevations (feet NAVD88) Flooding Source Location 10% 4% 2% 1% 0.2% J0760N At Ponding Area 121 * * * J0765N At Ponding Area 152 * * * J0790N At Ponding Area 47 * * * J0800N At Ponding Area 153 * * * J0810N At Ponding Area 154 * * * J0850N At Ponding Area 124 * * * J0870N At Ponding Area 171 * * * J5030N At Ponding Area 40 * * * J5130PN At Ponding Area 35 * * * J5220N At Ponding Area 158 * * * J5230N At Ponding Area 157 * * * J5330N At Ponding Area 63 * * * J8000N At Ponding Area 9 * * * J8001N At Ponding Area 15 * * * J8002N At Ponding Area 137 * * * K0030N At Ponding Area 93 * * *
48 Table 11: Summary of Non-Coastal Stillwater Elevations Elevations (feet NAVD88) Flooding Source Location 10% 4% 2% 1% 0.2% K0050N At Ponding Area 68 * * * K0060N At Ponding Area 166 * * * K0070N At Ponding Area 32 * * * K0090N At Ponding Area 97 * * * K0110N At Ponding Area 77 * * * K0170N At Ponding Area 167 * * * K0180N At Ponding Area 38 * * * K0200N At Ponding Area 73 * * * K0220N At Ponding Area 17 * * * K1040N At Ponding Area 103 * * * K2030N At Ponding Area 112 * * * K3030N At Ponding Area 94 * * * K3050N At Ponding Area 96 * * * K3070N At Ponding Area 74 * * * K3090N At Ponding Area 100 * * * K4000N At Ponding Area 16 * * *
49 Table 11: Summary of Non-Coastal Stillwater Elevations Elevations (feet NAVD88) Flooding Source Location 10% 4% 2% 1% 0.2% L0062PN At Ponding Area 6 * * * L0064PN At Ponding Area 7 * * * L2010PN At Ponding Area 2 * * * L3000N At Ponding Area 27 * * * M0010N At Ponding Area 142 * * * M0030N At Ponding Area 61 * * * M0035N At Ponding Area 66 * * * M0040PN At Ponding Area 11 * * * M0050N At Ponding Area 28 * * * M0070N At Ponding Area 14 * * * M0090N At Ponding Area 30 * * * M0100N At Ponding Area 69 * * * M0110N At Ponding Area 159 * * * M0130N At Ponding Area 4 * * * M0135N At Ponding Area 169 * * * M0140PN At Ponding Area 3 * * *
50 Table 11: Summary of Non-Coastal Stillwater Elevations Elevations (feet NAVD88) Flooding Source Location 10% 4% 2% 1% 0.2% M1050PN At Ponding Area 8 * * * M1052PN At Ponding Area 10 * * * M2020N At Ponding Area 141 * * * M2020PN At Ponding Area 140 * * * M4000N At Ponding Area 34 * * * *Not calculated for this Flood Risk Project 46
51 Table 12: Stream Gage Information used to Determine Discharges (Not Applicable to this Flood Risk Project) 5.2 Hydraulic Analyses Analyses of the hydraulic characteristics of flooding from the sources studied were carried out to provide estimates of the elevations of floods of the selected recurrence intervals. Base flood elevations on the FIRM represent the elevations shown on the Flood Profiles and in the Floodway Data tables in the FIS Report. Rounded whole-foot elevations may be shown on the FIRM in coastal areas, areas of ponding, and other areas with static base flood elevations. These wholefoot elevations may not exactly reflect the elevations derived from the hydraulic analyses. Flood elevations shown on the FIRM are primarily intended for flood insurance rating purposes. For construction and/or floodplain management purposes, users are cautioned to use the flood elevation data presented in this FIS Report in conjunction with the data shown on the FIRM. The hydraulic analyses for this FIS were based on unobstructed flow. The flood elevations shown on the profiles are thus considered valid only if hydraulic structures remain unobstructed, operate properly, and do not fail. For streams for which hydraulic analyses were based on cross sections, locations of selected cross sections are shown on the Flood Profiles (Exhibit 1). For stream segments for which a floodway was computed (Section 6.3), selected cross sections are also listed on Table 24, Floodway Data. A summary of the methods used in hydraulic analyses performed for this project is provided in Table 13. Roughness coefficients are provided in Table 14 Roughness coefficients are values representing the frictional resistance water experiences when passing overland or through a channel. They are used in the calculations to determine water surface elevations. Greater detail (including assumptions, analysis, and results) is available in the archived project documentation. 47
52 Table 13: Summary of Hydrologic and Hydraulic Analyses Flooding Source Study Limits Downstream Limit Study Limits Upstream Limit Hydrologic Model or Method Used Hydraulic Model or Method Used Date Analyses Completed Flood Zone on FIRM Special Considerations Beale Creek At confluence with White River Approximately 800 feet southwest of Curtis Road Regression Equations HEC-RAS AE Big Coldwater Creek At confluence with Blackwater River At confluence with East Fork Big Coldwater Creek and West Fork Big Coldwater Creek Regression Equations HEC-RAS A, AE Blackwater River At County Boundary At Interstate 10 Regression Equations HEC AE w/ Floodway, VE Bray Mill Creek At confluence with Escambia River At Town of Jay Boundary Regression Equations HEC-RAS A Clear Creek At confluence with Blackwater River Approximately 1,400 feet southeast of Forrest Hills Rd Regression Equations HEC-RAS A, AE East Bay River East Fork Big Coldwater Creek Escambia River At US 10 Holley By The Sea Jacobs Creek At confluence with East Bay At confluence with Big Coldwater Creek and West Fork Big Coldwater Creek At County Boundary Approximately 0.5 miles east of Gordon Land Rd. At Florida/Alabama state line Regression Equations Regression Equations Log Pearson Type III Frequency Analysis HEC-RAS HEC-RAS HEC AE w/ Floodway, VE 2012 AE A, AE w/ Floodway, VE Entire Watershed Entire Watershed ICPR v3.1 ICPR v A, AE At confluence with Pace Mill Creek At Becky Ln Regression Equations HEC-RAS AE 48
53 Table 13: Summary of Hydrologic and Hydraulic Analyses Flooding Source Juniper Creek Long Branch Malloy Branch Manning Creek Pace Mill Creek Pond Creek Reader Creek Study Limits Downstream Limit At confluence with West Fork Big Coldwater Creek At confluence with Pond Creek At confluence with West Fork Big Coldwater Creek At confluence with West Fork Big Coldwater Creek At confluence with Escambia Bay At confluence with Blackwater River At confluence with Pond Creek Study Limits Upstream Limit At confluence with West Fork Big Coldwater Creek At Long Branch Pond At Town of Jay Boundary At Van Jernigan Road Hydrologic Model or Method Used Regression Equations Regression Equations Regression Equations Regression Equations Hydraulic Model or Method Used HEC-RAS HEC-RAS HEC-RAS HEC-RAS Date Analyses Completed Flood Zone on FIRM 2012 A, AE 2012 A, AE 2012 A 2012 A, AE At Chumuckla Hwy HEC-HMS HEC AE w/ Floodway Approximately 1,700 feet north of Forty Acre Pond At Fairway Dr. HEC-HMS HEC AE w/ Floodway Regression Equations HEC-RAS AE Special Considerations Rocky Creek Unnamed Tributary to Beale Creek Unnamed Tributary to Bray Mill Creek Unnamed Tributary to Escambia River West Fork Big Coldwater Creek At Confluence with Escambia River At confluence with Beale Creek At confluence with Bray Mill Creek At confluence with Escambia River At confluence with Big Coldwater Creek and East Fork Big Coldwater Creek At Rowe Trl. Approximately 1,000 feet west of Cobblestone Rd Approximately 3,000 feet north of Highway 4 Approximately 300 feet north of Highway 4 Approximately 1,300 feet southwest of County Mill Rd Regression Equations Regression Equations Regression Equations Regression Equations Regression Equations HEC-RAS HEC-RAS HEC-RAS HEC-RAS HEC-RAS AE 2012 AE 2012 A 2012 A 2012 A, AE 49
54 Table 13: Summary of Hydrologic and Hydraulic Analyses Flooding Source Study Limits Downstream Limit Study Limits Upstream Limit Hydrologic Model or Method Used Hydraulic Model or Method Used Date Analyses Completed Flood Zone on FIRM Special Considerations Yellow River At confluence with Blackwater Bay County Boundary Regression Equations HEC AE w/ Floodway, VE 50
55 Table 14: Roughness Coefficients Flooding Source Channel n Overbank n Beale Creek Big Coldwater Creek Blackwater River Clear Creek East Bay River East Fork Big Coldwater Creek Escambia River Jacobs Creek Juniper Creek Long Branch Manning Creek Pace Mill Creek Pond Creek Reader Creek Rocky Creek Unnamed Tributary to Beale Creek West Fork Big Coldwater Creek Yellow River Coastal Analyses For the areas of Santa Rosa County that are impacted by coastal flooding processes, coastal flood hazard analyses were performed to provide estimates of coastal BFEs. Coastal BFEs reflect the increase in water levels during a flood event due to extreme tides and storm surge as well as overland wave effects. The following subsections provide summaries of how each coastal process was considered for this FIS Report. Greater detail (including assumptions, analysis, and results) is available in the archived project documentation. Table 15 summarizes the methods and/or models used for the coastal analyses. Refer to Section for descriptions of the terms used in this section. 51
56 Flooding Source Blackwater Bay East Bay Escambia Bay Gulf of Mexico Pensacola Bay Santa Rosa Sound Study Limits From Entire Shoreline Entire Shoreline Entire Shoreline Entire Shoreline Entire Shoreline Entire Shoreline Table 15: Summary of Coastal Analyses Study Limits To Entire Shoreline Entire Shoreline Entire Shoreline Entire Shoreline Entire Shoreline Entire Shoreline Hazard Evaluated Storm Surge, Wave Runup, Wave Height Analysis, Erosion Storm Surge, Wave Runup, Wave Height Analysis, Erosion Storm Surge, Wave Runup, Wave Height Analysis, Erosion Storm Surge, Wave Runup, Wave Height Analysis, Erosion Storm Surge, Wave Runup, Wave Height Analysis, Erosion Storm Surge, Wave Runup, Wave Height Analysis, Erosion Model or Method Used ADCIRC, CHAMP, TAW, CSHORE, Runup 2.0 ADCIRC, CHAMP, TAW, CSHORE, Runup 2.0 ADCIRC, CHAMP, TAW, CSHORE, Runup 2.0 ADCIRC, CHAMP, TAW, CSHORE, Runup 2.0 ADCIRC, CHAMP, TAW, CSHORE, Runup 2.0 ADCIRC, CHAMP, TAW, CSHORE, Runup 2.0 Date Analysis was Completed 04/01/ /01/ /01/ /01/ /01/ /01/ Total Stillwater Elevations The total stillwater elevations (stillwater including storm surge plus wave setup) for the 1% annual chance flood were determined for areas subject to coastal flooding. The models and methods that were used to determine storm surge and wave setup are listed in Table 15. The stillwater elevation that was used for each transect in coastal analyses is shown in Table 17, Coastal Transect Parameters. Figure 8 shows the total stillwater elevations for the 1% annual chance flood that was determined for this coastal analysis. 52

57 Figure 8: 1% Total Stillwater Elevations for Coastal Areas Astronomical Tide Astronomical tidal statistics were generated directly from local tidal constituents by sampling the predicted tide at random times throughout the tidal epoch. Storm Surge Statistics Storm surge is modeled based on characteristics of actual storms responsible for significant coastal flooding. The characteristics of these storms are typically determined by statistical study of the regional historical record of storms or by statistical study of tidal gages. Table 16: Tide Gage Analysis Specifics (Not Applicable to this Flood Risk Project) Combined Riverine and Tidal Effects This section is not applicable to this Flood Risk Project. 53
58 Wave Setup Analysis Wave setup was computed during the storm surge modeling through the methods and models listed in Table 15 and included in the frequency analysis for the determination of the total stillwater elevations. The oscillating component of wave setup, dynamic wave setup, was calculated for areas subject to wave runup hazards Waves The region wide storm surge modeling system includes the Advanced Circulation Model for Oceanic, Coastal and Estuarine Waters (ADCIRC) for simulation of 2-dimensional hydrodynamics. ADCIRC was loosely coupled to the unstructured numerical wave model Simulating Waves Nearshore (unswan) to calculate the contribution of waves to total storm surge (FEMA, 2010). The resulting model system is typically referred to as SWAN+ADCIRC. A seamless modeling grid was developed to support the storm surge modeling efforts. The modeling system validation consisted of a comprehensive tidal calibration followed by a validation using carefully reconstructed wind and pressure fields for five major flood events affecting the region: Hurricane Opal, Hurricane Georges, Hurricane Ivan, Hurricane Dennis and Hurricane Katrina Model skill was assessed by quantitative comparison of model output to wind, wave, and high water mark observations. The model was then used to re-create 295 synthetic hurricanes to create a synthetic water elevation record from which the 10-, 2-, 1-, and 0.2- percent annual chance of exceedance elevations were determined. Wave setup results in an increased water level at the shoreline due to the breaking of waves and transfer of momentum to the water column during hurricanes and severe storms. For the Florida Panhandle and Alabama surge study, wave setup was determined directly from the coupled wave and storm surge model. The total stillwater elevation with wave setup was then used for the erosion and overland wave modeling Coastal Erosion A single storm episode can cause extensive erosion in coastal areas. Storm-induced erosion was evaluated to determine the modification to existing topography that is expected to be associated with flooding events. Erosion was evaluated using the methods listed in Table 15. The postevent eroded profile was used for the subsequent transect-based onshore wave hazard analyses Wave Hazard Analyses Overland wave hazards were evaluated to determine the combined effects of ground elevation, vegetation, and physical features on overland wave propagation and wave runup. These analyses were performed at representative transects along all shorelines for which waves were expected to be present during the floods of the selected recurrence intervals. The results of these analyses were used to determine elevations for the 1% annual chance flood. Transect locations were chosen with consideration given to the physical land characteristics as well as development type and density so that they would closely represent conditions in their locality. Additional consideration was given to changes in the total stillwater elevation. Transects were spaced close together in areas of complex topography and dense development or where total stillwater elevations varied. In areas having more uniform characteristics, transects were spaced at larger intervals. Transects shown in Figure 9, Transect Location Map, are also 54
59 depicted on the FIRM. Table 17 provides the location, stillwater elevations, and starting wave conditions for each transect evaluated for overland wave hazards. In this table, starting indicates the parameter value at the beginning of the transect. Wave Height Analysis Wave height analyses were performed to determine wave heights and corresponding wave crest elevations for the areas inundated by coastal flooding and subject to overland wave propagation hazards. Refer to Figure 6 for a schematic of a coastal transect evaluated for overland wave propagation hazards. Wave heights and wave crest elevations were modeled using the methods and models listed in Table 15, Summary of Coastal Analyses. Wave Runup Analysis Wave runup analyses were performed to determine the height and extent of runup beyond the limit of stillwater inundation for the 1% annual chance flood. Wave runup is defined as the maximum vertical extent of wave uprush on a beach or structure. FEMA s 2007 Guidelines and Specifications require the 2-percent wave runup level be computed for the coastal feature being evaluated (cliff, coastal bluff, dune, or structure) (FEMA, February 2007). The 2-percent runup level is the highest 2 percent of wave runup affecting the shoreline during the 1-percent-annualchance flood event. Each transect defined within the study area was evaluated for the applicability of wave runup, and if necessary, the appropriate runup methodology was selected and applied to each transect. Runup elevations were then compared to results to determine the dominant process affecting BFEs and associated flood hazard levels. Based on wave runup rates, wave overtopping was computed following the FEMA 2007 Guidelines and Specifications. Wave runup elevations were modeled using the methods and models listed in Table
60 Table 17: Coastal Transect Parameters Starting Wave Conditions for the 1% Starting Stillwater Elevations (ft NAVD88) Range of Stillwater Elevations (ft NAVD88) Flood Source Coastal Transect Significant Wave Height H s (ft) Peak Wave Period T p (sec) 10% 4% 2% 1% 0.2% Gulf of Mexico * Gulf of Mexico * Escambia Bay * Escambia Bay *
61 Table 17: Coastal Transect Parameters Starting Wave Conditions for the 1% Starting Stillwater Elevations (ft NAVD88) Range of Stillwater Elevations (ft NAVD88) Flood Source Coastal Transect Significant Wave Height H s (ft) Peak Wave Period T p (sec) 10% 4% 2% 1% 0.2% Escambia Bay * Escambia Bay * Escambia Bay * Escambia Bay *
62 Table 17: Coastal Transect Parameters Starting Wave Conditions for the 1% Starting Stillwater Elevations (ft NAVD88) Range of Stillwater Elevations (ft NAVD88) Flood Source Coastal Transect Significant Wave Height H s (ft) Peak Wave Period T p (sec) 10% 4% 2% 1% 0.2% Escambia Bay * Escambia Bay * Escambia Bay * Escambia Bay *
63 Table 17: Coastal Transect Parameters Starting Wave Conditions for the 1% Starting Stillwater Elevations (ft NAVD88) Range of Stillwater Elevations (ft NAVD88) Flood Source Coastal Transect Significant Wave Height H s (ft) Peak Wave Period T p (sec) 10% 4% 2% 1% 0.2% East Bay * East Bay * Blackwater Bay * Blackwater Bay *
64 Table 17: Coastal Transect Parameters Starting Wave Conditions for the 1% Starting Stillwater Elevations (ft NAVD88) Range of Stillwater Elevations (ft NAVD88) Flood Source Coastal Transect Significant Wave Height H s (ft) Peak Wave Period T p (sec) 10% 4% 2% 1% 0.2% Blackwater Bay * Blackwater Bay * Blackwater Bay * Blackwater Bay *
65 Table 17: Coastal Transect Parameters Starting Wave Conditions for the 1% Starting Stillwater Elevations (ft NAVD88) Range of Stillwater Elevations (ft NAVD88) Flood Source Coastal Transect Significant Wave Height H s (ft) Peak Wave Period T p (sec) 10% 4% 2% 1% 0.2% Blackwater Bay * Blackwater Bay * Blackwater Bay * East Bay *
66 Table 17: Coastal Transect Parameters Starting Wave Conditions for the 1% Starting Stillwater Elevations (ft NAVD88) Range of Stillwater Elevations (ft NAVD88) Flood Source Coastal Transect Significant Wave Height H s (ft) Peak Wave Period T p (sec) 10% 4% 2% 1% 0.2% East Bay * East Bay * East Bay * East Bay *
67 Table 17: Coastal Transect Parameters Starting Wave Conditions for the 1% Starting Stillwater Elevations (ft NAVD88) Range of Stillwater Elevations (ft NAVD88) Flood Source Coastal Transect Significant Wave Height H s (ft) Peak Wave Period T p (sec) 10% 4% 2% 1% 0.2% East Bay * East Bay * East Bay * East Bay *
68 Table 17: Coastal Transect Parameters Starting Wave Conditions for the 1% Starting Stillwater Elevations (ft NAVD88) Range of Stillwater Elevations (ft NAVD88) Flood Source Coastal Transect Significant Wave Height H s (ft) Peak Wave Period T p (sec) 10% 4% 2% 1% 0.2% East Bay * East Bay * East Bay * Pensacola Bay *
69 Table 17: Coastal Transect Parameters Starting Wave Conditions for the 1% Starting Stillwater Elevations (ft NAVD88) Range of Stillwater Elevations (ft NAVD88) Flood Source Coastal Transect Significant Wave Height H s (ft) Peak Wave Period T p (sec) 10% 4% 2% 1% 0.2% Pensacola Bay * Pensacola Bay * Pensacola Bay * Pensacola Bay *
70 Table 17: Coastal Transect Parameters Starting Wave Conditions for the 1% Starting Stillwater Elevations (ft NAVD88) Range of Stillwater Elevations (ft NAVD88) Flood Source Coastal Transect Significant Wave Height H s (ft) Peak Wave Period T p (sec) 10% 4% 2% 1% 0.2% Pensacola Bay * Pensacola Bay * Pensacola Bay * Santa Rosa Sound *
71 Table 17: Coastal Transect Parameters Starting Wave Conditions for the 1% Starting Stillwater Elevations (ft NAVD88) Range of Stillwater Elevations (ft NAVD88) Flood Source Coastal Transect Significant Wave Height H s (ft) Peak Wave Period T p (sec) 10% 4% 2% 1% 0.2% Santa Rosa Sound * Santa Rosa Sound * Santa Rosa Sound * Santa Rosa Sound *
72 Table 17: Coastal Transect Parameters Starting Wave Conditions for the 1% Starting Stillwater Elevations (ft NAVD88) Range of Stillwater Elevations (ft NAVD88) Flood Source Coastal Transect Significant Wave Height H s (ft) Peak Wave Period T p (sec) 10% 4% 2% 1% 0.2% Santa Rosa Sound * Santa Rosa Sound * Santa Rosa Sound * Santa Rosa Sound *
73 Table 17: Coastal Transect Parameters Starting Wave Conditions for the 1% Starting Stillwater Elevations (ft NAVD88) Range of Stillwater Elevations (ft NAVD88) Flood Source Coastal Transect Significant Wave Height H s (ft) Peak Wave Period T p (sec) 10% 4% 2% 1% 0.2% Santa Rosa Sound * Santa Rosa Sound * Santa Rosa Sound * Santa Rosa Sound *
74 Table 17: Coastal Transect Parameters Starting Wave Conditions for the 1% Starting Stillwater Elevations (ft NAVD88) Range of Stillwater Elevations (ft NAVD88) Flood Source Coastal Transect Significant Wave Height H s (ft) Peak Wave Period T p (sec) 10% 4% 2% 1% 0.2% Santa Rosa Sound * Santa Rosa Sound * Santa Rosa Sound * Santa Rosa Sound *
75 Table 17: Coastal Transect Parameters Starting Wave Conditions for the 1% Starting Stillwater Elevations (ft NAVD88) Range of Stillwater Elevations (ft NAVD88) Flood Source Coastal Transect Significant Wave Height H s (ft) Peak Wave Period T p (sec) 10% 4% 2% 1% 0.2% Santa Rosa Sound * Santa Rosa Sound * Santa Rosa Sound * * Not calculated for this Flood Risk Project 71
76 «16 «31 «20 «25 Weaver Creek Escambia River b Branch Figure 9: Transect Location Map West Fork Big Coldwat Juniper Creek Sweetwater Creek Mcdavid Creek Moore Creek «89 Manning Creek Wolfe Creek «4 Dead River Danley Branch Thomas Creek Crooked Creek Buffalo Mill Creek White River Sevenmile Creek Pond Creek «87 Clear Creek CITY OF MILTON Big Coldwater Creek Pittman Creek SANTA ROSA COUNTY Blackwater River 90 Big Juniper Creek Alligator Creek 10 Ates Creek Simpson River «3 «4 Pace Mill Creek «5 «6 «18 «19 «87 Yellow River Boiling Creek Bear Creek Wolf Creek «7 Mulatto Bayou «8 «9 «281 «17 «21 Weaver River «10 «14 «15 «23 «22 Escambia Bay «12 «11 «13 Blackwater Bay East Bay «24 «26 Dean Creek East Bay River Panther Creek «29 «28 «27 «30 Pensacola Bay «42 «43 «41 «44 «40 «45 «39 «38 «46 «47 «37 «36 «48 Santa Rosa Sound «35 CITY OF GULF BREEZE «49 «50 «34 «51 «33 «52 «32 98 «53 «55 Gulf Of Mexico «57 «58 Santa Rosa Sound «1 «56 «59 «2 «60 «61 ESCAMBIA COUNTY (AREA NOT INCLUDED) «62 «63 «64 1 in = 3 miles Miles COUNTY LOCATOR NATIONAL FLOOD INSURANCE PROGRAM TRANSECT LOCATION MAP Map Projection: Florida State Plane North FIPS Zone 0903; North American Datum 1983 HARN; GRS 1980 Spheroid SANTA ROSA COUNTY, FLORIDA and Incorporated Areas Santa Rosa Transects: 1, 2, 3, 4, 5, 6, 7, 8, 9, 10, 11, 12, 13, 14, 15, 16, 17, 18, 19, 20, 21, 22, 23, 24, 25, 26, 27, 28, 29, 30, 31, 32, 33, 34, 35, 36, 37, 38, 39, 40, 41, 42, 43, 44, 45, 46, 47, 48, 49, 50, 51, 52, 53, 54, 55, 56, 57, 58, 59, 60, 61, 62, 63, 64 FEMA THE INFORMATION DEPICTED ON THIS MAP AND SUPPORTING DOCUMENTATION ARE ALSO AVAILABLE IN DIGITAL FORMAT AT SEE FLOOD INSURANCE STUDY FOR ADDITIONAL INFORMATION 72
77 5.4 Alluvial Fan Analyses This section is not applicable to this Flood Risk Project Table 18: Summary of Alluvial Fan Analyses (Not Applicable to this Flood Risk Project) Table 19: Results of Alluvial Fan Analyses (Not Applicable to this Flood Risk Project) SECTION 6.0 MAPPING METHODS 6.1 Vertical and Horizontal Control All FIS Reports and FIRMs are referenced to a specific vertical datum. The vertical datum provides a starting point against which flood, ground, and structure elevations can be referenced and compared. Until recently, the standard vertical datum used for newly created or revised FIS Reports and FIRMs was the National Geodetic Vertical Datum of 1929 (NGVD29). With the completion of the North American Vertical Datum of 1988 (NAVD88), many FIS Reports and FIRMs are now prepared using NAVD88 as the referenced vertical datum. Flood elevations shown in this FIS Report and on the FIRMs are referenced to NAVD88. These flood elevations must be compared to structure and ground elevations referenced to the same vertical datum. For information regarding conversion between NGVD29 and NAVD88 or other datum conversion, visit the National Geodetic Survey website at or contact the National Geodetic Survey (NGS) at the following address: NGS Information Services NOAA, N/NGS12 National Geodetic Survey SSMC-3, # East-West Highway Silver Spring, Maryland (301) Temporary vertical monuments are often established during the preparation of a flood hazard analysis for the purpose of establishing local vertical control. Although these monuments are not shown on the FIRM, they may be found in the archived project documentation associated with the FIS Report and the FIRMs for this community. Interested individuals may contact FEMA to access these data. To obtain current elevation, description, and/or location information for benchmarks in the area, please contact the Information Services Branch of the NGS at (301) , or visit their website at 73
78 Table 20: Countywide Vertical Datum Conversion (Not Applicable to this Flood Risk Project) Calculations for the vertical offsets for Escambia River basis are depicted in Table 21. Table 21: Stream-Based Vertical Datum Conversion Flooding Source Average Vertical Datum Conversion Factor (feet) Escambia River Base Map The FIRMs and FIS Report for this project have been produced in a digital format. The flood hazard information was converted to a Geographic Information System (GIS) format that meets FEMA s FIRM database specifications and geographic information standards. This information is provided in a digital format so that it can be incorporated into a local GIS and be accessed more easily by the community. The FIRM Database includes most of the tabular information contained in the FIS Report in such a way that the data can be associated with pertinent spatial features. For example, the information contained in the Floodway Data table and Flood Profiles can be linked to the cross sections that are shown on the FIRMs. Additional information about the FIRM Database and its contents can be found in FEMA s Guidelines and Standards for Flood Risk Analysis and Mapping, Base map information shown on the FIRM was derived from the sources described in Table 22. Table 22: Base Map Sources Data Type Data Provider Data Date Hydrological line and Polygon features FDOT Imagery PLSS Transportation Features Coastal Barrier Resource System (CBRS) Boundaries Santa Rosa County GIS Department Florida Department of Transportation Santa Rosa County GIS Department Santa Rosa County GIS Department US Fish and Wildlife Service Data Scale Data Description 02/09/2012 N/A Hydrography 09/17/2013 N/A Aerial Imagery 11/08/2011 N/A Public Land Survey System Boundaries 11/08/2011 N/A Road Centerline Data 04/24/2013 N/A CBRS Boundary Data 74
79 6.3 Floodplain and Floodway Delineation The FIRM shows tints, screens, and symbols to indicate floodplains and floodways as well as the locations of selected cross sections used in the hydraulic analyses and floodway computations. For riverine flooding sources, the mapped floodplain boundaries shown on the FIRM have been delineated using the flood elevations determined at each cross section; between cross sections, the boundaries were interpolated using the topographic elevation data described in Table 23. For each coastal flooding source studied as part of this FIS Report, the mapped floodplain boundaries on the FIRM have been delineated using the flood and wave elevations determined at each transect; between transects, boundaries were delineated using land use and land cover data, the topographic elevation data described in Table 23, and knowledge of coastal flood processes. In ponding areas, flood elevations were determined at each junction of the model; between junctions, boundaries were interpolated using the topographic elevation data described in Table 23. In cases where the 1% and 0.2% annual chance floodplain boundaries are close together, only the 1% annual chance floodplain boundary has been shown. Small areas within the floodplain boundaries may lie above the flood elevations but cannot be shown due to limitations of the map scale and/or lack of detailed topographic data. The floodway widths presented in this FIS Report and on the FIRM were computed for certain stream segments on the basis of equal conveyance reduction from each side of the floodplain. Floodway widths were computed at cross sections. Between cross sections, the floodway boundaries were interpolated. Table 2 indicates the flooding sources for which floodways have been determined. The results of the floodway computations for those flooding sources have been tabulated for selected cross sections and are shown in Table 24, Floodway Data. Table 23: Summary of Topographic Elevation Data used in Mapping Community Santa Rosa County (all communities) Flooding Source Description Scale All within HUC basins Light Detection and Ranging data (LiDAR) Source for Topographic Elevation Data Contour Interval RMSE z Accuracy z Citation 1:1200 N/A N/A N/A NWFWMD BFEs shown at cross sections on the FIRM represent the 1% annual chance water surface elevations shown on the Flood Profiles and in the Floodway Data tables in the FIS Report. Rounded whole-foot elevations may be shown on the FIRM in coastal areas, areas of ponding, and other areas with static base flood elevations. 75
80 Table 24: Floodway Data CROSS SECTION LOCATION DISTANCE 1 WIDTH (FEET) FLOODWAY SECTION AREA (SQ. FEET) MEAN VELOCITY (FEET/SEC) 1% ANNUAL CHANCE FLOOD WATER SURFACE ELEVATION (FEET NAVD88) REGULATORY WITHOUT FLOODWAY WITH FLOODWAY INCREASE A 9,342 1,380 13, B 10,605 2,540 20, C 11,960 3,491 25, D 14,578 2,885 32, E 16,459 3,242 40, F 17,731 2,840 37, G 21,056 2,640 40, H 23,348 3,472 55, I 26,807 4,846 56, J 31,849 5,073 76, K 36,996 4,605 66, L 37,937 4,924 62, M 45,014 4,615 75, N 49,166 4,115 55, O 51,919 4,230 69, P 55,733 3,791 46, Q 62,743 3,024 43, R 68,973 2,413 35, S 72,997 3,364 56, T 76,544 2,582 47, U 80,226 2,825 51, V 84,523 2,818 47, W 90,387 3,953 73, X 93,456 4,366 64, Y 97,816 2,280 40, Z 99,764 1,497 27, AA AU 3 1 Feet above mouth at Blackwater Bay 2 Elevation computed without consideration of Blackwater Bay storm surge effects 3 Floodway data not computed, see Table 25 for elevations TABLE 24 FEDERAL EMERGENCY MANAGEMENT AGENCY SANTA ROSA COUNTY, FL AND INCORPORATED AREAS 76 FLOODWAY DATA FLOODING SOURCE: BLACKWATER RIVER
81 CROSS SECTION LOCATION DISTANCE 1 WIDTH (FEET) FLOODWAY SECTION AREA (SQ. FEET) MEAN VELOCITY (FEET/SEC) 1% ANNUAL CHANCE FLOOD WATER SURFACE ELEVATION (FEET NAVD88) REGULATORY WITHOUT FLOODWAY WITH FLOODWAY INCREASE A , B 2, , C 5, , D 5, , E 12,392 1,072 7, F 17,192 1,971 17, G 21, , H 25, , I 28, , J 33, , K 36,492 1,324 11, L 38,842 1,346 10, Feet above mouth at East Bay 2 Elevation computed without consideration of East Bay storm surge effects TABLE 24 FEDERAL EMERGENCY MANAGEMENT AGENCY SANTA ROSA COUNTY, FL AND INCORPORATED AREAS FLOODWAY DATA FLOODING SOURCE: EAST BAY RIVER 77
82 CROSS SECTION LOCATION DISTANCE 1 WIDTH3 (FEET) FLOODWAY SECTION AREA (SQ. FEET) MEAN VELOCITY (FEET/SEC) 1% ANNUAL CHANCE FLOOD WATER SURFACE ELEVATION (FEET NAVD88) REGULATORY WITHOUT FLOODWAY WITH FLOODWAY INCREASE A ,754 36, B 9,610 13, , C 14,210 11, , D 23,510 8, , E 30,970 9, , F 39,920 10, , G 50,110 12, , H 56,790 9, , I 64,350 8, , J 66,500 5,607 72, K 73,502 13, , L 80,602 11, , M 87,632 12, , N 97,812 11, , O 111,852 13, , P 125,662 15, , Q 143,062 9, , R 150,242 9, , S 163,342 11, , T 173,042 10, , U 179,742 5,863 98, V 193,392 7, , W 200,492 10, , X 211,172 15, , Y 217,572 10, , Z 222,972 7, , Feet above U.S. route 90 2 Elevation computed without consideration of Escambia Bay storm surge effects 3 Width extends beyond county boundary TABLE 24 FEDERAL EMERGENCY MANAGEMENT AGENCY SANTA ROSA COUNTY, FL AND INCORPORATED AREAS FLOODWAY DATA FLOODING SOURCE: ESCAMBIA RIVER 78
83 CROSS SECTION LOCATION DISTANCE 1 WIDTH2 (FEET) FLOODWAY SECTION AREA (SQ. FEET) MEAN VELOCITY (FEET/SEC) 1% ANNUAL CHANCE FLOOD WATER SURFACE ELEVATION (FEET NAVD88) REGULATORY WITHOUT FLOODWAY WITH FLOODWAY INCREASE AA 235,122 8, , AB 243,542 8, , AC 253,392 8, , AD 261,042 8, , AE 269,291 8,694 94, Feet above U.S. route 90 2 Width extends beyond county boundary TABLE 24 FEDERAL EMERGENCY MANAGEMENT AGENCY SANTA ROSA COUNTY, FL AND INCORPORATED AREAS FLOODWAY DATA FLOODING SOURCE: ESCAMBIA RIVER 79
84 CROSS SECTION LOCATION DISTANCE 1 WIDTH (FEET) FLOODWAY SECTION AREA (SQ. FEET) MEAN VELOCITY (FEET/SEC) 1% ANNUAL CHANCE FLOOD WATER SURFACE ELEVATION (FEET NAVD88) REGULATORY WITHOUT FLOODWAY WITH FLOODWAY INCREASE A 5, , B 7, , C 8, , D 11, E 14, , F 15, G 15, , H 19, I 21, J 21, , K 22, L 23, M 23, N 24, O 25, P 25, Q 27, Feet above mouth at Escambia Bay 2 Elevation computed without consideration of Escambia Bay storm surge effects TABLE 24 FEDERAL EMERGENCY MANAGEMENT AGENCY SANTA ROSA COUNTY, FL AND INCORPORATED AREAS FLOODWAY DATA FLOODING SOURCE: PACE MILL CREEK 80
85 CROSS SECTION LOCATION DISTANCE 1 WIDTH (FEET) FLOODWAY SECTION AREA (SQ. FEET) MEAN VELOCITY (FEET/SEC) 1% ANNUAL CHANCE FLOOD WATER SURFACE ELEVATION (FEET NAVD88) REGULATORY WITHOUT FLOODWAY WITH FLOODWAY INCREASE TABLE 24 A 4, , B 6, , C 6, , D 10,108 1,564 10, E 13, , F 13, , G 14,352 1,286 10, H 15,669 1,537 18, I 18,389 1,210 12, J 23, , K 25,016 1,359 11, L 30,373 1,070 10, M 32, , N 33,216 1,151 13, O 35,720 1,222 15, P 39,348 1,071 9, Q 39,427 1,071 9, R 40,496 1,250 8, S 44, , T 45, , U 48, , V 51, , W 53, , X 53, , Y 54, , Z 54, , Feet above mouth at Blackwater River 2 Elevation computed without consideration of Blackwater Bay storm surge effects FEDERAL EMERGENCY MANAGEMENT AGENCY SANTA ROSA COUNTY, FL AND INCORPORATED AREAS FLOODWAY DATA FLOODING SOURCE: POND CREEK 81
86 CROSS SECTION LOCATION DISTANCE 1 WIDTH (FEET) FLOODWAY SECTION AREA (SQ. FEET) MEAN VELOCITY (FEET/SEC) 1% ANNUAL CHANCE FLOOD WATER SURFACE ELEVATION (FEET NAVD88) REGULATORY WITHOUT FLOODWAY WITH FLOODWAY INCREASE AA 55, , AB 58, , AC 61, , AD 65,620 1,199 11, AE 66,421 1,511 9, AF 69,258 1,046 7, AG 69,388 1,046 8, AH AT 2 1 Feet above mouth at Blackwater River 2 Floodway data not computed, see Table 25 for elevations TABLE 24 FEDERAL EMERGENCY MANAGEMENT AGENCY SANTA ROSA COUNTY, FL AND INCORPORATED AREAS FLOODWAY DATA FLOODING SOURCE: POND CREEK 82
87 CROSS SECTION LOCATION DISTANCE 1 WIDTH (FEET) FLOODWAY SECTION AREA (SQ. FEET) MEAN VELOCITY (FEET/SEC) 1% ANNUAL CHANCE FLOOD WATER SURFACE ELEVATION (FEET NAVD88) REGULATORY WITHOUT FLOODWAY WITH FLOODWAY INCREASE A 10,736 7,168 27, B 27,462 8, , C 33,390 4,792 67, D 33,496 7,792 66, E 43,293 7,329 90, F 51,322 8, , G 58,514 5,841 79, H 66,628 5,231 79, I 81,427 6,118 88, J 87,896 5,863 77, K 96,564 4,124 67, L 103,524 5,476 82, M 109,668 6, , N 3 113,349 7,073 84, Feet above mouth at Blackwater Bay 2 Elevation computed without consideration of Blackwater Bay storm surge effects 3 Floodway is shown outside of the county boundary TABLE 24 FEDERAL EMERGENCY MANAGEMENT AGENCY SANTA ROSA COUNTY, FL AND INCORPORATED AREAS FLOODWAY DATA FLOODING SOURCE: YELLOW RIVER 83
88 Flooding Source Table 25: Flood Hazard and Non-Encroachment Data for Selected Streams Cross Section Stream Station 1 1% Flood Discharge (cfs) 1% Water Surface Elevation (feet NAVD88) Non- Encroachment Width (feet) Beale Creek A 14,142 * 24.4 N/A N/A Beale Creek B 15,153 * 28.2 N/A N/A Beale Creek C 16,647 * 39.8 N/A N/A Beale Creek D 17,596 * 43.7 N/A N/A Beale Creek E 19,875 * 61.9 N/A N/A Big Coldwater Creek Big Coldwater Creek Big Coldwater Creek Big Coldwater Creek Big Coldwater Creek Blackwater River Blackwater River Blackwater River Blackwater River Blackwater River Blackwater River Blackwater River Blackwater River Blackwater River Blackwater River Left Right A 40,079 * 40.7 N/A N/A B 45,079 * 41.6 N/A N/A C 51,077 * 44.1 N/A N/A D 57,073 * 48.5 N/A N/A E 61,498 * 50.8 N/A N/A AA 103,473 * 39.3 N/A N/A AB 105,593 * 40.6 N/A N/A AC 111,459 * 43.5 N/A N/A AD 116,529 * 46.3 N/A N/A AE 119,914 * 48.1 N/A N/A AF 123,825 * 49.5 N/A N/A AG 128,077 * 50.6 N/A N/A AH 133,378 * 52.0 N/A N/A AI 136,277 * 53.4 N/A N/A AJ 140,562 * 55.5 N/A N/A 84
89 Flooding Source Blackwater River Blackwater River Blackwater River Blackwater River Blackwater River Blackwater River Blackwater River Blackwater River Blackwater River Blackwater River Blackwater River Table 25: Flood Hazard and Non-Encroachment Data for Selected Streams Cross Section Stream Station 1 1% Flood Discharge (cfs) 1% Water Surface Elevation (feet NAVD88) Non- Encroachment Width (feet) Left Right AK 145,563 * 57.1 N/A N/A AL 147,370 * 57.6 N/A N/A AM 147,427 * 57.6 N/A N/A AN 150,858 * 59.1 N/A N/A AO 155,016 * 60.9 N/A N/A AP 158,349 * 62.0 N/A N/A AQ 162,478 * 63.3 N/A N/A AR 167,062 * 65.5 N/A N/A AS 170,370 * 67.0 N/A N/A AT 173,528 * 68.4 N/A N/A AU 176,677 * 70.2 N/A N/A Clear Creek A 21,706 * 31.9 N/A N/A Clear Creek B 27,676 * 40.3 N/A N/A Clear Creek C 31,612 * 49.6 N/A N/A Clear Creek D 34,953 * 58.1 N/A N/A Clear Creek E 38,989 * 58.6 N/A N/A Clear Creek F 41,972 * 68.6 N/A N/A Clear Creek G 47,881 * 77.1 N/A N/A Clear Creek H 52,184 * N/A N/A East Fork Big Coldwater Creek East Fork Big Coldwater Creek A 3,229 * 51.5 N/A N/A B 5,952 * 52.7 N/A N/A 85
90 Flooding Source Table 25: Flood Hazard and Non-Encroachment Data for Selected Streams East Fork Big Coldwater Creek East Fork Big Coldwater Creek East Fork Big Coldwater Creek East Fork Big Coldwater Creek East Fork Big Coldwater Creek East Fork Big Coldwater Creek East Fork Big Coldwater Creek Cross Section Stream Station % Flood Discharge (cfs) 1% Water Surface Elevation (feet NAVD88) Non- Encroachment Width (feet) Left Right C 11,546 * 56.0 N/A N/A D 16,448 * 59.7 N/A N/A E 21,998 * 63.3 N/A N/A F 27,605 * 66.6 N/A N/A G 32,527 * 71.1 N/A N/A H 36,493 * 74.0 N/A N/A I 38,778 * 76.1 N/A N/A Jacobs Creek A 1,688 * 28.4 N/A N/A Jacobs Creek B 3,240 * 40.3 N/A N/A Jacobs Creek C 4,139 * 44.2 N/A N/A Jacobs Creek D 5,111 * 47.0 N/A N/A Juniper Creek A 1,357 * 84.3 N/A N/A Juniper Creek B 6,638 * 92.1 N/A N/A Juniper Creek C 11,822 * N/A N/A Juniper Creek D 17,348 * N/A N/A Juniper Creek E 21,885 * N/A N/A Juniper Creek F 26,475 * N/A N/A Manning Creek A 2,628 * 56.4 N/A N/A Manning Creek B 6,850 * 61.8 N/A N/A Manning Creek C 11,308 * 69.3 N/A N/A Manning Creek D 16,408 * 76.5 N/A N/A Manning Creek E 22,144 * 86.7 N/A N/A
91 Flooding Source Table 25: Flood Hazard and Non-Encroachment Data for Selected Streams Cross Section Stream Station 1 1% Flood Discharge (cfs) 1% Water Surface Elevation (feet NAVD88) Non- Encroachment Width (feet) Manning Creek F 28,330 * 98.5 N/A N/A Pond Creek AH 69,525 * 68.8 N/A N/A Pond Creek AI 74,748 * 71.1 N/A N/A Pond Creek AJ 82,814 * 80.9 N/A N/A Pond Creek AK 89,152 * 89.6 N/A N/A Pond Creek AL 97,394 * 99.5 N/A N/A Pond Creek AM 104,309 * N/A N/A Pond Creek AN 111,300 * N/A N/A Pond Creek AO 119,412 * N/A N/A Pond Creek AP 128,879 * N/A N/A Pond Creek AQ 138,256 * N/A N/A Pond Creek AR 145,534 * N/A N/A Pond Creek AS 151,054 * N/A N/A Pond Creek AT 74,748 * N/A N/A Reader Creek A 1,402 * 70.2 N/A N/A Reader Creek B 6,576 * 81.7 N/A N/A Reader Creek C 12,391 * N/A N/A Reader Creek D 16,215 * N/A N/A Reader Creek E 19,143 * N/A N/A Rocky Creek A 10,460 * 14.0 N/A N/A Rocky Creek B 12,663 * 20.5 N/A N/A Rocky Creek C 14,770 * 48.4 N/A N/A Rocky Creek D 17,378 * 62.9 N/A N/A Unnamed Tributary to Beale Creek Unnamed Tributary to Beale Creek Unnamed Tributary to Beale Creek Left Right A 1,083 * 25.2 N/A N/A B 3,464 * 40.1 N/A N/A C 5,063 * 46.2 N/A N/A 87
92 Flooding Source Table 25: Flood Hazard and Non-Encroachment Data for Selected Streams West Fork Big Coldwater Creek West Fork Big Coldwater Creek West Fork Big Coldwater Creek West Fork Big Coldwater Creek West Fork Big Coldwater Creek West Fork Big Coldwater Creek West Fork Big Coldwater Creek West Fork Big Coldwater Creek West Fork Big Coldwater Creek West Fork Big Coldwater Creek Cross Section Stream Station 1 1 Feet above mouth *Not calculated for this Flood Risk Project 1% Flood Discharge (cfs) 1% Water Surface Elevation (feet NAVD88) Non- Encroachment Width (feet) Left Right F 5,001 * 51.4 N/A N/A G 11,148 * 55.0 N/A N/A H 16,903 * 57.8 N/A N/A I 21,857 * 60.7 N/A N/A J 26,724 * 63.4 N/A N/A K 32,691 * 66.4 N/A N/A L 38,695 * 71.8 N/A N/A M 43,558 * 77.5 N/A N/A N 48,085 * 84.0 N/A N/A O 50,487 * 84.4 N/A N/A 6.4 Coastal Flood Hazard Mapping Flood insurance zones and BFEs including the wave effects were identified on each transect based on the results from the onshore wave hazard analyses. Between transects, elevations were interpolated using topographic maps, land-use and land-cover data, and knowledge of coastal flood processes to determine the aerial extent of flooding. Sources for topographic data are shown in Table
93 Zone VE is subdivided into elevation zones and BFEs are provided on the FIRM. The limit of Zone VE shown on the FIRM is defined as the farthest inland extent of any of these criteria (determined for the 1% annual chance flood condition): The primary frontal dune zone is defined in 44 CFR Section 59.1 of the NFIP regulations. The primary frontal dune represents a continuous or nearly continuous mound or ridge of sand with relatively steep seaward and landward slopes that occur immediately landward and adjacent to the beach. The primary frontal dune zone is subject to erosion and overtopping from high tides and waves during major coastal storms. The inland limit of the primary frontal dune zone occurs at the point where there is a distinct change from a relatively steep slope to a relatively mild slope. The wave runup zone occurs where the (eroded) ground profile is 3.0 feet or more below the 2-percent wave runup elevation. The wave overtopping splash zone is the area landward of the crest of an overtopped barrier, in cases where the potential 2-percent wave runup exceeds the barrier crest elevation by 3.0 feet or more. The breaking wave height zone occurs where 3-foot or greater wave heights could occur (this is the area where the wave crest profile is 2.1 feet or more above the total stillwater elevation). The high-velocity flow zone is landward of the overtopping splash zone (or area on a sloping beach or other shore type), where the product of depth of flow times the flow velocity squared (hv 2 ) is greater than or equal to 200 ft 3 /sec 2. This zone may only be used on the Pacific Coast. The SFHA boundary indicates the limit of SFHAs shown on the FIRM as either V zones or A zones. Table 26 indicates the coastal analyses used for floodplain mapping and the criteria used to determine the inland limit of the open-coast Zone VE and the SFHA boundary at each transect. Coastal Transect Table 26: Summary of Coastal Transect Mapping Considerations Primary Frontal Dune (PFD) Identified Wave Runup Analysis Zone Designation and BFE (ft NAVD 88) 1 YES N/A 2 YES N/A 3 NO N/A 4 NO N/A 89 Wave Height Analysis Zone Designation and BFE (ft NAVD 88) VE AE 8-11 VE AE 8-12 VE AE VE AE Zone VE Limit PFD PFD SFHA Boundary PFD &
94 Coastal Transect Table 26: Summary of Coastal Transect Mapping Considerations Primary Frontal Dune (PFD) Identified Wave Runup Analysis Zone Designation and BFE (ft NAVD 88) 5 NO N/A 6 NO N/A 7 NO N/A 8 NO N/A 9 NO N/A 10 NO N/A 11 NO N/A 12 NO N/A 13 NO N/A 14 NO N/A 15 NO N/A 16 NO N/A 17 NO N/A 18 NO N/A 19 NO N/A 20 NO N/A 21 NO N/A 22 NO N/A 23 NO N/A 24 NO N/A Wave Height Analysis Zone Designation and BFE (ft NAVD 88) VE AE VE AE VE AE VE AE 9-12 VE AE 9-12 VE AE 8-11 VE AE 8-11 VE AE 7-10 VE AE 6-10 VE AE 8-10 VE AE 8-11 VE AE 8-11 VE AE 9-11 VE AE 9-12 VE AE 9-12 VE AE 8-12 VE AE 7-12 VE AE 9-11 VE AE 8-11 VE AE 8-11 Zone VE Limit SFHA Boundary 90
95 Coastal Transect Table 26: Summary of Coastal Transect Mapping Considerations Primary Frontal Dune (PFD) Identified Wave Runup Analysis Zone Designation and BFE (ft NAVD 88) 25 NO N/A 26 NO N/A 27 NO N/A 28 NO N/A 29 NO N/A 30 NO N/A 31 NO N/A 32 NO N/A 33 NO VE NO VE NO VE NO AE NO N/A 38 NO AE 9 39 NO VE NO VE NO N/A 42 NO N/A 43 NO VE NO N/A 45 NO N/A Wave Height Analysis Zone Designation and BFE (ft NAVD 88) VE AE 8-11 VE AE 8-11 VE AE 7-11 VE AE 8-11 VE AE 8-10 VE AE 7-10 VE AE 8-10 VE AE 8-10 VE AE 8-10 VE AE 7-10 VE 10 AE 8-10 VE 9-10 AE 6-9 VE 9-11 AE 7-9 VE 9-11 AE 7-9 VE 9-11 AE 7-9 VE AE 7-10 VE AE 8-10 VE AE 8-10 VE AE 8-10 VE AE 8-10 VE AE 8-10 Zone VE Limit RUNUP RUNUP RUNUP RUNUP RUNUP RUNUP SFHA Boundary RUNUP RUNUP RUNUP RUNUP RUNUP RUNUP RUNUP & OVERTOPPIN G RUNUP 91
96 Coastal Transect Table 26: Summary of Coastal Transect Mapping Considerations Primary Frontal Dune (PFD) Identified Wave Runup Analysis Zone Designation and BFE (ft NAVD 88) 46 NO N/A 47 NO N/A 48 NO N/A 49 NO N/A 50 NO N/A 51 NO N/A 52 NO N/A 53 NO N/A 55 NO N/A 56 NO N/A 57 NO N/A 58 NO N/A 59 NO N/A 60 NO N/A 61 NO N/A 62 NO N/A 63 NO VE NO N/A Wave Height Analysis Zone Designation and BFE (ft NAVD 88) VE AE 6-10 VE AE 7-10 VE AE 7-10 VE AE 7-10 VE AE 7-10 VE AE 8-10 VE AE 7-10 VE AE 8-10 VE AE 8-11 VE AE 9-11 VE AE 8-11 VE AE 9-11 VE AE 9-11 VE AE 9-11 VE AE 9-11 VE AE 9-11 VE AE 9-11 VE AE 9-11 Zone VE Limit RUNUP SFHA Boundary RUNUP A LiMWA boundary has also been added in coastal areas subject to wave action for use by local communities in safe rebuilding practices. The LiMWA represents the approximate landward limit of the 1.5-foot breaking wave. To simplify representation, the LiMWA was continued immediately landward of the VE/AE boundary in areas where wave runup elevations dominate. Similarly, in areas where the Zone VE designation is based on the presence of a primary frontal dune or wave overtopping, the LiMWA was delineated immediately landward of the Zone VE/AE boundary. 92
97 6.5 FIRM Revisions This FIS Report and the FIRM are based on the most up-to-date information available to FEMA at the time of its publication; however, flood hazard conditions change over time. Communities or private parties may request flood map revisions at any time. Certain types of requests require submission of supporting data. FEMA may also initiate a revision. Revisions may take several forms, including Letters of Map Amendment (LOMAs), Letters of Map Revision Based on Fill (LOMR-Fs), Letters of Map Revision (LOMRs) (referred to collectively as Letters of Map Change (LOMCs)), Physical Map Revisions (PMRs), and FEMA-contracted restudies. These types of revisions are further described below. Some of these types of revisions do not result in the republishing of the FIS Report. To assure that any user is aware of all revisions, it is advisable to contact the community repository of flood-hazard data (shown in Table 31, Map Repositories ) Letters of Map Amendment A LOMA is an official revision by letter to an effective NFIP map. A LOMA results from an administrative process that involves the review of scientific or technical data submitted by the owner or lessee of property who believes the property has incorrectly been included in a designated SFHA. A LOMA amends the currently effective FEMA map and establishes that a specific property is not located in a SFHA. A LOMA cannot be issued for properties located on the PFD (primary frontal dune). To obtain an application for a LOMA, visit and download the form MT-1 Application Forms and Instructions for Conditional and Final Letters of Map Amendment and Letters of Map Revision Based on Fill. Visit the Flood Map-Related Fees section to determine the cost, if any, of applying for a LOMA. FEMA offers a tutorial on how to apply for a LOMA. The LOMA Tutorial Series can be accessed at For more information about how to apply for a LOMA, call the FEMA Map Information exchange; toll free, at FEMA MAP ( ) Letters of Map Revision Based on Fill A LOMR-F is an official revision by letter to an effective NFIP map. A LOMR-F states FEMA s determination concerning whether a structure or parcel has been elevated on fill above the base flood elevation and is, therefore, excluded from the SFHA. Information about obtaining an application for a LOMR-F can be obtained in the same manner as that for a LOMA, by visiting for the MT-1 Application Forms and Instructions for Conditional and Final Letters of Map Amendment and Letters of Map Revision Based on Fill or by calling the FEMA Map Information exchange, toll free, at FEMA MAP ( ). Fees for applying for a LOMR-F, if any, are listed in the Flood Map-Related Fees section. A tutorial for LOMR-F is available at 93
98 6.5.3 Letters of Map Revision A LOMR is an official revision to the currently effective FEMA map. It is used to change flood zones, floodplain and floodway delineations, flood elevations and planimetric features. All requests for LOMRs should be made to FEMA through the chief executive officer of the community, since it is the community that must adopt any changes and revisions to the map. If the request for a LOMR is not submitted through the chief executive officer of the community, evidence must be submitted that the community has been notified of the request. To obtain an application for a LOMR, visit and download the form MT-2 Application Forms and Instructions for Conditional Letters of Map Revision and Letters of Map Revision. Visit the Flood Map-Related Fees section to determine the cost of applying for a LOMR. For more information about how to apply for a LOMR, call the FEMA Map Information exchange; toll free, at FEMA MAP ( ) to speak to a Map Specialist. Previously issued mappable LOMCs (including LOMRs) that have been incorporated into the Santa Rosa County FIRM are listed in Table Physical Map Revisions Table 27: Incorporated Letters of Map Change (Not Applicable to this Flood Risk Project) A PMR is Physical Map Revisions (PMRs) are an official republication of a community s NFIP map to effect changes to base flood elevations, floodplain boundary delineations, regulatory floodways and planimetric features. These changes typically occur as a result of structural works or improvements, annexations resulting in additional flood hazard areas or correction to base flood elevations or SFHAs. The community s chief executive officer must submit scientific and technical data to FEMA to support the request for a PMR. The data will be analyzed and the map will be revised if warranted. The community is provided with copies of the revised information and is afforded a review period. When the base flood elevations are changed, a 90-day appeal period is provided. A 6-month adoption period for formal approval of the revised map(s) is also provided. For more information about the PMR process, please visit and visit the Flood Map Revision Processes section Contracted Restudies The NFIP provides for a periodic review and restudy of flood hazards within a given community. FEMA accomplishes this through a national watershed-based mapping needs assessment strategy, known as the Coordinated Needs Management Strategy (CNMS). The CNMS is used by FEMA to assign priorities and allocate funding for new flood hazard analyses used to update the FIS Report and FIRM. The goal of CNMS is to define the validity of the engineering study data within a mapped inventory. The CNMS is used to track the assessment process, document engineering gaps and their resolution, and aid in prioritization for using flood risk as a key factor for areas identified for flood map updates. Visit to learn more about the CNMS or contact the FEMA Regional Office listed in Section 8 of this FIS Report. 94
99 6.5.6 Community Map History The current FIRM presents flooding information for the entire geographic area of Santa Rosa County. Previously, separate FIRMs, Flood Hazard Boundary Maps (FHBMs) and/or Flood Boundary and Floodway Maps (FBFMs) may have been prepared for the incorporated communities and the unincorporated areas in the county that had identified SFHAs. Current and historical data relating to the maps prepared for the project area are presented in Table 28, Community Map History. A description of each of the column headings and the source of the date is also listed below. Community Name includes communities falling within the geographic area shown on the FIRM, including those that fall on the boundary line, nonparticipating communities, and communities with maps that have been rescinded. Communities with No Special Flood Hazards are indicated by a footnote. If all maps (FHBM, FBFM, and FIRM) were rescinded for a community, it is not listed in this table unless SFHAs have been identified in this community. Initial Identification Date (First NFIP Map Published) is the date of the first NFIP map that identified flood hazards in the community. If the FHBM has been converted to a FIRM, the initial FHBM date is shown. If the community has never been mapped, the upcoming effective date or pending (for Preliminary FIS Reports) is shown. If the community is listed in Table 28 but not identified on the map, the community is treated as if it were unmapped. Initial FHBM Effective Date is the effective date of the first Flood Hazard Boundary Map (FHBM). This date may be the same date as the Initial NFIP Map Date. FHBM Revision Date(s) is the date(s) that the FHBM was revised, if applicable. Initial FIRM Effective Date is the date of the first effective FIRM for the community. FIRM Revision Date(s) is the date(s) the FIRM was revised, if applicable. This is the revised date that is shown on the FIRM panel, if applicable. As countywide studies are completed or revised, each community listed should have its FIRM dates updated accordingly to reflect the date of the countywide study. Once the FIRMs exist in countywide format, as Physical Map Revisions (PMR) of FIRM panels within the county are completed, the FIRM Revision Dates in the table for each community affected by the PMR are updated with the date of the PMR, even if the PMR did not revise all the panels within that community. The initial effective date for the Santa Rosa County FIRMs in countywide format was 12/19/
100 Community Name Table 28: Community Map History Initial Identification Date Initial FHBM Effective Date FHBM Revision Date(s) Initial FIRM Effective Date Gulf Breeze, City of 06/28/ /28/ /30/ /01/1977 FIRM Revision Date(s) 12/19/ /19/ /16/ /03/ /01/1985 Jay, Town of 10/10/ /10/1975 N/A 05/15/ /19/2006 Milton, City of 05/24/ /24/1974 N/A 06/01/1977 Santa Rosa, Unincorporated Areas 01/24/ /24/1975 N/A 10/14/ /19/ /18/ /19/ /17/ /19/ /20/ /03/ /01/1985 SECTION 7.0 CONTRACTED STUDIES AND COMMUNITY COORDINATION 7.1 Contracted Studies Table 29 provides a summary of the contracted studies, by flooding source, which are included in this FIS Report. Table 29: Summary of Contracted Studies Included in this FIS Report Flooding Source Various Streams within Santa Rosa County Holley By The Sea FIS Report Dated Contractor Number Work Completed Date TBD AECOM TBD AECOM EMA CA Affected Communities Santa Rosa County and Incorporated Areas Santa Rosa County (Unincorporated Areas) 7.2 Community Meetings The dates of the community meetings held for this Flood Risk Project and previous Flood Risk Projects are shown in Table 30. These meetings may have previously been referred to by a variety of names (Community Coordination Officer (CCO), Scoping, Discovery, etc.), but all meetings 96
101 represent opportunities for FEMA, community officials, study contractors, and other invited guests to discuss the planning for and results of the project. 97
102 Table 30: Community Meetings Community FIS Report Dated Date of Meeting Meeting Type Attended By Gulf Breeze, City of November 1, 1985 January 19, 2000 August 8, 1979 Initial CCO FEMA, the community, and the study contractor December 4, 1984 Final CCO FEMA, the community, and the study contractor July 14, 1998 Initial CCO FEMA, the community, and the study contractor February 12, 1999 Final CCO FEMA, the community, and the study contractor Milton, City of Santa Rosa County and Incorporated Areas May 15, 1985 December 19, 2006 August 8, 1979 Initial CCO FEMA, the community, and the study contractor December 5, 1984 Final CCO FEMA, the community, and the study contractor November 10, 2005 December 19, 2006 December 19, 2006 Initial CCO Final CCO Initial CCO Final CCO None Held FEMA, NWFWMD, the Town of Jay, Santa Rosa County, and the State of Florida None Held FEMA, NWFWMD, the Town of Jay, Santa Rosa County, and the State of Florida Santa Rosa County (Unincorporated Areas) November 1, 1985 January 19, 2000 July 17, 2002 July 18, 2016 August 8, 1979 Initial CCO FEMA, the community, and the study contractor December 5, 1984 Final CCO FEMA, the community, and the study contractor July 14, 1997 Initial CCO FEMA, the community, and the study contractor February 12, 1999 Final CCO FEMA, the community, and the study contractor June 12, 2001 Initial CCO FEMA, the community, and the study contractor Final CCO None Held Initial CCO Final CCO 98
103 SECTION 8.0 ADDITIONAL INFORMATION Information concerning the pertinent data used in the preparation of this FIS Report can be obtained by submitting an order with any required payment to the FEMA Engineering Library. For more information on this process, see Table 31 is a list of the locations where FIRMs for Santa Rosa County can be viewed. Please note that the maps at these locations are for reference only and are not for distribution. Also, please note that only the maps for the community listed in the table are available at that particular repository. A user may need to visit another repository to view maps from an adjacent community. Table 31: Map Repositories Community Address City State Zip Code Gulf Breeze, City of Jay, Town of Milton, City of Santa Rosa County (Unincorporated Areas) City Hall 1070 Shoreline Drive Town Hall 3695 Highway 4 Planning and Development Department 6738 Dixon Street Santa Rosa County Public Services Department 6051 Old Bagdad Highway Gulf Breeze FL Jay FL Milton FL Milton FL The National Flood Hazard Layer (NFHL) dataset is a compilation of effective FIRM databases and LOMCs. Together they create a GIS data layer for a State or Territory. The NFHL is updated as studies become effective and extracts are made available to the public monthly. NFHL data can be viewed or ordered from the website shown in Table 32. Table 32 contains useful contact information regarding the FIS Report, the FIRM, and other relevant flood hazard and GIS data. In addition, information about the State NFIP Coordinator and GIS Coordinator is shown in this table. At the request of FEMA, each Governor has designated an agency of State or territorial government to coordinate that State's or territory's NFIP activities. These agencies often assist communities in developing and adopting necessary floodplain management measures. State GIS Coordinators are knowledgeable about the availability and location of State and local GIS data in their state. 99
104 Table 32: Additional Information FEMA and the NFIP FEMA and FEMA Engineering Library website NFIP website NFHL Dataset FEMA Region IV msc.fema.gov Federal Emergency Management Agency 3003 Chamblee Tucker Road Atlanta, GA (770) Other Federal Agencies USGS website Hydraulic Engineering Center website State NFIP Coordinator State GIS Coordinator State Agencies and Organizations Steve Martin, CFM Florida Division of Emergency Management 2555 Shumard Oak Boulevard Tallahassee, FL Richard Butgereit, GIS Administer Florida Division of Emergency Management 2555 Shumard Oak Boulevard Tallahassee, FL SECTION 9.0 BIBLIOGRAPHY AND REFERENCES Table 33 includes sources used in the preparation of and cited in this FIS Report as well as additional studies that have been conducted in the study area. 100
105 Table 33: Bibliography and References Citation in this FIS BASE1 BASE2 BASE3 BASE4 BASE6 Publisher/ Issuer Santa Rosa County U.G. Geological Survey Florida Department of Transportation National Geodetic Survey US Fish and Wildlife Service Publication Title, Article, Volume, Number, etc. Transportation, Political, Hydrology and Wetland features GIS data FDOT Imagery NGS benchmark data BASE7 US Census Bureau TIGER Roads FIRM1 FIRM3 FIS1 Federal Emergency Management Agency Federal Emergency Management Agency Federal Emergency Management Agency National Wetlands Inventory Effective FIRM data for Santa Rosa County, Florida and Incorporated Areas Effective FIRM data for Okaloosa County, Florida and Incorporated Areas Santa Rosa County, Florida and Incorporated Areas of Flood Insurance Rate Map Author/Editor Santa Rosa County GIS U.S. Geological Survey Florida Department of Transportation National Oceanic and Atmospheric Administration US Fish and Wildlife Service US Census Bureau Federal Emergency Management Agency Federal Emergency Management Agency Federal Emergency Management Agency Place of Publication Publication Date/ Date of Issuance Link Milton, FL 09/06/ Reston, VA Tallahassee, FL Charleston, SC Falls Church, VA Washington, D.C Washington, D.C. Washington, D.C. Washington, D.C. 04/18/ yingandmapping/aerialmain.sh tm 05/10/ /24/ /13/ /19/ /29/ /06/
106 Table 33: Bibliography and References Citation in this FIS STUDY1 STUDY2 STUDY3 STUDY4 STUDY4 STUDY4 STUDY5 STUDY6 Publisher/ Issuer Federal Emergency Management Agency Federal Emergency Management Agency Federal Emergency Management Agency NWFWMD GIS Department Northwest Florida Water Management District Northwest Florida Water Management District GIS Department Federal Emergency Management Agency Federal Emergency Management Agency Publication Title, Article, Volume, Number, etc. FIRM Panel Layout for Santa Rosa County Revised and adjusted effective data for Santa Rosa County Modeling data for Santa Rosa County DEM Breakline features Modeling data DEM Modified transition zones Detailed coastal analysis using ADCIRC, CHAMP, TWA, CSHORE, and Runup 2.0 Author/Editor Federal Emergency Management Agency URS Corporation Southern URS Corporation Southern Northwest Florida Water Management District Federal Emergency Management Agency Northwest Florida Water Management District URS Corporation Southern Federal Emergency Management Agency Place of Publication Washington, D.C. Publication Date/ Date of Issuance Link 07/18/ Tampa, FL 07/18/ Tampa, FL 07/18/ Havana, FL Tampa, FL Havana, FL Tampa, FL 07/18/ Washington, D.C. 04/01/
107 Table 33: Bibliography and References Citation in this FIS STUDY7 STUDY8 TOPO1 Publisher/ Issuer Federal Emergency Management Agency Federal Emergency Management Agency Northwest Florida Water Management District Publication Title, Article, Volume, Number, etc. Modified transition zones using 2 models ICPR Modeling for Holley By The Sea Watershed Santa Rosa Mosaic DEM Author/Editor URS Corporation Southern Place of Publication Publication Date/ Date of Issuance Link Tampa, FL 07/18/ AECOM Tampa, FL 07/18/ Northwest Florida Water Management District Santa Rosa County 12/31/
108
109
110
111
112
113
114
115
116
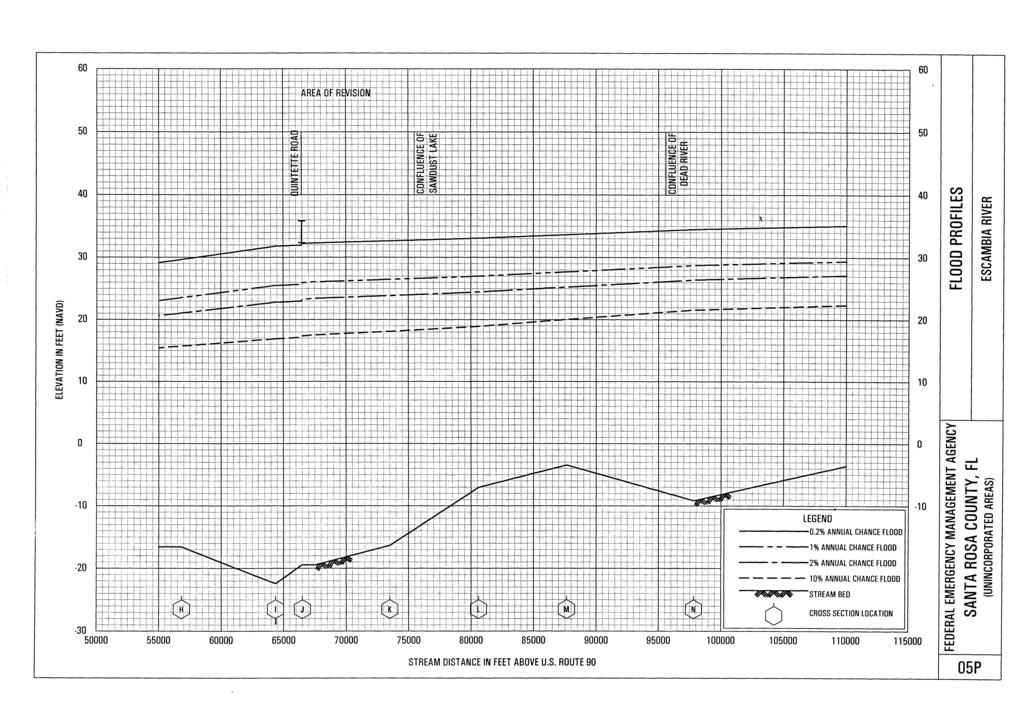
117
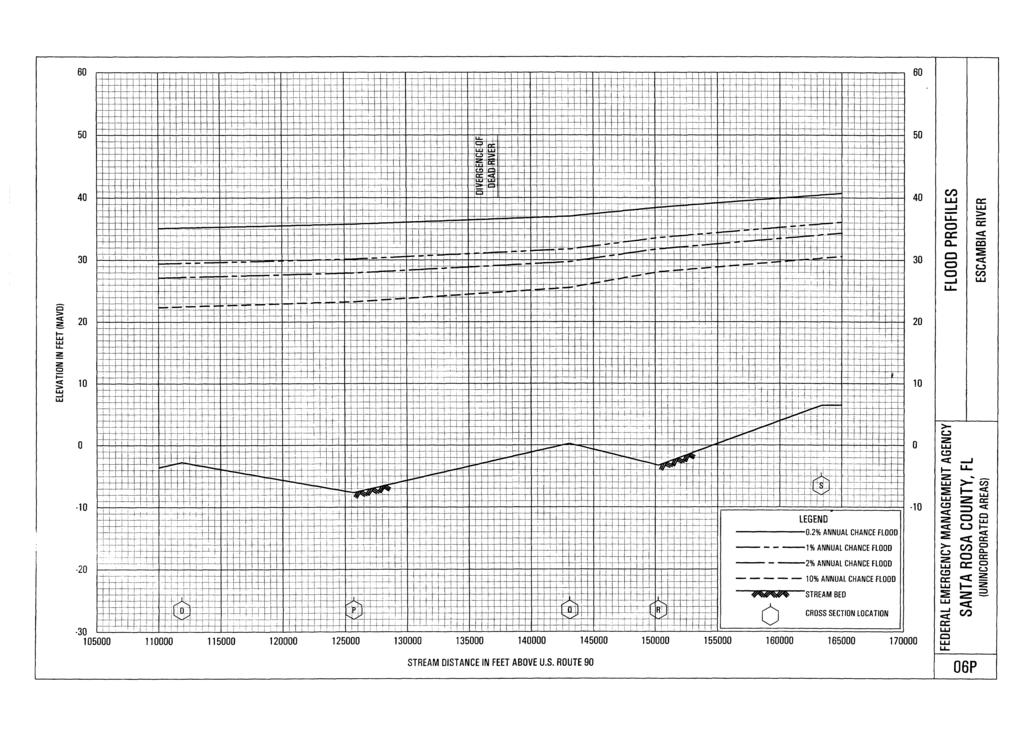
118
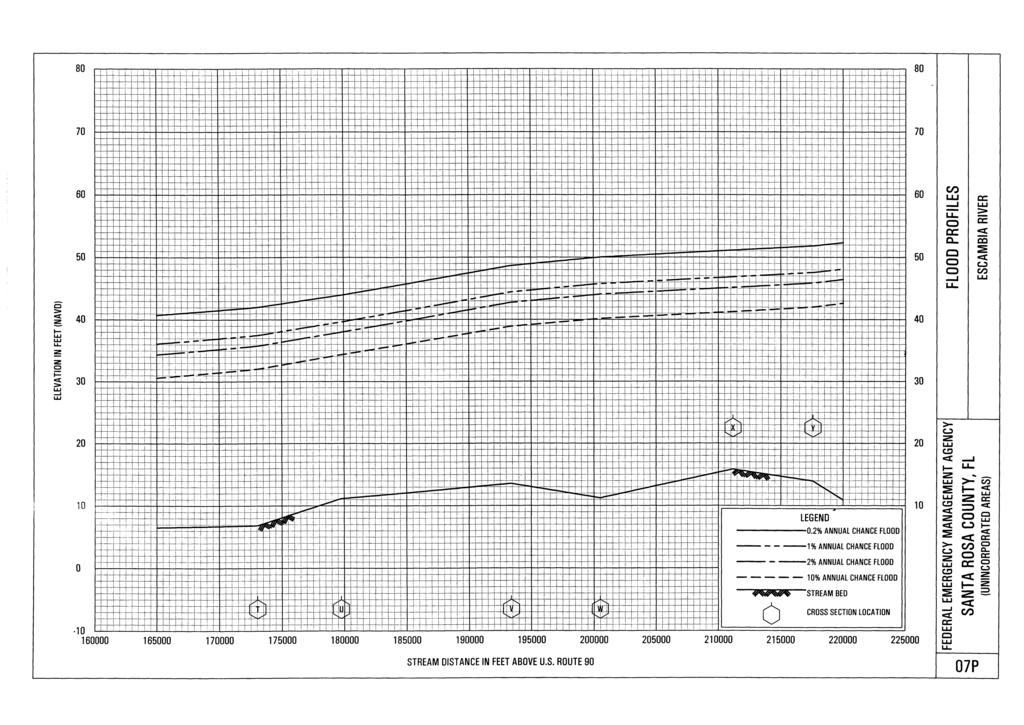
119
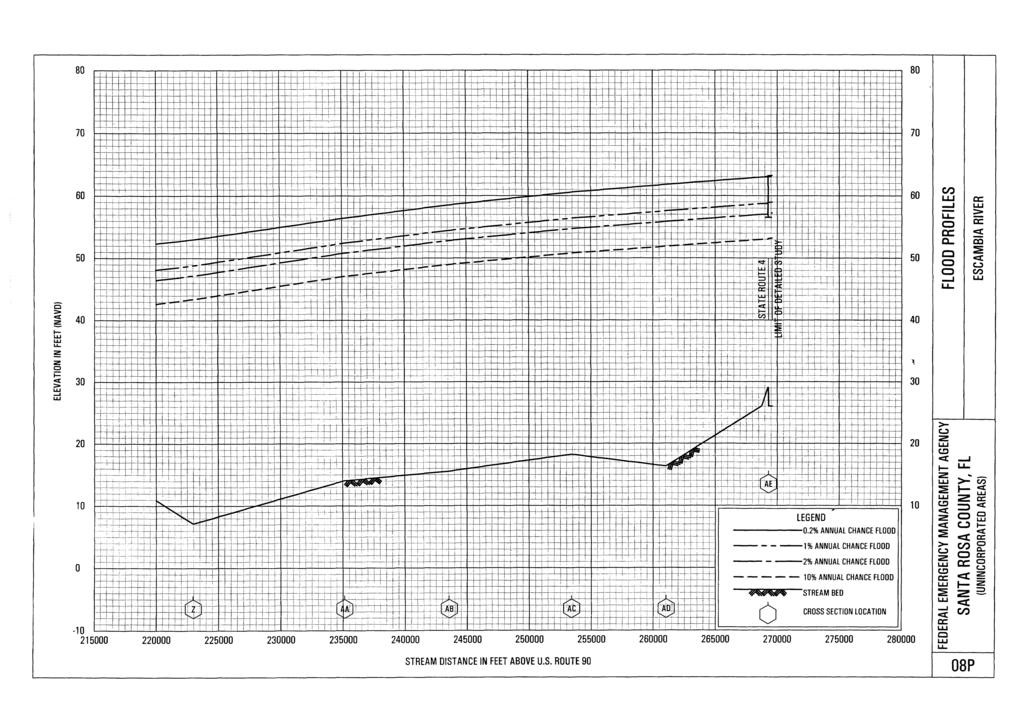
120
121
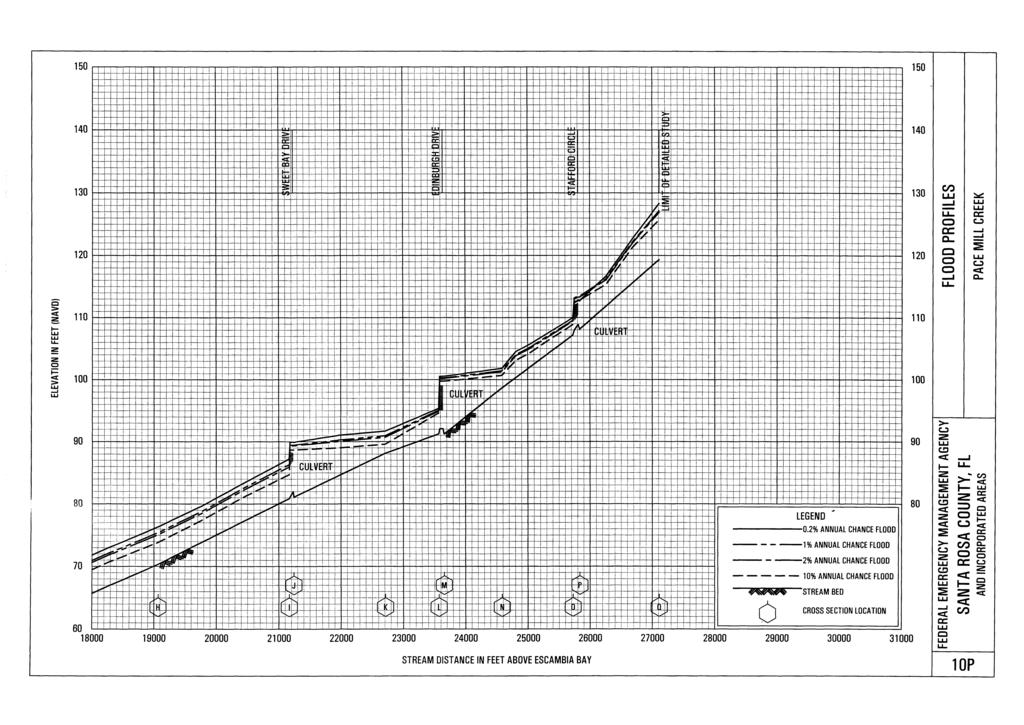
122
WALTON COUNTY, FLORIDA
 VOLUME 1 OF 1 WALTON COUNTY, FLORIDA AND INCORPORATED AREAS COMMUNITY NAME DEFUNIAK SPRINGS, CITY OF NUMBER 120318 FREEPORT, CITY OF 120319 PAXTON, TOWN OF 120423 WALTON COUNTY, UNINCORPORATED AREAS 120317
WASHINGTON COUNTY, MAINE (ALL JURISDICTIONS)
") VOLUME 1 OF 1 WASHINGTON COUNTY, MAINE (ALL JURISDICTIONS) COMMUNITY NAME CID COMMUNITY NAME CID TOWN OF ADDISON 230132 TOWNSHIP OF BROOKTON 230470 TOWN OF ALEXANDER 230303 CITY OF CALAIS 230134 TOWN OF
VOLUME 1 OF 1 WASHINGTON COUNTY, MAINE (ALL JURISDICTIONS) COMMUNITY NAME CID COMMUNITY NAME CID TOWN OF ADDISON 230132 TOWNSHIP OF BROOKTON 230470 TOWN OF ALEXANDER 230303 CITY OF CALAIS 230134 TOWN OF
VOLUME 1 OF 1 VOLUSIA COUNTY, FLORIDA AND INCORPORATED AREAS COMMUNITY NAME NUMBER COMMUNITY NAME NUMBER
 VOLUME 1 OF 1 VOLUSIA COUNTY, FLORIDA AND INCORPORATED AREAS COMMUNITY NAME NUMBER COMMUNITY NAME NUMBER DAYTONA BEACH, CITY OF 125099 DAYTONA BEACH SHORES, CITY OF NEW SMYRNA BEACH, CITY OF 125132 125100
VOLUME 1 OF 5 VOLUSIA COUNTY, FLORIDA AND INCORPORATED AREAS COMMUNITY NAME NUMBER COMMUNITY NAME NUMBER
 VOLUME 1 OF 5 VOLUSIA COUNTY, FLORIDA AND INCORPORATED AREAS COMMUNITY NAME NUMBER COMMUNITY NAME NUMBER DAYTONA BEACH, CITY OF 125099 DAYTONA BEACH SHORES, CITY OF NEW SMYRNA BEACH, CITY OF 125132 125100
Sussex County, DE Preliminary Study Overview
 Sussex County, DE Preliminary Study Overview Coastal study scope: 102 miles of entire County shoreline Revised 102 panels for coastal study Riverine study scope: 14 streams, 67.1 miles, within the Nanticoke
VOLUME 2 OF 5 VOLUSIA COUNTY, FLORIDA AND INCORPORATED AREAS COMMUNITY NAME NUMBER COMMUNITY NAME NUMBER
 VOLUME 2 OF 5 VOLUSIA COUNTY, FLORIDA AND INCORPORATED AREAS COMMUNITY NAME NUMBER COMMUNITY NAME NUMBER DAYTONA BEACH, CITY OF 125099 NEW SMYRNA BEACH, CITY OF 125132 DAYTONA BEACH SHORES, CITY OF 125100
Photo by: Darryl Hatheway, 2011
 Photo by: Darryl Hatheway, 2011 September 11, 2015 Presentation Discussion Examine PFD V-Zone Mapping in Wave Runup Dominated West Coast Application of PFD V-Zone Mapping Criteria in Pacific G&S PFD V-Zone
MADISON COUNTY, ILLINOIS AND INCORPORATED AREAS
 VOLUME 2 OF 2 MADISON COUNTY, ILLINOIS AND INCORPORATED AREAS * * * COMMUNITY COMMUNITY NAME NUMBER ALHAMBRA, VILLAGE OF 170270 ALTON, CITY OF 170437 BETHALTO, VILLAGE OF 170438 COLLINSVILLE, CITY OF 170439
2016 NC Coastal Local Governments Annual Meeting
 2016 NC Coastal Local Governments Annual Meeting Coastal Flood Study Modeling and Mapping 101 April 21, 2016 Tom Langan, PE, CFM Engineering Supervisor NCEM Floodplain Mapping Program FEMA Coastal Flood
Evaluation of June 9, 2014 Federal Emergency Management Agency Flood Insurance Study for Town of Weymouth, Norfolk, Co, MA
 Evaluation of June 9, 2014 Federal Emergency Management Agency Flood Insurance Study for Town of Weymouth, Norfolk, Co, MA Prepared For: Woodard & Curran 95 Cedar Street, Suite 100 Providence, RI 02903
Baraga County, MI Coastal Hazard Analysis Flood Risk Review Meeting. July 12, 2018
 Baraga County, MI Coastal Hazard Analysis Flood Risk Review Meeting July 12, 2018 Agenda Introductions Coastal Flood Risk Study and Mapping Program Current Status Technical Overview of Study and Mapping
St. Louis County, MN Coastal Hazard Analysis Flood Risk Review Meeting. May 2, 2018
 St. Louis County, MN Coastal Hazard Analysis Flood Risk Review Meeting May 2, 2018 Agenda Introductions Coastal Flood Risk Study and Mapping Program Current Status Technical Overview of Study and Mapping
Bay County, MI Coastal Hazard Analysis Flood Risk Review Meeting. May 14, 2018
 Bay County, MI Coastal Hazard Analysis Flood Risk Review Meeting May 14, 2018 Agenda Introductions Coastal Flood Risk Study and Mapping Program Current Status Technical Overview of Study and Mapping Floodplain
Door County, WI Coastal Hazard Analysis Flood Risk Review Meeting. August 21, 2017
 Door County, WI Coastal Hazard Analysis Flood Risk Review Meeting August 21, 2017 Agenda Introductions Coastal Flood Risk Study and Mapping Program Current Status Technical Overview of Study and Mapping
Bayfield & Ashland Counties, WI Coastal Hazard Analysis Flood Risk Review Meeting. June 05, 2018
 Bayfield & Ashland Counties, WI Coastal Hazard Analysis Flood Risk Review Meeting June 05, 2018 Agenda Introductions Coastal Flood Risk Study and Mapping Program Current Status Technical Overview of Study
Citrus, Hernando, and Pasco Coastal Hazard Analysis. Flood Risk Review Meeting Citrus, Hernando, and Pasco Counties, Florida December 14, 2017
 Citrus, Hernando, and Pasco Coastal Hazard Analysis Flood Risk Review Meeting Citrus, Hernando, and Pasco Counties, Florida December 14, 2017 Introductions Risk MAP Project Team FEMA Region IV RAMPP (study
Technical Report Culvert A Hydraulic Analysis
 DATE: November 3, 2011 Technical Report Culvert A Hydraulic Analysis TO: FROM: RE: Jim Reiser, P.E. Project Manager Parsons Brinckerhoff, Inc. Kurt Killian, P.E., CFM Parsons Brinckerhoff, Inc. Design
WMS 8.4 Tutorial Hydraulics and Floodplain Modeling HY-8 Modeling Wizard Learn how to model a culvert using HY-8 and WMS
 v. 8.4 WMS 8.4 Tutorial Hydraulics and Floodplain Modeling HY-8 Modeling Wizard Learn how to model a culvert using HY-8 and WMS Objectives Define a conceptual schematic of the roadway, invert, and downstream
JEFFERSON COUNTY, ARKANSAS AND INCORPORATED AREAS
 JEFFERSON COUNTY, ARKANSAS Community Name Community Number ALTHEIMER, CITY OF 050107 HUMPHREY, CITY OF 050108 JEFFERSON COUNTY 050440 (UNINCORPORATED AREAS) PINE BLUFF, CITY OF 050109 REDFIELD, CITY OF
OFFICE OF STRUCTURES MANUAL FOR HYDROLOGIC AND HYDRAULIC DESIGN CHAPTER 11 APPENDIX B TIDEROUT 2 USERS MANUAL
 OFFICE OF STRUCTURES MANUAL FOR HYDROLOGIC AND HYDRAULIC DESIGN CHAPTER 11 APPENDIX B TIDEROUT 2 USERS MANUAL APRIL 2011 APRIL 2011 Page 1 Preface TIDEROUT 2, Build 1.22 dated June 29, 2006 is the current
Physical Map Revisions in Connecticut due to Updated Coastal Flood Hazards F8: Maps in Transition
 Physical Map Revisions in Connecticut due to Updated Coastal Flood Hazards F8: Maps in Transition Brian Caufield, P.E., CFM Principal Engineer CDM Smith Kerry Bogdan, CFM Senior Engineer FEMA Region I
Federal Emergency Management Agency FLOOD INSURANCE STUDY NUMBER 48423CV001B. Smith County. Preliminary May 9, 2011
 VOLUME 1 of 2 SMITH COUNTY, TEXAS Community Name Community Number Smith County ARP, CITY OF 480567 BULLARD, CITY OF* 480568 HIDEAWAY, CITY OF 480200 LINDALE, CITY OF 480569 NEW CHAPEL HILL, CITY OF 480157
The History of Coastal Flood Hazard Assessments in the Great Lakes
 The History of Coastal Flood Hazard Assessments in the Great Lakes Brian A. Caufield, P.E., CFM June 23, 2016 2 The Great Lakes Some Statistics Courtesy of Great Lakes Information Network One-fifth of
VOLUME 4 OF 6 LOS ANGELES COUNTY, CALIFORNIA AND INCORPORATED AREAS
 VOLUME 4 OF 6 LOS ANGELES COUNTY, CALIFORNIA AND INCORPORATED AREAS COMMUNITY NAME NUMBER COMMUNITY NAME NUMBER LOS ANGELES COUNTY UNINCORPORATED AREAS 065043 CITY OF CLAREMONT* 060109 CITY OF AGOURA HILLS
ADDENDA B Hydrologic and Hydraulic (H&H) Study Guidance 2019
 Study Guidance 2019") 09/25/2018 DRAFT FEMA Region I PA H&H Study ADDENDA B Hydrologic and Hydraulic (H&H) Study Guidance 2019 Region I Federal Emergency Management Agency (FEMA) Public Assistance Hydrologic and Hydraulic (H&H)
09/25/2018 DRAFT FEMA Region I PA H&H Study ADDENDA B Hydrologic and Hydraulic (H&H) Study Guidance 2019 Region I Federal Emergency Management Agency (FEMA) Public Assistance Hydrologic and Hydraulic (H&H)
GALLATIN COUNTY, MONTANA AND INCORPORATED AREAS
 GALLATIN COUNTY, MONTANA AND INCORPORATED AREAS Community Name Community Number * BELGRADE, CITY OF 300105 BOZEMAN, CITY OF 300028 GALLATIN COUNTY UNINCORPORATED AREAS 300027 * MANHATTAN, TOWN OF 300034
NORFOLK COUNTY, MASSACHUSETTS (ALL JURISDICTIONS)
") NORFOLK COUNTY, MASSACHUSETTS (ALL JURISDICTIONS) Volume 4 of 4 COMMUNITY NAME COMMUNITY NUMBER AVON, TOWN OF 250231 BELLINGHAM, TOWN OF 250232 BRAINTREE, TOWN OF 250233 BROOKLINE, TOWN OF 250234 CANTON,
NORFOLK COUNTY, MASSACHUSETTS (ALL JURISDICTIONS) Volume 4 of 4 COMMUNITY NAME COMMUNITY NUMBER AVON, TOWN OF 250231 BELLINGHAM, TOWN OF 250232 BRAINTREE, TOWN OF 250233 BROOKLINE, TOWN OF 250234 CANTON,
VOLUME 1 OF 6 LOS ANGELES COUNTY, CALIFORNIA AND INCORPORATED AREAS
 VOLUME 1 OF 6 LOS ANGELES COUNTY, CALIFORNIA AND INCORPORATED AREAS COMMUNITY NAME NUMBER COMMUNITY NAME NUMBER LOS ANGELES COUNTY UNINCORPORATED AREAS 065043 CITY OF CLAREMONT* 060109 CITY OF AGOURA HILLS
Boothbay Harbor Rotary Club May 12, 2016
 Mapping Potential Sea Level Rise and Storm Surge in Boothbay Harbor, ME Boothbay Harbor Rotary Club May 12, 2016 Peter A. Slovinsky, Marine Geologist Maine Geological Survey S.M. Dickson, MGS Quickly,
MONTGOMERY COUNTY, TEXAS AND INCORPORATED AREAS VOLUME 2 OF 6
 MONTGOMERY COUNTY, TEXAS AND INCORPORATED AREAS VOLUME 2 OF 6 COMMUNITY NAME COMMUNITY NUMBER CONROE, CITY OF 480484 CUT AND SHOOT, CITY OF 481279 HOUSTON, CITY OF 480296 MAGNOLIA, CITY OF 481261 MONTGOMERY,
Plan B Dam Breach Assessment
 Plan B Dam Breach Assessment Introduction In support of the Local Sponsor permit applications to the states of Minnesota and North Dakota, a dam breach analysis for the Plan B alignment of the Fargo-Moorhead
SUSSEX COUNTY, DELAWARE AND INCORPORATED AREAS
 VOLUME 1 OF 3 SUSSEX COUNTY, DELAWARE AND INCORPORATED AREAS COMMUNITY COMMUNITY NUMBER COMMUNITY COMMUNITY NUMBER BETHANY BEACH, TOWN OF 105083 LAUREL, TOWN OF 100040 BETHEL, TOWN OF 100055 LEWES, CITY
Flood Insurance Study
 Flood Insurance Study Tulsa County, Oklahoma and Incorporated Areas VOLUME 6 of 7 COMMUNITY NAME COMMUNITY NO. Bixby, City of 400207 Broken Arrow, City of 400236 Collinsville, City of 400360 Glenpool,
VIRGINIA SOIL AND WATER CONSERVATION BOARD GUIDANCE DOCUMENT ON DAM BREAK INUNDATION ZONE AND INCREMENTAL DAMAGE ANALYSIS AND MAPPING PROCEDURES
 (Approved XXXXX, 2010) Working Draft Version January 14, 2010 VIRGINIA SOIL AND WATER CONSERVATION BOARD GUIDANCE DOCUMENT ON DAM BREAK INUNDATION ZONE AND INCREMENTAL DAMAGE ANALYSIS AND MAPPING PROCEDURES
Flood Insurance Study
 Flood Insurance Study Tulsa County, Oklahoma and Incorporated Areas VOLUME 5 of 7 COMMUNITY NAME COMMUNITY NO. Bixby, City of 400207 Broken Arrow, City of 400236 Collinsville, City of 400360 Glenpool,
KENT COUNTY, DELAWARE AND INCORPORATED AREAS
 This preliminary FIS report only includes revised Floodway Data Tables and revised Flood Profiles. The unrevised components will appear in the final FIS report. KENT COUNTY, DELAWARE AND INCORPORATED AREAS
UPPER BEACH REPLENISHMENT PROJECT RELATED
 ASSESSMENT OF SAND VOLUME LOSS at the TOWNSHIP of UPPER BEACH REPLENISHMENT PROJECT RELATED to the LANDFALL OF HURRICANE SANDY - PURSUANT TO NJ-DR 4086 This assessment is in response to Hurricane Sandy
PROFILE OF SACRAMENTO RIVER, FREEPORT TO VERONA, CALIFORNIA,
 PROFILE OF SACRAMENTO RIVER, FREEPORT TO VERONA, CALIFORNIA, FLOOD OF FEBRUARY 1986 By J.C. Blodgett and J.B. Lucas U.S. GEOLOGICAL SURVEY Open-File Report 88-82 CO CM I m r-h CM Sacramento, California
APPENDIX C. Fluvial and Tidal Hydraulics Report
 APPENDIX C Fluvial and Tidal Hydraulics Report BUENA VISTA LAGOON ENHANCEMENT PROJECT FLUVIAL AND TIDAL HYDRAULICS ANALYSES Prepared for: SANDAG 401 B Street, Suite 800 San Diego, California 92101 Contact:
U.S. Army Engineer Institute for Water Resources
 Sea Level Change Curve Calculator (2014.88) (DRAFT) U.S. Army Engineer Institute for Water Resources Table of Contents 1. INTRODUCTION... 2 1.1 BACKGROUND... 2 1.1.1 INFORMATION QUALITY ACT... 2 1.2 OVERVIEW...
HURRICANE SANDY LIMITED REEVALUATION REPORT UNION BEACH, NEW JERSEY DRAFT ENGINEERING APPENDIX SUB APPENDIX D SBEACH MODELING
 HURRICANE SANDY LIMITED REEVALUATION REPORT UNION BEACH, NEW JERSEY DRAFT ENGINEERING APPENDIX SUB APPENDIX D SBEACH MODELING Rev. 18 Feb 2015 1 SBEACH Modeling 1.0 Introduction Following the methodology
PALM BEACH COUNTY, FLORIDA AND INCORPORATED AREAS
 PALM BEACH COUNTY, FLORIDA AND INCORPORATED AREAS Palm Beach County Community Name Community Number PALM BEACH COUNTY (UNINCORPORATED AREAS) 120192 ATLANTIS, CITY OF 120193 BELLE GLADE, CITY OF 120194
FEMA Region V. Great Lakes Coastal Flood Study. Pilot Study Webinar. Berrien County, Michigan. February 26, 2014
 FEMA Region V Great Lakes Coastal Flood Study Pilot Study Webinar Berrien County, Michigan February 26, 2014 2 Pilot Study Webinar Agenda Great Lakes Coastal Flood Study Background Demonstration Project
2017 Preliminary FEMA Flood Maps Old Orchard Beach Town Council Meeting. Old Orchard Beach, Town Hall July 18, 2017
 2017 Preliminary FEMA Flood Maps Old Orchard Beach Town Council Meeting Old Orchard Beach, Town Hall July 18, 2017 Overview Potential impacts of inaccurate Flood Insurance Rate Maps (FIRM) Why is appealing
Monterey County December 3, 2014
 Flood Risk Review Meeting: Open Pacific Coast Study Monterey County December 3, 2014 Welcome and Introductions Flood Risk Review Meeting Monterey County California Coastal Analysis and Mapping Project
STUDY REPORT W&AR-03 RESERVOIR TEMPERATURE MODEL ATTACHMENT B DON PEDRO RESERVOIR BATHYMETRIC STUDY REPORT
 STUDY REPORT W&AR-03 RESERVOIR TEMPERATURE MODEL ATTACHMENT B DON PEDRO RESERVOIR BATHYMETRIC STUDY REPORT DON PEDRO RESERVOIR BATHYMETRIC STUDY REPORT Prepared for: TURLOCK IRRIGATION DISTRICT MODESTO
Technical Brief - Wave Uprush Analysis Island Harbour Club, Gananoque, Ontario
 Technical Brief - Wave Uprush Analysis RIGGS ENGINEERING LTD. 1240 Commissioners Road West Suite 205 London, Ontario N6K 1C7 October 31, 2014 Table of Contents Section Page Table of Contents... i List
Ventura County. Open Pacific Coast Study. California Coastal Analysis and Mapping Project
 Ventura County Open Pacific Coast Study California Coastal Analysis and Mapping Project December 2011 Project Name: Meeting: Date and Time: Location: California Coastal Analysis and Mapping Project (CCAMP)/Open
SACO RIVER AND CAMP ELLIS BEACH SACO, MAINE SECTION 111 SHORE DAMAGE MITIGATION PROJECT APPENDIX F ECONOMIC ASSESSMENT
 SACO RIVER AND CAMP ELLIS BEACH SACO, MAINE SECTION 111 SHORE DAMAGE MITIGATION PROJECT APPENDIX F ECONOMIC ASSESSMENT Department of the Army New England District, Corps of Engineers 696 Virginia Road
SPO Regional Challenge Grant Creation of a Sea Level Adaption Working Group for Biddeford, Saco, OOB and Scarborough J.T. Lockman, AICP, Planning
 SPO Regional Challenge Grant Creation of a Sea Level Adaption Working Group for Biddeford, Saco, OOB and Scarborough J.T. Lockman, AICP, Planning Director Southern Maine Regional Planning Commission jlockman@smrpc.org
City of Del Mar Local Coastal Plan (LCP) Amendment for Sea Level Rise and Coastal Flooding
 Amendment for Sea Level Rise and Coastal Flooding") City of Del Mar Local Coastal Plan (LCP) Amendment for Sea Level Rise and Coastal Flooding 6/22/17 Presentation to Sea Level Rise Stakeholder- Technical Advisory Committee (STAC) Nick Garrity, P.E. Lindsey
City of Del Mar Local Coastal Plan (LCP) Amendment for Sea Level Rise and Coastal Flooding 6/22/17 Presentation to Sea Level Rise Stakeholder- Technical Advisory Committee (STAC) Nick Garrity, P.E. Lindsey
APPENDIX D-2. Sea Level Rise Technical Memo
 APPENDIX D-2 Sea Level Rise Technical Memo 2185 N. California Blvd., Suite 500 Walnut Creek, CA 94596 (925) 944-5411 Fax: (925) 944-4732 www.moffattnichol.com DRAFT MEMORANDUM To: From: Neil Nichols,
San Luis Obispo County December 2, 2014
 Flood Risk Review Meeting: Open Pacific Coast Study San Luis Obispo County December 2, 2014 Welcome and Introductions Flood Risk Review Meeting San Luis Obispo County California Coastal Analysis and Mapping
APPENDIX J HYDROLOGY AND WATER QUALITY
 APPENDIX J HYDROLOGY AND WATER QUALITY J-1 Technical Report on Airport Drainage, Northern Sector Airport and Ordinance Creek Watershed / Preliminary Creek Constructed Natural Channel Culvert J-2 Preliminary
Open Pacific Coast Study. California Coastal Analysis and Mapping Project
 Open Pacific Coast Study California Coastal Analysis and Mapping Project September 2012 California Open Coast Counties California Coastal Analysis and Mapping Project This publication is an initiative
Figure 1 GE image of the Costa Sur & EcoEléctrica power plants, located inside Guayanilla and Tallaboa bay.
 1 7 - STORM SURGES IN PUERTO RICO_Power Plants-Costa Sur & EcoElectrica Costa Sur & EcoEléctrica Figure 1 shows a GE image of the Costa Sur (Guayanilla) and EcoElectrica site. Figure 2 shows the topographic
Federal Emergency Management Agency
 Page 1 of 5 Date: May 31, 2012 COMMUNITY AND MAP PANEL INFORMATION COLLIER COUNTY, FLORIDA (Unincorporated Areas) LEGAL PROPERTY DESCRIPTION Multiple Properties, all recorded in the Office of the Clerk
Red River Basin and FM Diversion Hydrology. North Dakota Water Education Foundation Executive Briefing July 13, 2012
 Red River Basin and FM Diversion Hydrology North Dakota Water Education Foundation Executive Briefing July 13, 2012 Red River Basin Total Drainage Area: 45,000 square miles North Dakota Fargo, ND Moorhead,
Interim Guidance Fish Presence Absence
 Interim Guidance Fish Presence Absence Source: Forest Practices Act Guidance for Division 635 of the forest practices act dealing with stream classification when no fish surveys have been done (referenced
DELAWARE S VULNERABLE COASTAL AREAS. DELAWARE INLAND BAYS and DELAWARE BAY RECONNAISSANCE STUDY
 DELAWARE S VULNERABLE COASTAL AREAS and the DELAWARE INLAND BAYS and DELAWARE BAY RECONNAISSANCE STUDY Kimberly K. McKenna, PG Delaware Dept. of Natural Resources & Environmental Control Division of Watershed
GONE! Coastal Erosion Happens During Storms! Why Worry About Coastal Setbacks? Goals for Today
 RI Regulatory Setbacks & Buffers: Coastal Zone Management Issues New England Onsite Wastewater Training Program @ URI OWT 155 November 21, 2013 Goals for Today Understand the impacts of storms, coastal
La Crescent Township Zoning Ordinance
 La Crescent Township Zoning Ordinance Table of Contents SECTION 1 ~ PREAMBLE, TITLE, SHORT TITLE AND PURPOSE... 1 0101 Preamble... 1 0102 Title... 1 0103 Short Title... 1 0104 Purpose... 1 SECTION 2 ~
We Make a Difference. New Maps, Now What? Updated Coastal Flood Hazard Information for Southern Georgia
 New Maps, Now What? Updated Coastal Flood Hazard Information for Southern Georgia New Maps, Now What? Risk MAP Project Team FEMA Region IV BakerAECOM, FEMA Mapping Partner GA DNR (CTP) NEFL Duval Flagler
LOCAL COASTAL PROGRAM UPDATE
 LOCAL COASTAL PROGRAM UPDATE Agenda Meeting #1 General Information (1 1:45 pm) Introductions and Background Grants involved What is a Local Coastal Program? What is required? LCP Update tasks and schedule
Juneau Douglas Harbor
 Juneau Douglas Harbor Douglas Harbor Page 2 of 8 Condition of Improvements 31 December 2015 Douglas Harbor, Alaska (CWIS No. 072789, 180942) Authorization Rivers and Harbors Act, 3 July 1958 (House Doc.
RI Regulatory Setbacks & Buffers: Coastal Management Issues
 RI Regulatory Setbacks & Buffers: Coastal Management Issues New England Onsite Wastewater Training Program @ URI OWT 155 - November 29, 2012 James Boyd - Coastal Policy Analyst Photo: October 30, 2012
SURGE SUPPRESSION ACHIEVED BY DIFFERENT COASTAL SPINE (IKE DIKE) ALIGNMENTS. Bruce A. Ebersole, Thomas W. Richardson and Robert W.
 ALIGNMENTS. Bruce A. Ebersole, Thomas W. Richardson and Robert W.") SURGE SUPPRESSION ACHIEVED BY DIFFERENT COASTAL SPINE (IKE DIKE) ALIGNMENTS Abstract Bruce A. Ebersole, Thomas W. Richardson and Robert W. Whalin, Jackson State University, Jackson, Mississippi The primary
SURGE SUPPRESSION ACHIEVED BY DIFFERENT COASTAL SPINE (IKE DIKE) ALIGNMENTS Abstract Bruce A. Ebersole, Thomas W. Richardson and Robert W. Whalin, Jackson State University, Jackson, Mississippi The primary
Currents measurements in the coast of Montevideo, Uruguay
 Currents measurements in the coast of Montevideo, Uruguay M. Fossati, D. Bellón, E. Lorenzo & I. Piedra-Cueva Fluid Mechanics and Environmental Engineering Institute (IMFIA), School of Engineering, Research
Hydraulic Modeling of Stream Enhancement Methods
 Hydraulic Modeling of Stream Enhancement Methods Matthew J. Curry John J. Levitsky Abstract Development within watersheds increases the amounts of runoff causing stream erosion and degradation of stream
Klickitat County Shoreline Master Program Update. Open House March 15, 2017
 Klickitat County Shoreline Master Program Update Open House March 15, 2017 Agenda 6:00 6:10 Welcome 6:10 6:40 Presentation SMP Update Process Shoreline Analysis review 6:40 8:00 Open House Topics SMP Process
New Jersey Coastal Zone Overview. The New Jersey Beach Profile Network (NJBPN) 3 Dimensional Assessments. Quantifying Shoreline Migration
 3 Dimensional Assessments. Quantifying Shoreline Migration") New Jersey Coastal Zone Overview The New Jersey Beach Profile Network (NJBPN) Objectives Profile Locations Data Collection Analyzing NJBPN Data Examples 3 Dimensional Assessments Methodology Examples Quantifying
New Jersey Coastal Zone Overview The New Jersey Beach Profile Network (NJBPN) Objectives Profile Locations Data Collection Analyzing NJBPN Data Examples 3 Dimensional Assessments Methodology Examples Quantifying
FEMA West Coast Sea Level Rise Pilot Study
 FEMA West Coast Sea Level Rise Pilot Study Ed Curtis, P.E., CFM FEMA Region IX June 4, 2014 Presentation Objectives Present the goals of the FEMA West Coast Sea Level Rise Pilot Study Review the SLR Pilot
Encampment River-Elk River drainage divide area landform origins along USA Missouri River drainage basin landform origins research project
 10/5/12 7:30 PM Encampment River-Elk River drainage divide area landform origins along the continental divide in the Wyoming and Colorado Sierra Madre Mountains and Park Range, USA October 5, 2012! Colorado,
North Platte River-Little Snake River drainage divide area landform origi s, USA Missouri River drainage basin landform origins research project
 North Platte River-Little Snake River drainage divide area landform origins along the continental divide in the Wyoming and Colorado Sierra Madre Mountains, USA October 3, 2012! Colorado, east-west continental
DRAFT. October 17, 2014 File No Mr. Brendhan Zubricki Town Administrator Essex Town Hall 30 Martin Street Essex, MA.
 GZA GeoEnvironmental, Inc. Engineers and Scientists October 17, 2014 File No. 18.0171857.00 Mr. Brendhan Zubricki Town Administrator Essex Town Hall 30 Martin Street Essex, MA. 01929 DRAFT Re: Essex River
CALCASIEU SALINITY STRUCTURES. HYDRODYNAMIC MODELING (To Support Design of Salinity Barriers)
") CALCASIEU SALINITY STRUCTURES HYDRODYNAMIC MODELING (To Support Design of Salinity Barriers) Presentation Overview 1 2 3 4 5 Project Overview and CEA Circulation Modeling Vessel Hydrodynamics Modeling
CALCASIEU SALINITY STRUCTURES HYDRODYNAMIC MODELING (To Support Design of Salinity Barriers) Presentation Overview 1 2 3 4 5 Project Overview and CEA Circulation Modeling Vessel Hydrodynamics Modeling
Multi-Jurisdictional Hazard Mitigation Plan
 Flooding General Flooding is the leading cause of death among all types of natural disasters throughout the United States, with its ability to roll boulders the size of cars, tear out trees, and destroy
Hydrologic Feasibility of Storm Surge Barriers
 Hydrologic Feasibility of Storm Surge Barriers Malcolm J. Bowman, School of Marine and Atmospheric Sciences State University of New York, Stony Brook, NY. Presented at Against the Deluge: Storm Surge Barriers
Technical Brief - Wave Uprush Analysis 129 South Street, Gananoque
 Technical Brief - Wave Uprush Analysis 129 South Street, Gananoque RIGGS ENGINEERING LTD. 1240 Commissioners Road West Suite 205 London, Ontario N6K 1C7 June 12, 2013 Table of Contents Section Page Table
USING A LABYRINTH WEIR TO INCREASE HYDRAULIC CAPACITY. Dustin Mortensen, P.E. 1 Jake Eckersley, P.E. 1
 USING A LABYRINTH WEIR TO INCREASE HYDRAULIC CAPACITY Dustin Mortensen, P.E. 1 Jake Eckersley, P.E. 1 Plum Creek Floodwater Retarding Structure No. 6 is located in an area of Kyle, Texas, that is currently
NEED FOR SUPPLEMENTAL BATHYMETRIC SURVEY DATA COLLECTION
 305 West Grand Avenue, Suite 300 Montvale, New Jersey 07645 Phone 201.930.9890 Fax 201.930.9805 www.anchorqea.com M EMORANDUM To: Caroline Kwan and Nica Klaber U.S. Environmental Protection Agency Region
Appendix M: Durras Lake Tailwater Conditions
 Appendix M: Durras Lake Tailwater Conditions M.1 Preamble WRL has completed a tailwater condition assessment for the entrance to Durras Lake, to be used as an ocean boundary condition for a future flood
Trout Unlimited Comments on the Scope of Environmental Impact Statement for the Constitution Pipeline Project, Docket No. PF12-9
 October 9, 2012 Kimberly D. Bose, Secretary Federal Energy Regulatory Commission 888 First Street, NE, Room 1A Washington, DC 20426 RE: Trout Unlimited Comments on the Scope of Environmental Impact Statement
North Shore of Long Island, Feasibility Study
 North Shore of Long Island, Asharoken New York Asharoken, Feasibility Study Asharoken, NY Public Meeting June 30, 2015 US Army Corps of Engineers US Army Corps of Engineers New York BUILDING STRONG BUILDING
NORTH CAROLINA FLOODPLAIN MAPPING PROGRAM COOPERATING TECHNICAL STATE
 NORTH CAROLINA FLOODPLAIN MAPPING PROGRAM COOPERATING TECHNICAL STATE FINAL BASIN PLAN WATAUGA RIVER BASIN Prepared by the: State of North Carolina and the Federal Emergency Management Agency December
New Orleans Municipal Yacht Harbor
 New Orleans Municipal Yacht Harbor Marina Schematic Design Update 601 Poydras St., Suite 1860 New Orleans, LA, 70130 504-648-3560 Post-Katrina Municipal Yacht Harbor: Introduction The MYH was an approximate
HISTORY OF CONSTRUCTION
 HISTORY OF CONSTRUCTION CFR 257.73(c)(1) West Boiler Slag Pond Clifty Creek Plant Madison, Indiana October, 2016 Prepared for: Indiana Kentucky Electric Corporation Prepared by: American Electric Power
HYDROLOGIC AND HYDRAULIC REPORT PROPOSED CULVERT STRUCTURES SR 194, SECTION 10
 HYDROLOGIC AND HYDRAULIC REPORT PROPOSED CULVERT STRUCTURES SR 194, SECTION 10 RACETRACK ROAD CULVERT OVER THE SPRING RUN & GREEN SPRINGS ROAD CULVERT OVER AN UNNAMED TRIBUTARY TO SPRING RUN BERWICK TOWNSHIP
Total Suspended Solids, Stable Flow, and Wet Weather Event Monitoring in the Bass River Watershed. December The Cadmus Group, Inc.
 Total Suspended Solids, Stable Flow, and Wet Weather Event Monitoring in the Bass River Watershed December 2004 The Cadmus Group, Inc. Grand Valley State University Annis Water Resources Institute Submitted
Distribution Restriction Statement Approved for public release; distribution is unlimited.
 CECW-EH Engineer Regulation 1110-2-1451 Department of the Army U.S. Army Corps of Engineers Washington, DC 20314-1000 Engineering and Design ACQUISITION OF LANDS DOWNSTREAM FROM SPILLWAYS FOR HYDROLOGIC
Culvert Design for Low and High Gradient Streams in the Midwest. Dale Higgins, Hydrologist Chequamegon-Nicolet National Forest
 Culvert Design for Low and High Gradient Streams in the Midwest Dale Higgins, Hydrologist Chequamegon-Nicolet National Forest Overview Culvert Design Considerations Hydraulic Terms Culvert Impacts Low
Assessment of Baseline Geomorphic Features at. Proposed Stream Crossings On The Proposed County Road 595. Marquette County, Michigan
 Assessment of Baseline Geomorphic Features at Proposed Stream Crossings On The Proposed County Road 595 Marquette County, Michigan Prepared for: Kennecott Eagle Minerals Company Marquette, Michigan Prepared
ST LEONARDS COASTAL HAZARD VULNERABILITY ASSESSMENT
 Level 12, 333 Collins Street Melbourne VIC 3000 Australia Telephone: +61 3 8676 3500 Facsimile: +61 3 8676 3505 www.worleyparsons.com WorleyParsons Services Pty Ltd ABN 61 001 279 812 23 November 2011
FISH PASSAGE IMPROVEMENT in California s Watersheds. Assessments & Recommendations by the Fish Passage Forum
 FISH PASSAGE IMPROVEMENT in California s Watersheds Assessments & Recommendations by the Fish Passage Forum FISH PASSAGE IMPROVEMENT in California s Watersheds The mission of the Fish Passage Forum is
Hard Hat Services ph: hardhatinc.com 932 N. Wright St., Suite 160 Naperville, IL 60563
 Interstate Power and Light Company Ottumwa Generation Station CCR Surface Impoundment Annual Inspection Report 154.018.015.003 Report issued: July 03, 2017 Hard Hat Services ph: 877-630-7428 hardhatinc.com
Figure 1 Example feature overview.
 1. Introduction This case focuses on the northeastern region of Onslow Bay, NC, and includes an initial shoreline, regional contour, wave gauges, inlets, dredging, and beach fills. Most of the features
SUPPLEMENTAL DOCUMENT SEA LEVEL RISE SCENARIO SELECTION AND DESIGN TIDE CALCULATION
 SUPPLEMENTAL DOCUMENT SEA LEVEL RISE SCENARIO SELECTION AND DESIGN TIDE CALCULATION FOR THE GUIDANCE FOR INCORPORATING SEA LEVEL RISE INTO CAPITAL PLANNING IN SAN FRANCISCO: ASSESSING VULNERABILITY AND
Creek Trash Assessment (CTA) Methodology (Demonstration: Mill Run Creek, Cheltenham, Pa.)
 Methodology (Demonstration: Mill Run Creek, Cheltenham, Pa.)") Creek Trash Assessment (CTA) Methodology (Demonstration: Mill Run Creek, Cheltenham, Pa.) Mill Run Creek emerges from a storm sewer in Philadelphia to an open creek in Cheltenham. The Creek downstream
Creek Trash Assessment (CTA) Methodology (Demonstration: Mill Run Creek, Cheltenham, Pa.) Mill Run Creek emerges from a storm sewer in Philadelphia to an open creek in Cheltenham. The Creek downstream
Hard Hat Services ph: hardhatinc.com 932 N. Wright St., Suite 160 Naperville, IL 60563
 Interstate Power and Light Company Ottumwa Generation Station CCR Surface Impoundment Annual Inspection Report 154.018.012.003 Report issued: December 21, 2016 Hard Hat Services ph: 877-630-7428 hardhatinc.com
4.6 MODELING COASTAL RIVERS OPERATIONALLY: A CASE STUDY OF THE ST. JOHNS RIVER, FLA.
 4.6 MODELING COASTAL RIVERS OPERATIONALLY: A CASE STUDY OF THE ST. JOHNS RIVER, FLA. Reggina Cabrera Garza 1, Janice Sylvestre 2, and Michael Watts 2 1 NOAA, National Weather Service, Southeast River Forecast