SUSSEX COUNTY, DELAWARE AND INCORPORATED AREAS
|
|
|
- Flora Hensley
- 5 years ago
- Views:
Transcription


 * No special flood hazards areas identified Sussex County REVISED: Federal Emergency Management Agency FLOOD INSURANCE")
1 VOLUME 1 OF 3 SUSSEX COUNTY, DELAWARE AND INCORPORATED AREAS COMMUNITY COMMUNITY NUMBER COMMUNITY COMMUNITY NUMBER BETHANY BEACH, TOWN OF LAUREL, TOWN OF BETHEL, TOWN OF LEWES, CITY OF BLADES, TOWN OF MILFORD, CITY OF BRIDGEVILLE, TOWN OF MILLSBORO, TOWN OF DAGSBORO, TOWN OF MILLVILLE, TOWN OF DELMAR, TOWN OF* MILTON, TOWN OF DEWEY BEACH, TOWN OF OCEAN VIEW, TOWN OF ELLENDALE, TOWN OF* REHOBOTH BEACH, CITY OF FENWICK ISLAND, TOWN OF SEAFORD, CITY OF FRANKFORD, TOWN OF SELBYVILLE, TOWN OF GEORGETOWN, TOWN OF SLAUGHTER BEACH, TOWN OF GREENWOOD, TOWN OF SOUTH BETHANY, TOWN OF HENLOPEN ACRES, TOWN OF SUSSEX COUNTY (UNINCORPORATED AREAS) * No special flood hazards areas identified Sussex County REVISED: Federal Emergency Management Agency FLOOD INSURANCE STUDY NUMBER 10005CV001B
2 NOTICE TO FLOOD INSURANCE STUDY USERS Communities participating in the National Flood Insurance Program have established repositories of flood hazard data for floodplain management and flood insurance purposes. This Flood Insurance Study (FIS) may not contain all data available within the repository. It is advisable to contact the community repository for any additional data. Part or all of this FIS may be revised and republished at any time. In addition, part of this FIS may be revised by the Letter of Map Revision process, which does not involve republication or redistribution of the FIS. It is, therefore, the responsibility of the user to consult with community officials and to check the community repository to obtain the most current FIS components. Initial Countywide FIS Effective Date: June 16, 1995 Revised Countywide FIS Effective Dates: December 19, 1996 to correct the elevation of Elevation Reference Mark 89 February 8, 1999 to increase and add Base Flood Elevations, to change and delete Special Flood Hazard Areas, to change floodway, and to change zone designations December 20, 2000 to incorporate Letter of Map Revision May 5, 2003 to update corporate limits and county boundary, to change Special Flood Hazard Areas, and to add roads and road names January 6, 2005 to change Special Flood Hazard Areas and to update roads and road names This Preliminary FIS report only includes revised Floodway Data Tables and revised Flood Profiles. The unrevised components will appear in the final FIS report.
3 TABLE OF CONTENTS Volume 1 Page 1.0 INTRODUCTION Purpose of Study Authority and Acknowledgments Coordination AREA STUDIED Scope of Study Community Description Principal Flood Problems Flood Protection Measures ENGINEERING METHODS Hydrologic Analyses Hydralulic Analyses Coastal Analysis Vertical Datum FLOODPLAIN MANAGEMENT APPLICATIONS Floodplain Boundaries Floodways INSURANCE APPLICATIONS FLOOD INSURANCE RATE MAP OTHER STUDIES LOCATION OF DATA BIBLIOGRAPHY AND REFERENCES 99 i
4 TABLE OF CONTENTS Volume 1 (continued) Page FIGURES Figure 1 - Vicinity Map 7 Figure 2 - Frequency-Discharge, Drainage Area Curves Figure 3 - Transect Location Map 54 Figure 4 - Transect Schematic 63 Figure 5 - Floodway Schematic 67 TABLES Table 1 - Initial and Final CCO Meetings 6 Table 2 - Flooding Sources Studied by Detailed Methods 8 Table 3 - Flooding Sources Studied by Limited Detailed Methods 9 Table 4 - Incorporated Letters of Map Corrections (LOMCs) 10 Table 5 - Summary of Discharges Table 6 - Method of Determining Starting Water-Surface Elevations Table 7 - Manning s n Values Table 8 - Limited Detailed Flood Hazard Data Table 9 - Summary of Coastal Stillwater Elevations Table 10 - Transect Data Table 11 - Floodway Data Table Table 12 - Community Map History TABLE OF CONTENTS Volume 2 EXHIBITS Exhibit 1 - Flood Profiles Bark Pond Betts Pond Shoals Branch Bridgeville Branch Broad Creek Broadkill River Buntings Branch Sandy Branch Cart Branch Cedar Creek Church Branch Clear Brook Deep Branch Panel 01P Panels 02P-04P Panels 04P-06P Panel 07P Panels 08P-12P Panels 13P-14P Panel 15P Panels 15P-16P Panels 17P-18P Panels 19P-23P Panels 24P-27P Panels 28P-32P Panel 33P ii
5 Exhibit 1 - Flood Profiles (continued) TABLE OF CONTENTS Volume 2 (continued) EXHIBITS (continued) Deep Creek Georgetown Road Branch Herring Creek Chapel Branch Herring Run Hopkins Prong Unity Branch Indian River Ingram Branch Iron Branch Little Creek Love Creek Martin Branch Mirey Branch Mispillion River Mullet Run Panels 34P-36P Panel 37P Panels 38P-40P Panels 40P-41P Panels 42P-43P Panels 44P-45P Panels 45P-46P Panels 47P-51P Panel 52P Panels 53P-54Pb Panels 55P-56P Panels 57P-59P Panels 60P-62P Panels 63P-64P Panel 65P Panel 66P TABLE OF CONTENTS Volume 3 EXHIBITS (continued) Exhibit 1 - Flood Profiles Nanticoke River Pemberton Branch Pepper Creek Pepper Creek Fork 1 Pepper Creek Fork 2 Pepper Creek Fork 3 Presbyterian Branch Rossakatum Branch Round Pole Branch Sowbridge Branch Tantrough Branch Vines Creek Whartons Branch White Creek White Creek Ditch Butler Mill Branch Chapel Branch Gravelly Branch Panels 67P-71P Panels 72P-73P Panels 74P-76P Panels 77P-78P Panel 79P Panel 80P Panel 81P Panels 82P-83P Panel 84P Panels 85P-89P Panels 90P-92P Panels 93P-94P Panels 95P-96P Panels 97P-99P Panels 100P-101P Panels 102P-104P Panels 105P-109P Panels 110P-115P iii
6 Exhibit 1 - Flood Profiles (continued) TABLE OF CONTENTS Volume 3 (continued) EXHIBITS (continued) Gum Branch Hitch Pond Branch James Branch Marshy Hope Creek Smith-Short and Willin Ditch Thompson Branch Tom Dam Branch Unnamed Tributary of White Marsh Branch White Marsh Branch Panels 116P-121P Panels 122P-125P Panels 126P-131P Panels 132P-136P Panel 137P Panel 138P Panels 139P-142P Panel 143P Panel 144P Exhibit 2 - Flood Insurance Rate Map Index Flood Insurance Rate Map iv
7 FLOOD INSURANCE STUDY SUSSEX COUNTY, DELAWARE AND INCORPORATED AREAS 1.0 INTRODUCTION 1.1 Purpose of Study This countywide Flood Insurance Study (FIS) revises and updates the previous FIS/Flood Insurance Rate Map (FIRM) for the geographic area of Sussex County, Delaware, including: the unincorporated areas of Sussex County; the Cities of Lewes, Milford, Rehoboth Beach, and Seaford; and the Towns of Bethany Beach, Bethel, Blades, Bridgeville, Dagsboro, Dewey Beach, Fenwick Island, Frankford, Georgetown, Greenwood, Henlopen Acres, Laurel, Millsboro, Millville, Milton, Ocean View, Selbyville, Slaughter Beach, and South Bethany (hereinafter referred to collectively as Sussex County). This FIS aids in the administration of the National Flood Insurance Act of 1968 and the Flood Disaster Protection Act of This study has developed flood risk data for various areas of the community that will be used to establish actuarial flood insurance rates. This information will also be used by Sussex County to update existing floodplain regulations as part of the Regular Phase of the National Flood Insurance Program (NFIP), and by local and regional planners to further promote sound land use and floodplain development. Minimum floodplain management requirements for participation in the NFIP are set forth in the Code of Federal Regulations at 44 CFR, Please note that the Town of Delmar is geographically located in Sussex County, Delaware, and Wicomico County, Maryland. Only the portion of the Town of Delmar located in Sussex County is included in this FIS. See the separately published FIS reports and Flood Insurance Rate Maps (FIRMs) for countywide map dates and flood hazard information outside of Sussex County. Please note that the City of Milford is geographically located in Kent, and Sussex Counties. The City of Milford is included in its entirety in this FIS report. Please note that on the effective date of this study, the Towns of Delmar and Ellendale have no mapped Special Flood Hazard Areas (SFHAs). This does not preclude future determinations of the SFHAs that might be necessitated by changed conditions affecting the community (ie. Annexation of new lands) or the availability of new scientific or technical data about flood hazards. In some States or communities, floodplain management criteria or regulations may exist that are more restrictive or comprehensive than the minimum Federal requirements. In such cases, the more restrictive criteria take precedence and the State (or other jurisdictional agency) will be able to explain them. 1.2 Authority and Acknowledgments The sources of authority for this FIS are the National Flood Insurance Act of 1968 and the Flood Disaster Protection Act of
8 The original June 16, 1995 countywide FIS was prepared to include all jurisdictions within Sussex County into a countywide format FIS. Information on the authority and acknowledgments for each jurisdiction with a previously printed FIS report included in this countywide FIS is shown below. Bethany Beach, Town of Bethel, Town of Blades, Town of Dagsboro, Town of Dewey Beach, Town of Fenwick Island, Town of The wave height analysis for the FIS effective August 2, 1982, and FIRM dated February 2, 1983, was prepared by Dewberry & Davis for Federal Emergency Management Agency (FEMA). The hydrologic and hydraulic analyses for the FIS effective July 16, 1980, FIRM dated January 16, 1981, were prepared by Edward H. Richardson Associates, Inc., for the Federal Insurance Administration (FIA) under Contract No. H That work was completed in April The hydrologic and hydraulic analyses for the FIS effective July 16, 1980, and FIRM dated January 16, 1981, were prepared by Kidde Consultants, Inc., for the FIA under Contract No. H That work was completed in August The hydrologic and hydraulic analyses for the FIS effective December 1, 1980, and FIRM dated June 1, 1981, were prepared by Kidde Consultants, Inc., for the FIA, under Contract No. H That work was completed in December The wave height analysis for the FIS effective November 17, 1982, and FIRM dated April 4, 1983, was prepared by Dewberry & Davis, for FEMA, under Contract No. EMW-C That work was completed in May The hydrologic and hydraulic analyses for the FIS effective March 23, 1973, were prepared by the U.S. Army Corps of Engineers (USACE) and the wave height analysis was prepared by Dewberry & Davis. The hydrologic and hydraulic analyses for the revised FIS dated April 17, 1985, were prepared by Dewberry & Davis for FEMA under Contract No. C That revised work was completed in July
9 Frankford, Town of Henlopen Acres, Town of Laurel, Town of Lewes, City of Milford, City of Millsboro, Town of Milton, Town of Ocean View, Town of The hydrologic and hydraulic analyses for the FIS effective March 16, 1981, and FIRM dated September 16, 1981, were prepared by Kidde Consultants, Inc., for the FIA under Contract No. H That work was completed in January The hydrologic and hydraulic analyses for the FIS effective in February 1978, and FIRM dated February 2, 1983, were prepared by the Delaware River Basin Commission for the FIA under Contract No. H That work was completed in May The hydrologic and hydraulic analyses for the FIS effective July 16, 1980, and FIRM dated January 16, 1981, were prepared by Edward H. Richardson Associates, Inc., for the FIA under Contract No. H That work was completed in April The wave height analysis for the FIS effective March 2, 1982, and FIRM dated September 2, 1982, was prepared by Dewberry & Davis for FEMA. The hydrologic and hydraulic analyses for the FIS effective December 1976, and FIRM dated June 1, 1977, was prepared by Greenhorne & O'Mara, Inc., for the FIA under Contract No. H That work was completed in May The hydrologic and hydraulic analyses for the FIS effective March 1978, and FIRM dated September 1, 1978, were prepared by the Delaware River Basin Commission for the FIA under Contract No. H That work was completed in June The hydrologic and hydraulic analyses for the FIS effective in February 1978, and FIRM dated August 1, 1978, were prepared by the Delaware River Basin Commission for the FIA under Contract No. H That work was completed in May The hydrologic and hydraulic analyses for the FIS effective in March 1980, and FIRM dated September 3, 1980, were prepared by the USACE, Philadelphia District, for the FIA under Inter- Agency Agreement No. IAA-H That work 3
10 was completed in December Rehoboth Beach, City of Seaford, City of Slaughter Beach, Town of South Bethany, Town of The wave height analysis for the FIS effective August 2, 1982, was prepared by Dewberry & Davis for FEMA. The hydrologic and hydraulic analyses for the FIS effective in August 1978, and FIRM dated February 1, 1979, were prepared by the Delaware River Basin Commission for the FIA under Contract No. H That work was completed in September The wave height analysis for the FIS effective March 2, 1982, and FIRM dated April 2, 1992, was prepared by Dewberry & Davis for FEMA. The hydrologic and hydraulic analyses for the original FIS effective in August 1975 were prepared by the USACE, Baltimore District, under Inter-Agency Agreement No. H-2-73, Project Order No. 13. That work was completed in July The wave height analysis was prepared by Dewberry & Davis and completed in February For the FIS dated April 3, 1985, the updated versions were prepared by Dewberry & Davis for FEMA under Contract No. C That work was completed in July Sussex County (Unincorporated Areas) Sussex County (Unincorporated Areas) Sussex County (Unincorporated Areas) The wave height analysis for the FIS effective July 5, 1983, was prepared by Dewberry & Davis for FEMA, under Contract No. EMW-C That work was completed in May The updated hydrologic and/or hydraulic analyses performed for the June 16, 1995 FIS Revision revised flooding sources were prepared by the USACE, Philadelphia District, for FEMA under Inter-Agency Agreement No. EMW That work was completed in January For the February 8, 1999, Countywide FIS, the updated hydrologic and hydraulic analyses for the Mispillion River were prepared by the USACE, Philadelphia District, for FEMA, under Inter- Agency Agreement No. EMW-93-E-4119, Task Letter No That work was completed in April The updated hydrologic and hydraulic 4
11 analyses for Shoals Branch were prepared by the USACE, under Inter-Agency Agreement No. EMW-95-E-4759, Task Letter No That work was completed in October There are no previous FISs for the Towns of Bridgeville, Georgetown, Greenwood, Millville, and Selbyville; therefore, the previous authority and acknowledgment information for these communities is not included in this FIS. These communities may not appear in the Community Map History table (Section 6.0)." For the riverine flood hazard analyses for this revision, the Digital Flood Insurance Rate Map (DFIRM) database and mapping were prepared for FEMA by GG3, a joint venture between Greenhorne & O Mara, Inc., Laurel, Maryland and Gannett Fleming, Inc., Camp Hill, Pennsylvania under the Joint Venture Contract No. EMP-2003-CO-2606, Task Order Number 11. The countywide FIS does not include new detailed hydrologic and hydraulic analyses, but rather approximately 65 stream miles studied by limited detailed methods. The limited detailed hydrologic and hydraulic analyses were completed by URS Corporation, Gaithersburg, MD, in December The coastal flood hazard analyses for this revision were completed for FEMA by the USACE and its project partners under Project HSFE03-06-X-0023 and Project HSFE03-09-X-1108, and by RAMPP under contract No. HSFEHQ-09-D- 0369, Task Order HSFE03-09-J The creation of the final FIRM database and coastal floodplain mapping for this revision were performed by RAMPP under contract No. HSFEHQ-09-D-0369, Task Order HSFE03-09-J This study was completed in December Base map information shown on this FIRM was provided in digital format by Delaware Geospatial Data Exchange. The base map features were compiled at a scale of 1:24,000 from aerial photography dated The projection used in the preparation of this map was State Plane Delaware zone (FIPS Zone 0700). The horizontal datum was North American Datum of 1983 (NAD 83), Geodetic Reference System 1980 (GRS 80) spheroid. Differences in datum, spheroid, projection or State Plane zones used in the production of FIRMs for adjacent jurisdictions may result in slight positional differences in map features across jurisdiction boundaries. These differences do not affect the accuracy of information shown on this FIRM. 1.3 Coordination An initial Consultation Coordination Officer s (CCO) meeting is typically held with representatives of FEMA, the community, and the study contractor to explain the nature and purpose of a FIS and to identify the streams to be studied by detailed methods. A final CCO meeting is held typically with the same representatives to review the results of the study. 5
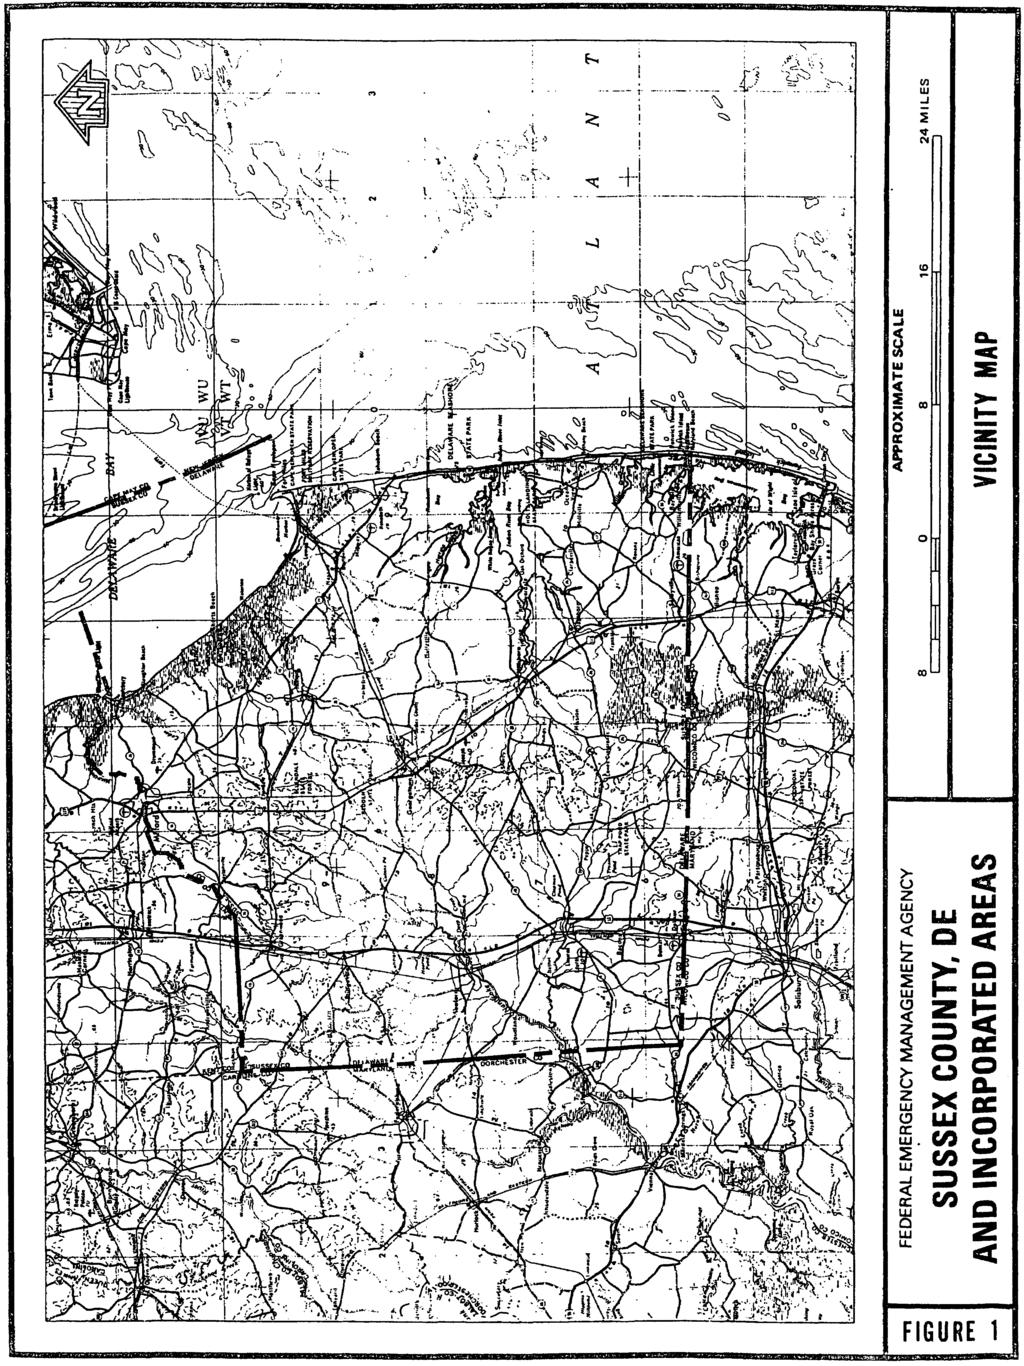
12 The initial and final meeting dates for the previous FIS reports for Sussex County and its communities are listed in Table 1, Initial and Final CCO Meetings. TABLE 1 INITIAL AND FINAL CCO MEETINGS COMMUNITY NAME INITIAL MEETING FINAL MEETING Town of Bethany Beach October 17, 1989 October 13, 1993 Town of Fenwick Island October 17, 1989 October 13, 1993 Town of Henlopen Acres October 17, 1989 October 13, 1993 Town of Laurel October 17, 1989 October 13, 1993 City of Lewes October 17, 1989 October 13, 1993 Town of Millsboro October 17, 1989 October 13, 1993 Town of Ocean View October 17, 1989 October 13, 1993 City of Rehoboth October 17, 1989 October 13, 1993 Town of Slaughter Beach October 17, 1989 October 13, 1993 Town of South Bethany October 17, 1989 October 13, 1993 Sussex County (Unincorporated Areas) October 17, 1989 October 13, 1993 For the February 8, 1999, revision, the county was notified by FEMA in a letter dated December 4, 1996, that its FIS would be revised using the analyses prepared by the USACE. For the riverine analyses of this revision, the final CCO meeting was held on March 30, 2011, and attended by representatives of FEMA Region III, the Sussex County Planning and Zoning Department, Delaware Department of Natural Resources (DNREC), local community representatives and FEMA study contractors. All problems raised at that meeting have been addressed. For this coastal revision, the initial community meeting was held on December 1, 2010 at the Sussex County West Annex and attended by representatives of FEMA, Sussex County, local communities, DNREC, and FEMA study contractors. The final CCO meeting was held on, and attended by. 2.0 AREA STUDIED 2.1 Scope of Study This FIS covers the geographic area of Sussex County, Delaware, including the incorporated communities listed in Section 1.1. The area of study is shown on the Vicinity Map (Figure 1). 6
13 7
14 All or portions of the flooding sources listed in Table 2, "Flooding Sources Studied by Detailed Methods," were streams previously studied by detailed methods. Limits of detailed study are indicated on the Flood Profiles (Exhibit 1) and on the FIRM (Exhibit 2). TABLE 2 FLOODING SOURCES STUDIED BY DETAILED METHODS Bark Pond Deep Creek Martin Branch Presbyterian Betts Pond Georgetown Road Mirey Branch Branch Shoals Branch Branch Mispillion River Rossakatum Bridgeville Branch Herring Creek Mullet Run Branch Broad Creek Chapel Branch Nanticoke River Round Pole Broadkill River Herring Run Pemberton Branch Branch Buntings Branch Hopkins Prong Pepper Creek Sowbridge Branch Sandy Branch Unity Branch Pepper Creek Tantrough Branch Cart Branch Indian River Fork 1 Vines Creek Cedar Creek Ingram Branch Pepper Creek Whartons Branch Church Branch Iron Branch Fork 2 White Creek Clear Brook Little Creek Pepper Creek White Creek Ditch Deep Branch Love Creek Fork 3 For the June 16, 1995 countywide FIS report, the Atlantic Ocean, including all or portions of Delaware Bay, Indian River Bay, Little Assawoman Bay, and Rehoboth Bay, were restudied by detailed methods. All streams except Deep Branch, Mispillion River, and Mullet Run were restudied. The June 16, 1995, countywide FIS also incorporated the effects of annexations or deannexations by the following communities: the City of Seaford and the Towns of Georgetown, Millsboro, and Ocean View. For the February 8, 1999 countywide revision, the Mispillion River was restudied by detailed methods from Washington Street to U.S. Route 113, a total of 1.2 miles, the downstream end being tidal, the upstream end at the confluence of Tantrough Branch; and Shoals Branch was studied by detailed methods from U.S. Route 113 to County Road 432, a distance of 4.3 miles. The downstream end of the study ties into Betts Pond. For the January 6, 2005, countywide revision, all elevations have been converted from National Geodetic Vertical Datum of 1929 (NGVD 29) to North American Vertical Datum of 1988 (NAVD 88). In addition, an updated base map was used for the FIRM. For this countywide revision, approximately 65 stream miles were studied by limited detail methods with 49 hydraulic structure crossings. In addition, flood data tables that include the river station, discharge and 1% annual chance water surface elevation for each cross section included in the this flood study update have been developed. 8
15 Table 3, Flooding Sources Studied by Limited Detailed Methods lists the streams that were studied by limited detailed methods. TABLE 3 FLOODING SOURCES STUDIED BY LIMITED DETAILED METHODS Stream Name Butler Mill Branch Chapel Branch Gravelly Branch Gum Branch Limits of Study Approximately 500 ft downstream of Woodland Road to the confluence with Horsepen Branch Approximately 0.16 mile downstream of Woodland Road to approximately 0.67 miles upstream of Boyce Road At the confluence with Nanticoke River to approximately 0.06 miles upstream of Deer Forest Road At the confluence with Nanticoke River to approximately 1.22 miles upstream of Wolf Road Hitch Pond Branch At the confluence with James Branch to approximately 0.24 miles upstream of Wooten Road Iron Branch James Branch Marshy Hope Creek Nanticoke River Smith-Short and Willin Ditch Thompson Branch Approximately 450 ft downstream of Handy Road to approximately 0.3 miles upstream of Hickory Hill Road Approximately 0.36 mile downstream of Laurel Road to approximately 0.51 miles upstream of Whitesville Road Approximately 0.87 mile downstream of Noble Road to approximately 0.16 miles upstream of Hickman Road Approximately 0.84 mile downstream of Old Furnace Road to approximately 0.8 miles upstream of Greenhurst Farm Road At the confluence with Gravelly Branch to approximately 0.05 miles upstream of Russell Road At the confluence with Hitch Pond Branch to approximately 0.07 miles upstream of Whaley s Road Toms Dam Branch At the confluence with Gum Branch to approximately 0.31 miles upstream of Beach Highway Unnamed Tributary of White Marsh Branch White Marsh Branch At the confluence with White Marsh Branch to approximately 0.52 miles upstream of Dupont Parkway At the confluence with Nanticoke River to approximately 0.55 miles upstream of Woodyard Road The areas studied by detailed methods were selected with priority given to all known flood hazards and areas of projected development or proposed construction. 9
16 Numerous flooding sources were studied by approximate methods. Approximate analyses were used to study those areas having a low development potential or minimal flooding hazards. The scope and methods of study were proposed to, and agreed upon, by FEMA and the communities. This revision includes a new coastal analysis and mapping for 102 miles of shoreline. Table 4 presents Letters of Map Correction (LOMCs) incorporated into this revision: Table 4 INCORPORATED LETTERS OF MAP CORRECTION (LOMCs) LOMC Case Number Date Issued Project Identifier LOMR P July, 26, 2005 Iron Branch LOMR P December 09, Pepper Creek Fork LOMR A587P October 30, 2006 Indigo Run LOMR P January 31, 2008 LOMR P October 13, 2009 Cool Spring: McCrone Project No. D Round Pole Branch Revision LOMR P June 9, 2010 Hastings Heritage Subdivision 2.2 Community Description Sussex County is the most southern of the three counties in Delaware. The county is bordered by Kent County to the north, and the Maryland counties of Caroline and Dorchester to the west, Wicomico to the southwest, and Worcester to the south. The coastal communities are bordered on the east by the Atlantic Ocean. The temperature range in Sussex County is moderate, varying from an average low of 27 degrees Fahrenheit ( o F) in February to an average high of 89 o F in July. The average annual rainfall is 46 inches. The county is situated on the geological subdivision known as the Atlantic Coastal Plain Province, which provides excellent soil conditions for agriculture and vegetal growth. Consequently, although there are some urbanized communities, outlying areas remain farmland, natural forests, and wetlands. 2.3 Principal Flood Problems Tropical storms or hurricanes are most likely to occur from August through October, followed by northeasters (storms characterized by strong northeasterly winds) through early spring. Flooding within Sussex County on fluvial flood sources occurs during all seasons of the year with the main flood seasons being 10
17 spring and summer. Summer floods are generally the result of intense local thunderstorms. Along the Delaware Bay and Atlantic Ocean coasts, as well as along inland bay coastlines, flooding is caused by high tides and wave action associated with northeasters or other coastal storms. The hurricanes of August 1933 and September 1944, and the northeasters of November 1950, November 1953, January 1956, and March 1962 were the most severe recent storms affecting the Delaware coastline. Beach erosion and damage to shore structures also occurred in coastal communities during such storms. The 1944 hurricane produced severe damage along the oceanfront of coastal communities as a result of wind and waves. The northeasters of 1950, 1953, and 1956 produced strong winds and high tides, which eroded the oceanfront and damaged highways and residences along the Delaware coastline. The storm of 1962 was unusually severe, with strong northeast winds lasting through five successive high tides. The high tides, combined with wind-driven waves, produced record high tide readings along the beach and inland bay areas, resulting in severe damage. Flooding problems occasionally result from overtopping of the Willow Street bridge over Broad Creek and on Rossakatum Branch in the Town of Laurel. The Broadkill River overflowed its banks and caused flood damage in Milton in March of 1962 as a result of water being pushed up the river by tidal surges resulting from a northeaster. The Mispillion River in the City of Milford overflowed its banks in 1935 and in 1962 as a result of high tides caused by a northeaster. Historical data exists for various storms along the Delaware coast. The October/November 1991 storm (Halloween Storm) and January 1992 storm had peak recorded elevations of 5.3 and 6.6 feet NAVD88, respectively, at the NOAA tide gage at Lewes, which would place the return period of the Halloween Storm at less than 10 years and the January storm at approximately 25 years. Other events of record include the following storms with their peak elevation in feet NAVD88 as recorded at the NOAA tide gage at Lewes unless otherwise noted: the Great Atlantic Hurricane of September 1944, 7+ feet estimated; the November 1950 storm, 6.4 feet estimated; the March 1962 storm, 7.3 feet; and Hurricane Gloria of September 1985, 5.8 feet. 2.4 Flood Protection Measures Flood protection measures in the City of Milford are limited to bank stabilization measures along the Mispillion River and the flood-reducing effects of Haven Lake, Silver Lake, and Marshall Millpond. These impoundments are more effective in reducing the hazards of high frequency floods (10- and 2-percent-annual-chance frequency) than in controlling low frequency events (1- and 0.2-percent-annualchance floods). Bank stabilization measures include river channelization by concrete (with the exception of the river bed) and some channel realignment. 11
18 Presently, there are no other flood protection measures within Sussex County. Residents depend on the usual warnings issued through radio, television, and local newspapers for information concerning possible flood conditions. Many dams exist in Sussex County, but they are used for purposes other than flood control. 3.0 ENGINEERING METHODS For the flooding sources studied in detail in the county, standard hydrologic and hydraulic study methods were used to determine the flood hazard data required for this study. Flood events of a magnitude which are expected to be equaled or exceeded once on the average during any 10-, 50-, 100-, or 500-year period (recurrence interval) have been selected as having special significance for floodplain management and for flood insurance rates. These events, commonly termed the 10-, 2-, 1-, and 0.2-percent chance floods, have a 10-, 2-, 1-, and 0.2- percent chance, respectively, of being equaled or exceeded during any year. Although the recurrence interval represents the long term average period between floods of a specific magnitude, rare floods could occur at short intervals or even within the same year. The risk of experiencing a rare flood increases when periods greater than 1 year are considered. For example, the risk of having a flood which equals or exceeds the 1-percent-annual-chance flood (100-year of annual exceedence) in any 50-year period is approximately 40 percent (4 in 10), and, for any 90-year period, the risk increases to approximately 60 percent (6 in 10). The analyses reported herein reflect flooding potentials based on conditions existing in the county at the time of completion of this study. Maps and flood elevations will be amended periodically to reflect future changes. 3.1 Hydrologic Analyses Hydrologic analyses were carried out to establish the peak discharge-frequency and peak elevation-frequency relationships for each flooding source studied in detail affecting the county. Information on the methods used to determine peak discharge-frequency relationships for the streams studied by detailed methods is shown below. A gaging station on Beaverdam Creek (a small upstream tributary of the Mispillion River outside the City of Milford corporate limits) was the only source of streamflow data available for the Mispillion River, Mullet Run, and Deep Branch. This lack of data dictated use of hydrologic methods other than the standard log- Pearson Type III distribution techniques of annual peak flow data (Water Resources Council, 1967). To define discharge-frequency data for the Deep Branch, Mispillion River, and Mullet Run several methods of analysis were used. A method using a rainfall-runoff computer model that relates rainfall, land-use, drainage area, and other hydrologic watershed characteristics (i.e., infiltration, antecedent soil moisture conditions, time of concentration) was the principal method used (Soil Conservation Service, 1965). Other methods used for comparison of results include: the application of regional relationships as developed for Kent County, Delaware by the study contractor from a previous 12
19 county study (FEMA, 1975); regional relationships (regression equations) relating peak discharge with drainage area, a runoff coefficient, an average basin slope as developed in a previous study (Delaware Department of Highways and Transportation, 1972); and, a regional log-pearson Type III study, which included all available streamflow records for Kent County and additional data generated by a synthetic streamflow computer model (USACE, 1972). Final results of the hydrologic analyses were compared with the frequency and discharge data of historical floods as remembered by community officials and local residents. For the June 16, 1995, countywide FIS, peak discharges for the remaining streams studied by detailed methods were determined using R. H. Simmons and D. H. Carpenter's regional method (USGS, 1978). The Simmons and Carpenter method was developed specifically for Delaware for use on gaged and ungaged streams. This method provides a separate set of regression equations for the southern part of the state taking into account such factors as the mild slope of the streams, the soil type, and storage associated with Sussex County's numerous swamps and dams. The regression equations in the Simmons and Carpenter method are based on gage data through 1975 providing frequency streamflow estimates up to the 1-percentannual-chance frequency event. The 0.2-percent-annual-chance frequency event was extrapolated on a plot of the 50-, 20-, 10-, 4-, 2-, and 1-percent-annual-chance frequency events for each stream. To determine whether the Simmons and Carpenter regression equations should be updated for data collected after 1975, a comparative analysis was performed on a long term gage on the Nanticoke River U.S. Geological Survey (USGS) (gage no ). All results are in close agreement indicating that the regression equations are still valid today. Before undertaking the regression analysis, Bulletin 17B methodology was used at all gage locations to update discharges for the 10-, 2-, 1-, and 0.2-percent-annualchance frequency events using the most recent data available (USGS, 1981). The Simmons and Carpenter regression analysis was then performed for all streams. The regression equations were used directly for ungaged streams and for sites on gaged streams where the drainage area at the site in question was less than 50 percent or greater than 150 percent of the drainage area at the gage. The regression equations were used with an adjustment for sites on gaged streams where the drainage area at the site in question was between 50 percent and 150 percent of the drainage area at the gage. The adjustment modifies streamflow estimates through an equation based on the gage discharge and a drainage area proportion. This occurred at only two sites on gaged streams in Sussex County, one on Sowbridge Branch and one on Pepper Creek. All of the Simmons and Carpenter regression equations take into consideration physical basin characteristics. Where applicable, all regression results were checked for consistency with updated frequency discharges at long-term gage locations. 13
20 This Revision No new detailed hydrologic analyses were carried out for this revision. A summary of the drainage area-peak discharge relationships for all of the streams studied by detailed methods is shown in Table 5, Summary of Discharges. Discharges are shown in cubic feet per second (cfs). Table 5 SUMMARY OF DISCHARGES FLOODING SOURCE AND LOCATION DRAINAGE AREA (sq. miles) 10-Percent- Annual- Chance PEAK DISCHARGES (cfs) 2-Percent- 1-Percent- Annual- Annual- Chance Chance 0.2-Percent- Annual- Chance BARK POND Upstream of confluence with Millsboro Pond BETTS POND Upstream of confluence with Millsboro Pond SHOALS BRANCH Upstream of U.S. Route At the confluence of Long Drain Ditch and Phillips Ditch BRIDGEVILLE BRANCH Upstream of U.S. Route ,300 BROAD CREEK Upstream of downstream Bethel corporate limits ,700 3,100 3,900 6,000 Upstream of confluence with Little Creek ,100 2,100 2,700 4,200 14
21 TABLE 5 SUMMARY OF DISCHARGES (continued) FLOODING SOURCE AND LOCATION DRAINAGE AREA (sq. miles) 10-Percent- Annual-Chance PEAK DISCHARGES (cfs) 2-Percent- Annual- Chance 1-Percent- Annual- Chance 0.2- Percent- Annual- Chance BROADKILL RIVER Approximately5,000 feet downstream of Town of Milton downstream corporate limits ,213 1,900 CART BRANCH Upstream of confluence with Nanticoke River ,090 2,200 CEDAR CREEK Upstream of State Route 30 (Swiggets Pond Dam) ,000 Upstream of County Road 214 (Cubbage Pond Dam) Upstream of Hudson Pond Dam Upstream of U.S. Route CHURCH BRANCH Upstream of confluence with Swiggets Pond Upstream of unnamed tributary confluence approximately 2,900 feet upstream of County Road Upstream of unnamed tributary confluence approximately 200feet upstream of County Road CLEAR BROOK Upstream of confluence with Nanticoke River ,500 Upstream of Hearns Pond Dam DEEP CREEK Upstream of confluence with Nanticoke River ,100 1,350 2,100 15
22 TABLE 5 SUMMARY OF DISCHARGES (continued) FLOODING SOURCE AND LOCATION DRAINAGE AREA (sq. miles) 10-Percent- Annual- Chance PEAK DISCHARGES (cfs) 2-Percent- 1-Percent- Annual- Annual- Chance Chance 0.2-Percent- Annual- Chance GEORGETOWN ROAD BRANCH Upstream of confluence with Records Pond HERRING CREEK Upstream of Hazard Cove Upstream of confluence with Hopkins Prong CHAPEL BRANCH Approximately 3,800 feet upstream of Burton Pond Dam Upstream of confluence with Wall Branch 4.2 * * 200 * HERRING RUN Upstream of confluence with Williams Pond ,020 1,770 HOPKINS PRONG (UNITY BRANCH) Upstream of confluence with Herring Creek Upstream of State Route INDIAN RIVER Upstream of confluence with Warwick Gut ,190 4,220 5,360 8,400 Upstream of Millsboro Pond Dam ,340 2,540 3,220 5,200 INGRAM BRANCH Upstream of confluence with Wagamons Pond IRON BRANCH Upstream of confluence with Whartons Branch ,550 * Data Not Available 16
23 TABLE 5 SUMMARY OF DISCHARGES (continued) FLOODING SOURCE AND LOCATION DRAINAGE AREA (sq. miles) 10-Percent- Annual- Chance PEAK DISCHARGES (cfs) 2-Percent- 1-Percent- Annual- Annual- Chance Chance 0.2-Percent- Annual- Chance LAYTON-VAUGHN DITCH Approximately 2,000 feet upstream of confluence with New Ditch LITTLE CREEK Upstream of confluence with Broad Creek ,000 1,300 2,200 LOVE CREEK Upstream of State Route Approximately 2,000 feet downstream of County Road Approximately 2,000 feet upstream of County Road MARTIN BRANCH Upstream of State Route Approximately 50 feet downstream of County Road MIREY BRANCH Upstream of confluence with Millsboro Pond MISPILLION RIVER At State Route ,750 1,110 3,440 At confluence of Presbyterian Branch ,255 1,580 2,650 NANTICOKE RIVER Upstream of confluence with Morgan Branch ,230 4,080 5,120 8,100 Upstream of confluence with Clear Brook ,990 3,620 4,540 7,150 17
24 TABLE 5 SUMMARY OF DISCHARGES (continued) FLOODING SOURCE AND LOCATION DRAINAGE AREA (sq. miles) 10-Percent- Annual- Chance PEAK DISCHARGES (cfs) 2-Percent- 1-Percent- Annual- Annual- Chance Chance 0.2-Percent- Annual- Chance NANTICOKE RIVER (continued) Upstream of confluence with Deep Creek ,610 2,970 3,730 6,000 PEMBERTON BRANCH Upstream of Mulberry Street l,200 Upstream of confluence with Ingram Branch PEPPER CREEK Approximately 2,500 feet upstream of confluence with Vines Creek ,050 1,360 2,700 PEPPER CREEK FORK 1 Upstream of confluence with Pepper Creek PEPPER CREEK FORK 2 Upstream of confluence with Pepper Creek PEPPER CREEK FORK 3 Upstream of confluence with Pepper Creek PRESBYTERIAN BRANCH Upstream of confluence with Mispillion River (Silver Lake) ROSSAKATUM BRANCH Upstream of confluence with Broad Creek ROUND POLE BRANCH Upstream of confluence with Broadkill River ,302 18
25 TABLE 5 SUMMARY OF DISCHARGES (continued) FLOODING SOURCE AND LOCATION DRAINAGE AREA (sq. miles) 10-Percent- Annual- Chance PEAK DISCHARGES (cfs) 2-Percent- 1-Percent- Annual- Annual- Chance Chance 0.2-Percent- Annual- Chance BUNTING BRANCH Upstream of confluence with Broadkill River ,310 2,300 SOWBRIDGE BRANCH Upstream of dam approximately 500 feet downstream of State Route Upstream of Waples Pond Dam Upstream of confluence with Piney Branch Approximately 2,000 feet upstream of County Road TANTROUGH BRANCH Upstream of U.S. Route l,250 1,580 2,650 Upstream of confluence with Johnson Branch ,300 Upstream of confluence with Beaverdam Branch VINES CREEK Approximately 3,400 feet downstream of Town of Frankford downstream corporate limits ,500 2,070 3,800 WHARTONS BRANCH Upstream of confluence with Indian River ,100 WHITE CREEK Approximately1,000 feet downstream of Town of Ocean View corporate limits Upstream of confluence with White Creek Ditch
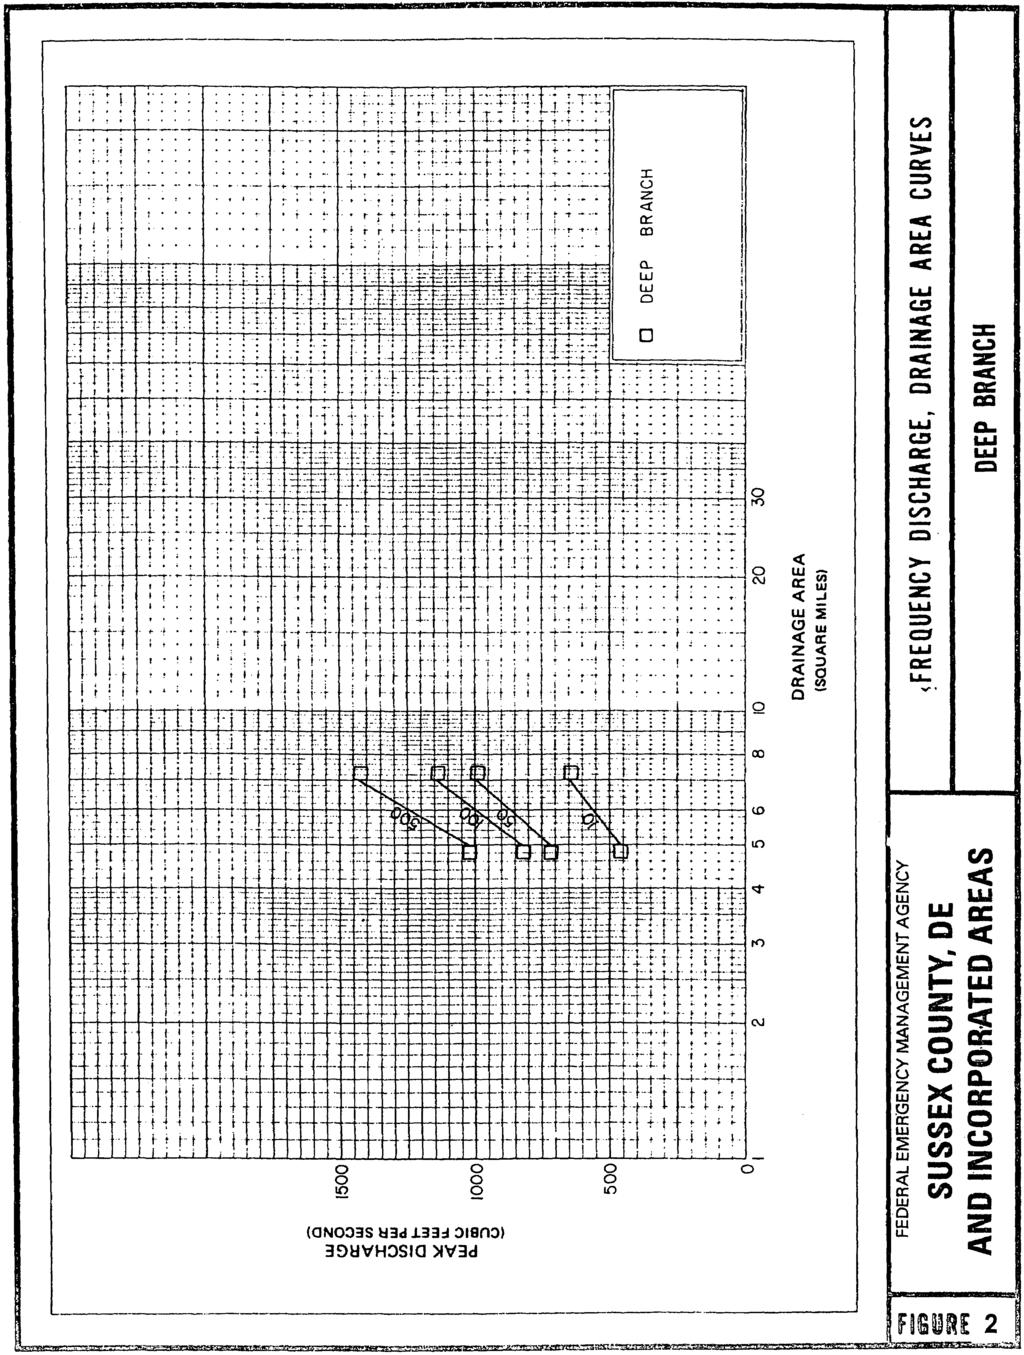
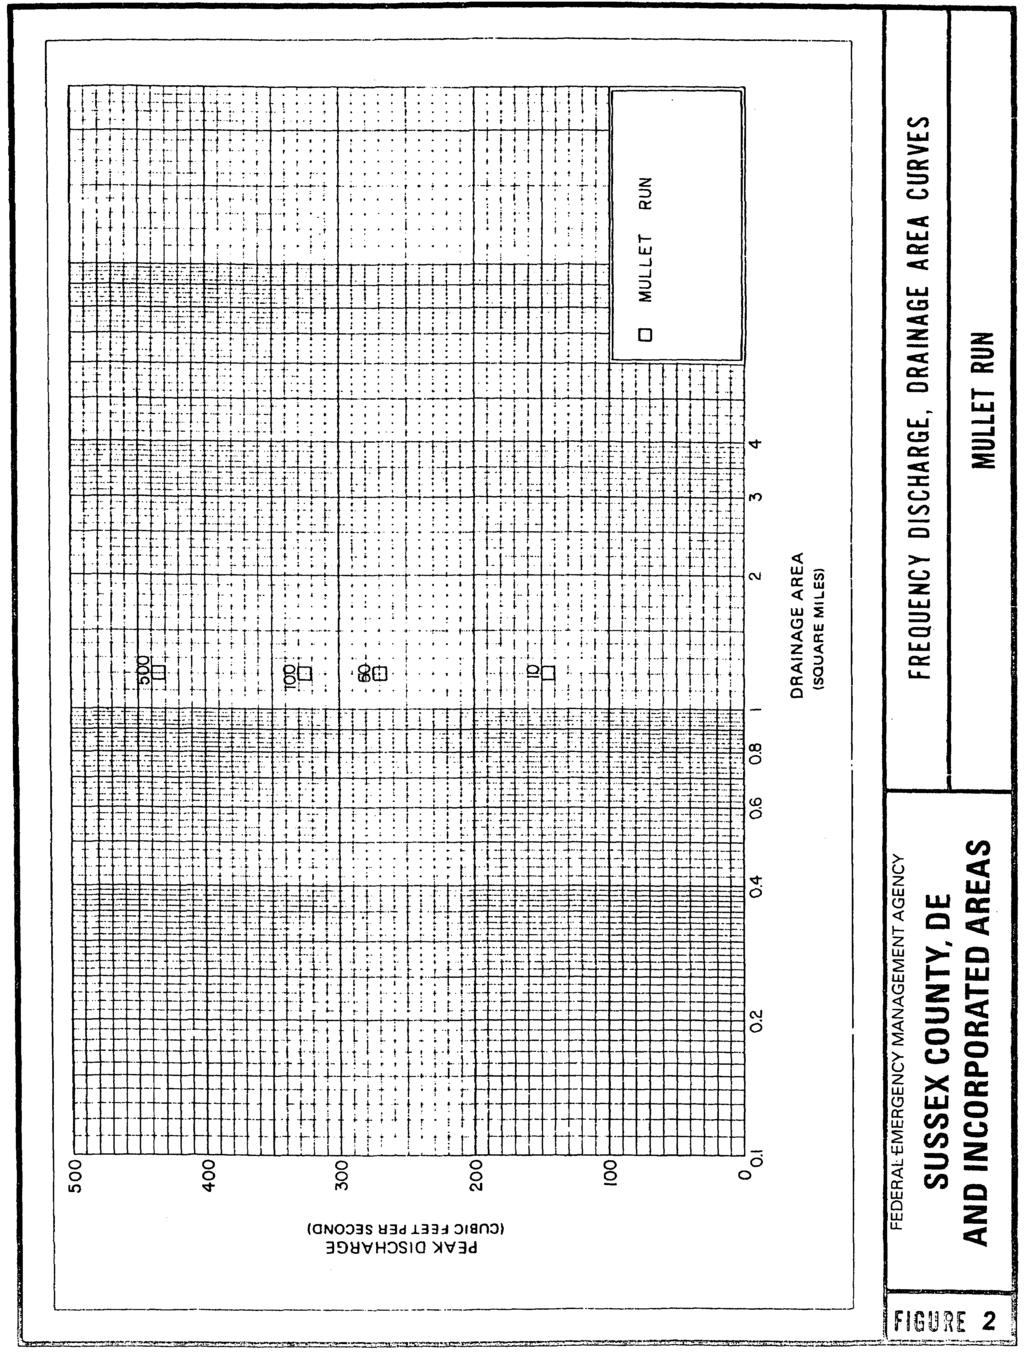
26 TABLE 5 SUMMARY OF DISCHARGES (continued) FLOODING SOURCE AND LOCATION DRAINAGE AREA (sq. miles) 10-Percent- Annual- Chance PEAK DISCHARGES (cfs) 2-Percent- 1-Percent- Annual- Annual- Chance Chance 0.2-Percent- Annual- Chance WHITE CREEK DITCH Upstream of confluence with White Creek Frequency-discharge, drainage area curves for Deep Branch and Mullet Run are shown in Figure 2. 20
27 21
28 22
29 3.2 Hydraulic Analyses Analyses of the hydraulic characteristics of flooding from the sources studied were carried out to provide estimates of the elevations of floods of the selected recurrence intervals. Users should be aware that flood elevations shown on the FIRM represent rounded whole-foot elevations and may not exactly reflect the elevations shown on the Flood Profiles or in the Floodway Data tables in the FIS report. Flood elevations shown on the FIRM are primarily intended for flood insurance rating purposes. For construction and/or floodplain management purposes, users are cautioned to use the flood elevation data presented in this FIS in conjunction with the data shown on the FIRM. Flood profiles were drawn showing computed water-surface elevations to an accuracy of 0.5-foot for floods of the selected recurrence intervals. Locations of selected cross sections used in the hydraulic analyses are shown on the Flood Profiles (Exhibit 1). For stream segments for which a floodway is computed (Section 4.2), selected cross-section locations are also shown on the FIRM (Exhibit 2). Unless specified otherwise, the hydraulic analyses for these studies were based on unobstructed flow. The flood elevations shown on the profiles are thus considered valid only if hydraulic structures remain unobstructed, operate properly, and do not fail. All elevations shown on the Flood Profiles and FIRM (Exhibits 1 and 2) are referenced to the NAVD88. Hydraulic analyses, considering storm characteristics and the shoreline and bathymetric characteristics of the flooding sources studied, were carried out to provide estimates of the elevations of floods of the selected recurrence intervals along the shoreline. For the streams in the City of Milford that were not revised in the June 16, 1995, countywide FIS (Deep Branch, Misspillion River, and Mullet Run), cross sections for the flooding sources studied by detailed methods were obtained from field surveys. All bridges, dams, and culverts were field surveyed to obtain elevation data and structural geometry. All other cross sections were obtained by photogrammetry using aerial photography (Aerial Data Reduction Associates, Inc., 1991). The ground control for the photogrammetry was acquired using conventional surveying techniques (Aerial Data Reduction Associates, Inc., 1991). Bridges, culverts and dams were field surveyed (USACE, 1991). Water-surface elevations of floods of the selected recurrence intervals were computed using the USACE HEC-2 step-backwater computer program (USACE, 1984). The methods of determining starting water-surface elevations are shown in Table 6, Method of Determining Starting Water-Surface Elevations. Flood profiles were drawn showing computed water-surface elevations for floods of the selected recurrence intervals. 23
30 TABLE 6 METHOD OF DETERMINING STARTING WATER-SURFACE ELEVATIONS Flooding Source Starting Water-Surface Elevation Method for 10-, 2-, 1-, and 0.2-Percent-Annual-Chance Frequency Floods Bark Pond normal depth Betts Pond normal pool elevation of Millsboro Pond Bridgeville Branch normal depth Broad Creek 1-year tide Broadkill River 1-year tide (10) normal depth (2, 1, 0.2) Cart Branch normal depth Cedar Creek 1-year tide Church Branch normal pool elevation (10, 2, 1) Swiggetts Pond normal depth (0.2) Clear Brook 1-year tide (10, 2, 1) normal depth (0.2) Deep Creek 1 year tide (10, 2, 1) normal depth (0.2) Georgetown Road Branch normal depth Herring Creek 1-year tide Chapel Branch 1-year tide Herring Run normal pool elevation of Williams Pond (10) normal depth (2, 1, 0.2) Hopkins Prong 1-year tide Unity Branch Indian River 1-year tide Ingram Branch normal pool elevation of Wagamons Pond Iron Branch normal depth Little Creek 1-year tide (10, 2) normal depth (1, 0.2) Layton - Vaughan Ditch normal depth Love Creek normal depth Martin Branch 1-year tide (10, 2, 1) normal depth (0.2) Mirey Branch normal depth Nanticoke River 1-year tide (10, 2, 1) normal depth (0.2) Pemberton Branch elevations at last cross section from Broadkill River model (continuation of model) Pepper Creek 1-year tide (10, 2, 1) normal depth (0.2) Pepper Creek Fork 1 normal depth 24
31 TABLE 6 METHOD OF DETERMINING STARTING WATER-SURFACE ELEVATIONS (continued) Flooding Source Pepper Creek Fork 2 normal depth Pepper Creek Fork 3 normal depth Presbyterian Branch normal depth Rossakatum Branch 1-year tide (10) normal depth (2, 1, 0.2) Round Pole Branch 1-year tide (10) normal depth (2, 1, 0.2) Buntings Branch normal depth Sandy Branch normal depth Sowbridge Branch 1-year tide (10, 2) critical depth (1, 0.2) Tantrough Branch normal depth Vines Creek normal depth Whartons Branch 1-year tide (10) normal depth (2, 1, 0.2) White Creek 1-year tide White Creek Ditch 1-year tide Starting Water-Surface Elevation Method for 10-, 2-, 1-, and 0.2-Percent-Annual-Chance Frequency Floods Elevations determined for the 10-, 2-, 1-, and 0.2-percent-annual-chance floods on Silver Lake were used as the starting elevations for Mullet Run. Starting watersurface elevations for Deep Branch were supplied by the USACE in the tidal reach of the river, just downstream of Marshall Millpond. For the February 8, 1999, countywide FIS revision, the hydraulic characteristics of the Mispillion River and Shoals Branch were studied to determine the elevations of flood waters for the 10-, 2-, 1-, and 0.2-percent-annual-chance recurrence intervals. These water- surface elevations were computed using the HEC-2 standard step backwater computer program (USACE, February 1991). The cross sections for the hydraulic analysis were obtained from the Digital Terrain Model developed for this study (G&O, 1996 and USACE, 1993). Starting water-surface elevations for the Mispillion River were based on the 1-year tide for all recurrence intervals. Starting water-surface elevations for Shoals Branch were taken from the model for Betts Pond. This Revision For this FIS revision, cross section geometries were obtained from a combination of Light Detection and Ranging (LIDAR) land data, USGS 10-m Digital Elevation 25
32 Model (DEM), and field measurements of hydraulic and flood control structures for limited detail studied streams. The hydraulic model used for this FIS is the USACE Hydraulic Engineering Center River Analysis System, version (HECRAS 3.1.3). Topographic data for the floodplain models was developed using recently acquired LIDAR land data, USGS 10-m Digital Elevation Model (DEM), field measurements of hydraulic and flood control structures, and updated hydrologic data. The models were developed using HEC-RAS for the peak 10-, 2-, 1-, and 0.2-percentannual-chance frequency storm discharges for limited detail studied streams. Starting conditions for the hydraulic models were set to normal depth using starting slopes calculated from water surface elevation values taken from the LIDAR data or, where applicable, derived from the water surface elevations of existing effective flood elevations. Roughness factors (Manning's n ) used in the hydraulic computations were chosen based on orthophotography. Table 7, Manning s n Values, shows the channel and overbank n values for the streams studied by detailed methods. TABLE 7 MANNING S n VALUES Stream Channel Overbank Bark Pond Betts Pond Shoals Branch Bridgeville Branch Broad Creek Broadkill River Butler Mill Branch Cart Branch Cedar Creek Chapel Branch Church Branch Clear Brook Deep Branch Deep Creek Georgetown Road Branch Gravelly Branch Gum Branch Herring Creek Chapel Branch Herring Run Hitch Pond Branch
33 TABLE 7 MANNING S n VALUES (continued) Stream Channel Overbank Hopkins Prong Unity Branch Indian River Ingram Branch Iron Branch James Branch Little Creek Love Creek Marshy Hope Creek Martin Branch Mirey Branch Mispillion River Mullet Run Nanticoke River Pemberton Branch Pepper Creek Pepper Creek Fork Pepper Creek Fork Pepper Creek Fork Presbyterian Branch Rossakatum Branch Round Pole Branch Buntings Branch Sandy Branch Smith-Short and Millin Ditch Sowbridge Branch Tantrough Branch Thompson Branch Toms Dam Branch Unnamed Tributary of White Marsh Branch Vines Creek Whartons Branch White Creek White Creek Ditch White Marsh Branch
34 Flood profiles were drawn to an accuracy of 0.5 foot showing computed watersurface elevations for the 10-, 2-, 1-, and 0.2-percent-annual-chance frequency floods. The backwater effect of the corresponding frequency event of the appropriate flooding source was superimposed on the lower reaches of each fluvial flooding source studied by detailed methods. Flood elevations are often raised by debris jams during major floods. The hydraulic analyses for this study, however, are based on the effects of unobstructed flow and existing conditions at the time field surveys were performed. The elevations shown on the profiles are thus considered valid only if hydraulic structures remain unobstructed and do not fail. The category of Limited Detail is assigned to areas where unnumbered A- zones are shown on the effective maps, and communities have requested new/upgraded studies, but the level of projected development does not warrant a detailed study. It is also applied to lakes that do not have level gauge data, and will be included in a hydraulic model. The level of effort includes collection of an orthophoto, LiDAR and limited survey of structures, nomination of flow rates, and the development of HEC-RAS hydraulic models. For the purposes of this document limited survey refers to survey of man-made hydraulic obstructions, such as dams, bridges and culverts, and to the survey of the outlet channels of lakes with natural outlet controls. The purpose of collecting limited survey is to enhance the accuracy of the hydraulic model thus allowing the development and publication of Advisory Base Flood Elevations (BFEs). Engineering drawing plans and Department of Transportation (DOT) hydraulic studies may be substituted for limited survey, where appropriate and available. Table 8, Limited Detailed Flood Hazard Data, includes flood hazard data for streams with limited detailed studies. Flood data tables for each cross section included in this flood study update have been developed. 28
35 TABLE 8 LIMITED DETAILED FLOOD HAZARD DATA Cross Section Stream Station Flood Discharge (cfs) 1-Percent-Annual- Chance Water Surface Elevation (feet NAVD88) Butler Mill Branch 1 A 3, B 4, C 4, D 5, E 5, F 6, G 7, H 7, I 8, J 8, K 9, L 9, Feet above confluence with Nanticoke River/Lewes Creek 2 Elevation includes backwater effects 29
36 TABLE 8 LIMITED DETAILED FLOOD HAZARD DATA (Continued) Cross Section Stream Station Flood Discharge (cfs) 1-Percent-Annual- Chance Water Surface Elevation (feet NAVD88) Butler Mill Branch 1 (Continued) M 10, N 10, O 11, P 12, Q 12, R 13, S 13, T 14, U 14, V 15, W 15, X 16, Y 16, Z 17, AA 18, Chapel Branch 2 A 3, B 3, C 3, D 4, E 4, F 5, G 5, H 6, I 6, J 6, K 7, L 7, M 7, N 8, O 8, P 8, Q 8, R 9, Feet above confluence with Nanticoke River/Lewes Creek 2 Feet above confluence with Nanticoke River 3 Elevation includes backwater effects 30
37 TABLE 8 LIMITED DETAILED FLOOD HAZARD DATA (Continued) Cross Section Stream Station Flood Discharge (cfs) 1-Percent-Annual- Chance Water Surface Elevation (feet NAVD88) Chapel Branch 1 (Continued) S 9, T 10, U 10, V 11, W 11, X 12, Y 12, Z 12, AA 13, AB 14, AC 14, AD 14, AE 15, AF 15, AG 15, AH 16, AI 16, AJ 17, AK 17, AL 18, AM 18, AN 19, AO 19, AP 20, AQ 20, AR 21, AS 21, AT 22, AU 22, AV 22, AW 23, AX 23, AY 23, AZ 23, BA 24, Feet above confluence with Nanticoke River 2 Elevation includes backwater effects 31
38 TABLE 8 LIMITED DETAILED FLOOD HAZARD DATA (Continued) Cross Section Stream Station Flood Discharge (cfs) 1-Percent-Annual- Chance Water Surface Elevation (feet NAVD88) Chapel Branch 1 (Continued) BB 25, BC 23, BD 25, BE 26, BF 26, BG 26, BH 27, BI 27, BJ 28, BK 28, BL 29, Gravelly Branch 1 A 2,921 1, B 3,468 1, C 3,815 1, D 4,713 1, E 5,170 1, F 5,464 1, G 6,138 1, H 6,758 1, I 7,262 1, J 7,810 1, K 8,138 1, L 8,875 1, M 9,843 1, N 10,410 1, O 10,925 1, P 11,804 1, Q 12,395 1, R 12,976 1, S 13,535 1, T 14,134 1, U 14,697 1, V 15,350 1, Feet above confluence with Nanticoke River 32
39 TABLE 8 LIMITED DETAILED FLOOD HAZARD DATA (Continued) Cross Section Stream Station Flood Discharge (cfs) 1-Percent-Annual- Chance Water Surface Elevation (feet NAVD88) Gravelly Branch 1 (Continued) W 15,721 1, X 16,670 1, Y 18,660 1, Z 19,331 1, AA 19,844 1, AB 20,319 1, AC 21,013 1, AD 21,358 1, AE 22,387 1, AF 22,999 1, AG 23,502 1, AH 24,412 1, AI 25,563 1, AJ 26,260 1, AK 27,249 1, AL 28,077 1, AM 28,855 1, AN 29,776 1, AO 30,458 1, AP 30,988 1, AQ 31,521 1, AR 32,079 1, AS 32,560 1, AT 33,284 1, AU 34,074 1, AV 35,425 1, Gum Branch 1 A 1,088 1, B 1,598 1, C 2,186 1, D 2,730 1, E 3,326 1, F 3,903 1, G 4,447 1, Feet above confluence with Nanticoke River 2 Elevation includes backwater effects 33
40 TABLE 8 LIMITED DETAILED FLOOD HAZARD DATA (Continued) Cross Section Stream Station Flood Discharge (cfs) 1-Percent-Annual- Chance Water Surface Elevation (feet NAVD88) Gum Branch 1 (Continued) H 5,060 1, I 5,611 1, J 6,117 1, K 6,628 1, L 7,174 1, M 8,158 1, N 8,659 1, O 10,050 1, P 10, Q 11, R 11, S 12, T 12, U 13, V 13, W 14, X 14, Y 15, Z 15, AA 16, AB 16, AC 17, AD 17, AE 18, AF 17, AG 19, AH 19, AI 20, AJ 20, AK 21, AL 21, AM 22, AN 23, AO 23, AP 24, Feet above confluence with Nanticoke River 34
41 TABLE 8 LIMITED DETAILED FLOOD HAZARD DATA (Continued) Cross Section Stream Station Flood Discharge (cfs) 1-Percent-Annual- Chance Water Surface Elevation (feet NAVD88) Gum Branch 1 (Continued) AQ 24, AR 25, AS 26, AT 26, AU 27, AV 27, AW 28, AX 28, AY 29, AZ 29, BA 30, BB 60, BC 31, BD 31, BE 32, BF 32, BG 33, BH 33, BI 34, BJ 34, BK 35, BL 35, BM 36, BN 36, BO 37, BP 37, Hitch Pond Branch 2 A 321 1, B 999 1, C 1,427 1, D 1,911 1, E 3,703 1, F 4,180 1, G 4,746 1, Feet above confluence with Nanticoke River 2 Feet above confluence with James River 35
42 TABLE 8 LIMITED DETAILED FLOOD HAZARD DATA (Continued) Cross Section Stream Station Flood Discharge (cfs) 1-Percent-Annual- Chance Water Surface Elevation (feet NAVD88) Hitch Pond Branch 1 (Continued) H 5,193 1, I 5,708 1, J 6,201 1, K 6,737 1, L 7,325 1, M 7,811 1, N 8,375 1, O 8,911 1, P 9,491 1, Q 10,428 1, R 11,621 1, S 12,154 1, T 12,761 1, U 13,394 1, V 14,074 1, W 14,594 1, X 15,101 1, Y 15,591 1, Z 16,168 1, AA 16,569 1, AB 16,913 1, AC 17,391 1, AD 17,909 1, AE 18, AF 19, AG 19, AH 20, AI 21, Iron Branch 2 A Q* R 9, S 9, T 10, U 10, Feet above confluence with James Branch 2 Feet above confluence with Whartons Branch * Portion of streams studied by detailed methods included in the Floodway Data Tables 36
43 TABLE 8 LIMITED DETAILED FLOOD HAZARD DATA (Continued) Cross Section Stream Station Flood Discharge (cfs) 1-Percent-Annual- Chance Water Surface Elevation (feet NAVD88) Iron Branch 1 (Continued) V 11, W 11, X 12, Y 12, Z 13, AA 13, AB 14, AC 14, AD 14, AE 16, AF 16, AG 16, AH 17, James Branch 1 A 295 2, B 910 2, C 1,484 2, D 2,577 2, E 3,266 2, F 3,751 2, G 4,224 2, H 4,859 2, I 5,301 2, J 5,822 2, K 6,296 2, L 6,803 2, M 7,204 2, N 7,616 2, O 7,125 2, P 8,701 2, Q 9,256 2, R 9,753 2, S 10,208 2, T 10,748 2, Feet above confluence with Whartons Branch 2 Feet above confluence with Elliot Pond Branch 37
44 TABLE 8 LIMITED DETAILED FLOOD HAZARD DATA (Continued) Cross Section Stream Station Flood Discharge (cfs) 1-Percent-Annual- Chance Water Surface Elevation (feet NAVD88) James Branch 1 (Continued) U 11,269 2, V 11,737 2, W 12,229 2, X 12,693 2, Y 13,370 2, Z 13,783 2, AA 14,370 2, AB 15,081 1, AC 15,586 1, AD 15,998 1, AE 16,741 1, AF 17,230 1, AG 17,620 1, AH 18,159 1, AI 19,813 1, AJ 20,321 1, AK 20,777 1, AL 21,237 1, AM 21,922 1, AN 22,597 1, AO 23,002 1, AP 23,378 1, AQ 23,858 1, AR 24,357 1, AS 24,783 1, AT 25,372 1, AU 26,085 1, AV 27,487 1, AW 28,096 1, AX 28,915 1, AY 29,489 1, AZ 29,909 1, BA 30,410 1, BB 31,067 1, BC 31,648 1, Feet above confluence with Elliot Pond Branch 38
45 TABLE 8 LIMITED DETAILED FLOOD HAZARD DATA (Continued) Cross Section Stream Station Flood Discharge (cfs) 1-Percent-Annual- Chance Water Surface Elevation (feet NAVD88) James Branch 1 (Continued) BD 32,020 1, BE 32,482 1, BF 33,929 1, BG 34,175 1, BH 34,643 1, BI 35,228 1, BJ 35,657 1, BK 36,125 1, Marshy Hope Creek 2 A 820 5, B 1,305 5, C 1,886 5, D 2,348 5, E 2,863 5, F 3,363 5, G 3,861 5, H 4,304 5, I 4,802 5, J 5,308 5, K 5,878 5, L 6,430 5, M 6,944 5, N 7,467 5, O 8,068 5, P 8,650 5, Q 9,433 5, R 10,012 5, S 10,429 5, T 10,954 5, U 11,427 5, V 11,923 5, W 12,407 5, X 13,372 5, Y 14,860 5, Feet above confluence with Elliot Pond Branch 2 Feet above county boundary 39
46 TABLE 8 LIMITED DETAILED FLOOD HAZARD DATA (Continued) Cross Section Stream Station Flood Discharge (cfs) 1-Percent-Annual- Chance Water Surface Elevation (feet NAVD88) Marshy Hope Creek 1 (Continued) Z 15,355 5, AA 15,947 5, AB 16,429 5, AC 16,930 5, AD 17,430 5, AE 17,930 5, AF 18,786 5, AG 19,351 5, AH 20,114 4, AI 20,520 4, AJ 20,956 4, AK 21,421 4, AL 21,954 4, AM 22,441 4, AN 22,897 4, AO 23,256 4, AP 23,815 4, AQ 24,449 4, AR 24,950 4, AS 25,450 4, AT 26,057 4, AU 26,601 4, AV 27,409 4, Nanticoke River 2 A N* O 32,948 3, P 33,895 3, Q 34,295 3, R 34,947 3, S 35,447 3, T 35,857 3, U 36,646 3, Feet above county boundary 2 Feet above confluence with Morgan Branch * Portion of streams studied by detailed methods included in the Floodway Data Tables 40
47 TABLE 8 LIMITED DETAILED FLOOD HAZARD DATA (Continued) Cross Section Stream Station Flood Discharge (cfs) 1-Percent-Annual- Chance Water Surface Elevation (feet NAVD88) Nanticoke River 1 (Continued) V W 37,109 37,891 3,730 3, X 38,427 3, Y 39,249 3, Z 39,987 3, AA 40,561 3, AB 41,061 3, AC 41,847 3, AD 42,418 3, AE 43,189 3, AF 44,405 3, AG 45,268 3, AH 46,342 3, AI 46,760 3, AJ 47,416 3, AK 47,932 3, AL 48,499 3, AM 49,072 3, AN 49,637 3, AO 49,933 3, AP 50,609 3, AQ 51,097 3, AR 51,658 3, AS 52,322 3, AT 52,927 3, AU 53,646 3, AV 54,581 3, AW 55,288 3, AX 55,889 3, AY 56,315 3, AZ 58,582 3, BA 59,236 3, BB 60,052 3, BC 60,830 3, BD 61,327 3, BE 61,843 3, Feet above confluence with Morgan Branch 41
48 TABLE 8 LIMITED DETAILED FLOOD HAZARD DATA (Continued) Cross Section Stream Station Flood Discharge (cfs) 1-Percent-Annual- Chance Water Surface Elevation (feet NAVD88) Nanticoke River 1 (Continued) BF 62,572 3, BG 63,269 3, BH 63,807 3, BI 64,637 3, BJ 64,962 3, BK 65,526 3, BL 66,073 3, BM 66,604 3, BN 68,952 3, BO 69,525 3, BP 70,149 3, BQ 70,787 3, BR 71,183 3, BS 71,683 3, BT 72,375 3, BU 73,101 3, BV 73,694 3, BW 74,336 3, BX 74,677 3, BY 75,384 3, BZ 75,949 2, CA 76,472 2, CB 77,111 2, CC 78,366 2, CD 78,900 2, CE 79,481 2, CF 79,950 2, CG 80,432 2, CH 80,860 2, CI 81,375 2, CJ 82,968 2, CK 83,520 2, CL 84,047 2, CM 84,534 2, CN 85,012 2, Feet above confluence with Morgan Branch 42
49 TABLE 8 LIMITED DETAILED FLOOD HAZARD DATA (Continued) Cross Section Stream Station Flood Discharge (cfs) 1-Percent-Annual- Chance Water Surface Elevation (feet NAVD88) Nanticoke River 1 (Continued) CO 85,435 2, CP 85,813 2, CQ 86,242 2, CR 86,885 1, CS 87,203 1, CT 87,791 1, CU 88,358 1, CV 88,938 1, CW 89,644 1, CX 90,257 1, CY 90,754 1, CZ 91,357 1, DA 92,031 1, DB 92,592 1, DC 93,139 1, DD 93,636 1, DE 94,136 1, DF 94,628 1, DG 95,264 1, DH 95,956 1, DI 96,667 1, DJ 97,098 1, DK 97,706 1, DL 98,160 1, DM 98,683 1, DN 99,309 1, DO 99,830 1, DP 100,461 1, DQ 100,857 1, DR 101,307 1, DS 101,870 1, DT 102,390 1, DU 102,982 1, DV 103,602 1, DW 104,244 1, Feet above confluence with Morgan Branch 43
50 TABLE 8 LIMITED DETAILED FLOOD HAZARD DATA (Continued) Cross Section Stream Station Flood Discharge (cfs) 1-Percent-Annual- Chance Water Surface Elevation (feet NAVD88) Nanticoke River 1 (Continued) DX 104,838 1, DY 105,383 1, DZ 106,050 1, EA 106,720 1, EB 107,966 1, EC 108,605 1, ED 109,322 1, EE 109,832 1, EF 110,329 1, EG 110,775 1, EH 111,356 1, EI 112,065 1, EJ 112,853 1, EK 113, EL 114, Smith-Short and Willin Ditch 2 A B 1, C 1, D 2, E 2, F 3, G 3, H 4, I 4, J 5, K 5, Thompson Branch 3 A B C 1, D 1, Feet above confluence with Morgan Branch 2 Feet above confluence with Gravelly Branch 3 Feet above confluence with Hitch Pond Branch 4 Elevation includes backwater effects 44
51 TABLE 8 LIMITED DETAILED FLOOD HAZARD DATA (Continued) Cross Section Stream Station Flood Discharge (cfs) 1-Percent-Annual- Chance Water Surface Elevation (feet NAVD88) Thompson Branch 1 (Continued) D 1, E 2, F 2, G 3, H 3, I 4, Unnamed Tributary of White Marsh Branch 2 A B C D 2, E 3, F 3, G 4, H 4, Toms Dam Branch 3 A B 1, C 1, D 2, E 2, F 2, G 3, H 4, I 4, J 4, K 5, L 5, M 6, N 7, O 7, Feet above confluence with Hitch Pond Branch 2 Feet above confluence with White Marsh Branch 3 Feet above confluence with Gum Branch 4 Elevation includes backwater effects 45
52 TABLE 8 LIMITED DETAILED FLOOD HAZARD DATA (Continued) Cross Section Stream Station Flood Discharge (cfs) 1-Percent-Annual- Chance Water Surface Elevation (feet NAVD88) Toms Dam Branch 1 (Continued) P 7, Q 8, R 9, S 9, T 10, U 11, V 11, W 12, X 12, Y 13, Z 13, AA 14, AB 14, AC 14, AD 15, AE 16, AF 16, AG 17, AH 17, AI 18, AJ 18, AK 19, AL 19, AM 19, AN 20, AO 20, AP 21, White Marsh Branch 2 A 1, B 1, Feet above confluence with Gum Branch 2 Feet above confluence with Nanticoke River 3 Elevation includes backwater effects 46
53 TABLE 8 LIMITED DETAILED FLOOD HAZARD DATA (Continued) Cross Section Stream Station Flood Discharge (cfs) 1-Percent-Annual- Chance Water Surface Elevation (feet NAVD88) White Marsh Branch 1 (Continued) C 2, D 2, E 3, F 3, G 4, H 4, Feet above confluence with Nanticoke River For FIRM panels dated July 16, 2004, or later, qualifying bench marks within a given jurisdiction that are cataloged by the National Geodetic Survey (NGS) and entered into the National Spatial Reference System (NSRS) as First or Second Order Vertical and have a vertical stability classification of A, B, or C are shown and labeled on the FIRM with their 6-character NSRS Permanent Identifier. Bench marks cataloged by the NGS and entered into the NSRS vary widely in vertical stability classification. NSRS vertical stability classifications are as follows: Stability A: Monuments of the most reliable nature, expected to hold position/elevation well (e.g., mounted in bedrock) Stability B: Monuments which generally hold their position/elevation well (e.g., concrete bridge abutment) Stability C: Monuments which may be affected by surface ground movements (e.g., concrete monument below the frost line) Stability D: Mark of questionable or unknown vertical stability (e.g., concrete monument above frost line, or steel witness post) In addition to NSRS bench marks, the FIRM may also show vertical control monuments established by a local jurisdiction; these monuments will be shown on the FIRM with the appropriate designations. Local monuments will only be placed on the FIRM if the community has requested that they be included, and if the monuments meet the aforementioned NSRS inclusion criteria. 47
54 To obtain elevation, description, and /or location information for bench marks shown on the FIRM for this jusrisdiction, please contact the Information Services Branch of the NGS at (301) , or visit their Web site at It is important to note that temporary vertical monuments are often established during the preparation of a flood hazard analysis for the purpose of establishing local vertical control. Although these monuments are not shown on the FIRM, they may be found in the Technical Support Data Notebook associated with this FIS and FIRM. Interested individuals may contact FEMA to access this data. 3.3 Coastal Analyses Tidal Flooding Sources Due to Sussex County's flat topography, many areas are subject to tidal flooding. The following sources produce tidal flooding in Sussex County: the Atlantic Ocean, Delaware Bay, Chesapeake Bay, Indian River Bay, Rehoboth Bay, Assawoman Bay, and Little Assawoman Bay. Along the Atlantic coast, tidal flooding affects the communities of the City of Rehoboth Beach; the Towns of Bethany Beach, Dewey Beach, Fenwick Island, Henlopen Acres, South Bethany; and the unincorporated areas of Sussex County. Communities along the Delaware Bay at risk to tidal flooding are the City of Lewes, the Town of Slaughter Beach, and the unincorporated areas of Sussex County. Inland areas are also at risk as tidal flooding propagates upstream affecting the following communities and associated flooding sources: the City of Milford on the Mispillion River, which discharges into the Delaware Bay; the City of Seaford and the Town of Blades on the Nanticoke River, which discharges into the Chesapeake Bay; the Towns of Bethel and Laurel on Broad Creek, which discharges into the Nanticoke River; the Town of Milton on the Broadkill River, which discharges into the Delaware Bay; the Town of Millsboro on the Indian River, which discharges into Indian River Bay; the Town of Millville on White Creek, which discharges into Indian River Bay; the Town of Ocean View on White Creek Ditch, which discharges into White Creek; and the unincorporated areas of Sussex County on various streams influenced by tidal flooding. Chesapeake Bay The Nanticoke River and Broad Creek in western Sussex County are part of the Nanticoke River Basin. The Nanticoke River discharges into the Chesapeake Bay near the Town of Chance, Maryland and is subject to tidal flooding from the bay. Indian River Bay and Rehoboth Bay Historical data are listed in the tabulation below for extreme events at two locations, one each on Indian River Bay (Rosedale Beach) and Rehoboth Bay (Dewey Beach) (USGS, 1992). 48
55 Elevation in Feet (NAVD88) Storm Indian River Bay Rehoboth Bay March Halloween January Elevations from the two recent storms were recorded at tide gages; the 1962 storm elevations were measured from high watermarks. Additional data for the two more recent storms are available from the USGS at various locations on the bay system. Coastal analysis for this revision, considering storm characteristics and the shoreline and bathymetric characteristics of the flooding sources studied, were carried out to provide estimates of the elevations of floods of the selected recurrence intervals along the shoreline. Users of the FIRM should be aware that coastal flood elevations are provided in Table 9, Summary of Coastal Stillwater Elevations table in this report. If the elevation on the FIRM is higher than the elevation shown in this table, a wave height, wave runup, and/or wave setup component likely exists, in which case, the higher elevation should be used for construction and/or floodplain management purposes. An analysis was performed to establish the frequency peak elevation relationships for coastal flooding in Sussex County. The FEMA, Region III office, initiated a study in 2008 to update the coastal storm surge elevations within the states of Virginia, Maryland, and Delaware, and the District of Columbia including the Atlantic Ocean, Chesapeake Bay, the Delaware Bay, and their tributaries. The study replaces outdated coastal analyses as well as previously published storm surge stillwater elevations for all FIS Reports in the study area, including Sussex County, DE, and serves as the basis for updated FIRMs. Study efforts were initiated in 2008 and concluded in The Delaware Bay and Atlantic Ocean are the primary flooding sources in Sussex County. Coastal flooding along Delaware Bay north of Cape Henlopen, primarily impacts suburban and rural areas, but there are also large areas of swamp and marshland. Areas south of Cape Henlopen are directly impacted by waves from the Atlantic Ocean as well as Indian River Bay, Rehoboth Bay, and Little Assawoman Bay, which are additional coastal flooding sources in the south portion of Sussex County. The entire Atlantic Ocean coastline and part of the Delaware Bay coastline is comprised of dunes with elevations that vary from four feet to greater than nine feet, North American Vertical Datum of 1988 (NAVD88). The storm surge study was conducted for FEMA by the USACE and its project partners under Project HSFE03-06-X-0023, NFIP Coastal Storm Surge Model for Region III and Project HSFE03-09-X-1108, Phase II Coastal Storm Surge Model for FEMA Region III. The work was performed by the Coastal Processes Branch (HF-C) of the Flood and Storm Protection Division (HF), U.S. Army Engineer Research and Development Center Coastal & Hydraulics Laboratory (ERDC-CHL). 49
56 The end-to-end storm surge modeling system includes the Advanced Circulation Model for Oceanic, Coastal and Estuarine Waters (ADCIRC) for simulation of 2- dimensional hydrodynamics. ADCIRC was dynamically coupled to the unstructured numerical wave model Simulating Waves Nearshore (unswan) to calculate the contribution of waves to total storm surge (FEMA, 2010). The resulting model system is typically referred to as SWAN+ADCIRC (FEMA, 2010). A seamless modeling grid was developed to support the storm surge modeling efforts. The modeling system validation consisted of a comprehensive tidal calibration followed by a validation using carefully reconstructed wind and pressure fields from three major flood events for the Region III domain: Hurricane Isabel, Hurricane Ernesto, and extratropical storm Ida. Model skill was accessed by quantitative comparison of model output to wind, wave, water level and high water mark observations. The tidal surge in the Delaware Bay and Atlantic Ocean affects 20 miles and 25 miles of Sussex County coastline respectively, and that entire length was modeled for overland wave propagation. The fetch length across the Delaware Bay is approximately 11 miles. The storm-surge elevations for the 10-, 2-, 1-, and.2- percent annual chance floods were determined for the Delaware Bay and are shown in Table 9, Summary of Coastal Stillwater Elevations. The analyses reported herein reflect the stillwater elevations due to tidal and wind setup effects. TABLE 9 - SUMMARY OF COASTAL STILLWATER ELEVATIONS ELEVATION (feet NAVD88) 10-Percent 2-Percent 1-Percent- 0.2-Percent- FLOODING SOURCE Annual- Annual- Annual- Annual- AND LOCATION Chance Chance Chance Chance ATLANTIC OCEAN Coastline from Cape Henlopen to just South of Dewey Beach Coastline from just south of Dewey Beach to just north of Bethany Beach Coastline from just north of Bethany Beach to Delaware- Maryland State line CHESAPEAKE BAY Coastline at Chance DELAWARE BAY Coastline from Kent-Sussex County line to Cape Henlopen
57 TABLE 9 - SUMMARY OF COASTAL STILLWATER ELEVATIONS- (Continued) ELEVATION (feet NAVD88) 10-Percent 2-Percent 1-Percent- 0.2-Percent- FLOODING SOURCE Annual- Annual- Annual- Annual- AND LOCATION Chance Chance Chance Chance INDIAN RIVER BAY Entire coastline REHOBOTH BAY Entire coastline ASSAWOMAN BAY Coastline within Sussex County LITTLE ASSAWOMAN BAY Entire coastline The methodology for analyzing the effects of wave heights associated with coastal storm surge flooding is described in a report prepared by the National Academy of Sciences (NAS) (NAS, 1977). This method is based on three major concepts. First, depth-limited waves in shallow water reach maximum breaking height that is equal to 0.78 times the stillwater depth. The wave crest is 70 percent of the total wave height above the stillwater level. The second major concept is that wave height may be diminished by dissipation of energy due to the presence of obstructions, such as sand dunes, dikes and seawalls, buildings and vegetation. The amount of energy dissipation is a function of the physical characteristics of the obstruction and is determined by procedures prescribed in NAS Report. The third major concept is that wave height can be regenerated in open fetch areas due to the transfer of wind energy to the water. This added energy is related to fetch length and depth. The coastal analysis for this revision involved transect layout, field reconnaissance, erosion analysis, and overland wave modeling including wave setup, wave height analysis and wave runup. Wave heights were computed across transects that were located along coastal and inland bay areas of Sussex County, as illustrated on the FIRMs. The transects were located with consideration given to existing transect locations and to the physical and cultural characteristics of the land so that they would closely represent conditions in the locality. Each transect was taken perpendicular to the shoreline and extended inland to a point where coastal flooding ceased. Along each transect, wave heights and elevations were computed considering the combined effects of changes in ground 51
58 elevation, vegetation, and physical features. The stillwater elevations for a 1% annual chance event were used as the starting elevations for these computations. Wave heights were calculated to the nearest 0.1 foot, and wave elevations were determined at whole-foot increments along the transects. The location of the 3- foot breaking wave for determining the terminus of the Zone VE (area with velocity wave action) was computed at each transect. Along the open coast, the Zone VE designation applies to all areas seaward of the landward toe of the primary frontal dune system. The primary frontal due is defined as the point where the ground profile changes from relatively steep to relatively mild. Dune erosion was taken into account along the Delaware Bay and Atlantic Ocean coastline. A review of the geology and shoreline type in Sussex County was made to determine the applicability of standard erosion methods, and FEMA s standard erosion methodology for coastal areas having primary frontal dunes, referred to as the 540 rule, was used (FEMA, 2007). This methodology first evaluates the dune s cross-sectional profile to determine whether the dune has a reservoir of material that is greater or less than 540 square feet. If the reservoir is greater than 540 square feet, the retreat erosion method is employed and approximately 540 square feet of the dune is eroded using a standardized eroded profile, as specified in FEMA guidelines. If the reservoir is less than 540 square feet, the remove erosion method is employed where the dune is removed for subsequent analysis, again using a standard eroded profile. The storm surge study provided the return period stillwater elevations required for erosion analyses. Each cross-shore transect was analyzed for erosion, when applicable. Wave height calculations used in this flood study are based on the methodologies described in the FEMA guidance for coastal mapping (FEMA, February 2007). Wave setup results in an increased water level at the shoreline due to the breaking of waves and transfer of momentum to the water column during hurricanes and severe storms. For the Sussex County study, wave setup was determined directly from the coupled wave and storm surge model. The total stillwater elevation (SWEL) with wave setup was then used for simulations of inland wave propagation conducted using FEMA s Wave Height Analysis for Flood Insurance Studies (WHAFIS) model Version 4.0 (FEMA, August 2007). WHAFIS is a onedimensional model that was applied to each transect in the study area. The model uses the specified SWEL, the computed wave setup, and the starting wave conditions as input. Simulations of wave transformations were then conducted with WHAFIS taking into account the storm-induced erosion and overland features of each transect. Output from the model includes the combined SWEL and wave height along each cross-shore transect allowing for the establishment of base flood elevations (BFEs) and flood zones from the shoreline to points inland within the study area. Wave runup is defined as the maximum vertical extent of wave uprush on a beach or structure. FEMA s 2007 Guidelines and Specifications require the 2% wave runup level be computed for the coastal feature being evaluated (cliff, coastal 52
59 bluff, dune, or structure) (FEMA, February 2007). The 2% runup level is the highest 2 percent of wave runup affecting the shoreline during the 1-percentannual-chance flood event. Each transect defined within the Region III study area was evaluated for the applicability of wave runup, and if necessary, the appropriate runup methodology was selected and applied to each transect. Runup elevations were then compared to WHAFIS results to determine the dominant process affecting BFEs and associated flood hazard levels. Based on wave runup rates, wave overtopping was computed following the FEMA 2007 Guidelines and Specifications. Computed controlling wave heights at the shoreline range from 6.93 feet at the northern end of the county where the coastal surge is higher to 5.86 feet at the southern end where the coastal surge is lower. The corresponding wave elevation at the shoreline varies from feet NAVD 88 at the northern end to feet NAVD 88 at the southern end. Any dunes present along the coast serve to reduce wave height transmitted inland, but the large areas of low-lying marshes which are inundated by the tidal surge allow regeneration of the waves as they proceed inland. In general, the relatively shallow depth of water in the marshes along with the energy dissipating effects of vegetation allows only minor regeneration of the waves. Figure 3, Transect Location Map, illustrates the location of each transect. Along each transect, wave envelopes were computed considering the combined effects of changes in ground elevation, vegetation and physical features. Between transects, elevations were interpolated using topographic maps, land-use and land-cover data, and engineering judgment to determine the aerial extent of flooding. The results of the calculations are accurate until local topography, vegetation, or cultural development within the community undergoes major changes. In Table 10, Transect Data, the flood hazard zone and base flood elevations for each transect flooding source is provided, along with the 10-, 2-, 1-, and 0.2-percent annual chance stillwater elevations for the respective flooding source. 53
60 54
61 TABLE 10 - TRANSECT DATA Starting Stillwater Elevations (ft NAVD88) Starting Wave Conditions for the 1% Annual Chance Range of Stillwater Elevations (ft NAVD88) Flood Source Transect Coordinates Significant Wave Height H s (ft) Peak Wave Period T p (sec) 10% Annual Chance 2% Annual Chance 1% Annual Chance 0.2% Annual Chance Delaware Bay 1 N W Delaware Bay 2 N W Delaware Bay 3 N W Delaware Bay 4 N W Delaware Bay 5 N W Delaware Bay 6 N W Delaware Bay 7 N W Delaware Bay 8 N W Delaware Bay 9 N W Delaware Bay 10 N W Delaware Bay 11 N W Delaware Bay 12 N W
62 Table 10 - Transect Data- (continued) Starting Stillwater Elevations (ft NAVD88) Starting Wave Conditions for the 1% Annual Chance Range of Stillwater Elevations (ft NAVD88) Flood Source Transect Coordinates Significant Wave Height H s (ft) Peak Wave Period T p (sec) 10% Annual Chance 2% Annual Chance 1% Annual Chance 0.2% Annual Chance Delaware Bay 13 N W Delaware Bay 14 N W Delaware Bay 15 N W Delaware Bay 16 N W Delaware Bay 17 N W Delaware Bay 18 N W Delaware Bay 19 N W Delaware Bay 20 N W Delaware Bay 21 N W Delaware Bay 22 N W
63 Table 10 - Transect Data- (continued) Starting Stillwater Elevations (ft NAVD88) Starting Wave Conditions for the 1% Annual Chance Range of Stillwater Elevations (ft NAVD88) Flood Source Transect Coordinates Significant Wave Height H s (ft) Peak Wave Period T p (sec) 10% Annual Chance 2% Annual Chance 1% Annual Chance 0.2% Annual Chance Delaware Bay 23 N W Atlantic Ocean 24 N W Atlantic Ocean 25 N W Atlantic Ocean 26 N W Atlantic Ocean 27 N W Atlantic Ocean 28 N W Atlantic Ocean 29 N W Atlantic Ocean 30 N W Atlantic Ocean 31 N W Atlantic Ocean 32 N W Atlantic Ocean 33 N W Atlantic Ocean 34 N W Atlantic Ocean 35 N W
64 Table 10 - Transect Data- (continued) Starting Stillwater Elevations (ft NAVD88) Starting Wave Conditions for the 1% Annual Chance Range of Stillwater Elevations (ft NAVD88) Flood Source Transect Coordinates Significant Wave Height H s (ft) Peak Wave Period T p (sec) 10% Annual Chance 2% Annual Chance 1% Annual Chance 0.2% Annual Chance Indian River Bay 36 N W Atlantic Ocean 37 N W Atlantic Ocean 38 N W Atlantic Ocean 39 N W Indian River Bay 40 N W Atlantic Ocean 41 N W Atlantic Ocean 42 N W Atlantic Ocean 43 N W Indian River Bay 44 N W Atlantic Ocean 45 N W Atlantic Ocean 46 N W Atlantic Ocean 47 N W Atlantic Ocean 48 N W
65 Table 10 - Transect Data- (continued) Starting Stillwater Elevations (ft NAVD88) Starting Wave Conditions for the 1% Annual Chance Range of Stillwater Elevations (ft NAVD88) Flood Source Transect Coordinates Significant Wave Height H s (ft) Peak Wave Period T p (sec) 10% Annual Chance 2% Annual Chance 1% Annual Chance 0.2% Annual Chance Atlantic Ocean 49 N W Atlantic Ocean 50 N W Indian River Bay 51 N W Atlantic Ocean 52 N W Atlantic Ocean 53 N W Atlantic Ocean 54 N W Atlantic Ocean 55 N W Atlantic Ocean 56 N W Atlantic Ocean 57 N W Atlantic Ocean 58 N W Atlantic Ocean 59 N W Atlantic Ocean 60 N W Atlantic Ocean 61 N W
66 Table 10 - Transect Data- (continued) Starting Stillwater Elevations (ft NAVD88) Flood Source Atlantic Ocean Transect Starting Wave Conditions for the 1% Annual Chance Coordinates 62 N W Significant Wave Height H s (ft) Peak Wave Period T p (sec) 10% Annual Chance Range of Stillwater Elevations (ft NAVD88) 2% Annual Chance % Annual Chance % Annual Chance Atlantic Ocean 63 N W Atlantic Ocean 64 N W Atlantic Ocean 65 N W Atlantic Ocean 66 N W Atlantic Ocean 67 N W Atlantic Ocean 68 N W Atlantic Ocean 69 N W Little Assawoman Bay Atlantic Ocean 70 N W N W Atlantic Ocean 72 N W Rehoboth Bay 73 N W Rehoboth Bay 74 N W
67 Table 10 - Transect Data- (continued) Starting Stillwater Elevations (ft NAVD88) Starting Wave Conditions for the 1% Annual Chance Range of Stillwater Elevations (ft NAVD88) Flood Source Transect Coordinates Significant Wave Height H s (ft) Peak Wave Period T p (sec) 10% Annual Chance 2% Annual Chance 1% Annual Chance 0.2% Annual Chance Rehoboth Bay 75 N W Rehoboth Bay 76 N W Rehoboth Bay 77 N W Rehoboth Bay 78 N W Rehoboth Bay 79 N W Rehoboth Bay 80 N W Rehoboth Bay 81 N W Rehoboth Bay 82 N W Indian River Bay 83 N W Indian River Bay 84 N W Indian River Bay 85 N W Indian River Bay 86 N W Indian River Bay 87 N W
68 Table 10 - Transect Data- (continued) Starting Stillwater Elevations (ft NAVD88) Starting Wave Conditions for the 1% Annual Chance Range of Stillwater Elevations (ft NAVD88) Flood Source Transect Coordinates Indian River 88 N W Significant Wave Height H s (ft) Peak Wave Period T p (sec) 10% Annual Chance 2% Annual Chance 1% Annual Chance 0.2% Annual Chance Indian River Bay 89 N W Indian River Bay 90 N W Indian River Bay 91 N W Indian River Bay 92 N W Indian River Bay 93 N W Indian River Bay 94 N W Indian River Bay 95 N W Indian River Bay 96 N W Areas of coastline subject to significant wave attack are referred to as coastal high hazard zones. The USACE has established the 3-foot breaking wave as the criterion for identifying the limit of coastal high hazard zones. The 3-foot wave has been determined to be the minimum size wave capable of causing major damage to conventional wood frame of brick veneer structures. The one exception to the 3-foot wave criteria is where a primary frontal dune exists. The limit of the coastal high hazard area then becomes the landward toe of the primary frontal dune or where a 3-foot or greater breaking wave exists, whichever is most landward. The coastal high hazard zone is depicted on the FIRMs as Zone VE, where the delineated flood hazard includes wave heights equal to or greater than three feet. Zone AE is depicted on the FIRMs where the delineated flood hazard 62

69 includes wave heights less than three feet. A depiction of how the Zones VE and AE are mapped is shown in Figure 4. Post-storm field visits and laboratory tests have confirmed that wave heights as small as 1.5 feet can cause significant damage to structures when constructed without consideration to the coastal hazards. Additional flood hazards associated with coastal waves include floating debris, high velocity flow, erosion, and scour which can cause damage to Zone AE-type construction in these coastal areas. To help community officials and property owners recognize this increased potential for damage due to wave action in the AE zone, FEMA issued guidance in December 2008 on identifying and mapping the 1.5-foot wave height line, referred to as the Limit of Moderate Wave Action (LiMWA). While FEMA does not impose floodplain management requirements based on the LiMWA, the LiMWA is provided to help communicate the higher risk that exists in that area. Consequently, it is important to be aware of the area between this inland limit and the Zone VE boundary as it still poses a high risk, though not as high of a risk as Zone VE, see Figure 4 "Transect Schematic". 3.4 Vertical Datum Figure 4: Transect schematic All FIS reports and FIRMs are referenced to a specific vertical datum. The vertical datum provides a starting point against which flood, ground, and structure elevations can be referenced and compared. Until recently, the standard vertical datum used for newly created or revised FIS reports and FIRMs was the NGVD29. With the completion of the NAVD88, many FIS reports and FIRMs are now prepared using NAVD88 as the referenced vertical datum. 63
KENT COUNTY, DELAWARE AND INCORPORATED AREAS
 This preliminary FIS report only includes revised Floodway Data Tables and revised Flood Profiles. The unrevised components will appear in the final FIS report. KENT COUNTY, DELAWARE AND INCORPORATED AREAS
Sussex County, DE Preliminary Study Overview
 Sussex County, DE Preliminary Study Overview Coastal study scope: 102 miles of entire County shoreline Revised 102 panels for coastal study Riverine study scope: 14 streams, 67.1 miles, within the Nanticoke
MADISON COUNTY, ILLINOIS AND INCORPORATED AREAS
 VOLUME 2 OF 2 MADISON COUNTY, ILLINOIS AND INCORPORATED AREAS * * * COMMUNITY COMMUNITY NAME NUMBER ALHAMBRA, VILLAGE OF 170270 ALTON, CITY OF 170437 BETHALTO, VILLAGE OF 170438 COLLINSVILLE, CITY OF 170439
VOLUME 2 OF 5 VOLUSIA COUNTY, FLORIDA AND INCORPORATED AREAS COMMUNITY NAME NUMBER COMMUNITY NAME NUMBER
 VOLUME 2 OF 5 VOLUSIA COUNTY, FLORIDA AND INCORPORATED AREAS COMMUNITY NAME NUMBER COMMUNITY NAME NUMBER DAYTONA BEACH, CITY OF 125099 NEW SMYRNA BEACH, CITY OF 125132 DAYTONA BEACH SHORES, CITY OF 125100
JEFFERSON COUNTY, ARKANSAS AND INCORPORATED AREAS
 JEFFERSON COUNTY, ARKANSAS Community Name Community Number ALTHEIMER, CITY OF 050107 HUMPHREY, CITY OF 050108 JEFFERSON COUNTY 050440 (UNINCORPORATED AREAS) PINE BLUFF, CITY OF 050109 REDFIELD, CITY OF
Federal Emergency Management Agency FLOOD INSURANCE STUDY NUMBER 48423CV001B. Smith County. Preliminary May 9, 2011
 VOLUME 1 of 2 SMITH COUNTY, TEXAS Community Name Community Number Smith County ARP, CITY OF 480567 BULLARD, CITY OF* 480568 HIDEAWAY, CITY OF 480200 LINDALE, CITY OF 480569 NEW CHAPEL HILL, CITY OF 480157
GALLATIN COUNTY, MONTANA AND INCORPORATED AREAS
 GALLATIN COUNTY, MONTANA AND INCORPORATED AREAS Community Name Community Number * BELGRADE, CITY OF 300105 BOZEMAN, CITY OF 300028 GALLATIN COUNTY UNINCORPORATED AREAS 300027 * MANHATTAN, TOWN OF 300034
Evaluation of June 9, 2014 Federal Emergency Management Agency Flood Insurance Study for Town of Weymouth, Norfolk, Co, MA
 Evaluation of June 9, 2014 Federal Emergency Management Agency Flood Insurance Study for Town of Weymouth, Norfolk, Co, MA Prepared For: Woodard & Curran 95 Cedar Street, Suite 100 Providence, RI 02903
SANTA ROSA COUNTY, FLORIDA AND INCORPORATED AREAS
 VOLUME 1 OF 1 SANTA ROSA COUNTY, FLORIDA AND INCORPORATED AREAS COMMUNITY NAME GULF BREEZE, CITY OF 120275 JAY, TOWN OF 120339 MILTON, CITY OF 120276 SANTA ROSA COUNTY, UNINCORPORATED AREAS COMMUNITY NUMBER
MONTGOMERY COUNTY, TEXAS AND INCORPORATED AREAS VOLUME 2 OF 6
 MONTGOMERY COUNTY, TEXAS AND INCORPORATED AREAS VOLUME 2 OF 6 COMMUNITY NAME COMMUNITY NUMBER CONROE, CITY OF 480484 CUT AND SHOOT, CITY OF 481279 HOUSTON, CITY OF 480296 MAGNOLIA, CITY OF 481261 MONTGOMERY,
Technical Report Culvert A Hydraulic Analysis
 DATE: November 3, 2011 Technical Report Culvert A Hydraulic Analysis TO: FROM: RE: Jim Reiser, P.E. Project Manager Parsons Brinckerhoff, Inc. Kurt Killian, P.E., CFM Parsons Brinckerhoff, Inc. Design
Flood Insurance Study
 Flood Insurance Study Tulsa County, Oklahoma and Incorporated Areas VOLUME 5 of 7 COMMUNITY NAME COMMUNITY NO. Bixby, City of 400207 Broken Arrow, City of 400236 Collinsville, City of 400360 Glenpool,
Flood Insurance Study
 Flood Insurance Study Tulsa County, Oklahoma and Incorporated Areas VOLUME 6 of 7 COMMUNITY NAME COMMUNITY NO. Bixby, City of 400207 Broken Arrow, City of 400236 Collinsville, City of 400360 Glenpool,
WASHINGTON COUNTY, MAINE (ALL JURISDICTIONS)
") VOLUME 1 OF 1 WASHINGTON COUNTY, MAINE (ALL JURISDICTIONS) COMMUNITY NAME CID COMMUNITY NAME CID TOWN OF ADDISON 230132 TOWNSHIP OF BROOKTON 230470 TOWN OF ALEXANDER 230303 CITY OF CALAIS 230134 TOWN OF
VOLUME 1 OF 1 WASHINGTON COUNTY, MAINE (ALL JURISDICTIONS) COMMUNITY NAME CID COMMUNITY NAME CID TOWN OF ADDISON 230132 TOWNSHIP OF BROOKTON 230470 TOWN OF ALEXANDER 230303 CITY OF CALAIS 230134 TOWN OF
PALM BEACH COUNTY, FLORIDA AND INCORPORATED AREAS
 PALM BEACH COUNTY, FLORIDA AND INCORPORATED AREAS Palm Beach County Community Name Community Number PALM BEACH COUNTY (UNINCORPORATED AREAS) 120192 ATLANTIS, CITY OF 120193 BELLE GLADE, CITY OF 120194
OFFICE OF STRUCTURES MANUAL FOR HYDROLOGIC AND HYDRAULIC DESIGN CHAPTER 11 APPENDIX B TIDEROUT 2 USERS MANUAL
 OFFICE OF STRUCTURES MANUAL FOR HYDROLOGIC AND HYDRAULIC DESIGN CHAPTER 11 APPENDIX B TIDEROUT 2 USERS MANUAL APRIL 2011 APRIL 2011 Page 1 Preface TIDEROUT 2, Build 1.22 dated June 29, 2006 is the current
DELAWARE S VULNERABLE COASTAL AREAS. DELAWARE INLAND BAYS and DELAWARE BAY RECONNAISSANCE STUDY
 DELAWARE S VULNERABLE COASTAL AREAS and the DELAWARE INLAND BAYS and DELAWARE BAY RECONNAISSANCE STUDY Kimberly K. McKenna, PG Delaware Dept. of Natural Resources & Environmental Control Division of Watershed
WALTON COUNTY, FLORIDA
 VOLUME 1 OF 1 WALTON COUNTY, FLORIDA AND INCORPORATED AREAS COMMUNITY NAME DEFUNIAK SPRINGS, CITY OF NUMBER 120318 FREEPORT, CITY OF 120319 PAXTON, TOWN OF 120423 WALTON COUNTY, UNINCORPORATED AREAS 120317
2016 NC Coastal Local Governments Annual Meeting
 2016 NC Coastal Local Governments Annual Meeting Coastal Flood Study Modeling and Mapping 101 April 21, 2016 Tom Langan, PE, CFM Engineering Supervisor NCEM Floodplain Mapping Program FEMA Coastal Flood
NORFOLK COUNTY, MASSACHUSETTS (ALL JURISDICTIONS)
") NORFOLK COUNTY, MASSACHUSETTS (ALL JURISDICTIONS) Volume 4 of 4 COMMUNITY NAME COMMUNITY NUMBER AVON, TOWN OF 250231 BELLINGHAM, TOWN OF 250232 BRAINTREE, TOWN OF 250233 BROOKLINE, TOWN OF 250234 CANTON,
NORFOLK COUNTY, MASSACHUSETTS (ALL JURISDICTIONS) Volume 4 of 4 COMMUNITY NAME COMMUNITY NUMBER AVON, TOWN OF 250231 BELLINGHAM, TOWN OF 250232 BRAINTREE, TOWN OF 250233 BROOKLINE, TOWN OF 250234 CANTON,
Plan B Dam Breach Assessment
 Plan B Dam Breach Assessment Introduction In support of the Local Sponsor permit applications to the states of Minnesota and North Dakota, a dam breach analysis for the Plan B alignment of the Fargo-Moorhead
Citrus, Hernando, and Pasco Coastal Hazard Analysis. Flood Risk Review Meeting Citrus, Hernando, and Pasco Counties, Florida December 14, 2017
 Citrus, Hernando, and Pasco Coastal Hazard Analysis Flood Risk Review Meeting Citrus, Hernando, and Pasco Counties, Florida December 14, 2017 Introductions Risk MAP Project Team FEMA Region IV RAMPP (study
PROFILE OF SACRAMENTO RIVER, FREEPORT TO VERONA, CALIFORNIA,
 PROFILE OF SACRAMENTO RIVER, FREEPORT TO VERONA, CALIFORNIA, FLOOD OF FEBRUARY 1986 By J.C. Blodgett and J.B. Lucas U.S. GEOLOGICAL SURVEY Open-File Report 88-82 CO CM I m r-h CM Sacramento, California
Sediment Management Plan Rehoboth Bay
 Sediment Management Plan Rehoboth Bay STAC Meeting November 16, 2007 Goals of the Study Improve planning for future dredging needs Reduce the dependency on dredging Study Tasks Environmental data Historical
Boothbay Harbor Rotary Club May 12, 2016
 Mapping Potential Sea Level Rise and Storm Surge in Boothbay Harbor, ME Boothbay Harbor Rotary Club May 12, 2016 Peter A. Slovinsky, Marine Geologist Maine Geological Survey S.M. Dickson, MGS Quickly,
VOLUME 1 OF 5 VOLUSIA COUNTY, FLORIDA AND INCORPORATED AREAS COMMUNITY NAME NUMBER COMMUNITY NAME NUMBER
 VOLUME 1 OF 5 VOLUSIA COUNTY, FLORIDA AND INCORPORATED AREAS COMMUNITY NAME NUMBER COMMUNITY NAME NUMBER DAYTONA BEACH, CITY OF 125099 DAYTONA BEACH SHORES, CITY OF NEW SMYRNA BEACH, CITY OF 125132 125100
APPENDIX J HYDROLOGY AND WATER QUALITY
 APPENDIX J HYDROLOGY AND WATER QUALITY J-1 Technical Report on Airport Drainage, Northern Sector Airport and Ordinance Creek Watershed / Preliminary Creek Constructed Natural Channel Culvert J-2 Preliminary
HEC-RAS Two-Dimensional Modeling: Lake Wausau, Wisconsin River and Tributaries Big Rib River and Eau Claire River January 2018
 Final Report HEC-RAS Two-Dimensional Modeling: Lake Wausau, Wisconsin River and Tributaries Big Rib River and Eau Claire River City of Schofield, City of Wausau, Town of Rib Mountain, and Village of Rothschild,
Physical Map Revisions in Connecticut due to Updated Coastal Flood Hazards F8: Maps in Transition
 Physical Map Revisions in Connecticut due to Updated Coastal Flood Hazards F8: Maps in Transition Brian Caufield, P.E., CFM Principal Engineer CDM Smith Kerry Bogdan, CFM Senior Engineer FEMA Region I
The History of Coastal Flood Hazard Assessments in the Great Lakes
 The History of Coastal Flood Hazard Assessments in the Great Lakes Brian A. Caufield, P.E., CFM June 23, 2016 2 The Great Lakes Some Statistics Courtesy of Great Lakes Information Network One-fifth of
CALCASIEU SALINITY STRUCTURES. HYDRODYNAMIC MODELING (To Support Design of Salinity Barriers)
") CALCASIEU SALINITY STRUCTURES HYDRODYNAMIC MODELING (To Support Design of Salinity Barriers) Presentation Overview 1 2 3 4 5 Project Overview and CEA Circulation Modeling Vessel Hydrodynamics Modeling
CALCASIEU SALINITY STRUCTURES HYDRODYNAMIC MODELING (To Support Design of Salinity Barriers) Presentation Overview 1 2 3 4 5 Project Overview and CEA Circulation Modeling Vessel Hydrodynamics Modeling
VOLUME 1 OF 1 VOLUSIA COUNTY, FLORIDA AND INCORPORATED AREAS COMMUNITY NAME NUMBER COMMUNITY NAME NUMBER
 VOLUME 1 OF 1 VOLUSIA COUNTY, FLORIDA AND INCORPORATED AREAS COMMUNITY NAME NUMBER COMMUNITY NAME NUMBER DAYTONA BEACH, CITY OF 125099 DAYTONA BEACH SHORES, CITY OF NEW SMYRNA BEACH, CITY OF 125132 125100
UPPER BEACH REPLENISHMENT PROJECT RELATED
 ASSESSMENT OF SAND VOLUME LOSS at the TOWNSHIP of UPPER BEACH REPLENISHMENT PROJECT RELATED to the LANDFALL OF HURRICANE SANDY - PURSUANT TO NJ-DR 4086 This assessment is in response to Hurricane Sandy
St. Louis County, MN Coastal Hazard Analysis Flood Risk Review Meeting. May 2, 2018
 St. Louis County, MN Coastal Hazard Analysis Flood Risk Review Meeting May 2, 2018 Agenda Introductions Coastal Flood Risk Study and Mapping Program Current Status Technical Overview of Study and Mapping
ADDENDA B Hydrologic and Hydraulic (H&H) Study Guidance 2019
 Study Guidance 2019") 09/25/2018 DRAFT FEMA Region I PA H&H Study ADDENDA B Hydrologic and Hydraulic (H&H) Study Guidance 2019 Region I Federal Emergency Management Agency (FEMA) Public Assistance Hydrologic and Hydraulic (H&H)
09/25/2018 DRAFT FEMA Region I PA H&H Study ADDENDA B Hydrologic and Hydraulic (H&H) Study Guidance 2019 Region I Federal Emergency Management Agency (FEMA) Public Assistance Hydrologic and Hydraulic (H&H)
Delaware Real Estate Data First Quarter: January 1, 2008 to March 31, 2008
 First Quarter: January 1, 2008 to March 31, 2008 New Castle County 237,000 267,052 27,000 2,400,000 Wilmington 165,000 182,171 29,000 600,000 Newark 251,000 266,439 86,000 729,000 New Castle N/A N/A N/A
Door County, WI Coastal Hazard Analysis Flood Risk Review Meeting. August 21, 2017
 Door County, WI Coastal Hazard Analysis Flood Risk Review Meeting August 21, 2017 Agenda Introductions Coastal Flood Risk Study and Mapping Program Current Status Technical Overview of Study and Mapping
Bayfield & Ashland Counties, WI Coastal Hazard Analysis Flood Risk Review Meeting. June 05, 2018
 Bayfield & Ashland Counties, WI Coastal Hazard Analysis Flood Risk Review Meeting June 05, 2018 Agenda Introductions Coastal Flood Risk Study and Mapping Program Current Status Technical Overview of Study
VOLUME 4 OF 6 LOS ANGELES COUNTY, CALIFORNIA AND INCORPORATED AREAS
 VOLUME 4 OF 6 LOS ANGELES COUNTY, CALIFORNIA AND INCORPORATED AREAS COMMUNITY NAME NUMBER COMMUNITY NAME NUMBER LOS ANGELES COUNTY UNINCORPORATED AREAS 065043 CITY OF CLAREMONT* 060109 CITY OF AGOURA HILLS
Baraga County, MI Coastal Hazard Analysis Flood Risk Review Meeting. July 12, 2018
 Baraga County, MI Coastal Hazard Analysis Flood Risk Review Meeting July 12, 2018 Agenda Introductions Coastal Flood Risk Study and Mapping Program Current Status Technical Overview of Study and Mapping
Bay County, MI Coastal Hazard Analysis Flood Risk Review Meeting. May 14, 2018
 Bay County, MI Coastal Hazard Analysis Flood Risk Review Meeting May 14, 2018 Agenda Introductions Coastal Flood Risk Study and Mapping Program Current Status Technical Overview of Study and Mapping Floodplain
APPENDIX H LAKE OKEECHOBEE FLOOD ROUTINES
 1 2 3 APPENDIX H LAKE OKEECHOBEE FLOOD ROUTINES 1 2 3 4 5 6 7 8 9 10 11 12 13 14 15 16 17 18 19 20 21 22 23 24 25 26 27 28 29 30 31 32 33 34 35 36 37 38 39 40 41 42 43 44 45 LAKE OKEECHOBEE FLOOD ROUTINGS
USING A LABYRINTH WEIR TO INCREASE HYDRAULIC CAPACITY. Dustin Mortensen, P.E. 1 Jake Eckersley, P.E. 1
 USING A LABYRINTH WEIR TO INCREASE HYDRAULIC CAPACITY Dustin Mortensen, P.E. 1 Jake Eckersley, P.E. 1 Plum Creek Floodwater Retarding Structure No. 6 is located in an area of Kyle, Texas, that is currently
APPENDIX C VEGETATED EMERGENCY SPILLWAY. VERSION 1.0 March 1, 2011
 APPENDIX C VEGETATED EMERGENCY SPILLWAY VERSION 1.0 March 1, 2011 [NOTE: Could use a better photo more clearly showing the emergency spillway in the context of the dam.] SECTION C-1: DESCRIPTION OF PRACTICE
Photo by: Darryl Hatheway, 2011
 Photo by: Darryl Hatheway, 2011 September 11, 2015 Presentation Discussion Examine PFD V-Zone Mapping in Wave Runup Dominated West Coast Application of PFD V-Zone Mapping Criteria in Pacific G&S PFD V-Zone
Illinois State Water Survey
 Illinois State Water Survey HYDROLOGY DIVISION SWS Contract Report 508 COMPARISON OF 1987 AND 1989 BED PROFILE SURVEYS OF THE LOWER CACHE RIVER by Richard Allgire Office of Sediment and Wetland Studies
Hydraulic Modeling Analysis
 Final Report Photograph: http://www.newington-dover.com Newington to Dover, New Hampshire Prepared for: Vanasse Hangen Brustlin, Inc. 6 Bedford Farms Drive, Suite 607 Bedford, New Hampshire 03110-6532
KENNEBEC COUNTY, MAINE (ALL JURISDICTIONS) Volume 1 of 2
 Volume 1 of 2") KENNEBEC COUNTY, MAINE (ALL JURISDICTIONS) Volume 1 of 2 COMMUNITY NAME COMMUNITY NUMBER ALBION, TOWN OF 230231 AUGUSTA, CITY OF 230067 BELGRADE, TOWN OF 230232 BENTON, TOWN OF 230233 CHELSEA, TOWN OF
KENNEBEC COUNTY, MAINE (ALL JURISDICTIONS) Volume 1 of 2 COMMUNITY NAME COMMUNITY NUMBER ALBION, TOWN OF 230231 AUGUSTA, CITY OF 230067 BELGRADE, TOWN OF 230232 BENTON, TOWN OF 230233 CHELSEA, TOWN OF
VIRGINIA SOIL AND WATER CONSERVATION BOARD GUIDANCE DOCUMENT ON DAM BREAK INUNDATION ZONE AND INCREMENTAL DAMAGE ANALYSIS AND MAPPING PROCEDURES
 (Approved XXXXX, 2010) Working Draft Version January 14, 2010 VIRGINIA SOIL AND WATER CONSERVATION BOARD GUIDANCE DOCUMENT ON DAM BREAK INUNDATION ZONE AND INCREMENTAL DAMAGE ANALYSIS AND MAPPING PROCEDURES
WAUKESHA COUNTY, AND INCORPORATED AREAS VOLUME 1 OF 3
 WAUKESHA COUNTY, AND INCORPORATED AREAS VOLUME 1 OF 3 Community Name Community Number BIG BEND, VILLAGE OF 550477 BROOKFIELD, CITY OF 550478 BUTLER, VILLAGE OF 550536 CHENEQUA, VILLAGE OF 550125 DELAFIELD,
Cumberland River Flood Preparedness Mapping and Products
 Cumberland River Flood Preparedness Mapping and Products Barry P. Moran, P.E. Hydraulic Engineer Nashville District September 2013 US Army Corps of Engineers BUILDING STRONG Authority: As a result of the
WMS 8.4 Tutorial Hydraulics and Floodplain Modeling HY-8 Modeling Wizard Learn how to model a culvert using HY-8 and WMS
 v. 8.4 WMS 8.4 Tutorial Hydraulics and Floodplain Modeling HY-8 Modeling Wizard Learn how to model a culvert using HY-8 and WMS Objectives Define a conceptual schematic of the roadway, invert, and downstream
APPENDIX C. Fluvial and Tidal Hydraulics Report
 APPENDIX C Fluvial and Tidal Hydraulics Report BUENA VISTA LAGOON ENHANCEMENT PROJECT FLUVIAL AND TIDAL HYDRAULICS ANALYSES Prepared for: SANDAG 401 B Street, Suite 800 San Diego, California 92101 Contact:
Skagit River Historical Flood Elevations and Peak Flow Estimates
 Skagit River Historical Flood Elevations and Peak Flow Estimates to be presented at Skagit River GI H&H Technical Workshop Wednesday, June 17, 2009 Background Corps of Engineers began a General Investigation
Interim Guidance Fish Presence Absence
 Interim Guidance Fish Presence Absence Source: Forest Practices Act Guidance for Division 635 of the forest practices act dealing with stream classification when no fish surveys have been done (referenced
STUDY REPORT W&AR-03 RESERVOIR TEMPERATURE MODEL ATTACHMENT B DON PEDRO RESERVOIR BATHYMETRIC STUDY REPORT
 STUDY REPORT W&AR-03 RESERVOIR TEMPERATURE MODEL ATTACHMENT B DON PEDRO RESERVOIR BATHYMETRIC STUDY REPORT DON PEDRO RESERVOIR BATHYMETRIC STUDY REPORT Prepared for: TURLOCK IRRIGATION DISTRICT MODESTO
HYDROLOGIC AND HYDRAULIC REPORT PROPOSED CULVERT STRUCTURES SR 194, SECTION 10
 HYDROLOGIC AND HYDRAULIC REPORT PROPOSED CULVERT STRUCTURES SR 194, SECTION 10 RACETRACK ROAD CULVERT OVER THE SPRING RUN & GREEN SPRINGS ROAD CULVERT OVER AN UNNAMED TRIBUTARY TO SPRING RUN BERWICK TOWNSHIP
Modeling of Long Culverts and Stormdrains A Comparison of Different Methods
 Modeling of Long Culverts and Stormdrains A Comparison of Different Methods Shrinivas Kaulgud, P.E., CFM Cheryl Hannan, P.E., CFM, LEED AP October 12, 2017 Presentation Outline Introduction Case Studies
Multi-Jurisdictional Hazard Mitigation Plan
 Flooding General Flooding is the leading cause of death among all types of natural disasters throughout the United States, with its ability to roll boulders the size of cars, tear out trees, and destroy
GONE! Coastal Erosion Happens During Storms! Why Worry About Coastal Setbacks? Goals for Today
 RI Regulatory Setbacks & Buffers: Coastal Zone Management Issues New England Onsite Wastewater Training Program @ URI OWT 155 November 21, 2013 Goals for Today Understand the impacts of storms, coastal
HEC 26 Aquatic Organism Passage Design Manual Evolution & Application
 HEC 26 Aquatic Organism Passage Design Manual Evolution & Application Sven Leon, P.E., Hydraulics Engineer Federal Highway Administration 2015 Alaska Fish Passage Meeting October 13 14, 2015 VTRC, Juneau,
Ellis Y. Byeon, PE Bryan VanderGheynst, PE 1
 Ellis Y. Byeon, PE Bryan VanderGheynst, PE 1 Background Information: City of Trenton, Mercer County Assunpink Creek, Pond Run and Delaware River Lower 2.5 miles of the Assunpink Creek Lower 0.6 miles of
Red River Basin and FM Diversion Hydrology. North Dakota Water Education Foundation Executive Briefing July 13, 2012
 Red River Basin and FM Diversion Hydrology North Dakota Water Education Foundation Executive Briefing July 13, 2012 Red River Basin Total Drainage Area: 45,000 square miles North Dakota Fargo, ND Moorhead,
RE: Hurricane Matthew Beach Damage Assessment and Recommendations [CSE 2416]
![RE: Hurricane Matthew Beach Damage Assessment and Recommendations [CSE 2416]](/thumbs/83/87675702.jpg "RE: Hurricane Matthew Beach Damage Assessment and Recommendations [CSE 2416]") October 25, 2016 Iris Hill Town Administrator Town of Edisto Beach 2414 Murray St Edisto Beach SC 29438 RE: Hurricane Matthew Beach Damage Assessment and Recommendations [CSE 2416] Dear Iris, Hurricane
October 25, 2016 Iris Hill Town Administrator Town of Edisto Beach 2414 Murray St Edisto Beach SC 29438 RE: Hurricane Matthew Beach Damage Assessment and Recommendations [CSE 2416] Dear Iris, Hurricane
NORTH CAROLINA FLOODPLAIN MAPPING PROGRAM COOPERATING TECHNICAL STATE
 NORTH CAROLINA FLOODPLAIN MAPPING PROGRAM COOPERATING TECHNICAL STATE FINAL BASIN PLAN WATAUGA RIVER BASIN Prepared by the: State of North Carolina and the Federal Emergency Management Agency December
Figure 4, Photo mosaic taken on February 14 about an hour before sunset near low tide.
 The Impact on Great South Bay of the Breach at Old Inlet Charles N. Flagg and Roger Flood School of Marine and Atmospheric Sciences, Stony Brook University Since the last report was issued on January 31
New Jersey Coastal Zone Overview. The New Jersey Beach Profile Network (NJBPN) 3 Dimensional Assessments. Quantifying Shoreline Migration
 3 Dimensional Assessments. Quantifying Shoreline Migration") New Jersey Coastal Zone Overview The New Jersey Beach Profile Network (NJBPN) Objectives Profile Locations Data Collection Analyzing NJBPN Data Examples 3 Dimensional Assessments Methodology Examples Quantifying
New Jersey Coastal Zone Overview The New Jersey Beach Profile Network (NJBPN) Objectives Profile Locations Data Collection Analyzing NJBPN Data Examples 3 Dimensional Assessments Methodology Examples Quantifying
Total Suspended Solids, Stable Flow, and Wet Weather Event Monitoring in the Unnamed Tributary to the Grand River Watershed.
 Total Suspended Solids, Stable Flow, and Wet Weather Event Monitoring in the Unnamed Tributary to the Grand River Watershed December 2004 The Cadmus Group, Inc. Grand Valley State University Annis Water
Technical Brief - Wave Uprush Analysis Island Harbour Club, Gananoque, Ontario
 Technical Brief - Wave Uprush Analysis RIGGS ENGINEERING LTD. 1240 Commissioners Road West Suite 205 London, Ontario N6K 1C7 October 31, 2014 Table of Contents Section Page Table of Contents... i List
CLAIBORNE LOCK AND DAM PERTINENT DATA
 CLAIBORNE LOCK AND DAM PERTINENT DATA GENERAL Location Clarke, Monroe, & Wilcox Counties, Alabama; Alabama River, river mile 72.5 Drainage area Millers Ferry to Claiborne sq. mi. 836 Total drainage area
RI Regulatory Setbacks & Buffers: Coastal Management Issues
 RI Regulatory Setbacks & Buffers: Coastal Management Issues New England Onsite Wastewater Training Program @ URI OWT 155 - November 29, 2012 James Boyd - Coastal Policy Analyst Photo: October 30, 2012
1.Mill Creek Watershed Summary Description and Land Use
 1.Mill Creek Watershed Summary Description and Land Use Table xxx: Mill Creek Watershed Overview Watershed Size 31,435 acres/49.1 sq miles/ 127.1 sq km Elevation Range 5,594 feet [4,967-10,561] Stream
Delaware Chapter Surfrider Foundation - Indian River Inlet Monitoring
 Delaware Chapter Surfrider Foundation - Indian River Inlet Monitoring In 2012, the Delaware Surfrider Foundation Chapter formed the Surf Quality and Access Committee to focus on issues such as surf spot
Total Suspended Solids, Stable Flow, and Wet Weather Event Monitoring in the Bass River Watershed. December The Cadmus Group, Inc.
 Total Suspended Solids, Stable Flow, and Wet Weather Event Monitoring in the Bass River Watershed December 2004 The Cadmus Group, Inc. Grand Valley State University Annis Water Resources Institute Submitted
COST EFFECTIVE STORAGE CAPACITY INCREASE FOR ALUMINA TAILINGS DISPOSAL AREA THROUGH SPILLWAY OPTIMISATION
 COST EFFECTIVE STORAGE CAPACITY INCREASE FOR ALUMINA TAILINGS DISPOSAL AREA THROUGH SPILLWAY OPTIMISATION Abstract Lonie I * Tailings and Dams, GHD Brisbane, QLD, Australia Queensland Alumina Limited operates
Stormwater Level of Service Study - Phase 2 Flooding Adjacent to Rock Creek
 Stormwater Level of Service Study - Phase 2 Flooding Adjacent to Rock Creek City of Fairway, Kansas Fairway Stormwater Level of Service Study - Phase 2 Project No. 108200 Revision 1 12/6/2018 Stormwater
Distribution Restriction Statement Approved for public release; distribution is unlimited.
 CECW-EH Engineer Regulation 1110-2-1451 Department of the Army U.S. Army Corps of Engineers Washington, DC 20314-1000 Engineering and Design ACQUISITION OF LANDS DOWNSTREAM FROM SPILLWAYS FOR HYDROLOGIC
Coastal Hazards Study
 Coastal Hazards Study 2212 Beach Boulevard, Pacifica Prepared for: EXECUTIVE SUMMARY City of Pacifica 170 Santa Maria Ave Pacifica, CA 94044 Prepared by: moffatt & nichol 2185 N. California Blvd. Walnut
HURRICANE SANDY LIMITED REEVALUATION REPORT UNION BEACH, NEW JERSEY DRAFT ENGINEERING APPENDIX SUB APPENDIX D SBEACH MODELING
 HURRICANE SANDY LIMITED REEVALUATION REPORT UNION BEACH, NEW JERSEY DRAFT ENGINEERING APPENDIX SUB APPENDIX D SBEACH MODELING Rev. 18 Feb 2015 1 SBEACH Modeling 1.0 Introduction Following the methodology
SECTION 2 HYDROLOGY AND FLOW REGIMES
 SECTION 2 HYDROLOGY AND FLOW REGIMES In this section historical streamflow data from permanent USGS gaging stations will be presented and discussed to document long-term flow regime trends within the Cache-Bayou
Assessment of Baseline Geomorphic Features at. Proposed Stream Crossings On The Proposed County Road 595. Marquette County, Michigan
 Assessment of Baseline Geomorphic Features at Proposed Stream Crossings On The Proposed County Road 595 Marquette County, Michigan Prepared for: Kennecott Eagle Minerals Company Marquette, Michigan Prepared
NEED FOR SUPPLEMENTAL BATHYMETRIC SURVEY DATA COLLECTION
 305 West Grand Avenue, Suite 300 Montvale, New Jersey 07645 Phone 201.930.9890 Fax 201.930.9805 www.anchorqea.com M EMORANDUM To: Caroline Kwan and Nica Klaber U.S. Environmental Protection Agency Region
Technical Brief - Wave Uprush Analysis 129 South Street, Gananoque
 Technical Brief - Wave Uprush Analysis 129 South Street, Gananoque RIGGS ENGINEERING LTD. 1240 Commissioners Road West Suite 205 London, Ontario N6K 1C7 June 12, 2013 Table of Contents Section Page Table
U.S. Army Engineer Institute for Water Resources
 Sea Level Change Curve Calculator (2014.88) (DRAFT) U.S. Army Engineer Institute for Water Resources Table of Contents 1. INTRODUCTION... 2 1.1 BACKGROUND... 2 1.1.1 INFORMATION QUALITY ACT... 2 1.2 OVERVIEW...
APPENDIX D-2. Sea Level Rise Technical Memo
 APPENDIX D-2 Sea Level Rise Technical Memo 2185 N. California Blvd., Suite 500 Walnut Creek, CA 94596 (925) 944-5411 Fax: (925) 944-4732 www.moffattnichol.com DRAFT MEMORANDUM To: From: Neil Nichols,
Ventura County. Open Pacific Coast Study. California Coastal Analysis and Mapping Project
 Ventura County Open Pacific Coast Study California Coastal Analysis and Mapping Project December 2011 Project Name: Meeting: Date and Time: Location: California Coastal Analysis and Mapping Project (CCAMP)/Open
TOWN OF BETHANY BEACH E-NEWSLETTER
 BETHANY BEACH NEWSLETTER Issue # TOWN OF BETHANY BEACH E-NEWSLETTER JANUARY 2019 South Atlantic and Cedarwood Street Project Complete The project begun last February is complete with the paving and striping
TROUT CREEK WATERSHED (Second Year of Snowline Data)
") Extent of Snow Cover During the 2002 Spring Freshet For the TROUT CREEK WATERSHED (Second Year of Snowline Data) (Penticton Forest District) 1.0 INTRODUCTION The extent of snow cover over a watershed basin
Extent of Snow Cover During the 2002 Spring Freshet For the TROUT CREEK WATERSHED (Second Year of Snowline Data) (Penticton Forest District) 1.0 INTRODUCTION The extent of snow cover over a watershed basin
We Make a Difference. New Maps, Now What? Updated Coastal Flood Hazard Information for Southern Georgia
 New Maps, Now What? Updated Coastal Flood Hazard Information for Southern Georgia New Maps, Now What? Risk MAP Project Team FEMA Region IV BakerAECOM, FEMA Mapping Partner GA DNR (CTP) NEFL Duval Flagler
Klickitat County Shoreline Master Program Update. Open House March 15, 2017
 Klickitat County Shoreline Master Program Update Open House March 15, 2017 Agenda 6:00 6:10 Welcome 6:10 6:40 Presentation SMP Update Process Shoreline Analysis review 6:40 8:00 Open House Topics SMP Process
Annex E Bridge Pier Protection Plan
 Annex E Bridge Pier Protection Plan Table E1 Bridge Types and Locations Table E2 Flow Conditions For River Sections Figure E1 Bridge Abutment Protection Figure E2 Bridge Pier Protection Figure E3 Central
Hydraulic Modeling of Stream Enhancement Methods
 Hydraulic Modeling of Stream Enhancement Methods Matthew J. Curry John J. Levitsky Abstract Development within watersheds increases the amounts of runoff causing stream erosion and degradation of stream
Hydrologic Feasibility of Storm Surge Barriers
 Hydrologic Feasibility of Storm Surge Barriers Malcolm J. Bowman, School of Marine and Atmospheric Sciences State University of New York, Stony Brook, NY. Presented at Against the Deluge: Storm Surge Barriers
SOUTH CAROLINA ELECTRIC & GAS COMPANY COLUMBIA, SOUTH CAROLINA
 SOUTH CAROLINA ELECTRIC & GAS COMPANY COLUMBIA, SOUTH CAROLINA SALUDA HYDROELECTRIC PROJECT FERC NO. 516 DOWNSTREAM TEMPERATURE STUDY DRAFT REPORT MAY 28 Prepared by: SOUTH CAROLINA ELECTRIC & GAS COMPANY
PRELIMINARY STORM DRAINAGE REPORT
 PRELIMINARY STORM DRAINAGE REPORT DRURY LANE DEVELOPMENT 704 1ST STREET SULTAN, WA 98294-94240 PARCEL #28083200305500 AUDITOR S FILE NO. 1090255 CITY OF SULTAN SNOHOMISH COUNTY, WASHINGTON PREPARED FOR:
San Lorenzo Valley Water District, Watershed Management Plan, Final Version Part I: Existing Conditions Report
 LIST OF FIGURES Figure 1-1. Map of the San Lorenzo River watershed Figure 2-1. The Santa Cruz Mountains Bioregion Figure 2-2. Protected areas within the San Lorenzo River watershed Figure 2-3. Primary
Designing Labyrinth Spillways for Less than Ideal Conditions Real World Application of Laboratory Design Methods
 Designing Labyrinth Spillways for Less than Ideal Conditions Real World Application of Laboratory Design Methods Gregory Richards, P.E., CFM, Gannett Fleming, Inc. Blake Tullis, Ph.D., Utah Water Research
CORPS FACTS. Harbor Dredging U.S. ARMY CORPS OF ENGINEERS BUILDING STRONG
 CORPS FACTS Harbor Dredging U.S. ARMY CORPS OF ENGINEERS BUILDING STRONG Disaster Response Sedimentation in the channel is caused by the normal cycle of silt movement, erosion from high water or heavy
Response of a Newly Created Marsh-Wetland Affected by Tidal Forcing, Upland Discharge, and Groundwater Interaction
 Response of a Newly Created Marsh-Wetland Affected by Tidal Forcing, Upland Discharge, and Groundwater Interaction Mouth of Columbia River, Cape Disappointment State Park, Washington 12 Hans R. Moritz
SELBY CREEK SILVERADO TRAIL CULVERT FISH PASSAGE ASSESSMENT
 SELBY CREEK SILVERADO TRAIL CULVERT FISH PASSAGE ASSESSMENT NAPA COUNTY, CALIFORNIA PREPARED BY NAPA COUNTY RESOURCE CONSERVATION DISTRICT 1303 JEFFERSON ST. SUITE 500B NAPA, CALIFORNIA 94559 WWW.NAPARCD.ORG