A simulation-based evaluation of alternative initial responses to gas kicks during managed pressure drilling operations
|
|
|
- Mercy Baker
- 5 years ago
- Views:
Transcription

1 Louisiana State University LSU Digital Commons LSU Master's Theses Graduate School 2009 A simulation-based evaluation of alternative initial responses to gas kicks during managed pressure drilling operations Majid Davoudi Louisiana State University and Agricultural and Mechanical College, mdavou1@lsu.edu Follow this and additional works at: Part of the Petroleum Engineering Commons Recommended Citation Davoudi, Majid, "A simulation-based evaluation of alternative initial responses to gas kicks during managed pressure drilling operations" (2009). LSU Master's Theses This Thesis is brought to you for free and open access by the Graduate School at LSU Digital Commons. It has been accepted for inclusion in LSU Master's Theses by an authorized graduate school editor of LSU Digital Commons. For more information, please contact gradetd@lsu.edu.
2 A SIMULATION-BASED EVALUATION OF ALTERNATIVE INITIAL RESPONSES TO GAS KICKS DURING MANAGED PRESSURE DRILLING OPERATIONS A Thesis Submitted to the Graduate Faculty of the Louisiana State University and Agricultural and Mechanical College in partial fulfillment of the Requirements for the degree of Master of Science in Petroleum Engineering in The Department of Petroleum Engineering by Majid Davoudi B.S., Sharif University of Technology, Tehran, Iran, 1996 December, 2009
3 DEDICATION This work is highly dedicated to Maryam. ii
4 ACKNOWLEDGMENTS I would like to express my sincere appreciation to my advisor, Dr. John Rogers Smith, at the Craft and Hawkins Department of Petroleum Engineering at Louisiana State University (LSU) for his continuous technical and mental support as well as insights toward the completion of this work. Undoubtedly, this work could not be possibly completed without such help. I would also like to thank Dr. Adam T. Bourgoyne and Dr. Julius P. Langlinais for their consent to be member of my graduate committee. Their technical guidance encouraged great motivation and added extra value to my overall research. My appreciation is further extended to all faculty members at the Craft and Hawkins Department of Petroleum Engineering at LSU for their contributions to my knowledge. I am especially thankful to Dr. Wojtanowicz for his help with graduate program. I am also grateful to the staff at the Craft and Hawkins Department of Petroleum Engineering at LSU, especially Randy Rasti as the computer manager and Janet Dugas as the administrative coordinator for their kind assistance throughout my studies. Financially and technically, this work also owes a debt of gratitude to LSU s industry consortium members, including At Balance TM, Blade Energy Partners, Chevron Energy Technology Company, ConocoPhillips, Secure Drilling TM, Total and Shell E & P companies. My appreciation is further extended to Don Reitsma, Philip Frink, and Philip Vogelsberg for providing permission to use technical information. Additionally, since this work is a simulationbased study, I would like to thank SPT Group for providing academic licenses, and a special appreciation to Lei Zho for support given. I am thankful to the staff at the LSU s Petroleum Engineering Research and Technology Transfer Laboratory (PERTTL), and in particular, Darryl Bourgoyne, Gerry Masterman and Jeanette Wooden for their help at the well facility. iii
5 I believe that my bachelor's degree in physics from Sharif University of Technology in Tehran provided me well with the knowledge required for my graduate level studies. This is further expressed by all the technical skills and knowledge that I earned during 6.5 years of petroleum-related work experience at the drilling and measurements (D & M) section of Schlumberger oilfield services in Iran, Qatar and Oman. I would also like to express my sincere thanks and gratitude to all my dear friends and fellow students at LSU, especially the LSU MPD team, Asis K. Das, Miodrag Bogdanovic, and William Burch for their encouragements. My special thanks go to all my family members particularly, my parents and my in-laws for their prayers, love and support. Finally, my deepest thanks and appreciation is extended to my wife, Maryam, who has always been by my side during my academic endeavors. Her immense support and encouragement is an inseparable part of this achievement. iv
6 TABLE OF CONTENTS DEDICATION... ii ACKNOWLEDGMENTS... iii TABLE OF CONTENTS... v LIST OF TABLES... ix LIST OF FIGURES... x ABSTRACT... xii 1. INTRODUCTION Origins of Managed Pressure Drilling Conventional Drilling Underbalanced Drilling Managed Pressure Drilling CBHP Method of MPD Application of the CBHP Method Well Control Challenges of MPD LSU MPD Consortium Research Objectives Thesis Objective Overview of Thesis LITERATURE REVIEW MPD General Concepts Introduction to MPD Advantages and Limitations of MPD MPD Equipment Categories and Variations of MPD Design Considerations of MPD Operations CBHP Method of MPD Tripping Operations during CBHP Method of MPD General Considerations for CBHP Method Pump Shut down Schedule during CBHP Method Recent Technologies in CBHP Method Micro-Flux Control MFC Field Examples Dynamic Annular Pressure Control DAPC System Field Examples Continuous Circulation System Continuous Circulation System Field Examples Examples of Different Initial Responses Examples of other MPD Applications Flow Control Matrix Initial Response Comparison Study v
7 2.8 Simulator RESEARCH METHODOLOGY Summary of Project Research Plan LSU MPD Road Map Research Tool Dynaflodrill TM Dynaflodrill TM Inputs Parameters Running Simulations in Dynaflodrill TM Limitations of Dynaflodrill TM Validation of Dynaflodrill TM Dynaflodrill TM Validation Method Description of the Steady State Validations The Results of Steady State Validations Description of the Transient State Validations Results of the Transient State Validations Dynaflodrill TM Validation Summary WELL GEOMETRIES Introduction Well X Well X Operational Settings Well X Kick Scenarios Well Z Well Z Operational Settings Well Z Kick Scenarios ALTERNATIVE INITIAL RESPONSES Introduction Non-Circulating Responses (NCRs) Shut-In (SI) Example of SI Response MPD Pump SD W/ CFC and SI Example of MPD Pump SD W/ CFC and SI MPD Pump SD and SI Example of MPD Pump SD and SI Auto MPD Pump SD W/ CFC and SI Example of Auto MPD Pump SD W/ CFC and SI Auto MPD Pump SD and SI Example of Auto MPD Pump SD and SI Circulating Responses (CRs) Stepwise P c Incr Example of Stepwise P c Incr Incr P c to 80% of MAASP Example of Incr P c to 80% of MAASP Rapid P c Incr Example of Rapid P c Incr vi
8 5.3.4 Stepwise Q in Incr Example of Stepwise Q in Incr DATA ANALYSIS Introduction DFD Inputs for Choke Operation Simulation Results Determining whether Kick Influx Stopped for Circulating Responses Flow out Behavior during Circulating Responses to Gas Kicks Explanation Q in Increase Response Summary of the Kick Influx Stoppage Confirmation for Circulating Responses Comparison of Initial Responses General Significance of Kick Scenario Variables Kick Detection Limits Formation Permeability Underbalance when Kick is Taken Summary for Well X Well Geometry Non-Circulating Responses (NCRs) Summary of the Best Non-Circulating Responses Advantages of the Best Non-Circulating Responses Limitations or Disadvantages of the Best Non-Circulating Responses The Best Circulating Responses (CRs) Summary of the Best Circulating Responses Advantages of the Best Circulating Responses Limitations or Disadvantages of the Best Circulating Responses The Results of the Best Alternative Initial Responses Initial Response Plan for kicks Taken during the CBHP Method of MPD Operations CONCLUSIONS AND RECOMMENDATIONS Summary Conclusions Recommendations REFERENCES APPENDIX A: WELL X SIMULATIONS INPUT DATA APPENDIX B: WELL Z SIMULATIONS INPUT DATA APPENDIX C: WELL X AND Z TABLES OF RESULTS AND SIMULATION PLOTS APPENDIX D: SCHEMATIC OF LSU WELL NO APPENDIX E: SCHEMATIC OF LSU WELL NO vii
9 APPENDIX F: AT BALANCE TM PERMISSION LETTER APPENDIX G: SHELL E & P COMPANY PERMISSION LETTER VITA viii
10 LIST OF TABLES 3.1 Steady state error ranges between DFD predictions and the real data from LSU#1 and LSU# Well X data summary Well X Operational Settings Well X Kick Scenarios (13.2 ppg mud at 190 GPM) Well Z 17.5 data Summary Well Z Operational Settings Well Z Kick Scenarios (13.1 ppg mud at 900 GPM) SI schedule Schedule for MPD pump SD W/ CFC and SI for Well X Schedule for Auto MPD pump SD W/ CFC and SI for Well X An example schedule for Rapid P c Incr response Implemented choke schedule for the kick scenario in Fig Comparison of DFD choke inputs on a 2 bbl kick from Well X Applications of SI response on Well X kick scenarios Well X, applications of the NCRs on 2 bbl kick / high k / 0.5 ppge Circ UB Well X, applications of the NCRs on 20 bbl kick / high k / 0.1 ppge Circ UB Well X, applications of the NCRs on 2 bbl kick / low k / 0.1 ppge Circ UB Well X, applications of the NCRs (0.5 ppge Circ UB) Well X, applications of the best NCRs on 20 bbl kicks / 0.5 ppge Circ UB Well X, applications of the CRs on 2 bbl kick / high k / 0.5 ppge Circ UB Well X, applications of the CRs on 20 bbl kick / high k / 0.5 ppge Circ UB Well X, applications of the CRs on 20 bbl kick / high k / 1.2 ppge Circ UB Well Z, applications of the all CRs on high k kick scenarios Well X, application of the best initial responses on high k kick scenarios ix
11 LIST OF FIGURES 1.1 A wide drilling window is typically available in conventional drilling applications Static and Dynamic pressure profiles in conventional drilling A typical narrow drilling window depiction in marine environments RCD above the BOP A typical automated DCM Non-return valve (float valve) Coriolis flow meter In CBHP method, back pressure must be applied when mud pumps are off Back pressure pump A transient of 10 seconds was detected by the DAPC system A typical CBHP method operational Matrix by MMS GOM region Wellbore pressure versus depth for routine CBHP MPD operations Matrix of simulation scenarios and sensitivities Sequential steps for simulations Comparison of gas migration results of DFD versus real data from LSU# Comparison of gas migration results of Ubitts TM versus real data from LSU# Well X directional profile plot Well X 6 section PP-FP gradient profiles A simplified schematic of Well X Well Z 17.5 section PP-FP gradient profiles A simplified schematic of Well Z, 17.5 section Well X, application of SI on 2 bbl kick / high k / 0.5 ppge Circ UB Well X, MPD pump SD W/ CFC and SI on 2 bbl kick / high k / 0.5 ppge Circ UB Well X, MPD pump SD and SI on 2 bbl kick / high k / 0.5 ppge Circ UB Well X, Auto MPD pump SD W/ CFC& SI on 2 bbl kick/ high k/ 0.5 ppge Circ UB...72 x
12 5.5 Well X, Auto MPD pump SD and SI on 2 bbl kick / high k / 0.5 ppge Circ UB Well X, Stepwise P c Incr on 2 bbl kick / high k / 0.5 ppge Circ UB Well X, Incr P c to 80% of MAASP on 2 bbl kick / high k / 0.5 ppge Circ UB Well X, Rapid Pc Incr. on 2 bbl kick / high k / 0.5 ppge Circ UB Well X, Stepwise Q in Incr. on 2 bbl kick / high k / 0.5 ppge Circ UB Comparison of choke input selection on a 2 bbl kick / high k / 0.1 ppge Circ UB bbl water kick in Well X (high k, 1.2 ppge Circ UB) Qualitative illustration of increasing choke pressure at constant pumping rate A minimized Q out Incr rate and repeatable trend versus time after influx stopped After influx stopped, choke size reduction controls Q out suppression not its trend Evaluation of k on kick stoppage confirmation, Well X / 0.5 ppge Circ UB Well X, Stepwise Q in Incr. on 20 bbl kick / low k / 0.5 ppge Circ UB Well X, SI on 2 & 20 bbl kick / high k versus 2 bbl / low k (0.5 ppge Circ UB) Well Z, SI on 2 bbl kick / high k versus different levels of the Circ UB Well X, application of the NCRs on 20 bbl kick (high k, 0.1 ppge Circ UB) Well X, application of the NCRs on 2 bbl kick (low k, 0.1 ppge Circ UB) Well X, application of the CRs on 2 bbl kick (high k, 0.5 ppge Circ UB) Well X, application of the CRs on 20 bbl kick (high k, 0.5 ppge Circ UB) Well X, application of the CRs on 20 bbl kick (high k, 1.2 ppge Circ UB) Well Z, application of Stepwise Q in Incr on 2 bbl kick / high k / 0.5 ppge Circ UB Plan of selecting an initial response to kicks taken during CBHP method of MPD xi
13 ABSTRACT Managed pressure drilling (MPD) is an adaptation of conventional drilling that has been developed to manage and control subsurface pressures in the well in order to minimize specific drilling problems. The constant bottom hole pressure approach (CBHP) is a versatile method of MPD, where a closed annulus allows initial responses to kicks other than simply shutting in the well. The objective of this research was to identify and evaluate the best initial response to gas kicks taken during drilling as a basis for developing reliable well control procedures for CBHP operations. Nine non-circulating and circulating responses (NCRs and CRs) were defined, and their application to kicks in two different wellbore geometries was studied through the use of computer simulations. Two different kick sizes, two different formation permeabilities, and three different kick intensities were considered. NCRs included a rapid shut in (SI) and four different MPD pump shut down schedules ending in SI. CRs included stepwise and rapidly increasing the casing pressure until the mud flow out equaled mud flow in, increasing casing pressure to a predefined limit and increasing the ECD by increasing mud pump rates. The initial responses were compared, based on the ability to stop an influx, determine whether the influx was stopped assuming intact wellbore, minimize risk of lost returns, minimize additional kick influx, and minimize excessive pressure at the surface and casing shoe. The results of over 150 simulations revealed that no single best initial response to all kicks could be identified. Three initial responses showing broad applicability include a rapid increase of casing pressure until flow rates are equal, shutting the well in and an adaptation of the MPD pump shut down schedule that allowed confirmation of a low rate kick. Increasing mud pump rate also showed advantages, but has limited application. Potential advantages and limitations of each were also explained. A method to confirm that the influx stopped during the xii
14 application of CRs was also proposed. The best initial response was dependent on well conditions and the equipment used. Therefore, a simple decision tree was developed to plan an appropriate response. xiii
15 1. INTRODUCTION 1.1 Origins of Managed Pressure Drilling A decade after the adoption of Underbalanced Drilling (UBD) by the oil and gas industry, conventional drilling remained the more desirable drilling technique for most operations owing to less cost and fewer complications. UBD requires rig personnel training and surface equipment to handle produced fluids. It also poses some limitations on mud pulse telemetry, employed by the majority of Measurement/Logging While Drilling (MWD/LWD) tools. The MWD/LWD tools are often used in the bottom hole assembly (BHA) to simultaneously drill and acquire necessary petrophysical data for real time decision making. However, the application of conventional overbalanced drilling is often ineffective especially in deep water environments that have a narrow Pore Pressure (PP) and Fracture Pressure (FP) margins (also called the drilling window). Potentially, such environments incur drilling-related problems such as well control incidents, lost returns followed by mud replacement expenses, etc. Another shortcoming of conventional overbalanced drilling leading to a higher cost of operation is a lower rate of penetration (ROP), mainly due to heavier drilling fluid selections. A recent study 1 has discovered that drilling associated problems account for around onethird of Non-Productive Time (NPT), encountered during drilling of gas wells in the shallow waters of the Gulf of Mexico (GOM). The cost of the NPT associated with these drilling incidents can easily result in costs that exceed a drilling program s Authorization For Expenditure (AFE) and thus leads to many prospects being economically undrillable. This becomes more severe with an increased water depth, where the drilling window becomes more narrow 2. 1
16 Drilling in narrow margins not only imposes drilling hazards causing NPT, but also more casing points would be required. A typical constraint of the GOM deep water exploration drilling program is the necessity for about 7-9 seats of casing 3. This leads to a smaller, ultimate, wellbore size which unfortunately reduces the size of the production string, the production rate that can be achieved, and ultimately, the economics of the well. A novel and innovative technique beyond conventional and underbalanced drilling seemed essential to manage annulus pressure within PP-FP margins, and hence, help mitigate drilling related NPTs. Thus, a new technique called Managed Pressure Drilling (MPD) emerged out of the context of UBD technology in Conventional Drilling A pretty wide margin is usually available between PP and FP in conventional overbalanced drilling (Fig. 1.1). Formation PP may be estimated from offset wells and seismic data. Fracture pressure, FP, which is a function of PP and overburden pressure, can be predicted from several available methods during the planning of a well. While drilling, it can be confirmed later by a leak off test (LOT) or a formation integrity test (FIT). This is usually done after drilling a few feet below the newly-cemented casing string 4. Hydrostatic pressure is present throughout a well when the rig mud pumps are off. This pressure is only a function of mud density and true vertical depth (TVD) at any given point (Eq. 1.1) assuming that the fluid compressibility and temperature effects are negligible 4. A sufficiently planned drilling fluid density (or mud weight) is theoretically enough to stop any kicks from openhole permeable zones and to keep wellbore pressure at any point within the drilling limits (Fig. 1.2). P Hyd = ( ) ρd.... (Eq. 1.1, field units) TVD 2

.")
17 Fig. 1.1: A wide drilling window is typically available in conventional drilling applications Fig. 1.2: Static and Dynamic pressure profiles in conventional drilling The Bottom Hole Pressure (BHP or P BH ) usually increases when drilling fluid (or mud) is circulated in the well. This is due to an induced pressure on the bottom, caused by the friction created by the upward flowing mud in the annulus between the wellbore and the drillstring. This extra pressure is called annular frictional pressure loss or P AF (Eq. 1.2). Hence, during circulation, a dynamic pressure profile will be established within the drilling window and thus throughout the well (Also Fig. 1.2). Mud then exits at top of the annulus to an open-to-theatmosphere 2 return-flow line. Consequently, the conventional circulation conduit is often referred to as an open system. PP < P = P + P < FP.. (Eq. 1.2, always true at any point in a well) BH Hyd AF P AF is a function of mud flow rate-in (Q in ), absolute roughness (ε), length of pipe (L), pipe and hole diameters (OD/ID), mud density (ρ), mud rheology and cuttings 4 (disregarding fluid compressibility and temperature effects). Therefore, Eq. 1.2 may be restated to show major parameters controlling BHP (Eq. 1.3). Most cannot be manipulated in real time to change the BHP; however, mud flow rate and density pose the exceptions. One of the most influential parameters on P AF is the borehole-drillstring clearance. Small borehole-drillstring clearance can significantly increase the P AF. This is generally true in moderate-to-slim holes, e.g. 12 to 6 diameter, across the BHA. In large holes, however, the clearance is typically large, and therefore, 3
18 BHP is not usually friction dominated. In friction dominant environments, an increase of mud flow rate can increase the BHP significantly. This may be achieved in real time by increasing the mud pump rate. Mud density manipulation can effectively change the BHP, but mud-up or muddown is more time-consuming. [ f ( ρ,d )] + [ f (Q, ε,l,od / ID,,Rheolog y,cuttings )] AFP P = TVD BH Hyd ρ... (Eq. 1.3) Petroleum engineers often use pressure gradients, which simply state the pressure at a depth in terms of an equivalent mud density at its equivalent TVD. Therefore, the actual BHP, whether static or circulating, can generally be expressed in terms of Equivalent Static Density (ESD) or Equivalent Circulating Density (ECD) respectively (Eq. 1.4). If there is no circulation, ECD reduces to ESD. ( P ) ( P ) ESD( ppge) = BH Static ECD( ppge) = BH Circulation.... (Eq. 1.4) ( ) D ( ) D TVD TVD A formation fluid influx (kick) will occur if BHP opposite a permeable zone is less than the PP of the zone. If so, then formation fluid will enter into the wellbore and displace an equal volume of the drilling fluid. Consequently, an extra volume of drilling fluid may be observed at the surface (pit gain). If a kick is taken, the influx must generally be stopped and then outcirculated from the well. This special operation is called well control 5. While removing the kick fluid, pressure in the well may exceed the fracture pressure of a weaker zone. In that case, an underground blowout can develop and seriously complicate the well control operation. Well control incidents can potentially threaten rig personnel, equipment, and cause NPT. Great efforts are being made to predict PP and FP, but abnormally high or low pressure zones represent an inevitable drilling challenge. A weakness of open systems, such as the circulating system used in conventional drilling, is lack of pressure control in the annulus. Particularly in case of a kick, the rig mud pumps must 4
19 be turned off in order to visually observe the mud flow out of the well into the return line. This is called a flow check (or static flow check). If that confirms a kick, the well is immediately shut-in by closing the blow out preventers (BOP); then the pressure in the annulus can be monitored. During flow checks, the reduced ECD unfortunately allows more influx into the well. This requires extra kick circulation work and ultimately causes longer NPT 6, 7, 8. Another drawback of conventional circulation systems is what petroleum engineers call wellbore ballooning. Ballooning is a transient condition, caused by wellbore pressure fluctuations. The symptoms are that mud is lost while circulating during drilling, but the well flows mud back during connections when the mud pumps are off. The flow back is a kick symptom, and therefore causes the drilling crew to observe the well (flow check), which consequently increases the NPT. Conversely, it can also mask a well control incident if misdiagnosed 9, 10. Using a closed and pressurizable system, common in UBD and many MPD applications, can mitigate these problems by allowing a more precise control of the annular pressure. 1.3 Underbalanced Drilling UBD technology, historically preceding the MPD, intends to control the BHP. However, BHP is kept intentionally below the exposed formation PP at all times to allow pore fluid to enter into the well and be produced at the surface (Eq. 1.5). If the ECD of the lightest available mud is greater than formation PP gradients, then gas, foam, or mist usually is injected into the well to reduce the BHP 11, 12. P < PP... (Eq. 1.5) BH The primary objective of UBD is to protect the reservoir productivity against damage caused by mud and cuttings invasion into the productive zones. Therefore, it can be the best technique when it comes to low pressure, mature as well as naturally-fractured reservoirs. 5
20 However due to technical or economical barriers, the application of UBD is not generally recommended, should well stability be an issue, well productivity is high, or there is a possible occurrence of high levels of sour gas 11, 12. There are several major benefits associated with the application of UBD technology such as a) potential elimination of formation damage, b) formation characterization while drilling or testing-while-drilling, and c) identification of production zones that otherwise could not be seen by overbalanced drilling 11, 12. Although the main focus of UBD is regarded as reservoirrelated 2, UBD can also reduce drilling-related problems such as lost returns, slow ROP, or differential sticking. 1.4 Managed Pressure Drilling A recent study by James K. Dodson 1 Company has revealed that drilling related problems account for approximately 36% of the total reported NPT for gas wells drilled in shallow waters (less than 600 ft) of the GOM prior to Major drilling related problems that contribute substantially to the above figure are differentially stuck pipe, lost circulation, wellbore instability and kicks 6, 7. The primary objective of MPD, in contrast to other techniques, is to minimize the NPT by reducing the drilling-related problems. The Intentional Association of Drilling Contractors (IADC) defines MPD as: an adaptive drilling process used to precisely control the annular pressure profile throughout the wellbore. The objectives are to ascertain the downhole pressure environment limits and to manage the annular hydraulic pressure profile accordingly. It is the intention of MPD to avoid continuous influx of formation fluids to the surface. Any influx incidental to the operation will be safely contained using an appropriate process 13. A combination of tools and techniques are used to apply MPD concepts. The main variations of 6
21 MPD are: Constant Bottomhole Pressure (CBHP), Pressurized Mud Cap Drilling (PMCD), Dual Gradient (DG), and Health, Safety and Environment (HSE). 1.5 CBHP Method of MPD One of the popular MPD variations 14 and the focus of this study is the CBHP method. In this method, a combination of P AF and surface back pressure help keep the wellbore pressure constant. The relevant wellbore pressure is not necessarily at the location of the drilling bit, and it can be in the openhole at whatever location requires precise pressure management 6, 15. The strength of CBHP method lies in establishing an ECD profile much closer to the formation PP gradient. The proximity of BHP to PP profile (or small dynamic overbalance) also increases ROP, reduces formation invasion, allows deeper casing setting depth, reduces ballooning, and reduces swab and surge effects Application of the CBHP Method To date, The CBHP method has the most possible applications within all MPD variations 16. The most important one may be the ability of the CBHP method to allow drilling in very narrow PP-FP margins, which can be experienced in deepwater environment by significantly reducing the drilling-related issues. Drilling slimholes in abnormal pressure environments is application of the CBHP method. Due to typically high friction in the well, the flow rate can be conveniently changed to achieve the desired BHP that is necessary for the trouble zone. Depleted zones become another potential application of the CBHP method, where a depleted PP and its induced reduction on FP provide the drilling window with a step-back pressure profile, as compared to other embedded high pressure zones. Consequently, a loss of returns in the depleted zone may trigger a kick from the high pressure zone. This situation, known as the loss-kick scenario, requires precise BHP 7
22 control. It can also increase the number of casing seats to reach total depth (TD), resulting in a smaller, ultimate, borehole size and reduced hydrocarbon production potential. 1.6 Well Control Challenges of MPD Well control incidents are an outcome of the uncertainty in downhole drilling margins. This uncertainty is generally neither reduced nor eliminated if an MPD method is adopted for a drilling operation. The uncertainty always remains. Although MPD methods and variations generally have better control of pressure environments in a well, the elimination of well control incidents cannot be guaranteed. In fact, narrow drilling environments impose the design of smaller kick margins compared to conventional drilling. Consequently, the well may become more vulnerable to well control incidents. These events may be of less severity than typical, especially if the MPD surface equipment enables faster detection of kicks or losses. Nevertheless, MPD operations have well control challenges just as conventional operations do. 1.7 LSU MPD Consortium Research Objectives A consortium including LSU and several significant industry members interested in MPD operations was initiated in 2006 for a three-year initial research period. The LSU consortium provided technical advice and the financial means for this research. The overall objective of the consortium is to establish comprehensive and reliable well control procedures for MPD operations equivalent to, or better than those currently used for conventional drilling operations. The specific goals of the proposed research project are to define, develop, document, and then demonstrate effective well control procedures for use in the CBHP method of MPD operations Thesis Objective The initial response to a kick represents the immediate task a drilling crew should perform in order to stop the formation influx into the wellbore. Whenever a kick is taken in 8
23 conventional drilling, the immediate response is to shut in the well and then record the pressures on the choke and drill pipe versus time. These pressure records are interpreted and then used as the basis for removing the kick from the well and ultimately killing the well. On a CBHP method of MPD, however, the well is closed by a Rotating Control Device (RCD) and flow out is diverted through a drilling choke. So, there may be more initial responses to stop the formation influx including circulating and non-circulating responses. The objective of this research is to investigate and evaluate the best alternative initial responses to gas kicks taken while drilling during the CBHP method of MPD. Alternative initial responses to kicks were investigated by using computer simulations incorporating two different wellbore sizes, two different formation permeabilities, two different kick detection limits, and three different formation pore pressures. The results will provide a basis for further research into well control procedures for MPD operations. 1.9 Overview of Thesis Chapter 1 highlights the most important concepts of the conventional and underbalanced drilling operations and introduces managed pressure drilling (MPD). The constant bottomhole pressure method CBHP, as a variation of MPD, is also introduced into the focus of this study. The objective of this research is summarized in this chapter. Chapter 2 summarizes the background knowledge about MPD techniques, and in particular the CBHP method, with emphasis on well control operations. Chapter 3 describes a detailed work plan for conducting the research. It lists different criteria that are included in the simulation study in order to check the effectiveness of the different initial responses to kicks. It also introduces a transient, multi-phase simulator that is used for this study and summarizes the detailed validation work that was done to assure the 9
24 credibility of the planned work. Chapter 4 discusses two different well representations used for the study, the slim hole, Well X, and large hole, Well Z. Chapter 5 introduces and describes different initial responses that can stop the gas kicks while drilling during MPD operations. It also explains the application of each on the simulator. Chapter 6 discusses and analyzes the results observed from the simulation study. The effectiveness of responses is compared with the defined criteria. The best initial responses specific to different conditions are categorized. Chapter 7 summarizes the most important conclusions of this research and includes a list of recommendations for future work. 10
25 2. LITERATURE REVIEW A meticulous search was performed through the Society of Petroleum Engineers (SPE) and other resources to take advantage of prior developed knowledge in the context of well control procedures for the CBHP method of MPD. Since CBHP is a variant of MPD, which itself is a descendant of UBD, a broader search was necessary. Consequently many papers, including several presentations, were found up to April 2009, and the relevant literature with an emphasis over well control during MPD operations was organized and will be discussed in this chapter. 2.1 MPD General Concepts As a new technology, a basic understanding of the MPD concept was necessary before any specific well control research could be realized. Authors, Hannegan 2, 16, 18, 19, 20, 31 6, 7,, Malloy 8, Finley 11, 12, Nauduri 15, Villatoro 21, Grayson 22, 23, Ramalho 24, Kozicz 25, 26, 27, Stone 28, Nas 29 and Cantu 30 introduced MPD and discussed its potential benefits and applicability versus conventional and underbalanced drilling, its variations and special equipment used, and typical offshore requirements, etc. A summary of these discussions follows Introduction to MPD A narrow window between formation PP and FP usually exists in deep water environments (Fig. 2.1). This is generally due to the lesser geostatic weight of the water column, which reduces the overburden as compared to the onshore strata; consequently the drilling window is narrow, i.e., smaller than what is usually seen on land. Typically, there are uncertainties over a formation s real PP and FP before any drilling operation. In conventional drilling, there are also larger uncertainties over the BHP relative to the formation s PP and FP. If wellbore pressure is too close to the formation PP, well control incidents can develop. Conversely, high BHP contributes to stuck pipe and lost returns 2. Consequently, the economic burden associated with remedial actions could surpass the planned drilling budget or force 11

26 compromising the TD. This simply implies that conventional drilling in those environments may potentially result in wells being economically un-drillable 6, 7, 8. This becomes extremely critical, in the knowledge that at least half of all offshore potential prospects have narrow drilling margins 2. Fig. 2.1: A typical narrow drilling window depiction in marine environments An accurate annulus pressure management technique is required to keep BHP within narrow downhole pressure limits; otherwise, potentially all of the drilling related issues are prone to occur. Hence a strong drive for a newly innovative and pressure-conscious technology to drill in trouble zones 2 safely, coupled with economic efficiency, is deemed necessary. The CBHP method of MPD is intended to fulfill this requirement 6, 7, 8, Advantages and Limitations of MPD There are several major benefits in employing MPD, compared with conventional drilling, including: a) improving ROP, b) minimizing differentially stuck pipe, c) minimizing lost returns and associated mud costs, d) reducing well control incidents, e) reduction of redundant casing seats so casing can be set deeper and f) reduction of wellbore instability by less pressure cyclic changes. There is no actual intention of allowing formation influx, therefore less surface equipment is required and associated costs are lower compared to UBD. MPD provides much 12
27 safer operations in H 2 S and HPHT (high pressure, high temperature) environments than UBD 11, 12, 16. The application of MPD may not be possible if the drilling window is extremely narrow or if the drilling margin varies significantly within the openhole interval 11, 12. Nevertheless, the application of MPD shows an increasing growth. In Asia Pacific 29, over 100 wells have been successfully drilled using MPD methods MPD Equipment MPD uses a combination of special tools and techniques to precisely control the ECD within narrow drilling margins. This may be achieved by designing hydraulics, and controlling surface back pressure, etc 13 6, 7, 8, 16, 19, and 20. Minimum equipment required for the MPD practice includes a rotating control device (RCD), a drilling choke manifold (DCM), and at least one nonreturn valve (NRV). These tools are briefly explained below. Rotating Control Device (RCD): The majority of MPD techniques use a closed and pressurized annulus by application of a RCD (Fig. 2.2). A surface or subsea RCD 30, 31 is used as the major safety and well control equipment that is deployed with the BOP to divert the returning mud to a drilling choke manifold. A RCD has rubber elements that permit the rotation and movement of drill pipe while the well is closed. The RCD is a supplement to the BOP stack and is not designed to replace it as a main well control device 6. Typically, API specification (16RCD) requires a RCD to contain 2500 psi while circulating and stripping, and 5000 while static 98. Drilling Choke Manifold (DCM): A DCM is a modular choke system (Fig. 2.3) with redundant legs that can be used to control the BHP by manipulation of the mud return flow to create back pressure. Its control can be manual, semi-automatic, or automatic. A DCM is not 13
28 designed to replace the complete functionality of the rig s choke manifold 6. In this thesis and for simplicity, a choke implies a drilling choke unless otherwise specified. Non-return valve (NRV): An NRV or float valve (Fig. 2.4) is used in many MPD operations. It is installed in the BHA and allows only a downward flow of the mud. It provides safety against any possible fluid up-flow migration in the BHA to the surface. Unfortunately, it does not allow any BHP observation in a well control incident, due to the hydraulic isolation of bottomhole and surface. The plunger and flapper types are most common. There are other optional tools that can be used, together with the basic ones mentioned above to help improve the wellbore pressure management 6 : Continuous Circulating System (CCS), downhole deployment valve, ECD reduction tool, back pressure pump, flow out metering, surface multi phase separators, pressure while drilling tool (PWDT), and hydraulic flow modeling. A more accurate way of knowing the mud flow rate-out of the well is offered by using a Coriolis flow meter (Fig. 2.5). In conventional drilling, a paddle-type flow sensor provides a very basic method to inquire about the mud level in the return line 4. If a Coriolis flow meter is used, however, the density as well as mass flow rate can be obtained very accurately. By dividing the mass flow rate by the density, the mud flow rate-out (volume rate) of the well can be deduced 32. An accurate mud flow rate metering increases kick detection capabilities and identifies the drilling problems more efficiently. Coriolis flow meters are highly accurate for single-phase fluid. Unfortunately, this error level of the conventional meters would increase over ±20% with a two-phase fluid 32. Digital Coriolis technology provides more accurate and faster responses for two-phase fluids. A recent Coriolis meter data sheet represented ±0.1% accuracy of volume and mass flow rates and ± gr/cc accuracy of fluid density

 Fig. 2.")
 (With the")


29 RCD BOP Fig. 2.2: RCD above the BOP Fig. 2.3: A typical automated DCM (With the permission of AT BALANCE TM ) (With the permission of AT BALANCE TM ) Fig. 2.4: Non-return valve (float valve) Fig. 2.5: Coriolis flow meter (Plunger, left and Flapper, right) (With the permission of AT BALANCE TM ) Categories and Variations of MPD The MPD is divided into Reactive and Proactive categories 13 : Reactive MPD: In this MPD approach, all the well planning is based on conventional drilling methods. MPD techniques and equipment are used only as a contingency plan to diminish any possible drilling problems or surprises. Typically, a minimum of MPD equipment is required 6,
30 Proactive MPD: If the drilling plan is built on MPD techniques to take full advantage of their benefits in order to accurately manage the pressure profile in a well, then the approach is proactive. This approach tends to incorporate addition of engineered tools to drill the difficult zones economically efficient with fewer interruptions. Several proactive techniques accordingly, have been developed to allow precise control of the pressure in the annulus. The most common MPD methods or variations are 13 : Constant Bottomhole Pressure (CBHP) Pressurized Mud Cap Drilling (PMCD) Dual Gradient (DG) Health, Safety and Environment (HSE) There are other methods that are less common or still under development. These include 6 : riserless drilling, casing while drilling, continuous circulation, and ECD reduction Design Considerations of MPD Operations Demirdal 34, 35, Gravdal 36, Petersen 37, Bjorkevoll 38, Iversen 39, Godhavn 40 and Bansal 41 have added to MPD technology by modeling, predicting BHP, and improving wellbore pressure management. However, none of the above mentioned references discussed initial responses to kicks during MPD operations. Tian 42, on the other hand, investigated whether pressure fluctuations upon breaking circulation can be detrimental in narrow drilling environments, because most drilling fluids are non-newtonian and have a non-zero yield point. Nygaard 43 and Rasmussen 44 also showed that continuous circulation could reduce BHP fluctuations during swab and surge. These results imply that keeping mud circulation in the well could minimize BHP fluctuations, rather than shut down the mud pumps. This is significant for the alternative initial responses to kicks. 16

31 2.2 CBHP Method of MPD Malloy 6, 7, 8, Hannegan 2, 16, 19, 20 and Nauduri 15 gave more detailed descriptions of the CBHP method of MPD which is explained in this section. As the focus of this study, relative references are given for special emphasis, and subsequently organized in the following sections. A closed annulus by the RCD, allows better annular pressure management as a method. A well is often statically underbalanced. This refers to the times when mud pumps are off, with the pressure profile shown by the dashed green line in Fig As explained in section 1.2, while the mud pumps are running, the BHP typically increases due to the P AF, and consequently, the dynamic pressure profile is established, shown by the dashed red line. The mud flow rate can be changed in real time to adjust the P AF, to ultimately achieve the required BHP (per Eq. 1.3), in order for the dynamic pressure profile to be kept within the drilling limits. Fig. 2.6: In CBHP method, back pressure must be applied when mud pumps are off There will be no friction in the annulus when mud pumps are off, and in the case of no action, an influx may occur. To prevent that, in the CBHP method, a pressure equal to the lost P AF is applied at the surface to keep the required BHP constant. This is seen by a solid green line in Fig This pressure compensation practice repeats whenever mud pumping rates are reduced for drill pipe connections or any other reasons. 17
, diverts the mud flow across the well head. A CHBP method is also possible by application of the Continuous Circulation System (CCS), leaving no requirement to shut down the mud pumps 13.")
32 The surface back pressure is either trapped in the well just before shutting down the mud pumps by adjusting the drilling choke, or a dedicated back pressure pump (Fig. 2.7), diverts the mud flow across the well head. A CHBP method is also possible by application of the Continuous Circulation System (CCS), leaving no requirement to shut down the mud pumps 13. The control of drilling chokes can be manual, semi-automated, or fully automated; however, the selection depends on how narrow the drilling margin is or how detrimental the connection pressure fluctuations are. In MPD operation, precise control of pressure in the annulus is a primary goal, therefore great importance should be given to any pressure surges. Overall, CBHP method tries to hold Eq. 2.1 true at all times: PP < P + P + P = P + P + P < FP.. (Eq. 2.1) Hyd AF back Hyd AF trap Fig. 2.7: Back pressure pump (With the permission of AT BALANCE TM ) Tripping Operations during CBHP Method of MPD Tripping operations are identical to that of conventional drilling, if the drilling fluid is heavy enough that the well is statically overbalanced. If the well is statically underbalanced, a heavier mud should be circulated before tripping, or enough volume of pill should be pumped down the BHA to bottomhole to balance the loss of back pressure 6, 45. In another attempt, Balanced Mud Pill 46, a solid free pill was successfully placed on the top of a light density mud column to balance the BHP during tripping operations. 18
33 2.2.2 General Considerations for CBHP Method There are authors who discussed the proper application of the CBHP method, including Spriggs 14, Nauduri 15 and Stone 47. Although no well control procedures were given, these discussions are important in considering the real potential of the CBHP method. One of the important issues that should be answered prior to a CBHP job that dictates the depth of planning is being statically overbalanced or underbalanced 14. This may have significance if mud is statically underbalanced, and back pressure application is planned during kick incidents. Surface pressure may have limitations and therefore proper planning is required. Although CBHP variation tends to induce a method that keeps BHP constant, it can be quite ambiguous. Since BHP can be kept constant at one depth, special care must be taken to carefully choose the depth. Incorrect application of the CBHP method could result in cyclic loads being applied to wellbore and thus increasing hole stability problems 15, or in case of a very compressible fluid, not being able to keep the BHP constant during drilling or connections Pump Shut down Schedule during CBHP Method A proper understanding of MPD pump shut down, especially its typical duration of application, is required for respective alternative initial responses that apply such a concept. A summary for the relevant references are discussed in this section. Medley 48 explained a simple and inexpensive manual CBHP method of shutting down the mud pumps and trapping annulus pressure. In his Step-wise method, choke pressure is applied while simultaneously reducing the mud pump rate to zero in a step-up and step-down schedule in about eight minutes. This schedule can be created prior to a drilling operation by using any hydraulic model to quantify loss of the ECD at different mud pump speeds. The opposite order is applied before resuming drilling operations. Medley 48 noted a CBHP job in Texas where manualtrapped pressure and fully automated methods experienced no significant difference in 19
34 connection times. Although the use of an auxiliary pump in an automatic method resulted in minimum BHP variations, the manual method was acceptable as well. He concluded that the trap pressure method can have potential application, although problems may still occur during a fully automated application of the CBHP method. Arnone 49 investigated the pressure and temperature effects on downhole fluid properties and therefore on BHP fluctuations, showing that the effects were more significant in HPHT environments. He also described a ten minute-long, step-wise, manual pump shut down schedule before connections. He advised that the theoretical schedule be correlated with the PWDT reading to develop an accurate schedule, and to practice it before beginning drilling operations. None of the above mentioned literature discussed any initial responses to kicks during the CBHP method of MPD. 2.3 Recent Technologies in CBHP Method Different technologies have been introduced that primarily allow the application of the CBHP method. Since, these technologies practice different methods to control kick influxes, they are likely to represent different initial responses, and so must be explained separately. Their respective examples in the field also follow each method Micro-Flux Control Santos 50 introduced micro-flux control or MFC, a new method suitable for drilling in challenging environments. This method is based on a minimum loss/influx of fluids, and involves adjusting the return flow rate in order to manage the bottomhole pressure within the PP- FP window. The well is closed at all times, with the return flow through an automated choke. The system uses a mass flow meter, which is more sensitive and accurate than conventional flow sensors for measuring the return mud flow rate. The return flow is constantly monitored and compared to the actual pump rate and computer-predicted flow to detect a loss or a kick in real- 20
35 time. In case of any discrepancies, the choke will be adjusted automatically to adjust the return flow to equal the actual flow-in. This is an example of a MPD specific initial response to a kick. This technology claims a kick detection limit of 0.25 bbl of influx, versus 5 bbls or more for conventional drilling. This early detection of a kick or loss can be crucial in regaining the control of a well. Although the intention of this system is to be fully automated, the control can be switched to manual. The development of the first version of MFC was as an automatic kick detection and control system, which was tested successfully in two phases 51. In phase one, a drilling simulator was used in conjunction with MFC system, and in phase two, LSU Well #1, with available sensors and a power choke, was used to detect an actual gas kick. The kick was detected very quickly and was circulated out automatically with less than 1 bbl of maximum total gain. This is an example of initial response and control to a kick. Santos 52 also described another use of MFC with the ultra invasion-drilling fluid (ULIF) technology as a means to significantly reduce drilling problems experienced in deepwater prospects. He claimed application of both methods together can potentially extend the openhole section and eliminate extra casing strings. No well control issues were discussed MFC Field Examples Santos 53 described the first two successful applications of the MFC system in Brazil and Texas. Flow rate fingerprinting during pipe connection was practiced before drilling the shoe to help detect any future drilling anomalies. Soon, this practice showed its benefit when kicks were detected due to a different flow out pattern during a pipe connection, and in another case, during back-reaming. An increase in flow out and decrease in mud density were observed after one bottoms-up, which confirmed gas influx. Small increases in static mud weight were managed by monitoring the next pipe connection fingerprints as an initial response to gas kicks during pipe 21
36 connections. Santos 54 also described application of the MFC in an onshore well in Mexico. The major drive for the employment of the MFC was to minimize the dynamic overbalance to improve the ROP and reduce the possible NPT due to uncertain pressure environments. Trip gas was observed and circulated out with MFC control. No other well control procedures were discussed Dynamic Annular Pressure Control Van Riet 55 announced development and testing of a fully automated prototype that can improve control of BHP during drilling. This prototype, which was later called the Dynamic Annular Pressure Control (DAPC) system, was devised by the Shell research center in It consists of a hydraulics simulator, and a computer controlled, drilling choke manifold and a back pressure pump to keep BHP constant during drilling operations. The idea behind this method relies on the fact that BHP variations during static and mud circulation can be compensated by the application of back pressure. The computer system receives different operational inputs, or can be calibrated if a PWDT were available to keep the BHP constant by calculating a required set-point for the back pressure pump. The author did not describe how this BHP is defined. However, it appears to be based on the ECD achieved by mud properties, geometry of a well, and pump pressure, etc. He further explained the full scale testing of the system against routine drilling operations in a test well facility in the Netherlands. drillers and wait and weight methods programmed in the computer system were successfully employed to circulate out detected and undetected gas kick tests DAPC System Field Examples Reitsma 56, 57 explained the first successful applications of the DAPC system on a HP geothermal job, as well as two offshore jobs in the North Sea and GOM. The DAPC configuration was different for these three cases. In one of them, without a PWDT, BHP was fine 22
37 tuned by drill pipe pressure data. A manually operated back pressure pump was used which resulted in psi BHP fluctuations. BHP was managed, relatively constant, within 30 psi for a fully automated case. Differentially stuck pipe was rectified by the reduction of surface back pressure. Roes 58 also discussed the application of DAPC system for the same well in the GOM. No well control issues were discussed. Laird 59, Taggart 60, and Geddes 61 described the application of a DAPC-CTD (Coiled Tubing Drilling) project on the same field in the North Sea. No well control issues were discussed. Chustz 62 explained the application of the DAPC system on the Auger TLP (Tension- Leg Platform) in the GOM to minimize hole instability issues and lost returns, due to pay sand depletions. A lower mud weight was used and back pressure was applied by the DAPC to maintain BHP within the well stability and fracture pressure gradients. This system was fully automated and managed the BHP within 0.3 ppge. No well control issues or loss returns occurred. In an illustrated MPD pipe connection, step-wise pump shut down and start up procedures took around ten and eight minutes respectively. Chustz 63 gave another update on the same location after drilling four sidetracks. Improvement in the application of the CBHP method, with help from the DAPC system, allowed limiting BHP fluctuations to within 0.2 ppge of the set-point. The accuracy of the mass flow meter, which had been inconsistent, was improved by couple of modifications to 2-3% of the downhole circulation rate. Connection time was also reduced by over 40% to about the same as conventional connection duration. Through 10,000 ft of successfully drilled intervals, 99% of automated pump-shut down and start-up cycles were executed within set-point margins. The planned response in case of a kick was that annular pressure would be increased to a safe level below the minimum pressure that would cause formation fracture, or the pressure rating of 23
38 surface equipment. This would rapidly increase the BHP and stop the influx, assuming the BHP achieved is greater than formation pressure. This procedure was expected to be viable during drilling at full rate. An alternative response was described as the addition of the same incremental pressure to the pressures in the step-wise MPD pump shut-downs and start-ups schedule. This can potentially stop the influx before shutting in the BOP, and reduces the extra volume of influx taken during pump shut down. Although these well control procedures were addressed, no real experiences executing these procedures were discussed, nor were details about the application of these alternative initial responses quantified. Fredericks 64 described the application of a DAPC system for a shallow gas well offshore Myanmar. The water depth was 400m, and a gas sand appeared to be m below seabed. A narrow, drilling margin of around 200 psi increased the possibility that the pressure required to control a gas influx would result in the gas broaching to seabed, which would be very dangerous. Therefore, a faster kick detection, as well as accurate pressure control, were deemed essential to avoid breaking the shoe, should it be necessary to control a gas kick. A flow model predicted that three minutes were required to detect a kick and to shut in the well. This was safely possible if BHP could be kept within a 15 psi window while drilling, and within 45 psi during connections or well control procedures. Many improvements were needed to achieve this level of accuracy, such as an accurate PWDT, a Coriolis meter and an MWD with wired drill string telemetry to minimize the update time of PWDT data at the surface. Consequently, a kick detection system was developed to detect flow out changes of one gpm. As a result, MPD step-wise pump schedule durations were reduced to less than two minutes. All of these capabilities were tested prior to drilling the shoe by injecting nitrogen in the well to allow it to migrate and expand. A modified volumetric kill method was developed by using the DAPC system and real-time PWDT data, in order to bleed 24

39 and lubricate the gas flow from the well, so that the BHP could be kept greater than the PP. This detailed planning and preparedness resulted in a successful job. and no well control incidents were experienced Vogelsberg 65 discussed another application of DAPC system with uncertain pressure environments located onshore Texas. A typical MPD step-wise schedule for pipe connection took 80 and 120 seconds respectively, while the DAPC system kept the BHP constant. Fig. 2.8 shows how the DAPC system responded in ten seconds to a sudden flow rate out drop. Four second transients were also claimed to be detected by this system 66. No well control procedures were discussed. Fig. 2.8 is especially important, as the responses of computer simulators to a choke opening adjustment are typically instantaneous. Consequently, a real basis for the duration of return flow monitoring before the next choke adjustments are applied, i.e., a definition of a time step, was required for this research. Fig. 2.8: A transient of 10 seconds was detected by the DAPC system (With the permission of SEPCO) 25
40 2.3.3 Continuous Circulation System Jenner 67 introduced CCS, a new way of drilling without shutting down the mud circulation in order to keep the BHP constant. The primary benefits of this system include elimination of BHP fluctuations associated with the conventional drill pipe connections, elimination of circulations before making connections, reduced wellbore ballooning, and improved hole cleaning. Jenner 67 listed extended reach drilling, deepwater wells, UBD, and MPD as possible applications of the CCS. Calderoni 68 and Vogel 69 discussed the evolution of the CCS from the prototype version to the first commercial tool, which was successfully tested on a land rig in Italy. The application of CCS in a BHA, however, does not improve the ability to detect or control kicks Continuous Circulation System Field Examples Calderoni 70 discussed the first field application of the CCS technique in an exploratory well offshore Egypt with extremely narrow pressure margins. Due to the importance of maintaining mud circulation to minimize pressure surges during drilling, dynamic well control procedures were planned for application in case of possible gas influxes. Since increasing the mud flow rate could increase the ECD, and consequently the BHP in the event of any kicks, it was advised as an initial response rather than a shut in response. Should any loss of returns incident occur, reducing the ECD also was advised. Although a series of lost returns and gas influx issues resulted in a 14 day well control operation on one occasion, no further details of the procedures were discussed nor did the author describe any details about the implementation steps of the pre-planned dynamic well control procedures. In terms of the capacity of MPD to minimize drilling problems, it seems, this example was an unsuccessful case. Calderoni 71 also explained the application of the MFC system and Eni Circulation Device (E-CD), a newly designed continuous circulation valve, in a HPHT environment in the lower 26
41 Mediterranean Sea with high kick-loss incidents. Based on the description of the field history and its location, it seems to be in the same location of the previous example. The E-CD is a sub that is made up on top of stand to be picked up by top drive. It also has a manifold that diverts the mud from the standpipe manifold through a hose into the side entry of the E-CD sub. The idea was to reduce BHP fluctuations during drilling by application of E-CD, and simultaneously managing BHP within pressure margins through application of the MFC system. Several kicks were taken and circulated out conventionally. However, during the 5-7/8 section, MFC was used online only for kick-loss detection purposes. The author demonstrated in detail the benefits of the online MFC application, versus its offline application. The most significant benefit was a total kick volume taken of 24 bbls when the MFC was online, versus 245 bbls when it was offline. The kick volumes reported by the rig crew when MFC was online were 5, 6 and 13 bbls. Since this was first experience by the operator, the automatic kick control ability of the MFC was disabled and SI was used as the initial response. The significance of this example includes the ability of the operator to TD this exploratory well for the first time after several failures. One of the key factors in this achievement was the early kick detection capability of the MFC system. It can also be deduced that, the application of a dynamic response in terms of only increasing the ECD, as an initial response within such a tight drilling margin, was not successful as evidenced in the theses two examples. Even though the accurate kick detection capability reduced the kick volumes during this example, the significance of a properly planned initial response to ultimately control the well cannot be underestimated from these two examples. Moreover, the kick volumes gained when the MFC was online shows that the kick volumes entering into a well during MPD operations may not always be small, even if kick detection ability is high. This is specifically important for 27
42 this study, since kick detection limits must be defined for the study of alternative initial responses. 2.4 Examples of Different Initial Responses Several authors published MPD field experiences that offered different initial responses to kicks, other than what was realized and discussed at the time. We deem it necessary to discuss these separately. Kadaster 72 explained a coring operation in the Alaskan Arctic where a shallow depth blow-out, believed to be due to probable gas hydrates, had been experienced. A reactive MPD approach was deployed merely to safeguard the operation due to any possible well control incidents. To take advantage of high ECD in the slimhole, a dynamic kill operation using preprepared charts was planned. No kicks however, occurred during the operation. In this example, an increased flow rate as an initial response to kicks was planned. Saponja 73 discussed MPD applications in a region in Canada where well control incidents due to loss of returns or high pressure nuisance gas kicks led to high NPT rising from weighting up the drilling fluid. The reduction of drilling cost was about 20% to 40% during field trials. He advised a continued circulation in the event, a nuisance gas zone influx was encountered, and to reduce well head pressure (WHP) by application of a dynamic annular pressure control technique. Saponja 73 also advised that the Bleed and Feed technique be applied as an advanced variation to dynamically control annular pressure for that purpose. This method potentially deenergizes the nuisance kick zone by pressure depletion. This is an example of initial response to nuisance gas kicks. If the influx does not stop, then the operation must switch to a well control operation. Consequently, a Flow Control Matrix (FCM) was defined that will be discussed separately. He also explained that MPD utilizes the conventional and UBD well control 28
43 procedures. He emphasized that proper risk management is required in order to bridge from MPD operations to well control procedures. Vieira 74 explained an application of the CBHP method of MPD in an onshore exploratory well that had uncertain pore pressure; tight hole and gas kicks had also been experienced. A flow control matrix was also defined (refer to 2.6). A semi-automated choke was used, and a step-wise pump schedule was implemented for drill pipe connections, but the duration of the schedule was not mentioned. However, plots showed two step-wise schedules that were executed within 15 and 20 minutes. These are examples of a manual MPD pump shut down and start up durations. No MPD well control procedures were addressed; however some elevated levels of connection and trip gas were observed, which was reduced by increasing the ECD. Perez-Tellez 75 talked about a CBHP method application in a HPHT field in southern Mexico with potential problems such as lost returns, formation influx as well as stuck pipe, and H 2 S hazards. A lower dynamic overbalance using the CBHP method was realized to minimize these problems. A MPD pump shut down schedule was also constructed based on equal flow rate reductions, but its duration was not mentioned. Several gas pockets were experienced while drilling execution due to the near-balance nature of the operation. However, the gas pockets were circulated out by operating a semi-automated choke, and without requiring action to shut the well in. This is an example of a circulating initial response by increasing the choke pressure. No details about the specific procedures were given. A FCM, however was designed for the proper transition to SI response (refer to 2.6). Solvang 76, Syltoy 77, and Bjorkevoll 78 discussed the MPD operations in heavily depleted HPHT Norwegian offshore fields. Use of an advanced dynamic flow and temperature models, together with an automated choke helped to maintain a constant BHP. Additionally, the application of CCS also minimized BHP fluctuations. Choke pressure was calculated by the 29
44 model to achieve a required ECD. Syltoy 77 mentioned that no influx or connection gas was experienced during the operation, but about 3% drilled gas in the mud was observed to cause pit gain to increase about 400 to 500 liters each time. The corresponding flow rate out increase was up to 300 l/min. These gas events were best identifiable by fingerprinting. If necessary, drilling was stopped and gas was circulated out by application of casing pressure, since shutting-in the well was not recommended. This clearly would have interrupted the hydraulics regime in such HPHT environment, causing more BHP fluctuations. The application of choke pressure during mud circulation to control a kick is an important example of initial response. Syltoy 77 also concluded that a good identification of gas events versus influxes eliminated many shut-ins. Carlsen 80 explained a modified application of dynamic SI, after taking a kick with automatic control of the annulus pump rate and the choke in order to maintain a constant BHP. Although dynamic SI is introduced for the DG method of MPD (Schubert 79 ), a modified version for application in typical MPD operations was tried in this paper. For highlighting the benefits, conventional SI was also executed by shutting down the mud pumps, checking for flow, and finally fully closing the choke. The annulus pump, which can only pressurize the upper part of an annulus, acts like a back pressure pump. For the dynamic SI, a kick is also detected by an increase in return mud flow. In that case, while running the same pump rates, the choke opening is reduced to stop the pit gain increase. The BHP is then measured by the pressure sensor in wired pipes. The new BHP is taken as a new set point for the automated control of annulus pump and choke opening in order to keep the BHP constant during kick control. A new mud weight is made and drillers or wait and weight methods can be applied for kick circulation. Dynamic SI procedures resulted in much less kick volume. Due to the loss of P AF during a conventional flow check, influx intensifies, and that was the reason for the larger gain for the conventional SI. Since the well is 30
45 not SI during the application of this method, the pore pressure of the kick zone cannot be quantified. This is an important example of a circulating response to stop a kick by application of choke pressure at running mud pump rates. 2.5 Examples of other MPD Applications Soto 81, Beltran 82, Miller 83, Shen 84, Foster 85, Dietrich 86, Hernandez 87, Dharma 88 and Niznik 89 discussed successful applications of MPD to minimize drilling related problems in Venezuela, Mexico, China, Canada, Texas, Mexico, Indonesia, and in the Persian Gulf (offshore Qatar), respectively. Hannegan 16, 19, 20 claimed that MPD well control procedures are similar to that of conventional drilling. None of authors discussed any MPD well control procedures. 2.6 Flow Control Matrix A Flow Control Matrix (FCM) is defined to indicate when the transition to a well control operation is necessary. There are several authors who used or indicated a FCM in their published experiences. Since the matrix associated with the FCM represents well control procedures, it importantly should be explained and discussed in this section. A version of the FCM or operational matrix 90 is required by the MMS, before a permit to drill can be granted for MPD job. Fig 2.9 shows a sample matrix given for the CBHP method, to be used in the GOM region. The chart provides an easily understandable hazard level, as well as instructions for rig crew to conduct a safe transition to well control operation, depicted by the red color. The influx indicator seen at the left of the matrix can be any or any combination of influx state (descriptions of flow characteristics), influx rate, influx duration, and influx gain. Consequently, each can be subdivided into none, low, medium (or moderate) and high to fit into the table. These alarm levels must be quantified by relating them to the maximum operational limits. An example of influx gain associates low, moderate, and high gain with 0.5 bbl, less than 31

46 1 bbl and greater than 1 bbl respectively. The surface pressure indicator at the top of the table describes different levels of pressure that can be applied to the annulus. Saponja 73 explained the FCM procedure used. Since nuisance gas kicks were expected, the matrix included the gas rates at the left and the WHP at the top. He discussed that a basis for designing a matrix should be: maximum pressure rating of RCD and choke manifold, maximum capacity of surface separators, and MPD maximum allowable casing pressure (MACP) to construct pressure indication levels. Vieira 74 constructed his FMC based on influx gain and WHP. A 2 m 3 of kick influx necessitated the response to the kick being shut-in. Perez-Tellez 75 used influx state versus WHP to design his FCM. All of these authors employed different initial responses in their FCMs such as: increasing or decreasing back pressure, pump rate, and / or mud density. Fig. 2.9: A typical CBHP method operational Matrix by MMS GOM region 90 As it can be seen from the MMS 90 matrix, changing back pressure, mud flow rate and / or mud density or SI are the distinctive initial responses to kicks that are considered appropriate by the MMS, and which appeared on the other samples of FCMs. However, the exact sequence, 32
47 duration or application of each is not discussed. The most important objective of this thesis is to evaluate these initial responses and any other relevant responses that effectively stop the influx. 2.7 Initial Response Comparison Study 91, 92 Das was the first researcher who compared initial responses study research to document apt well control procedures for the CBHP method of MPD initiated by the LSU MPD 91, 92 consortium in Das compared three primary responses, including SI the well conventionally, increasing back pressure while keeping the same mud circulation rate, and ultimately increasing mud circulation rate without changing back pressure, using computer simulations. Each of these responses can potentially stop an influx. However, each mechanism that increases the BHP over the kick zone pressure to stop the influx is different. Therefore, assessment criteria for effectiveness were defined. Those included whether a given response resulted in: A conclusive way to stop influx that can be insured or confirmed A conclusive way to identify downhole losses or wellbore being intact Minimum surface pressure Minimum risk of loss of returns A transient multiphase flow simulator (Ubitts TM ) was used to predict the application of the initial responses to different kicks. A 6 slim-hole (Well X) and a 17 ½ large-hole (Well Z) were selected as representative geometries, and the related well data, such as PP, FP, productivity index, mud data, and zones of interest were given by the project sponsors. Since these well scenarios were MPD applications with narrow drilling margins, taking a kick could risk lost returns in weaker zones or a loss of return could trigger an influx from a higher pressure zone. For the purpose of generality to responses, the sensitivity study was also performed by changing kick size, kick fluid (oil, gas), kick intensity (underbalance), and drilling fluid type 33
48 (Water and oil based mud). An increase of mud flow rate out was used as indication of influx during drilling. Das 91, 92 conclusions included: No response was identified as the best, as effectiveness depends on hole size and relative location of kick and loss zones. The circulating responses may stop an influx faster than SI and impose less casing pressure; this reduces the risk of lost returns. Increasing the mud flow rate requires the least choke pressure to maintain a given BHP and consequently, the least risk of lost returns at the casing shoe or a surface equipment failure; however, this is not a successful response in large holes or in case the mud pump rate is limited. Increasing back pressure is simple to apply and reduces the risk of breaking the shoe relative to a SI response. However, it can mask lost returns. SI response is fast, simple, and known to the industry; however, it causes the highest casing pressure and increases the chance of fracture at the shoe or exceeding the pressure rating of the surface equipment. There were a number of limitations to Das s work that opened the stage for this study. One of the most important is that Ubitts TM only accepts Newtonian fluids, but generally, most drilling fluids are non-newtonian 4. This can undermine the accuracy of the simulations, and Das 91, 92 recommended that Ubitts TM be updated to a more accurate simulator for future research. He made several AFP hand calculations for a steady state, single WBM fluid to evaluate the Ubitts TM hydraulics predictions, which did not show a good match. Additionally, the time to stop larger kicks was less than the time to stop small kicks. This behavior was opposite the research expectation. Das 91, 92 also recommended the future upgrade to Ubitts TM be evaluated for the accuracy of its predictions. 34
49 Das 91, 92 also recommended studying the effects of the productivity index (PI) on the effectiveness of the responses. PI controls the amount of influx feed-in rate into the well, and whether it is high or low can have differing impacts on the ultimate control of an influx. The other limitations of his work that appeared in the recommendation section of his thesis, relates to a limited number of kick intensities that were studied. Incorporating different formation pressures in order to change the drilling margin can help to define the limitations or boundaries for effective application of a given initial response. Since a best initial response was not identified by Das s work, meeting the initial LSU research consortium objectives required more work, as embodied in this thesis. 2.8 Simulator Abdul Mujeer 93 discussed how a proper hydraulics flow model could impact the successful application of a CBHP method in offshore India. Consequently, for a valid study of alternative initial responses, and in regard to Das 91, 92 recommendations, Dynaflodrill TM was suggested by the LSU MPD consortium members to be used for this simulation-based study. Rommetveit 94 introduced Dynaflodrill TM as an advanced simulator with a transient multiphase hydraulics model, useful for proper design of UBD operations. He described laboratory experiments and full scale testing used to evaluate the simulator. The results showed that the simulator predictions of BHP and parasite string gas injections were acceptable for a steady-state flow of gas-liquid mixtures, as well as for transient behavior during pipe connections. No more references to the further application examples of Dynaflodrill TM could be found, because the names of software are not published in the papers. An evaluation of the validity of Dynaflodrill TM predictions is planned for this research; therefore, the limited number of Dynaflodrill TM application, found in the literature, may not be critical. 35
50 3. RESEARCH METHODOLOGY 3.1 Summary of Project This study will identify and evaluate reliable procedures that may be applied upon well control incidents during the CBHP method of MPD operations. The initial response to a kick aims at stopping the formation influx into the well. There can be different alternative initial responses to stop an influx, but not all promise a successful and efficient well control operation. Therefore several initial responses were identified in this project and will be specifically evaluated for minimizing associated risks and maximizing effectiveness. An apt initial response to a kick is a critically important step to assure safe overture into well control operation. 3.2 Research Plan Steps taken to conduct this research are detailed in this section: 1. Current knowledge: Available literature about MPD operations with an emphasis on well control areas was reviewed during the course of this research to assure that the study takes prior industry knowledge into account. This review was reinforced by the sponsors feedback throughout the project. 2. Simulation: The flow of kick fluids into a wellbore is a transient and dynamic event. Therefore, transient computer simulations may be an efficient method to study alternative initial kick responses. Dynaflodrill TM (Version 4) was selected as the advanced, multi-phase, transient simulator. An interactive training session was held to learn the software. More detailed information about Dynaflodrill TM and the validation study that was performed will be covered in the next section. 3. Representative well geometries: In order to simulate kick scenarios, representative geometries must be defined in Dynaflodrill TM. This includes casing and drill string data, reservoir and drilling fluid data, etc. During this study, two well descriptions provided by the 36
51 sponsors were Well X, a 6 slim hole, and Well Z, a 17 ½ large hole, both of which were used on previous research done by Das 91. Both wells have drilling environments suitable for MPD application. Well X is a directional well with a potential deep kick zone, whereas Well Z is a straight hole with a potential shallow kick zone. The required well information to set up Dynaflodrill TM input files was based on descriptions of actual wells, but the well names X and Z are used for ease of reference and to maintain anonymity of the operators and well locations. The combination of these well geometries and kick scenarios provide a wide spectrum to help investigate the generalities of successful initial responses. The descriptions of Well X and Z are explained in Chapter Kick scenarios: In order to investigate initial kick responses, it is critical that kick scenarios attempted in simulations be realistic, and resemble the occurrence of typical kick incidents during drilling operations. For this entire study, only kick scenarios that occur upon drilling into a zone where the pore pressure exceeds that which was expected will be discussed. Kicks due to sudden BHP fluctuations or surface equipment failures were discussed separately by Hakan Guner 95. Cases of lost returns on bottom inducing kicks from a shallow, high pressure zone were studied by Das 91. The industry sponsors requested an emphasis on initial responses that could successfully stop formation influx and avoid loss of returns. Therefore, simulation of cases where the weak zone is above the high pressure zone, i.e., where actions to control a kick increase the likelihood of lost returns, are the focus of this study. This weak zone is typically the formation at the casing shoe, at the top of the open hole. Consequently, risks induced to a casing shoe are one basis for evaluating an initial kick response. There are many factors that contribute to the severity of kick incidents, including under balance pressure at the kick zone, the fracture pressure of weak zones, the kick zone s 37
52 permeability, the kick fluid type and density, the drilling fluid type and density, the kick volume, etc. In reality, most of these parameters are not accurately known before drilling into a kick zone. Additionally, the interaction of kick fluid and drilling fluid can also complicate the well control operation. The LSU consortium members agreed on simulating kick scenarios for the worst case, which is usually associated with gas kicks in water-based mud (WBM). This is due to the fact that gas solubility in WBM is usually minimal and therefore, the gas migrates to surface rapidly, causing potentially excessive surface pressures. The results developed from this approach are conservative, and therefore their application are expected to be safely extended to the less severe cases. Reducing kick scenarios to conditions mentioned above would still require a very large number of simulations to cover all possible combinations of influencing parameters, which is not practically possible. A reasonable combination of the mentioned parameters includes extreme cases such as easily- versus hardly-controllable kicks which ultimately results in a large reduction in the number of simulations. Moreover, those extreme kick scenarios, plus the fact that Well X and Well Z are, in a sense, extremely different wellbore sizes, broaden the study of initial kick responses. Hopefully, this would generalize the successful initial responses more relevantly. For this purpose, two extreme kick zone permeabilities of 5 md and 500 md were selected. Additionally, in order to simulate hardly controllable kicks as well as routine kicks, a range of kick intensity, and therefore kick zone pore pressures, were studied. In order to increase pore pressure systematically, the kick margin at the shoe was used as a basis for selecting pore pressures. The kick margin for MPD operations is defined herein as the difference between the shoe fracture pressure and the ECD in the annulus opposite to the shoe. Fig. 3.1 illustrates a PP and FP window for Well X, where hydraulics is adequate to keep the well dynamically overbalanced, i.e., dynamic wellbore pressure is greater than formation 38
 formation pore pressures to generate three underbalanced cases that have different kick")
53 pressure at all depths. This displays a base case where no kick will occur, even during drilling into the high pressure (HP) zone at about ft TVD. For kick scenarios however, 20%, 60%, and 120% of the kick margin will be added to nominal (or planned) formation pore pressures to generate three underbalanced cases that have different kick severities. These combinations for Well X and Well Z, at their respective drilling pumping rates, will create about 0.1, 0.5 and 1.2 ppge circulating underbalanced (Circ UB) pressure gradients upon drilling into the HP zone. The base case serves a no kick scenario when it comes to compare and contrast initial kick responses to the routine operation. Fig. 3.1: Wellbore pressure versus depth for routine CBHP MPD operations 5. Kick detection criteria: Kick volume in a well is a function of differential pressure at the kick zone, the permeable zone s characteristics, and kick detection capabilities. High kick volumes can potentially risk the well control operation. On the other hand, those initial kick responses that successfully stop small kick volumes may not effectively stop large kicks or may increase the risk of lost returns significantly when applied to a larger kick. Therefore, the study 39
54 of alternative initial responses to kicks should be evaluated against its sensitivity to kick volumes. Originally, the LSU consortium members agreed on an increase in mud flow rate versus time as the primary, field-applicable indication of downhole influx. Consequently, in cases with accurate surface flow out metering, sustained increases of 5% over 1 minute or 3% over 2 minutes were defined as kick indications. Otherwise, a 20% increase over 1 minute or 10% over 2 minutes were defined as kick indications, representing cases with conventional flow out monitoring. Later, when Well X simulations were being reported, the practicality of these kick detection criteria was questioned by some consortium members. Additionally, kicks that were deemed conclusive with accurate flow out metering were only about 1 bbl of gain for all simulated cases of Well X. This did not seem to be a conservative outcome, and consequently, the kick detection criteria were revised. The new criteria recognize kicks as conclusive upon 2 or 20 bbls of gain for cases with or without accurate flow metering, respectively. These limits which are more routine per literature review (chapter 2), are also easier to implement on simulations. Thus all of Well X simulations were repeated with 2, and then 20 bbls, of gain before further simulation study of alternative initial kick responses. 6. Initial kick responses: Six responses were defined during the course of this research, in addition to the three original initial responses that Das 91 investigated. Therefore, nine initial kick responses were evaluated for this study. The description of each initial response is explained in Chapter Effectiveness criteria: After the application of the initial responses on the kick scenarios, some evaluating criteria must be defined to help select the more favorable responses. In order to assess which alternative kick responses are more effective, the purpose of an initial response 40
55 should be considered. An initial response aims to stop an influx. Therefore, those responses able to stop the influx are judged more effective than the others. However, a trade off might become an excessive casing pressure that breaks the shoe and causes loss of returns. For example, if a response allows more kick volume into the well while stopping the kick, the loss of hydrostatic pressure could increase the risk in further well control operations. Consequently, the extra volume of kick into the well after application of an initial response is also critically important. This can be monitored by monitoring the total pit gain. Therefore, several criteria should be met collectively before an initial kick response may be recognized as the best response: Ability to stop formation flow Ability to verify that formation flow is stopped (assuming intact wellbore, due to inability of DFD to address lost returns scenarios) Ability to minimize formation fluid volume (minimize pit gain) Ability to minimize pressure imposed on weakest formation (risk of lost returns) Ability to minimize pressure imposed on surface equipment (risk of failure) Ability to handle fluid rates (risk of exceeding flow capacity of surface equipment) LSU MPD Road Map A work flow to show the steps taken to complete the numerous mentioned simulations was developed before commencing the simulation study. This work flow, termed a road map, defines the research method. It is in fact a snap shot of the entire research plan. Fig. 3.2 shows the matrix of simulation scenarios in which a well geometry is selected and the respective well data which will be used in DFD. Later, proper formation permeability and pressure will be chosen. The larger formation pore pressures are calculated using kick margin (or MAASP). Fig. 3.3, however, depicts general sequential steps taken to complete the entire research. Together, these figures are the road map for the project 41
, drilling is started, and pit gain will be used as indicative of a kick.")

56 After setting the inputs into DFD for a specific kick scenario (per Fig. 3.2), drilling is started, and pit gain will be used as indicative of a kick. Each initial response is applied, and the results are recorded for analysis. Consequently, after all initial responses are applied to the different kick scenarios, the results are compared and the best response is identified as per the effectiveness criteria. Fig. 3.2: Matrix of simulation scenarios and sensitivities Fig. 3.3: Sequential steps for simulations 42
57 3.3 Research Tool An efficient study of alternative initial responses to kicks is most practical if based on advanced computer simulations. Pressure and temperature changes impact the fluid properties in the downhole conditions and consequently the wellbore pressures. Therefore, advanced hydraulic modeling is required. Additionally, the influx rate from a zone into the well is a transient that depends on the zone s properties and the wellbore pressure. The kick itself creates multi-phase fluid flow in the annulus, including gas migration. Consequently, an advanced dynamic, multiphase flow simulator is required to simulate well control accounting for these complicated phenomena. 3.4 Dynaflodrill TM Dynaflodrill TM (DFD) is a software application intended to simulate and design UBD applications. It runs under the Drillbench TM engine and includes an advanced, multi-phase, flow model that allows simulation of steady state and dynamic modes as a result of the interaction of influx and drilling fluids accounting for the phenomena described in the previous section 96. A study of kick influxes and responses to stop those influxes can therefore be performed using DFD. In addition, due to DFD s advanced hydraulics model and the poor results of Ubitts TM validation 91 in the prior study, it was decided to utilize DFD for this research Dynaflodrill TM Inputs Parameters There are multiple input data that should be collected for a representative well before any simulations can be attempted. The main parameters required for DFD simulations are described in this section 97 are the following: 1. Survey data: Measured depth, inclination, and azimuth of all survey stations are entered, and TVD is calculated, using minimum curvature method. 2. Wellbore geometry: Specifications of casing strings, as well as the open hole, are entered. 43
58 3. Drillstring: Specifications of drillstring, as well as the drilling bit, are entered. 4. Surface equipment: Choke specifications include inner diameters; duration of the closure and its input (pressure or opening) are collected. For this research, a 3 inch inner diameter for the choke, with 0.5 minutes duration of closure 98 was selected. The choke input parameters will vary based on the way an initial response is applied (refer to Chapter 6). Other significant inputs are the separator working pressure, RCD closure time and liquid pumping rate. 5. Injection system: Drillstring and annulus (parasite and source point) injections are possible. Although this option was used for the software validation, it was not useful for the kick simulations. 6. Mud properties: Specifications of drilling mud are entered, including: fluid type, component density (base oil, water and solid densities as well water/oil ratio), PVT model, and rheology model, including the Fann table or PV and YP. A Black oil PVT model was used throughout the simulations. Rheology models include Bingham, Power law, and Robertson-Stiff. Robertson-Stiff is a three-parameter model, which includes a non-linear flow curve with a yield stress. The Robertson-Stiff model was used for this study based on the validation results in section Reservoir conditions: Characteristics of reservoir rock, as well as its fluid, are entered in this section. For any defined zone, the pressure, temperature, porosity, permeability, and influx rate model should be known. The influx rate models available are: constant rate, linear PI, squared PI, and reservoir model. The reservoir model depends on permeability, porosity, drawdown, and the length of the exposed bore. This model was used throughout the simulation study. 8. Temperature: Drillstring and annulus temperature versus depth may be entered in a table. 44
59 Optional inputs to DFD are also important for this study. The important ones are: 1. Pressure loss model: Beggs and Brill (for Newtonian fluids); the Semi-Empirical and Mechanistic models are also available. Semi-Empirical model was used for this study based on the validation results in section Friction factor model: There are several options, including Colebrook, Dodge-Metzner, Ed. Technip 1982, etc. Dodge-Metzner model was used for this study based on the validation results in section Observation points: Up to five positions in the well can be specified for pressure and temperature observations. This is especially valuable for observation of pressure at the bottom and shoe during kick simulation and control. Examples of input data sets are included as Appendix A and B Running Simulations in Dynaflodrill TM Two options are available to control simulations in DFD, interactive and batch modes 97. In the interactive mode, the user can modify the operational parameters during simulation, which include initial bit depth, liquid flow rate, gas injection rates, ROP, and the choke status. In batch mode however, simulation steps are specified in a table before actually starting a simulation. Later, the whole simulation is performed with no interaction from the user. The results of a simulation can be viewed graphically during the simulation and/or exported in different forms Limitations of Dynaflodrill TM Two major limitations in DFD impacted the depth of this simulation based study to some extent. Although pore pressure can be defined for reservoir zones in DFD, a fracture pressure cannot be specified. This means that the wellbore always remains intact, regardless of an infinite pressure buildup in the annulus. This limitation does not allow a study of cases involving lost returns. However, for this initial response study, these are not major limitations. The pressure in 45
60 the annulus, particularly at a weak zone like a casing shoe, can be monitored for different initial responses. Consequently, the risk associated with each response during stopping a kick can be quantitatively evaluated. Pit gain, an important kick indicator, was not a direct output in DFD (Version 4), and therefore was calculated using flow rate out and in data after recording that data. Consequently, for the 2 and 20 bbl kick sizes studied in this research, simulations were interrupted to find the correct simulation time required to take the pre-defined kick sizes Validation of Dynaflodrill TM A meticulous study, including more than 100 simulation runs, was performed to evaluate the validity of DFD simulation results. Since the outcome of this research was to be used as a basis for well control procedures during the CBHP method of MPD, confidence in the validity of results is important. A summary of the validation study follows this section Dynaflodrill TM Validation Method Simulation of alternative initial responses to gas kicks requires a robust engine. Consequently, a useful validation of DFD not only should examine its ability to reasonably simulate steady state modes, it should also predict soundly transient state modes. 1. Steady state: In this phase of DFD validation, the normal circulation of mud in a geometrically known flow conduit could be simulated and frictional pressure loss predictions verified versus the real data. Fortunately, historic data of tests done at the well LSU#1, as well as more comprehensive tests done by Amoco Production Company 99 at the well LSU#2, provided an opportunity to construct these well geometries in DFD and compare the results of simulations to the real data. Several steady state circulations of weighted and unweighted drilling fluids were available. The frictional pressure losses could also be checked versus theoretical predictions 4. 46
61 2. Transient state: In this phase of DFD validation, gas migration and kick circulation could be simulated in DFD and the results, such as pit gain and drill pipe pressure, verified versus the real data. Several transient state tests of simulated gas kicks with weighted and unweighted drilling fluids at the LSU#2 well were available as well Description of the Steady State Validations The LSU#1 and LSU#2 well geometries were constructed in DFD. A description of the wells and the historic data used for validation are introduced in this section: 1. LSU#1 is a vertical well with a depth of around 3000 ft and three different size annuli. Pump pressure data at several flow rates was available for an 8.4 ppg almost Newtonian WBM. A schematic of the LSU#1 well is included in Appendix D. 2. LSU#2 is a vertical well with 3.5 tubing inside casing at a depth of around 6000 ft. Pump pressure data at several flow rates was available for four selected sets of WBM from 8.6 to 12.4 ppg. The rheology of these drilling fluids followed the Power law rheology model well. A schematic of the LSU#2 well is included in Appendix E. The majority of available settings in DFD were alternated during simulations of each data set from LSU#1 and LSU#2. These include: 3 different mud rheology models (Bingham, Power law and Robertson-Stiff), 2 different pressure loss models (Mechanistic and Semi-empirical) and 3 different friction factor models (Colebrook, Dodge-Metzner, and Ed. Technip 1982), with two different pipe roughnesses for sensitivity checks. After entering a set of mud data and different models in DFD, the flow rate was increased to match the real data and accordingly, the pump pressure was recorded for evaluation process. This was repeated for all cases. The same simulations were also repeated using Ubitts TM (versions 2.9 and 3.0), which employs a very simplified rheology model and with independent hand calculations, using Colebrook s and Dodge-Metzner equations 4 for the LSU#1 and the LSU#2, respectively. 47

62 The Results of Steady State Validations A summary of the results of the steady state simulations is shown in Table 3.1. The overall results indicate that the selection of friction factor and rheology models impacted the DFD results. For Newtonian fluids, however, the results were identical with all of rheology models, but the Colebrook friction factor model showed the smallest error. For high rheology fluids, the Robertson-Stiff rheology model and the Dodge-Metzner friction factor model showed less than a 6% error consistently. The other friction factor models predictions were not as consistent and typically had larger errors. Ubitts TM also demonstrated inconsistently and larger errors. No significant difference was observed between pressure loss models in the steady state validation. Therefore, Robertson-Stiff as the rheology model, Dodge-Metzner as the friction factor model, and semi-empirical as the pressure loss model were concluded to be the proper settings for this research, although not all of these settings were recommended by the software developers. Table 3.1: Steady state error ranges between DFD predictions and the real data from LSU#1 and LSU#2 48
63 Description of the Transient State Validations The validated DFD models from the steady state simulations were entered in the DFD input parameters as the default settings. In order to validate the multi phase flow behavior of DFD, a gas migration test data set was chosen. In the original test, Nitrogen gas was injected in the bottom of LSU#2, and then choke was adjusted in an attempt to keep the BHP constant. The choke and pump pressure, as well as pit gain were recorded versus time in one minute increments. The following steps were followed in DFD to simulate this case: 1. The given WBM of 8.6 ppg with available Fann data was entered in DFD. 2. Nitrogen gas was injected in the bottom of LSU#2 at 1200 Scf/min to get the same initial gain of 8 bbls. 3. The choke pressure data versus time was entered in DFD, using the batch mode. 4. The simulation was started and drill pipe pressure and pit gain were observed while gas migrated in the annulus. The results were saved for the evaluation analysis. 5. Since Ubitts TM does not allow batch mode simulation, the same process was performed using interactive option. The results were also saved Results of the Transient State Validations The simulation results of the gas migration in DFD and Ubitts TM for the case described above are plotted in Fig. 3.4 and Fig As can be seen from the choke pressure data, the batch mode option in DFD allowed more accurate history matching, compared to Ubitts TM. In both simulations, the drill pipe pressure was lower, and the pit gain was larger than the real data. This shows that neither simulator predicted gas migration accurately. It also implies that both simulators underestimated the gas dispersion in the annulus. Moreover, comparison of DFD gain versus the real gain, reveals that the average gas velocity in the annulus was pretty reasonable, but that the gas surfaced much later in the simulation. The same comparison for Ubitts TM 49


64 indicates that average gas velocity was higher, and the gas surfaced very early. Two other gas migration and kick circulation simulations showed similar results 100. The results pertaining to gas migration and kick circulation would impact the accuracy of a full kick circulation study in DFD. However, for the study of the initial responses represented by the first 20 to 30 minutes of these tests, the accuracy of the DFD predictions are more than acceptable. Fig. 3.4: Comparison of gas migration results of DFD versus real data from LSU#2 Fig. 3.5: Comparison of gas migration results of Ubitts TM versus real data from LSU#2 50
65 Dynaflodrill TM Validation Summary DFD was selected for this research rather than Ubitts TM because DFD demonstrated acceptable simulations of steady state and transient conditions versus real data. Additionally, its more flexible user interface, supporting both interactive and batch inputs, allows efficient and repeatable simulation of the alternative initial responses. This further provides an opportunity to compare and evaluate the results more effectively. 51
66 4. WELL GEOMETRIES 4.1 Introduction Slim hole and large hole wellbores were defined for use in evaluating alternative initial responses to kicks for a broad spectrum of possible MPD applications. Therefore, a 6 well (Well X) and a 17 ½ (Well Z) well were selected. The detailed simulator input data for Well X and Well Z base cases (no kick cases) are given in Appendix A and B. A general description of each well follows. 4.2 Well X The objective of the MPD application represented by Well X is to produce from a mature reservoir where redevelopment with conventional drilling had not been successful mainly due to severe loss of returns. The well is an offshore sidetrack from a window milled in an existing 7 liner. Fig. 4.1 and Table 4.1 show the directional profile and summary description of Well X. Fig. 4.1: Well X directional profile plot 52
 15150 ft (13979 ft TVD) TD 17675 ft (15800 ft TVD) Hole size 6 in Max.")
67 Table 4.1: Well X data summary Well type Re-entry, sidetrack Well objective Produce from deeper sand Reservoir fluid Gas condensate Well profile Directional with max. 46 inclination Rotary table elevation 170 ft Water depth 2862 ft Mud line 3032 ft Top of window (shoe) ft (13979 ft TVD) TD ft (15800 ft TVD) Hole size 6 in Max. Bottom Hole Temperature (BHT) at TD 170 F Min. BHT (at shoe) 145 F Figure 4.2 depicts a simplified plot of pore pressure and fracture pressure profiles of Well X. The re-entry operation in such a slim wellbore is usually characterized by high AFP, which increases the ECD and therefore, requires careful hydraulics planning, especially in a narrow drilling margin. This planning was more complicated for Well X as the high pressure sand at ft (14800 ft TVD) required a mud weight of at least 13.7 ppg to avoid taking kicks. In addition for the interval shown, a minimum of 13.8 to 14.1 ppg mud weight was required for well stability purposes due to shale overburden. Fig. 4.2: Well X 6 section PP-FP gradient profiles 53

68 An ECD effect of 1 to 1.2 ppge was expected while drilling, based on P AF losses calculated with hydraulics modeling. Therefore, a mud weight that would avoid hole stability problems while static would be likely to cause lost returns either at the shoe or in the deeper, partially depleted sands, when circulating. Fig. 4.3 shows a simplified schematic of Well X, where relative location of high pressure sand to the shoe and TD, as well as BHA components, can be noted. In order to reduce the dynamic overbalance on the shoe and depleted zones, a precise wellbore pressure management technique was required. This could be realized by application of the CBHP method of MPD, where a smaller static mud weight is selected, and a combination of ECD and surface back pressure contribute to keep the target BHP constant during drilling and pipe connections. Fig. 4.3: A simplified schematic of Well X 54
69 4.2.1 Well X Operational Settings Hydraulics modeling had suggested a static mud weight of 13.2 ppg be used for drilling Well X in order to keep the BHP between 14.2 to 14.4 ppge while circulating. These circulating conditions gave a predicted ECD of ppge using DFD. This ECD (BHP of 10,710 psi at ft TVD) became the target BHP that should be kept constant just before drilling into the HP sand, using the CBHP method. Key operational inputs that remained constant throughout the simulations are listed in Table 4.2. Table 4.2: Well X Operational Settings Drilling flow rate 190 GPM Bottoms-Up lag time at the top of the HP sand (at ft) ~ 86 minutes Mud type WBM Mud weight 13.2 ppg Mud rheology Refer to Appendix A Bit nozzles, Total Flow Area (TFA) 4 x 11/32, 0.37 in 2 Drilling rate 60 ft/hr Shoe fracture pressure 14.9 ppg equal to psi ECD at shoe (at 190 GPM) ppge equal to 10,000 psi ECD on bottom (at ft and 190 GPM) ppge equal to 10,710 psi Annular Frictional Pressure Loss (P AF ) 520 psi HP sand at ft MD (14800 ft TVD) HP sand thickness 100 ft Kick margin ( ) = 1.15 ppge Max. Allowable Annular Surface Pressure (MAASP) (0.052 * * 1.15) = 836 psi Max. allowable Standpipe pressure 6000 psi Choke inner diameter 3 inches Well X Kick Scenarios Drilling into the deeper, depleted sands (per Fig. 4.2) is further complicated by the risk of lost returns at those zones, which in turn trigger kicks at the shallower HP sand, as studied by Das 91. The complication of taking a kick and the possible risk at the casing shoe is the focus of this study (Chapters 2 and 3). For any predefined formation pore pressure and permeability, bit depth is set just above the HP sand at ft, and drilling would initiate at 60 ft/hr. The bit would drill into the HP sand at ft, where gas kicks would be taken. Drilling continues at 55
70 the same rate until a surface pit gain of 2 bbls is achieved, equal to the assumed sensitive kick detection limit. At this moment the simulation is stopped, and the file is saved for the test of different initial responses as defined in Chapter 5. Then, the effectiveness of these responses is evaluated by means of the road map explained in Chapter 3. The whole work is repeated for 20 bbls of gain, equal to the assumed typical kick detection limit, in the same manner. Formation pore pressure is varied to define a total of 3 different cases of BHP, dynamically underbalanced with different severity. The method to calculate these formation pressure gradients is explained in Chapter 3, and given by Eq Kick intensity or underbalance severity may also be determined by application of Eq The values of X used in Eq. 4.1 are 20%, 60%, and 120%. Unfortunately, the 20% case only provided 0.01 ppge of dynamically underbalanced pressure, which in turn generated a very small kick, which was deemed insignificant. It was decided to create a higher, underbalanced case to achieve almost 0.1 ppge of dynamically underbalanced pressure. This is obtained by applying 25%, rather than 20% in the Eq There is no kick for the base case upon drilling in the HP sand, with the drilling parameters given in Table 4.2 and planned formation pressure, P fp. A list of all the different pore pressure scenarios is given in Table 4.3. Table 4.3: Well X Kick Scenarios (13.2 ppg mud at 190 GPM) No Kick Case X = 25% X = 60% X = 120% P fp gradients (ppg) Kick margin (ppge) P f gradients (ppg) P f used in simulations (psi) Kick intensity (ppge) 0.2 OB 0.1 UB 0.5 UB 1.2 UB P f = P + X ( Kick _ margin )... (Eq. 4.1) fp Kick _ Intensity = ( P f BHP ) ( ) (TVD ) HP _ Sand..... (Eq. 4.2) 56
71 The 3 different underbalanced cases, 2 different reservoir permeabilities, 2 different kick detection limits and 9 alternative initial responses result in a total of 108 simulations for Well X simulations to 108 runs. These runs and their results will be discussed in the next chapter. 4.3 Well Z Well Z represents a vertical exploratory well, planned to drill to a gas / oil sand at ft MD. A narrow PP-FP window caused the drilling of the 17.5 section to be especially challenging. Consequently, Well Z is a potential MPD application. The objective of 17.5 section was to drill to the planned 16 casing shoe, in a depth of 4756 ft. The well is offshore, and 20 casing is cemented at 3280 ft. Table 4.4 gives summary information about the 17.5 section of Well Z. Table 4.4: Well Z 17.5 data Summary Well type Exploratory Well objective Drill to a gas / oil sand at ft MD Well profile Vertical Rotary table elevation 140 ft Water depth 115 ft Mud line 255 ft Casing shoe 3280 ft MD / TVD Hole size 17.5 in Section TD 4756 ft MD / TVD Drilling fluid WBM Max. BHT (at section TD) 130 F Min. BHT (at shoe) 98 F Figure 4.4 depicts a simplified plot of the pore pressure and fracture pressure profiles of the 17.5 section of Well Z. As can be seen, the formation pore pressure gradient rapidly increases from 8.74 ppg at 3280 ft (20 casing shoe) to ppg at 4756 ft (TD of 17.5 section). This quickly reduces the drilling window and simultaneously, increases drilling related problems such as differential sticking and possible loss of returns at the shoe. The fracture pressure gradient of 20 casing shoe is ppg, and a mud weight of at least ppg is required (with no trip margin) to safely drill to the section TD. This leaves the ultimate drilling 57

72 window to be narrow, 0.67 ppg. Although a mud as heavy as 13.6 ppg would safely drill to the section TD, the potential for a higher pressure gas sand in this exploratory well makes this interval particularly interesting for evaluation of the sensitivity of initial kick responses to hole size. Fig. 4.4: Well Z 17.5 section PP-FP gradient profiles Uncertainty of the presence, pore pressure and depth of HP sands implies an advantage of using precise wellbore pressure management. Consequently, this could be realized by application of the CBHP method of MPD. Since there is minimal annular friction in this large hole section, using a minimal static overbalance drilling fluid while applying surface back pressure could combine to keep the target BHP constant during the drilling and pipe connection. Fig. 4.5 shows a simplified schematic of Well Z, where the relative location of a potential high pressure sand to the shoe and TD, as well as BHA components, may be noted. 58

73 Fig. 4.5: A simplified schematic of Well Z, 17.5 section Well Z Operational Settings A static mud weight of 13.1 ppg is required for the objective of drilling through the HP sand of the Well Z. This statically overbalanced mud weight provides the base case to be a no kick case, as well. A mud pumping rate of 900 gpm provides only an ECD of ppge (or BHP of 3070 psi), which in turn becomes the target BHP that should be kept constant just before drilling into the HP sand, using an application of the CBHP method. Some key operational inputs remain constant throughout the simulations; these are listed in Table
74 Table 4.5: Well Z Operational Settings Drilling flow rate 900 GPM Bottoms-Up lag time at the top of the HP sand (at 4500 ft) ~ 63 minutes Mud type 100% WBM Mud weight 13.1 ppg Mud rheology Refer to Appendix B Bit nozzles, Total Flow Area (TFA) 3 X 18/32, 0.75 in 2 Drilling rate 60 ft/hr Shoe fracture pressure ppg equal to 2415 psi ECD at shoe (at 900 GPM) ppge equal to 2243 psi ECD on bottom (at 4500 ft and 900 GPM) ppge equal to 3070 psi Annular Frictional Pressure Loss (P AF ) 5 psi HP sand at 4500 ft MD / TVD HP sand thickness 256 ft Kick margin ( ) = 1.01 ppge Max. Allowable Annular Surface Pressure (MAASP) * 3280 * 1.01 = 172 psi Max. allowable Standpipe pressure 6000 psi Choke inner diameter 3 inches Well Z Kick Scenarios The complication of taking a kick and the risk of losing returns at the casing shoe will be the focus of this study (refer to the chapter 2 and 3). Here, for any predefined formation pore pressure and permeability, the bit depth is set just above the HP sand at 4495 ft; drilling is commenced at 60 ft/hr. The bit drills into the HP sand at 4500 ft, where gas kicks are taken. Drilling continues at the same rate until a surface pit gain of 2 bbls, equal to the assumed sensitive kick detection limit, is obtained. At this moment the simulation is stopped, and the file is saved for the test of different initial responses defined in Chapter 5. Then the effectiveness of these responses is evaluated by means of the road map explained in Chapter 3. The whole work is repeated for 20 bbls of gain, equal to the assumed typical kick detection limit. Formation pressure gradients are calculated using Eq. 4.1, as explained for the Well X. The values of X used in the Eq. 4.1 are 20%, 60%, and 120%. Unfortunately, the 120% case only provided 1.1 ppge of dynamically underbalanced pressure, and consequently was changed to 60
75 130% to obtain the same severity of 1.2 ppge. There is no kick for the base case. The list of different pore pressure scenarios is provided in Table 4.6. Table 4.6: Well Z Kick Scenarios (13.1 ppg mud at 900 GPM) No Kick Case X = 20% X = 60% X = 130% P fp gradients (ppg) Kick margin (ppge) P f gradients (ppg) P f used in simulations (psi) Kick intensity (ppge) 0.1 OB 0.1 UB 0.5 UB 1.2 UB The negligible annular frictional pressure losses for Well Z eliminate the necessity of simulations for those alternative initial kick responses that stop kicks by the manipulation of friction in the annulus. This reduces the total number of initial responses for Well Z to four responses. Therefore, the total number of Well Z simulations drops to just 48 runs. These runs will be discussed in the next chapter. 61
76 5. ALTERNATIVE INITIAL RESPONSES 5.1 Introduction Initial responses to kicks are the immediate activities taken by a rig crew that are intended to stop an influx of fluids from a permeable formation into a well. The success of an initial response is very critical to controlling the well. If a kick volume gets larger due to an improper initial response, it can eventually complicate the subsequent kick circulation and control procedures. For example, excessive pressure will be developed in the annulus to compensate the larger loss of hydrostatic pressure caused by a larger kick. This situation can be a potential threat to surface equipment and to the well itself. The success of an initial response to a kick also depends on several other factors, including but not limited to a) well design, b) kick detection limits, c) rig equipment ratings, and d) the rig crew s experience. Designing a well for MPD type operations in narrow drilling margins tends to reduce the number of casing strings required. This can allow the well to reach TD with an appropriate bore size for efficient production. However, the resulting small kick margin implies an inherent limitation of well design for these operations. In addition, the IADC UBO/MPD committee has HSE and well control guidelines for rig personnel when attempting these kinds of operations. There may be limitations to the rating of equipment based on anticipated well requirements. Ultimately, with these constraints the importance of a proper initial response is critical. The kick scenarios investigated in this study are those taken during drilling into a permeable formation that contains a higher PP than expected. This class of kick incidents still carries a major potential for occurrence during MPD operations, which aim to drill faster in trouble zones for fewer interruptions. The other classes of kicks include off-bottom kicks, kicks 62
77 due to failed equipment, and kicks from upper high pressure zones due to loss of returns on bottom. These kicks are not considered in this research. There are additional approaches for increasing the BHP and stopping an influx during the CBHP method of MPD besides those used in conventional drilling. In conventional drilling, as mentioned in Chapter 1, Shut-In (SI) of the well is essentially the only way to stop kicks. In this simple method, there is no ECD after mud pumps are shut down. Permeable formation fluid enters into the wellbore building up pressure in the annulus as soon as annulus is closed. This continues until enough BHP is achieved to balance the zone PP. In the CBHP method, however, the well is closed by the RCD, and mud flows through the DCM. Thus, a SI response can also be realized by closing the choke. Other applicable mechanisms in the CBHP method that can potentially increase BHP and stop an influx are to apply surface back pressure and to increase the ECD or a combination of both. A total of nine alternative initial responses were finally defined to investigate the best alternative initial responses to gas kicks taken during drilling in the CBHP method of MPD operations. These may be divided into two major categories based on the mechanism by which they stop an influx. These categories are non-circulating and circulating responses. In the following sections, the initial responses, respective to each category, will be described and for each, a simulation example is shown to demonstrate the use of that response in DFD. 5.2 Non-Circulating Responses (NCRs) Five NCRs that are studied in this research will be described in this section. All of these initial responses end up with the well SI, and since there is no mud circulation, these are categorized as non-circulating responses. The well can be SI either by application of RCD and the choke or by closing the BOP directly. If the pressure rating of the RCD is not sufficient, then closing the rig BOP is the only logical non-circulating solution. 63
78 One of the major benefits of applying the NCRs to any kick scenario is the ability to directly determine the real formation PP from interpreting the stabilized casing and drill pipe pressures after a SI. However, if a NRV is used in the BHA, as is usually the case with MPD operations, then it is required to bump the float to realize a relevant drill pipe pressure for the interpretation. Another fact about the NCRs is an inherent ability to ultimately stop any influx as long as the wellbore remains intact. In a sealed and pressurized annulus, an influx may continue after the initial SI; however, it will only continue until the increasing BHP balances out the kick zone PP. Another benefit of Non-Circ responses lies in the fact that they do not require accurate surface mud flow rate-out (Q out ) metering before they can be applied to a kick. A proper pump start up procedure must be commenced after determination of the SI casing pressure required to stop formation flow in all of the NCRs. This is a necessary procedure before any kick circulation activity can be stated, which unfortunately can increase NPT. Another drawback of the NCRs is the immediate need to start the kick control procedure. This is especially serious in the case of gas kicks in WBM, which are the focus of this study, and are usually referred to as worst case scenarios. As the gas starts to migrate to the surface, casing pressure (P c ) continues to increase, and if no action is taken, it can potentially exceed the rating of the surface equipment, the casing design limits, or the fracture pressure of any weak zones in the well. The NCRs studied in this research are: SI; MPD pump shut-down (SD) with (W)/ choked flow check (CFC) and SI; MPD pump SD and SI; automated (Auto) MPD pump SD W/ CFC and SI; and Auto MPD pump SD and SI. All of the NCRs are applicable to Well X. For Well Z, however, due to a lack of significant P AF to construct the MPD pump SD schedule, the NCRs simply reduce to SI. 64
79 5.2.1 Shut-In (SI) The SI response is definitely the most recognized response to kicks in the entire petroleum industry. Any time there is uncertainty in well control aspects, the conventional drilling wisdom instructs the drilling crew to stop the mud pumps, do a flow check, and then SI the well. In MPD operations, where the annulus is already closed with the RCD, a flow check will show that the formation is flowing if the well is statically underbalanced and therefore is unnecessary and inappropriate. A simple method of shutting down the mud pumps and then closing the choke as fast as is practical is therefore a useful adaptation of conventional SI for MPD operations. The American Petroleum Institute 98 (API) requires that 30 seconds be enough for a choke throat to be fully closed. The SI schedule shown on Table 5.1, which looks like a conventional hard SI without a flow check, was defined and applied in the batch mode in DFD simulations; the process allowed all of the simulated cases to be consistent. Several practices and demonstrations at the LSU well facility with standard rig equipment demonstrated that the whole schedule could be repeated within much less than 1.1 minutes. Table 5.1: SI schedule Shut down the mud pumps 0.5 min Closing the choke min Example of SI Response Fig. 5.1 shows an application of SI response on a 2 bbl kick taken after drilling into the Well X HP sand at ft MD with 500 md permeability (high k). Drilling into this zone creates a circulating UB of 0.5 ppge at a drilling rate of 190 gpm. An accurate kick monitoring device was assumed to be available, which allowed early kick detection. A kick is recognized by the increase of the surface mud flow rate-out (Q out ), as shown by the arrow. Drilling was stopped, and the mud pump was shut down when pit level confirmed 2 65

80 bbls of gain. Afterwards, the choke was closed according to the schedule displayed in Table 5.1. Casing pressure consequently increased to balance the kick zone s pressure. This is affirmed by the choke pressure curve that stabilized at around 1100 psi. Hence, BHP increased and surpassed the formation pressure at the point shown by the green marker. At this point, the formation influx stopped, and therefore this initial response was successful. The slow rate of the choke pressure increase seen after this point indicates that gas migration is occurring in the annulus. About 5 bbls of extra kick volume was taken after commencing the SI response, until the choke was fully closed; thus, a total pit gain of 7 bbls remained constant for the rest of the simulation of the initial response. BHP, formation pressure, and the choke opening were divided by ten before plotting in order to allow better clarity and use of one scale. Fig. 5.1: Well X, application of SI on 2 bbl kick / high k / 0.5 ppge Circ UB 66
81 5.2.2 MPD Pump SD W/ CFC and SI The MPD pump SD W/ CFC and SI response commences with the CBHP method s proper pump shut-down schedule. This particular initial response, intended to simulate a manual form of pump shut-down, follows a step-wise pump schedule discussed in Chapter 2. At the end of the schedule, the P c that is required to compensate for the lost P AF is held constant for two minutes before shutting the well in, unless SI is required to maintain this P c. This provides an opportunity to check whether the pre-calculated P c is enough to stop formation flow. If not, the well will flow, and this particular practice serves the purpose of a flow check in conventional operations. Since the choke may not be fully closed during this period, yet the flow conduit was restricted, it was decided to call this part of the schedule a choked flow check or CFC for descriptive purposes. The required P c may be achieved either by trapping the pressure in the well through manipulation of the choke or by using the choke and a dedicated back pressure pump to impose pressure on the well. This method ending in SI has the benefits and drawbacks common in all NCRs that were previously discussed but is obviously slower than a simple SI. Its advantage is to confirm whether the planned P c will, in fact, control the well. Table 5.2 shows an 11.5 minute step-wise schedule until the well was SI; this schedule was constructed with the knowledge that the choke on a typical MPD job may not be semi or fully automated. As a result, some MPD pump SD schedules have required 10 to 15 minutes to perform. In such cases, the schedule must be manually achievable for the mud pump and choke operators. 15 minutes were added to all simulations In order to monitor the pressure build ups and interpret the stabilized pressure data. This schedule was applied to all Well X kick scenarios with this response for consistency. In practice, the SD should be conducted quickly and may be completed in as little as 2 to 3 minutes. 67
82 Likewise, the SI monitoring period should only be long enough to determine that formation flow has stopped, allowing a stabilized P c to be determined. Table 5.2: Schedule for MPD pump SD W/ CFC and SI for Well X Time (min) Mud Flow in (gpm) RCD Choke P c (psi) Comments Closed Open 100 MPD pump SD Closed Open Closed Open Closed Open Closed Open Closed Open Closed Open Closed Open Closed Open Closed Open 520 "choked flow check" Closed Closed Buildup SI 15 0 Closed Closed Buildup SI, Monitor Example of MPD Pump SD W/ CFC and SI This initial kick response, with the schedule shown in Table 5.2, was applied on the 2 bbl kick from the Well X HP sand at ft MD with a high k and the Circ UB of 0.5 ppge (the same kick scenario shown for the SI example). Results are shown in Fig After the initial gain of 2 bbls, drilling was stopped. The MPD pump SD was implemented, which resulted in keeping the choke pressure constant for 2 minutes (choked flow check or CFC), followed by SI. This practice replaces the P AF with an equivalent non-circulating back pressure, in order to keep the BHP constant. This is true when there is no kick and therefore the flow rate out closely follows the flow rate in as per the schedule, thus generating a no kick fingerprint. This so-called fingerprint can be recorded or modeled before drilling, and then compared to the actual flow rate out response as a sensitive kick detection method. For the no kick case ideally, no mud should be bled through the choke during the CFC; neither should a choke pressure build-up be seen. The simulated no kick choke pressure curve confirmed this statement. However, the no kick Q out curve shows that actually a small amount of mud had to be bled initially, at about
 during the CFC was not enough to contain the pressure of the HP sand.")
83 minutes before closing the choke completely, to allow the target choke pressure during the CFC to be achieved. If a kick is taken as seen on the plot, however, the back pressure (520 psi) during the CFC was not enough to contain the pressure of the HP sand. Therefore, the kick continued during the whole schedule and intensified during the CFC, due to an increased reservoir influx rate from a reduced BHP. The fact that flow must be bled through the choke to keep the P c constant, confirmed that a kick was in process. The BHP increased after the well was SI and caused the kick to stop. This is shown by a green marker on the BHP curve. The choke pressure also started to build up and stabilized at around 1800 psi, which was higher than for the SI response. This initial response, intended to simulate a manual MPD pump SD allowed a large additional kick volume of 42.3 bbls and consequently, was a poor response for this kick. Note that choke pressures were divided by ten before plotting for better resolution. Fig. 5.2: Well X, MPD pump SD W/ CFC and SI on 2 bbl kick / high k / 0.5 ppge Circ UB 69

84 5.2.3 MPD Pump SD and SI The MPD pump SD and SI response is exactly like the one explained under 5.2.2, except that the MPD pump SD schedule does not end in holding the P c constant for a choked flow check. Instead, the choke will be closed after establishing the required P c that balances the P AF at the drilling rate. This action comes at the end of the MPD pump SD schedule, after stopping the mud pump. This response, which takes about 9.5 minutes until the well is SI, was consistently applied to all Well X kick scenarios. This schedule, like the previous one, simulates the manual application of the MPD pump SD. All general considerations of NCRs and those specific to MPD pump SD under 5.2 and still apply Example of MPD Pump SD and SI The application of this initial response was on the 2 bbl kick from Well X, corresponding to the same conditions as for the previous examples, as illustrated in Fig Fig. 5.3: Well X, MPD pump SD and SI on 2 bbl kick / high k / 0.5 ppge Circ UB After confirmation of the 2 bbl kick, the MPD pump SD was applied. As soon as the required back pressure (520 psi) was achieved, the mud pump was shut down, and the choke was 70
85 closed immediately. A no kick fingerprint is also shown, which indicates that an ongoing kick was sustained during the application of this response to the kick. Consequently, it allowed an additional gain of 30.4 bbls, which is less than the previous case. As a result, the choke pressure stabilized at around 1600 psi. These are due to the shorter duration of the response without a CFC. A disadvantage is that the hard SI trapped some pressure in the well in the no kick case, which was not seen on the previous response with the CFC. Here, an increase of about 30 psi on the no kick choke pressure curve was observed. Choke pressures are divided by ten before plotting, for better resolution Auto MPD Pump SD W/ CFC and SI If the drilling choke control on a well location is automated, then the MPD pump SD W/ CFC and SI that was explained under can typically be more quickly applied. If a kick is confirmed, this response does not allow as much additional gain, as it is completed within 5.2 minutes as opposed to 11.5 minutes in the similar manual response. This schedule, shown in Table 5.3, was used in batch mode for simulation of all Well X kick scenarios for this response. All other considerations that were discussed for NCRs also remain true for this initial response. Table 5.3: Schedule for Auto MPD pump SD W/ CFC and SI for Well X Time (min) Mud Flow in (gpm) RCD Choke P c (psi) Comments Closed Open 100 MPD pump SD Closed Open Closed Open Closed Open Closed Open Closed Open Closed Open Closed Open Closed Open Closed Open 520 "choked flow check" Closed Closed Buildup SI 15 0 Closed Closed Buildup SI, Monitor 71

86 Example of Auto MPD Pump SD W/ CFC and SI Fig. 5.4 shows an application of a faster initial response, simulating an automated response, on the same Well X kick scenario. The schedule defined in Table 5.3 was applied, which included a MPD pump SD of approximately 3 minutes, followed by a 2 minute CFC and ending in SI. The well was flowing during the application of the response, especially during the CFC, in contrast to the no flow fingerprint. Since the duration of influx before SI was much less than previous MPD SD cases, an additional gain of only 16.9 bbls was taken. Shortly after the SI, the BHP increased past the formation pressure, and influx stopped, which the green marker points out. Stabilized choke pressure is around 1400 psi, which is less than its values in the previous MPD SD cases. Likewise, choke pressures are divided by ten before plotting in order for all curves and the legend to be seen clearly. Fig. 5.4: Well X, Auto MPD pump SD W/ CFC& SI on 2 bbl kick/ high k/ 0.5 ppge Circ UB 72

87 5.2.5 Auto MPD Pump SD and SI Auto MPD pump SD and SI is the last NCR that is studied. It is the same procedure as the manual MPD pump SD and SI discussed under 5.2.3, but it simulates a case where an automated drilling choke is available at the well site. This initial NCR is a faster response than the similar manual one. SI is reached in less than 3.5 minutes, as compared to 9.5 minutes in the MPD pump SD and SI. This schedule was consistently used in all Well X kick scenarios for this response. All other considerations discussed for NCRs also remain true for this initial response Example of Auto MPD Pump SD and SI This NCR was also applied to the same Well X kick scenario. The result is plotted in Fig This automated MPD pump SD and SI does not include the CFC. After the initial 2 bbl kick, the automated MPD pump SD schedule was applied; beginning at about 8.5 minutes, and then, the drilling choke was closed at about 12 minutes. Fig. 5.5: Well X, Auto MPD pump SD and SI on 2 bbl kick / high k / 0.5 ppge Circ UB 73
88 The well was underbalanced during the MPD pump SD; however, its duration was the least among all MPD pump SD cases, and therefore the additional gain was minimized to only 8.3 bbls. Consequently, the choke pressure stabilized slightly less than 1200 psi, which is the least when compared to all other MPD pump SD cases for this specific kick scenario. Unfortunately, this auto MPD pump SD and SI case can trap excess pressure in the well. For the no kick case, the extra choke pressure was around 20 psi. Likewise, choke pressures were divided by ten and then plotted in order to not hide the view of other important curves or the legend. 5.3 Circulating Responses (CRs) Four CRs studied in this research will be described in this section. During application of a CR to a kick scenario, mud circulation in the well is not stopped or interrupted, and hence, these are categorized as circulating responses. These responses generally aim to raise the BHP either by reducing the choke opening to increase casing pressure, or by increasing the pump rate to increase the ECD in the annulus. One of the major benefits of applying the CRs to any kick scenario is their ability to minimize the NPT. Since mud circulation is never stopped, no mud pump start up procedure is required for kick circulation. Another benefit associated with application of CRs, is their ability to reduce the expected P c, because the ECD increases the BHP relative to non-circulating conditions. Therefore they require less P c to stop an influx as compared to NCRs. Increased Q out and the resulting pit gain are the major indicators that an influx is occurring. There are alternative ways to confirm that drilling into a high pressure permeable zone has taken place, such as a drilling break, data from a PWDT, drill pipe pressure etc, but these are not as directly indicative of a kick as an increased Q out and the resulting pit gain. Additionally, CRs are generally intended to reduce the Q out with the goal matching it with the mud flow rate in 74
89 (Q in ) as the criteria that formation flow has been stopped. Therefore, these responses require accurate Q out metering to be effective. If the volumetric rate of mud (incompressible fluid) going into the well and coming out of the well is equal, there should be no formation flow into the well. Therefore, the matching of flow rates, in and out, indicates that an influx has stopped. This method worked well for water kicks, but a serious complication in the case of gas kicks (compressible fluid) was that Q out and Q in could not always be matched. Several attempts were made to address this inherent weakness in matching Q out and Q in. Finally, it was observed that the increasing rate of Q out after a reduction due to a choke pressure increase decreases after every reduction and reached a minimum upon the formation flow was stopped. Subsequent choke pressure increases result in a repeatable, slower rate that reaches a slowly increasing rate just greater than Q in. This minimal rate increase and repeatable trend of Q out versus time following the kick stoppage was a consistent behavior. Consequently, it was used as a confirmation of the kick stoppage during the simulation of CRs in DFD and will be discussed in Chapter 6 (under 6.4). The other complication of the CRs is the less direct indication of the kick zone PP; study about this case is beyond the scope of this research. The CRs studied in this research include Stepwise P c increase (Incr), Incr P c to 80% of MAASP, Rapid P c Incr, and Stepwise Q in Incr Stepwise P c Incr The Stepwise P c Incr response aims to simulate a manual application in which the mud pumping rate is held constant, but P c is increased stepwise in response to an elevated Q out. Several attempts showed that 100 psi steps on the choke were more effective than 50 psi steps and did not apply excessive BHP observed with 200 psi steps. In a MPD application, narrow 75
90 drilling margins typically require careful P c adjustments; hence, the step size should be chosen accordingly. There was no fixed schedule for cases simulating this initial response; all simulations were conducted interactively. The simulations were based on accurate Q out metering being available, but there was no fully automated or computer-aided choke control. In order to attain realism with this response as practiced manually in the real world, a consistent 30 second monitoring time was practiced after any P c step which reduced Q out to a new lower value. This provided enough time for the Q out to be monitored in a dynamic system and compared with the Q in. If there is no match, then the next P c step would be taken. Application of P c in steps was repeated until the increasing rate of Q out versus time became minimal as a sign of the kick stoppage. This was further examined by application of the subsequent choke pressure increases to observe the repeatable Q out trend. Then, similar to conventional well control, the resultant drill pipe pressure would be kept constant by choke adjustments to maintain BHP constant during kick circulation Example of Stepwise P c Incr Fig. 5.6 displays an application of the Stepwise P c Incr response on the same Well X kick scenario that was discussed for the NCR examples (drilling at 190 gpm to the HP zone at ft MD). The BHP, formation, and drill pipe pressure were divided by 10 before plotting to allow use of one scale. Pressure was set for the choke input in DFD, and drilling stopped after an initial pit gain of 2 bbls. While keeping the same mud pump rate, a 100 psi choke pressure was applied, followed by a 30 second Q out monitoring period, as explained earlier. Since this pressure was not sufficient to stop the influx, Q out resumed its ascending trend. Therefore, another 100 psi choke pressure increase was applied, and this procedure continued until around 13 minutes of simulation time, when Q out was reduced temporarily to less than Q in. After this reduction, the 76

91 increasing rate of Q out versus time became minimal indicating that the influx was stopped, which also agrees with the influx stoppage time shown by the green marker on BHP data. This observation was confirmed by application of two arbitrarily selected 50 psi choke pressures increases, as annotated on the plot. Both the profile of Q out versus time and the steady state Q out rate were essentially the same after each of these confirmation increases as seen in Fig. 5.6 which indicates the repeatable Q out trend was explained under section 5.3. An additional gain of 2.6 bbls was taken during the application of this response. In a field application, a minimum choke pressure change, achievable with the rig equipment, would minimize the risk of applying an excessive pressure. The drill pipe pressure after halting the kick must be kept constant by choke adjustments to maintain a BHP constant during kick circulation, similar to the drillers method. No choke adjustments were necessary because the drill pipe pressure did not change significantly after formation flow was stopped. Fig. 5.6: Well X, Stepwise P c Incr on 2 bbl kick / high k / 0.5 ppge Circ UB 77
92 5.3.2 Incr P c to 80% of MAASP The Incr P c to 80% of MAASP response may be practiced manually or automated in the field. After a kick, the P c is increased rapidly to the predefined maximum limit, 80% of MAASP, and then Q out and pit gain are monitored. MAASP includes the maximum pressure ratings of the surface equipment, the casing, and the maximum pressure that can be applied without causing formation fracture below the casing shoe. Typically, the lowest value for maximum pressure is determined by fracture pressure. As explained in previous chapters, the casing shoe was considered to be the weak zone in the well. In that case, the MAASP is identical to another term, which is more distinctive. This term is MACPBFF (maximum allowable casing pressure before formation fracture) and 80% of this value is used for this response to provide a safety margin. These maximum limits are usually known after drilling out the shoe, and they are known for Well X and Well Z (Table 4.2 for Well X and Table 4.5 for Well Z) Example of Incr Pc to 80% of MAASP Fig. 5.7 shows an example application of the Incr P c to 80% of MAASP response on the same Well X kick scenario. After observing a 2 bbl kick and keeping the same mud pump rate, 670 psi was applied to the choke. This value is about 80% of the MAASP for Well X. This pressure was held constant while the Q out was monitored. The established choke pressure for this kick scenario reduced the Q out temporarily to less than Q in. Finally, it became approximately equal to the Q out steady state rate, which confirmed that the influx stopped. This is also shown by the green marker on the BHP curve. This response stopped the influx rapidly, resulting in only 1 bbl of additional gain. However, the Circ UB for this case is small relative to the choke pressure of 670 psi. This pressure was so excessive that large increases on the BHP and drill pipe curves can be seen that were not experienced in previous cases. The drill pipe pressure did not drop noticeably during 78
93 the period shown, and therefore no choke adjustments were necessary. The same procedure was repeated for all Well X and Z simulations. Fig. 5.7: Well X, Incr P c to 80% of MAASP on 2 bbl kick / high k / 0.5 ppge Circ UB Rapid P c Incr The Rapid P c Incr response was initially suggested by a LSU MPD consortium industry member. The specific approach used herein was developed in the course of this research. Accurate Q out metering is required for this response to be applied in the field. An automated drilling choke is also generally used. The idea was to keep the Q in at the drilling rate while rapidly reducing the choke opening, until Q out dropped to around 110% of Q in, and then to proceed with much smaller choke adjustments in order to match Q out and Q in, as a sign of t kick stoppage. 79
94 To simulate such a response in DFD, choke closing must be performed interactively at a time step, while monitoring Q out. If the Q out is approaching the Q in, smaller choke adjustments must be taken. These choke closing steps should be defined in a manner generally applicable for any well conditions. Doing so for all Well X and Z kick scenarios, proved to be challenging. A maximum time step of 0.1 minute (or 6 seconds) was selected as a quick enough step within which any choke adjustments or Q out monitoring could be implemented appropriately in order to simulate a rapid P c response. A choke closing rate of 0.07 (1 stands for fully open choke) per time step was decided to be used at the beginning of the response. If the Q out reaches 110% of Q in, then the choke closing rate was reduced to 0.02 to 0.03 per longer time step, in order to to allow more precise Q out monitoring before confirming that the influx has stopped. After several simulations, it was noticed that although this schedule could function to stop different kicks, it needed modification for a different well scenario. It was slow for Well X, as it would take some time to establish a significant P c. Moreover in several simulations with low rate kicks (low k), Q out either was already below or dropped quickly below 105 % of Q in, yet formation influx still occurred. A key question was what would be the next choke closing step, knowing that the previous one resulted in more than a 5% drop in Q out? Several simulations were made to evaluate the last issue while trying to define a robust schedule with general applicability. It was noticed that a fixed schedule would not work for all the kick scenarios. The reduction in Q out increases for a given reduction in choke opening as the choke size gets smaller. Therefore, monitoring the reduction of the Q out progressively versus the choke closing rate allows finding a choke closing rate that would achieve the Q out reduction required to match with the Q in. Consequently, it was found that using fixed choke closing rates of either 0.02 or 0.03 after Q out was less than 110 % of Q in was not effective. These fixed step sizes 80
95 could give resulting pressure changes that were either too small or too large depending on well conditions. Hence, for each kick scenario, an attempt was made to determine the proper choke closing rate from the actual Q out reductions. A revised procedure started with a fully open choke and proceeded with a 0.07 choke closing rate per 6 second time step, while monitoring the Q out reductions. If a prior choke size reduction did not drop the Q out to less than 110% of Q in, it would be repeated. Once this criterion was met, the choke closing rate was adjusted using a linear proportional logic. This simple calculation is based on the Q out reduction achieved by means of the previous choke size reduction. This process would find a choke size reduction that proportionally would reduce the current Q out to the Q in. In order to have a more conclusive reduction in Q out, for the proper choke closing rate calculation, it was decided to target the Q out reduction to 95% of Q in. Not only did this step allow monitoring the increasing rate of Q out as it approached the Q in for the kick stoppage identification, but it also provided a margin for further choke closing adjustments, should the prior reduction in Q out be insufficient. If Q out still does not match the Q in, much smaller choke size reductions of to 0.01 per 3 to 5 time steps could be continued until the flow stoppage criterion was met. Since this modification proved to rapidly reduce the Q out, it allowed a faster BHP build up and stopped the influx more efficiently, compared to previous simulations. Ultimately, this method was further developed, understanding the that this response would be faster if a partially closed choke was selected initially. A simple practice can be repeated at well site just after drilling a casing shoe or when the risk of complications is judged to be minimal. A choke opening that provides 50 to 100 psi of P c may be found quickly by trialand-error. Later, this choke opening can be directly implemented as the first step in the method explained above. This eliminates the slow response experienced on the earlier implementation of 81
96 this response to Well X cases. These choke openings were 50% and 80%, respectively, for Wells X and Z. After these modifications, further simulations suggested that the process could start with a 0.05 choke size reduction per 6 second time step rate for all the kick scenarios of both wells after the initial choke size was reached. Table 5.4 is a schedule that demonstrates the procedure employed to simulate the Rapid P c Incr response in DFD for Well X kick scenarios. The initial choke opening is 50%. This schedule runs with 0.05 choke opening reductions per 6 second, unless the Q to_target is less than Q achieved. This simply means that Q out is in the proximity of Q in and a smaller increment of choke closing than 0.05 should be used. The new choke closing rate can be calculated as: X = ( 0 05) ( ΔQ ). to _ t arg et n ( ΔQ ) n * ΔQn 1 ΔQ (Eq. 5.1, where Q n > Q n-1 ) Table 5.4: An example schedule for Rapid P c Incr response n (Q out ) old Choke Opening (Q out ) new Q achieved (Q out ) 6sec_monitor Q to_target 1 Q1 0.5 Q2 Q1 = Q1-Q2 Q3 Q3-0.95Q in 2 Q Q4 Q2 = Q3-Q4 Q5 Q5-0.95Q in 3 Q5 0.4 Q6 Q3 = Q5-Q6 Q7 Q7-0.95Q in 4 Q7????? The Q achieved is not in reality a linear function of choke closing steps. If the choke opening is reduced in 0.05 steps as shown in the table above, then the Q achieved continues to increase. Therefore for simplicity, the Q achieved used in Eq. 5.1 is pro-rated based on what is achieved in the previous step. Several adaptations to the original idea were necessary to determine a general procedure for the Rapid P c Incr response in DFD. The final procedure, applied to Well X and Z kick scenarios, can be summarized as follows: 1. Find the equivalent choke opening at the regular circulating rate that provides a P c of 50 to 100 psi. 82
97 2. After taking a kick, reduce the choke opening continuously until reaching the value found in step Continue closing the choke opening at the rate of 0.5/minute (0.05/time step) while monitoring the Q out reduction ( Q achieved ) as in Table Use smaller increments when the Q out reduction exceeds the Q out to 95% Q in margin ( Q to_target ) per Eq If kick stoppage is not yet confirmed, use smaller increments of to 0.01/3 to 5 time steps and monitor Q out for a minimal increasing rate change Example of Rapid P c Incr Fig. 5.8 presents an application of Rapid P c Incr response on the same Well X kick scenario as for the other responses. Choke input was set to opening in DFD input parameters. After the initial pit gain confirmation of 2 bbls, and while keeping the same mud pump rate, the procedure above was applied to reach the P c in order to rapidly stop formation flow. Table 5.5 is the implementation of the procedure explained by Table 5.4 for the simulation of this particular Well X kick scenario. A choke opening of 50% was selected as the beginning step for all the Well X scenarios. The equivalent initial choke opening for Well Z cases was 80%. Q out was monitored progressively before and after each 5% choke opening reduction, in order to see the achieved Q out reduction ( Q achieved ). These values were constantly compared to the pre-assumed target of the Q out, which was 95% of Q in (180 gpm). When the Q achieved exceeded the requirement of reaching the target Q out value (i.e., more than Q to_target ), a smaller choke closing rate was applied. These values are highlighted in red in Table 5.5. The new value for the choke closing rate was calculated as per Eq. 5.1: ( 5 )* ( 19 ) X = = 2% ( 35 )* ( 35 / 23 ) 83

98 Table 5.5: Implemented choke schedule for the kick scenario in Fig. 5.8 (Q out ) old Choke Opening (%) (Q out ) new Q achieved (Q out ) 6sec_monitor Q to_target (< 35) Influx stopped Fig. 5.8: Well X, Rapid P c Incr on 2 bbl kick / high k / 0.5 ppge Circ UB The rate of Q out changed as soon as the each choke adjustment was made, until Q out dropped below Q in. This was an indication that the influx might be stopped, as in the Stepwise P c Incr method. To confirm this, two further choke manipulations were taken as shown on the choke opening curve. The Q out profile versus time was repeated almost identically after the application of these choke closing rates. This satisfied the flow stoppage criterion described in 84
99 section 5.3 and confirmed that no more influx was occurring from the reservoir into the well. The green marker on the BHP curve shows when the influx stopped. This response took around 2 minutes of simulation time to complete and allowed only 1.7 bbls additional gain. The drill pipe pressure and consequently the BHP were almost constant once formation flow was stopped, so no more choke adjustments were necessary. The same procedure was applied to the rest of Well X kick and all of the Well Z kick scenarios Stepwise Q in Incr The Stepwise Q in Incr response, which also requires accurate Q out metering for its application, uses increased Q in to increase ECD in the annulus to stop an influx. P c remains the same with no choke adjustments made until the influx is stopped. Then, the established drill pipe pressure and pump rate must be kept constant for kick circulation. Q in can be increased in steps of 10 to 20 gpm per time step (6-12 seconds) depending on the quantity of the initial Q out. If there is significant friction in the annulus, the Q in should approach the Q out. Q out equal to Q in is used as an indication that the influx has stopped Example of Stepwise Q in Incr Fig. 5.9 shows an application of Stepwise Q in Incr response on the same Well X kick scenario. After the initial gain of 2 bbls while keeping the same choke pressure (15 psi), Q in was increased stepwise in response to Q out as explained above. In a slim wellbore like Well X, the clearance between the open hole and the BHA is small, therefore a large P AF can be achieved simply by increasing the mud flow rate. In this simulation, Q in was increased 10 gpm per step at the beginning, and while approaching the Q out, a smaller increment of 5 gpm was taken. As annotated on the plot, when Q in surpassed Q out after applying a 5 gpm mud flow rate increase, the influx was stopped. At this time, two 5 gpm identical flow rate increments were applied, similar to applying choke pressure increases in the other circulating responses, to assure that the kick is 85

100 stopped and to acquire some BHP margin. This response successfully stopped the influx and allowed only 2.4 bbls additional gain during its application. The drill pipe pressure of 5960 psi, established during the initial response, did not drop much during the period shown, but it would have if the monitoring had continued for a few minutes more. Due to the fact that gas expansion in the annulus was accelerated by the elevated Q in (over 300 gpm), the loss of hydrostatic pressure in the annulus was rapid for this response, and consequently, the BHP kept falling. A second kick would result if the choke pressure was not increased to keep the drill pipe pressure constant during kick circulation. Fig. 5.9: Well X, Stepwise Q in Incr on 2 bbl kick / high k / 0.5 ppge Circ UB 86
101 6. DATA ANALYSIS 6.1 Introduction The non-circulation and circulating initial responses (NCRs and CRs), defined in the previous chapter were applied to all Well X and Well Z kick scenarios. The results of these simulations are discussed in this chapter. Specifically, these include a validation summary for DFD choke input options, a summary of simulation results, the method for determining kick stoppage during CRs, the identification of the best initial responses based on the evaluation criteria introduced in Chapter 3, and an initial response plan based on the best identified responses. 6.2 DFD Inputs for Choke Operation DFD has two options for the choke input. Pressure values may be input directly during simulations to increase or decrease the choke pressure. Alternatively, choke openings can be selected from 0 to 1. Since the NCRs required the choke to be closed fully, the pressure input option was not helpful. However, it was much easier to select the choke pressure input for some of the CRs, such as Stepwise P c Incr or Incr P c to 80% of MAASP. In order to determine the best initial responses, the simulation results from application of the initial responses to different kicks are compared. Therefore, it seemed necessary to evaluate the simulation results to make certain that they were independent of the DFD choke input options. Fig. 6.1 shows the simulation result of Incr P c to 80% of the MAASP response to a 2 bbl kick from the Well X HP sand with high permeability and a circulating (Circ) UB of 0.1 ppge. Although this response was performed throughout this research using the choke pressure input, it was also tried using the choke opening input on this plot. Several choke adjustments, as seen, were required before the target pressure could be achieved (670 psi), which took slightly longer 87

102 than the DFD through the use of a fixed pressure change rate of 5 psi/ (unit time), available with the choke pressure input option. It was experienced after several simulations that the target pressure could not be possibly be achieved fast enough by the operator s manual manipulation of the choke opening compared to the pressure achieved by DFD when the choke pressure was used as an input. Also, the operator involvement needed when using choke opening made consistency difficult. Ultimately, it was concluded to use the pressure input for the choke in DFD for those respective initial responses that require pressure input to ease simulation to make the results more repeatable. Table 6.1 summarizes the results of the simulations shown in Fig There is no practical difference between BHP, pressure at shoe, and drill pipe pressure data. The difference in the gains between choke input options is solely due to the difficulty of adjusting the pressure manually using the choke opening. Fig. 6.1: Comparison of choke input selection on a 2 bbl kick / high k / 0.1 ppge Circ UB 88
103 Table 6.1: Comparison of DFD choke inputs on a 2 bbl kick from Well X Shoe press P BHP (psi) drill pipe total gain (psi) (psi) (bbl) Choke input on pressure Choke input on opening Difference (%) Simulation Results Appendix C presents the results of the simulations in two parts. In the first part, the results of the application of the non-circulating responses (five NCRs) and the circulating responses (four CRs) are tabulated versus different kick scenarios and well geometries. Since the entire simulation output data could not be tabulated, the most important results are shown including a) choke pressure when the kick stopped and its value after 10 minutes, b) pressure at shoe when the kick stopped and its value after 10 minutes, c) BHP at 10 minutes after kick stoppage and additional gain from kick detection until its stoppage. The 10 minutes monitoring time was chosen as a rule of thumb, because, not only is it important to know the simulation outputs at the kick stoppage, but also to know and compare what occurs shortly thereafter. Twelve kick scenarios are coded, based on each set of initial responses (NCR or CR) and well geometries (2). Consequently, 48 cases were recognized (C1 to C48, where C refers to Appendix C). An index of these tables is found in Appendix C, where the tables of results and simulation plots of Well X and Z are shown. Further limitations or inapplicability of a response are addressed in the tables. In the second part of Appendix C, the results of the simulations are plotted. Each page presents a case with the same code given for the corresponding tables. Flow rates and choke pressures are plotted versus time. Moreover, additional gains and any other significant results are annotated on the plots. Since the NCRs reduce to SI for Well Z, it became possible to plot all of the twelve kick scenarios on two single pages. For the manual and automated MPD pump SD 89
104 responses, the no-kick fingerprints are also plotted to see what the responses would look like in absence of the kick. For each successful circulating response, kick stoppage time was retrieved from the BHP data. The corresponding time was marked by an arrow in the same color of the respective curve. There might be some minor differences between these marks and the kick stoppage times interpreted from the Q out trend change during implementation of the simulations. It should be noted that the simulation outputs of the NCRs, such as choke pressure and BHP are independent of operator manipulation once the pumps are stopped and well is closed in. For the CRs however, the procedure employed for each response can impact the outputs. Consequently, as opposed to the NCRs the simulation results of the CRs are inherently more operator and procedure dependent. This is the reason why the simulation outputs, such as choke pressure and pressure at the shoe, might be less consistent among the CRs. 6.4 Determining whether Kick Influx Stopped for Circulating Responses The presumed basis for determining that an influx has been stopped by a circulating response is that flow out, Q out, is equal to flow in, Q in. This method to confirm the stoppage of a kick and of formation flow into the well, pertained only to the application of the CRs. It is unnecessary for the NCRs, since the influx surely stopped if an intact well was closed-in. In both categories of the CRs, either increasing the choke pressure at the same pumping rate or increasing the ECD with a fully open choke, the basic concept of matching Q out to Q in as a sign that the influx stopped proved to be effective for intact wells in a previous study 91. Simulation of water kicks in this study showed that the influx from the HP zone did stop as the Q out was matched with Q in (Fig. 6.2). Consequently, it became the primary approach in all of the circulating response simulations because it confirmed that a kick was stopped. During larger gas kicks however, simulations showed that the Q out could not be forced to match the Q in exactly, even after the influx was stopped, or even by applying a much higher 90

105 choke pressure than was required to stop the flow. This was due to gas expansion occurring in the annulus that would push the mud out of the well thus causing the Q out to increase, as exemplified and explained in a previous report 101. Consequently, flow matching does not provide a reliable means to determine whether a gas influx has been stopped, at least for a large influx into a water base mud. Fig. 6.2: 20 bbl water kick in Well X (high k, 1.2 ppge Circ UB) Flow out Behavior during Circulating Responses to Gas Kicks Drilling is typically stopped immediately after a kick is identified to make an initial response to stop the kick. A commonly proposed MPD response would be to reduce the size of the choke opening. An example response is the Rapid P c Incr method. Fig. 6.3 shows a simplified illustration of this response to an ongoing gas kick during a typical MPD operation, 91
.")
106 after drilling into a zone with a higher PP than expected. If the well is intact, this elevated choke pressure will compress the fluid in the annulus and increase the BHP. Therefore, the drawdown at the kick zone will be reduced. This results in a reduced influx rate from the reservoir (predicted by reservoir inflow performance equation, Eq. 6.1 in the next section). Consequently, a reduction in the surface Q out will be observed (Eq. 6.2 in the next section). Further choking of the mud flow increases the BHP and reduces the Q out progressively until a P Choke is achieved that causes the drawdown to reduce to zero, i.e., the BHP will be equal to the HP zone PP, and thus the influx stops. Fig. 6.3: Qualitative illustration of increasing choke pressure at constant pumping rate Fig. 6.4 is a provisional simulation of a gas kick in Well X, where the flow of mud was sequentially choked to examine flow rate Q out behavior after the kick stopped. Note that after influx stopped, the Q out increased much slower than previous choke size reductions. It is also notable that this was true for the water kicks shown in Fig More importantly, this flow out transient behavior was then repeatable, following subsequent choke size reductions. This 92
 is a complicated function. Equation 6.")
107 behavior provides a logical basis for determining stoppage of an influx more conclusively than simply comparing Q out to Q in. Fig. 6.4: A minimized Q out Incr rate and repeatable trend versus time after influx stopped Explanation The influx rate from a gas reservoir (Q res ) is a complicated function. Equation 6.1 is a typical radial gas inflow equation 102 consisting of a Darcy and a non-darcy term. A key element which controls the influx rate in any inflow equation is the drawdown between the average formation PP and the BHP. This means that if the BHP can be increased enough by the application of an initial response, then the influx rate can be reduced to zero. The coefficient A and B in this form of inflow equation represent a function of reservoir permeability, viscosity, temperature, thickness, Z factor, skin effect and reservoir and wellbore radii. In order to simulate gas kicks in DFD, a proprietary influx model was selected whose rate depended on formation permeability, porosity, length of penetrated reservoir, and the pressure drawdown. 93
108 2 2 2 f PBH = AQ BQ.. (Eq. 6.1) P + The gas phase of a kick is immiscible in WBM and migrates up the annulus due to its lighter density. It travels upward even faster due to the mud circulating in the well (Q in ) during the application of circulating responses similar to the one shown in Fig Since the pressure is reduced on the gas as it travels up the annulus in a nearly isothermal environment, the gas should expand, as represented by larger bubbles. Consequently, while taking a gas kick in WBM, three components qualitatively contribute to Q out at surface, as can be seen in Fig. 6.3 and Eq. 6.2: Q out = Q + Q + ΔQ... (Eq. 6.2) in res exp ansion The flow out of the well, Q out is also related to the pressure drop through the choke. The flow of drilling mud through a choke is mostly subsonic, and hence, Eq can sufficiently describe the relation between the pressure drop across the choke and the Q out of the liquid. This equation is modified to present the choke area, rather than diameter, in order to match the DFD choke setting input. In this equation, ρ is the mud density (ppg), A c is the choked area (sq. in), Q out (gpm), A is a constan, and C is the flow coefficient. Crane 102 (1957) developed a correlation that estimated C to be 0.9 to 1.2 for various ratios of diameters of flow line to choke versus a range of Reynolds numbers. 2 out 2 2 Ac ρq Δ PChoke =... (Eq. 6.3) AC The key observation relative to whether inflow has stopped is that applying further choke pressure once formation inflow has stopped will increase the BHP but only reduces the rate of the Q out temporarily. Once the resulting transient has subsided, the gas expansion in the annulus solely controls the increasing rate of Q out, and thus, each transient after a choke opening reduction is expected to be similar. This can be observed in Figs. 5.8, 6.2, 6.4 and simulation results of other circulating responses in Appendix C. Before the influx stops, the transient 94
109 response of Q out versus time to a change in choke opening includes the change in Q res as implied by Eq. 6.4, and obtained by combining Eq. 6.2 and Eq But when the influx stops and Q res is zero, the transient is dependent only upon the fluid compressibility in the well, and there is no change observed due to flow from the reservoir (Eq. 6.5). ΔP Choke 2 ρ ) =. (Eq. 6.4) ( Qin + Qres + ΔQexp ansion 2 2 AC Ac ΔP Choke 2 ρ Q + ΔQ ) = (Eq. 6.5, when influx stops) ( in exp ansion 2 2 AC Ac This allows confirmation that the influx has stopped, by further choke manipulations. All of the simulations showed that the increasing rate of Q out versus time became minimal when influx stopped. This minimum rate versus time defined a trend that was repeatable by subsequent choke pressure increases (bumping the choke). Therefore, stoppage of inflow determines a minimum in the Q out trend that is repeatable. Consequently, after the trend in Q out versus time was concluded to indicate formation flow had stopped, two equal and arbitrarily selected choke opening reductions of 0.5% and 1% were sequentially applied to all simulated kick scenarios of Well X and Z for a Rapid P c Incr response. For a Stepwise P c Incr response, the corresponding choke pressure increases were 50 psi. The results of applying this approach can be seen in the plots of Q out in Figs. 5.6, 5.8, 6.4 and Appendix C. Fig. 6.5 shows an example of 20 bbl kick taken in Well X from the HP zone with a low permeability where the Circ UB is 1.2 ppge. To confirm the kick stoppage, two unequal steps in decreasing choke size were applied and then plotted for comparison to two equal steps. In each case, the increasing trend in Q out versus time was nearly unchanged. This implies that it is possible to apply a decreasing choke size in order to detect kick stoppage. The significance of this example is that especially when a large gas kick is taken, a very small increase in choke 95

110 pressure can be used to confirm kick stoppage. This minimizes the extra pressure imposed on the bottom resulting from the kick confirmation procedure. This may be critical in an extremely narrow drilling environment. In Fig. 6.5, the difference between the two confirmation sequences in BHP is about 70 psi. Fig. 6.5: After influx stopped, choke size reduction controls Q out suppression not its trend Another example that compares high and low k cases is shown in Fig Both plots describe simulations of 20 bbl gas kicks taken in the Well X HP zone with a 0.5 ppge Circ UB. The curves on the left are for the high k simulation, and those to the right, are for the low k kick simulation. The pressure at the shoe, BHP and choke opening are shown on the top plot, and the Q out, Q in and choke pressure on the lower plot. A significant increase in BHP and shoe pressure curves (green color) was experienced for the high k case, after the kick was taken. This is because the large increase in Q out increased the frictional pressure losses in the annulus. There is a smaller increase in BHP and shoe pressure (blue color) for the low k case, which decreased to 96


111 less than the original values as the kick volume approached the assumed 20 bbl kick detection limit. Fig. 6.6: Evaluation of k on kick stoppage confirmation, Well X / 0.5 ppge Circ UB 97
112 Approximately three minutes after applying the Rapid Choke Incr method, the kick stopped with the choke being about 80% closed for both cases. BHP increased about 450 psi for the low k case and only about 50 psi for the high k case. Overall, the BHP build up to stop the kicks for the high k simulation cases was achieved with minimum choke manipulations, after Q out was reduced to a value close to Q in, whereas more adjustments were required for the low k case, see Fig 6.6 and cases C22 and C46 in Appendix C. Therefore, it was easier to confirm the kick stoppage for the high k kick scenarios compared to the low k cases. Confirmation of kick stoppage using this approach was even trickier for the 2 bbl kicks, since the Q out was already close to the Q in. However, it was also much less critical because the smaller kick volume causes less expansion, and Q out can be made to nearly equal Q in. Cases C19-21 and C43-45 in Appendix C show the results for small kick sizes Q in Increase Response Interpreting the change in the rate in Q out as a tool to confirm that a kick has stopped is difficult when applying this response to a large gas kick. Fig. 6.7 presents results for a 20 bbl kick from the same HP sand in the Well X, but with low k. Since the increased Q in accelerates the gas expansion in the annulus, the expanding gas pushes the mud in front of it faster out of the well, and hence Q out keeps increasing. This rapid expansion prevented both the detection of the minimal rate increase in the trend of Q out versus time and achieving Q in greater than Q out following the kick stoppage as occurred for the 2 bbl kick in Fig In this example, significant P AF has increased the BHP to exceed the formation pressure and the influx is actually stopped, but there is no way to verify that the influx stopped by Q out monitoring. Additionally, the required drill pipe pressure exceeded the capabilities of most drilling rigs. Ultimately, these same complications were experienced in all 20 bbl kick scenarios, and therefore, it is not practical to apply this initial response for high gain cases. Other examples of these cases can be seen in 98
113 Appendix C, where annotated on the plots and labeled impractical in the tables. For the 2 bbl kick scenarios, however, a noticeable change in the trend of Q out versus time was identifiable. For these simulations, two 5 gpm Q in increases were applied to evaluate this trend and to confirm the stoppage of kicks which can be seen in the Fig. 5.9 and on the respective cases in the Appendix C. Fig. 6.7: Well X, Stepwise Q in Incr on 20 bbl kick / low k / 0.5 ppge Circ UB Summary of the Kick Influx Stoppage Confirmation for Circulating Responses With a flow rate out, Q out interpretation is required to determine whether a gas influx has stopped for circulating initial responses, CRs. This interpretation was not difficult for 2 bbl kick scenarios, and for a variety of well geometries and, reservoir conditions, Q out was almost equal to Q in when influx stopped. For 20 bbl kicks however, Q out could not be generally forced to equal Q in, and visually, it was difficult to confirm a kick stoppage. However for the responses that applied choke pressure to control the kick, a method of applying repetitive choke pressure 99
114 increases served to identify a repeatable transient behavior in Q out to confirm that formation influx had stopped. This method was successful for determining the kick stoppage for Well X and Z kick scenarios, but its application had not been quantified. Unfortunately, the confirmation of kick stoppage for the Q in increase response was practically impossible for large kicks, as the gas expansion offset the change of Q out trend that occurred upon kick stoppage. 6.5 Comparison of Initial Responses Results of the application of the alternative initial responses on the broad spectrum of the Well X and Z kick scenarios are discussed in this section. Nine initial responses in two categories, non-circulating and circulating responses (NCRs and CRs), were investigated in this research. A good, reliable response should be effective, regardless of the hole size, formation pressure, and permeability. These conditions may cause some of the responses to function inefficiently. Therefore, an effective way to discuss the simulation results of a response to kicks is to present its application versus a range of kick scenarios. Also, a logical approach to determine the best initial response, or responses, is to compare the NCRs and CRs independently before comparing the best of each General Significance of Kick Scenario Variables Some general observations were commonly seen throughout the simulations of the different kick scenarios. These will be discussed so that the significance of Circ UB, initial gain, permeability, and well geometry can be more easily deduced Kick Detection Limits The simulation examples of the initial responses to 2 bbl kicks, introduced in Chapter 5, assumed that sensitive kick monitoring equipment was in service, such as an accurate flow out meter, which allowed early kick detection. Conversely, a large kick, assumed to be 20 bbl in this study, is expected before being detected with conventional kick detection equipment. Fig
, which was discussed in Chapter 5 (Fig. 5.1).")
115 compares the results of three SI simulations. It includes application of the SI response on the same 2 bbl kick from the Well X HP zone (high k and 0.5 ppge Circ UB), which was discussed in Chapter 5 (Fig. 5.1). If a 20 bbl kick is taken while drilling into the same HP zone, retaining the same PP and k, a higher choke pressure is required to stop the influx as seen on the plot. The choke pressure for this case stabilizes at around 1500 psi, which indicates an increase of about 400 psi, compared to the 2 bbl kick case. This is simply due to a larger loss of hydrostatic pressure, which also increases the pressure drawdown at the kick zone and the influx rate from the reservoir, as compared to a 2 bbl kick. Therefore, higher choke pressure and additional gain are experienced for the 20 bbl kick case. Additionally, the larger gas influx travelling up the annulus increases the void fraction more significantly, causing a larger slope of choke pressure versus time than in 2 the bbl case. Fig. 6.8: Well X, SI on 2 & 20 bbl kick / high k versus 2 bbl / low k (0.5 ppge Circ UB) 101
116 The higher choke pressure increases the risk of exceeding the pressure limits of the surface equipment and of the integrity of the shoe. Overall, these conditions are the penalty for less accurate kick monitoring and a resulting 20 bbl kick. The pressure at the shoe when the kick was stopped, as well as the additional gain until influx stopped, were also higher for 20 bbl kicks compared to 2 bbl kicks. This effect on the pressure at the shoe and additional gain were also generally true for the circulating responses. Exceptions may be due to the effects of circulation for CRs, as well as the location of the gas column in the annulus relative to the shoe and surface Formation Permeability Fig. 6.8 also shows results for a 2 bbl kick taken in Well X with the same formation pressure (0.5 ppge Circ UB), but the permeability is reduced to 5 md (low k). In this case, choke pressure stabilizes at around 1000 psi, which is 100 psi less than the similar high k case. Although formation pressure and initial kick size are similar between the high and low k cases, the choke pressure required to stop the kick is different. This is due to the larger additional gain in the high k case. Simulation results of the NCRs and CRs also showed that generally, for the same kick size and formation pressure, the high k cases resulted in higher choke pressure, pressure at the shoe, and larger additional gain, compared to the respective responses for low k cases. Exceptions sometimes exist due to the effect of the location of gas in the annulus Underbalance when Kick is Taken The application of the SI response on a 2 bbl kick, taken after drilling into the Well Z HP sand at 4500 ft MD with high k, is shown in Fig In this plot, the SI responses are shown for different levels of Circ UB, given as a ppg equivalent in parentheses on the legend. It can be seen, as the formation PP and Circ UB increases, that the HP zone delivers larger influx rates, allowing a 2 bbl kick to be achieved earlier. It can be simply and intuitively deduced that the larger the Circ UB, the higher the choke pressure required to stop the influx. Simulation results 102

117 of the non-circulating and circulating responses showed that for the same kick size and permeability, the choke pressure and the pressure at the shoe when the kick was stopped increased directly with a larger Circ UB. Generally, the additional gain before the influx stopped also increased directly with the larger Circ UB. Fig. 6.9: Well Z, SI on 2 bbl kick / high k versus different levels of the Circ UB Summary for Well X Table 6.2 tabulates the simulation data from the application of the SI response to the complete range of Well X kick scenarios. A more complete data summary is provided in Appendix C. However, this table is shown as an example of the kick scenario observations that were discussed. There are minor exceptions to the general observations that primarily pertain to the additional gain taken while a kick was being stopped. 103
118 Table 6.2: Applications of SI response on Well X kick scenarios High k (500 md permeability) Init gain Circ 190 gpm Choke press (psi) Shoe press (psi) Addl gain (bbl) 0.1 ppge bbl 0.5 ppge ppge ppge bbl 0.5 ppge ppge Low k (5 md permeability) Init gain Circ 190 gpm Choke press (psi) Shoe press (psi) Addl gain (bbl) 0.1 ppge bbl 0.5 ppge ppge ppge bbl 0.5 ppge ppge Well Geometry A 20 bbl kick taken on the bottom of Well X results in more loss of hydrostatic head, compared to Well Z, due to its smaller hole size to BHA clearance. Additionally, the frictional pressure losses are minimal in Well Z due to its larger hole size to BHA clearance. Consequently, the simulation results of NCRs and CRs in Well Z generally showed less sensitivity to kick detection limits, i.e., 2 versus 20 bbl kick scenarios. The corresponding results in Well X are more significant, which may also be seen in Table 6.2. These results also suggest that the initial responses in slim hole applications may experience more severe consequences in regards to higher kick detection limits or higher reservoir productivity Non-Circulating Responses (NCRs) The non-circulating initial responses (NCRs) described in Chapter 5 were: SI (NCR1), MPD pump SD W/ CFC and SI (NCR2), MPD pump SD and SI (NCR3), Auto MPD pump SD W/ CFC and SI (NCR4), and Auto MPD pump SD and SI (NCR5). In this section, these responses are compared, based on simulation results. 104
119 Figs. 5.1, 5.2, 5.3, 5.4, and 5.5, which introduced the application of the NCRs on the 2 bbl kick scenario in Well X, showed that all of these successfully stopped the kick, yet the SI was the fastest. This is clearly evident from the green marker on the BHP curves. Figs. 5.2, 5.3, 5.4, and 5.5 further illustrated that the formation was flowing at all times during the application of MPD pump SD responses until the well was shut-in. Therefore, additional kick volume entered the well, which required additional choke pressure to offset the loss of hydrostatic. Consequently, higher pressure was imposed on the casing shoe. The evaluation criteria for the best initial response, explained in Chapter 3, requires a fast response which in turn minimizes the risk to the well; hence, the SI response was the best NCR for this kick scenario. Table 6.3 illustrates the simulation results for this particular kick scenario (case C2 in the Appendix C). It confirms that the SI response (NCR1) poses the least risk to the surface equipment and the casing shoe, compared to the other responses. Table 6.3: Well X, applications of the NCRs on 2 bbl kick / high k / 0.5 ppge Circ UB Data is reported at the kick stoppage Case Code Initial response Choke press (psi) Shoe press (psi) Addl gain (bbl) NCR NCR C2 NCR NCR NCR Fig shows the application of the NCRs on a 20 bbl kick from the Well X HP zone with high k and 0.1 ppge Circ UB (case C4 in the Appendix C), where the flow rates and choke pressures are plotted versus time. A brief increase in the Q out after the application of SI response is due to the loss of the P AF as the result of shutting down the mud pump before closing the choke. The Q in for the MPD pump SD responses are exactly the same as the Q in shown by the no kick fingerprint curves and therefore, are not plotted. 105
 A significant separation between the Q out and the Q in curves reveals that the well was flowing during the application of all the MPD pump SD responses.")
120 Fig. 6.10: Well X, application of the NCRs on 20 bbl kick (high k, 0.1 ppge Circ UB) A significant separation between the Q out and the Q in curves reveals that the well was flowing during the application of all the MPD pump SD responses. The influx rate even increased considerably during the choked flow check period (marked CFC in Fig. 6.10), when used in a MPD pump SD response, because the required P c was not enough to contain the influx. 106
121 Additionally, the manual MPD pump SD responses were slow, and hence allowed the well to be underbalanced for a longer time. Consequently, a larger influx entered into the well, compared to the automated responses. The SI response (NCR1) however, stopped the influx faster than all of the MPD pump SD responses, as evidenced in Table 6.4. The SI response also resulted in the least additional gain and the least pressure imposed, on the surface equipment and the shoe. Table 6.4: Well X, applications of the NCRs on 20 bbl kick / high k / 0.1 ppge Circ UB Data is reported at the kick stoppage Case Code Initial response Choke press (psi) Shoe press (psi) Addl gain (bbl) NCR NCR C4 NCR NCR NCR It is observed from the 2 bbl and the 20 bbl kicks discussed to this point, that all of the NCRs ultimately stopped the simulated kicks in the assumed intact wellbore. However, the MPD pump SD responses, either manual or automated, allowed additional kick to enter into the well. Consequently, this would cause more complications to the control of the well if the responses were taken as the initial response to a flowing well because the influx rate was intensified due to the increasing loss of hydrostatic pressure during the MPD pump SD schedule. In contrast the SI response minimizes the duration that the well is underbalanced, and therefore this was the best response for both cases shown. Moreover, the SI response is the best response for Well Z because all of the MPD pump SD responses were not applicable due to low P AF. Even if proper wellbore and BHA geometries would reasonably allow a pump SD schedule to be constructed, the SI response would yet be the best response to a flowing Well Z, similar to the Well X cases. Thus, with regard to all the facts mentioned above, and based on other simulation results in Appendix C for the Well X and Z kick scenarios, the SI response was the most generally successful response among the NCRs. 107
 is a 2 bbl kick from the HP zone with a low k and 0.1 ppge Circ UB, as shown in Fig. 6.")
122 A practical application for the MPD pump SD responses was realized during the simulation of the least severe kick scenario for Well X. This case (case C7 in the Appendix C) is a 2 bbl kick from the HP zone with a low k and 0.1 ppge Circ UB, as shown in Fig. 6.11, where the well had been flowing over 20 minutes before the assumed kick detection limit was reached. Fig. 6.11: Well X, application of the NCRs on 2 bbl kick (low k, 0.1 ppge Circ UB) 108
123 There is no significant difference in the Q out versus time between the MPD pump SD responses and the no kick fingerprints. Consequently, during a kick incident with such low intensity, it would be difficult to conclude that the well was flowing, based on the Q out profiles during a MPD pump SD. However, a choked flow check, CFC at the end of the pump SD can determine whether a kick is occurring or not. If a kick is taken, then the final P c on the SD schedule is insufficient to contain the well. Thus, the Q out continues, even increasing slightly during the CFC, as shown in Fig Subsequently, a casing pressure buildup will be observed after the well is SI, which confirms that the well was flowing. A similar buildup will also be experienced after a normal MPD pump SD and SI, or a simple conventional SI. However, these buildups could be due to trapped pressure. Therefore, it would be necessary to bleed choke pressure to check for trapped pressure in order to conclusively determine whether a kick occurred or not. Consequently, the MPD pump SD responses that end in a CFC have an advantage in detecting a weak, suspected kick, or an undetected kick during a connection, versus other NCRs. Fig illustrated a higher choke pressure for the SI response despite stopping the influx faster than all of the MPD pump SD responses. This is primarily due to the loss of P AF during the mud pump shut down, which increased the influx rate from the kick zone prior to closing the choke. The MPD pump SD responses did not allow a large BHP drop due to the P AF and P back applied during the step-wise schedule, although it took a longer time to implement them. This advantage was due to both low differential pressure at the kick zone and low permeability and the resulting low productivity associated with this kick scenario. The lower additional gains for MPD pump SD responses, therefore, caused the lower choke pressure and pressure at the shoe versus a simple SI for this case, see Table
124 Table 6.5: Well X, applications of the NCRs on 2 bbl kick / low k / 0.1 ppge Circ UB Data is reported at the kick stoppage Case Code Initial response Choke press (psi) Shoe press (psi) Addl gain (bbl) NCR NCR C7 NCR NCR NCR Summary of the Best Non-Circulating Responses Table 6.6 summarizes the application of the NCRs on 4 different Well X kick scenarios including 2 and 20 bbl kicks versus high and low k for the same Circ UB of 0.5 ppge. Table 6.6: Well X, applications of the NCRs (0.5 ppge Circ UB) Data is reported at the kick stoppage, (Data in red if P shoe > P FP ) Case Code Initial response Choke press (psi) Shoe press (psi) Addl gain (bbl) NCR bbl NCR High k NCR (C2) NCR NCR Case Code Initial response Choke press (psi) Shoe press (psi) Addl gain (bbl) NCR bbl NCR High k NCR (C5) NCR NCR Case Code Initial response Choke press (psi) Shoe press (psi) Addl gain (bbl) NCR bbl NCR Low k NCR (C8) NCR NCR Case Code Initial response Choke press (psi) Shoe press (psi) Addl gain (bbl) 20 bbl Low k (C11) NCR NCR NCR NCR NCR
125 It is evident, based on this discussion, the table shown, and Appendix C that the SI response is the most successful response among all the NCRs for the cases studied. The MPD pump SD responses without a CFC have shown no significant advantages overall. At the best, the automated MPD pump SD and SI response (NCR5) is a poor alternative to the SI response (NCR1), due to simulation results that are close to those for the SI response. The MPD pump SD responses that end in a CFC (NCR2 and NCR4) carry a particular advantage. They permit a choked flow check that identifies a questionable, very low rate or undetected kick. Either is a valuable response for these situations where a SI response may not be justified Advantages of the Best Non-Circulating Responses There are several advantages in applying the SI response (NCR1). The most important value is its simple operational procedure, which can be completed quickly in about one minute. This reduces the extra kick volume entering the well. It is also the primary well control procedure for the conventional applications. Additionally, the conventional well control wisdom requires that a well must be shut-in where there is an uncertainty regarding the appropriate conduct of the well control procedure or in the case of any surface equipment failure. Therefore, it is a well-known response in the industry, and its benefits extend to MPD applications as well. The interpretation of the pressure data following a SI allows determination of the HP zone PP, which is useful for controlling the kick. A SI response is also possible by the application of the rig choke and the BOP, which allows higher pressure ratings. It may also be implemented without requiring any special equipment such as flow out metering, an automated choke or hydraulics modeling. Finally, it can minimize the risk of loss of returns at a depth below a shallower HP kick zone 91. The primary advantage of the MPD pump SD W/ CFC and SI response (NCR2) lies in its inherent capability to detect low rate kicks during the CFC, which is an adaptation of a 111
126 conventional flow check. Therefore, it can be applied regularly for flow checks, including on connections. Since it ends in SI, it has similar advantages to a SI response, such as determining the formation PP and minimizing the risk of lost returns on bottom, as explained above Limitations or Disadvantages of the Best Non-Circulating Responses Table 6.7 presents the results of the best NCRs (NCR1 and NCR2) to 20 bbl kicks from the Well X HP zone with high and low k (Case C5 and C11) and the same Circ UB of 0.5 ppge. While the choke pressure, pressure at the shoe, and additional gain when the kick was stopped were shown in Table 6.6 for the same kick scenarios, here the choke and shoe pressures are shown ten minutes after the kick stoppage. The high increase in the choke pressure within ten minutes after the kick stoppage shows that gas is migrating in the annulus, which gradually elevates the surface and shoe pressures. Consequently, the pressure applied to the shoe may exceed what the shoe can tolerate. In those cases, the shoe pressure is shown in red. This data simply reveals that both responses increase the risk of lost returns, as the casing pressure builds up due to gas migration. There is also a significant complication in the determination of the formation PP or detection of an ongoing loss of returns after the well is shut-in when a NRV is used in the BHA because it prevents reading drill pipe pressure versus time. A NRV is a necessity for MPD operations that are statically underbalanced. These are the common disadvantages of responses ending in SI. Non-circulating responses also require a pump start up procedure to control the kick. This generally increases the NPT versus circulating responses. In addition, pump start ups and shut downs typically cause pressure fluctuations that can increase the risk of excessive pressures. A hard SI will also typically trap some pressure in the well, which relates to the NCR1, NCR3, and NCR5 cases as explained specifically for NCR3 in Chapter
127 The main disadvantage of the MPD pump SD W/ CFC and SI response (NCR2) is related to its application. It can be the worst initial response if it is applied to a known kick (shown on previous sections) because it will allow a large additional gain into the well and thus seriously complicate the well control operation. Table 6.7: Well X, applications of the best NCRs on 20 bbl kicks / 0.5 ppge Circ UB Data is reported 10 minutes after kick stoppage, (Data in red if P shoe > P FP ) Case Code Initial response Choke press (psi) Shoe press (psi) C5 NCR (high k) NCR C11 NCR (low k) NCR The Best Circulating Responses (CRs) The initial Circ responses (CRs) described in Chapter 5 include: Stepwise P c Incr (CR1), Incr P c to 80% of MAASP (CR2), Rapid P c Incr (CR3), and Stepwise Q in Incr (CR4). In this section, the results of simulating these responses are discussed. Fig shows the application of all of CRs, which were individually introduced by Figs. 5.6, 5.7, 5.8, and 5.9 on the 2 bbl kick scenario in Well X (high k, 0.5 ppge Circ UB). It was shown in Chapter 5 that all of the CRs successfully stopped the kick. Table 6.8 tabulates the results of these responses to one kick scenario, where data is given at the time that the kick is stopped. Table 6.8: Well X, applications of the CRs on 2 bbl kick / high k / 0.5 ppge Circ UB Data is reported at the kick stoppage Case Code Initial response Choke press (psi) Shoe press (psi) Addl gain (bbl) CR C14 CR CR CR

128 Fig. 6.12: Well X, application of the CRs on 2 bbl kick (high k, 0.5 ppge Circ UB) It is evident from Fig and Table 6.8 that CR2 stopped the kick faster than the others resulting in the least additional gain. However, as explained in , this was due to a large 114
129 pressure (670 psi) applied rapidly to the choke. Consequently, after the choke pressure was established, this response had the largest pressure applied to the surface casing and shoe, as well as at bottom (refer also to case C13 in Appendix C). Application of CR4 resulted in the least surface and shoe pressure because this response only utilizes the ECD to stop the kick. However, drill pipe pressure increased to a maximum of 5960 psi, which was the highest among all CRs. CR1 had a larger additional gain, compared to others, because the manual application of choke pressure was slower than for simulated automated responses, thus allowing a larger gain before it stopped the kick. Application of CR3 was successful and resulted in lower choke pressure than CR1 and CR2. The success of the CRs depend on parameters such as well design and kick detection limits, as explained in Section 5.1. For the example shown in Fig. 6.12, Well X has a 1.15 ppge kick margin at the shoe (at 190 GPM, refer to Table 4.2) and could tolerate a 2 bbl kick from the HP zone with the Circ UB of 0.5 ppge. With such a strong shoe, relative to the kick severity and the 2 bbl kick size, based on accurate kick detection equipment, the CRs all proved to be fast and efficient. A more severe kick scenario might challenge the effectiveness of the CRs. An example of the above discussion may be seen after the application of all CRs on a 20 bbl kick scenario in Well X (high k, 0.5 ppge Circ UB), shown in Fig The 20 bbl kick volume, when detected, was selected to represent kick detection with conventional equipment. In this plot, Q in, Q out and choke pressure versus time for the respective responses are shown. For CR2, the pressure equal to 80% of MAASP was insufficient to contain the well. Therefore, the well continued flowing, and Q out kept increasing, as marked by uncontrolled on the figure. Hence, this response was not successful for this case. For Stepwise Q in Incr, CR4, BHP data indicated that the kick was stopped (where the arrow is) by increased ECD in the open hole. Table 6.9 shows that shoe pressure at kick stoppage for CR4 is even less than pressure at the 115


130 shoe for the 2 bbl kick shown in Table 6.8 (same Circ UB). This is because of a more elevated ECD below the shoe. Kick stoppage confirmation became difficult for the Q out behavior due to the rapid expansion of gas in the annulus noted in Section Furthermore, the drill pipe pressure required to stop the kick for CR4 exceeded the capabilities of most drilling rigs. Consequently, CR4 was not conducted to be useful for this kick scenario. Fig. 6.13: Well X, application of the CRs on 20 bbl kick (high k, 0.5 ppge Circ UB) 116
131 The Rapid P c Incr (CR3) and the Stepwise P c Incr (CR1) methods stopped the kick effectively. The CR3 method stopped the kick faster. Table 6.9 shows that CR3 only allowed an additional 4.2 bbls of gain, while CR1 allowed an additional 17.9 bbls. The large gain resulted from the longer time required to implement this response. Consequently, it had a larger choke pressure than the rapid method, as seen in Table 6.9. This is opposite to what is seen for the pressure at the shoe. The BHP at the kick stoppage and the mud circulation rate are equal for both methods, and knowing that the wellbore is intact in DFD simulations, the lower shoe pressure for CR1 is due to less gas in the annulus below the shoe despite a larger kick volume in the well. The larger gas kick in the annulus for the CR1 method also presents increased potential risks at the surface. Therefore, the Rapid P c Incr method, CR3, was a more successful response for this kick scenario. It stopped the kick faster without breaking the shoe and resulted in lower choke pressure. Table 6.9: Well X, applications of the CRs on 20 bbl kick / high k / 0.5 ppge Circ UB Data is reported at the kick stoppage Case Code Initial response Choke press (psi) Shoe press (psi) Addl gain (bbl) CR C17 CR2 Uncontrolled Uncontrolled Uncontrolled CR CR The results of the 2 and 20 bbl kick examples from Tables 6.8 and 6.9 show that a 20 bbl kick resulted in significant additional choke pressure and additional gain. This is due to a larger loss of hydrostatic head for a 20 bbl kick in the slim wellbore of Well X compared to the 2 bbl kick. This difference is much smaller for the large wellbore of Well Z (Well Z Cases C38 and C41 in Appendix C). Consequently, the penalty for poor kick detection equipment is substantial for well control incidents in slim hole MPD operations. 117
132 A Circ UB of 1.2 ppge can create a kick severity that the design of Well X cannot tolerate. However, the simulation of such kicks can determine the effectiveness of the CRs for kick scenarios that were not planned, which often happens in real field applications. Additionally, an initial response that can stop such a kick successfully is important. Fig demonstrates an example of the application of CRs to a 20 bbl kick in Well X with high k and Circ UB of 1.2 ppge, which is the most severe kick scenario. The Q out for all CRs are plotted versus time. The tabulated results of the choke and the shoe pressure at the kick stoppage, as well as additional gain, are presented in Table The Incr P c to 80% of the MAASP method, CR2, was not enough to contain the formation pressure, and the well continued flowing. The response was not successful for this case. Neither was the Stepwise P c Incr method, CR1, effective for this kick. This was due to the slow manual increase in choke pressure to a kick with larger well deliverability. The jagged Q out profile was due to the application of 100 psi choke pressure increments. The stepwise increase of choke pressure was apparently slower than the loss of hydrostatic with a high influx rate, and thus the application of this response was not effective. The Rapid P c Incr method, CR3, however stopped the kick and only allowed 5.6 bbls of additional kick. The pressure applied at the shoe when the kick stopped for the CR3 method exceeded the casing shoe limits, shown in red color on Table This is a constraint in the design of Well X and does not undermine the general effectiveness of the CR3 method. The results do reinforce that different responses may be required for different well conditions. The Stepwise Q in Incr method, CR4, stopped this kick without pressure at the shoe that exceeded the fracture pressure. This is a general advantage of the CR4 method, in that it minimizes the risk of losing returns at the shoe versus all other responses investigated. On the other hand, the application of this response requires careful planning. As shown in Fig. 6.14, the 118

133 drill pipe pressure went far beyond what any rig pumps are currently rated for. Therefore, special BHA and/ or hydraulics designs are required for application of this response to be relied on in practice. In addition, it is difficult to confirm whether a kick was stopped due to the increasing rate of the Q out. This problem is a general weakness of this response, when applied to large kicks. Moreover, the mud-gas separator must also be capable of handling the high surface fluid rates. Fig. 6.14: Well X, application of the CRs on 20 bbl kick (high k, 1.2 ppge Circ UB) Table 6.10: Well X, applications of the CRs on 20 bbl kick / high k / 1.2 ppge Circ UB Data is reported at the kick stoppage, (Data in red if P shoe > P FP ) Case Code Initial response Choke press (psi) Shoe press (psi) Addl gain (bbl) CR1 Uncontrolled Uncontrolled Uncontrolled C18 CR2 Uncontrolled Uncontrolled Uncontrolled CR CR

134 The results of the simulations of all the CRs on Well Z, high k kick scenarios are tabulated in Table 6.11, which confirms the results observed from the Well X simulations. For the severe kick scenarios, the Incr P c to 80% of MAASP, CR2, was not effective. These cases are shown by Uncntrl in the table. The Rapid P c Incr method, CR3, stopped all the kicks and generally had the lowest choke and shoe pressure, as well as the smallest additional gain. The Stepwise P c Incr method, CR1, was slower and generally allowed additional gain into the well before it stopped the kicks. The Stepwise Q in Incr, CR4, was not functional for Well Z due to insignificant friction in such a large wellbore. Table 6.11: Well Z, applications of the all CRs on high k kick scenarios The Stepwise Q in Incr was also investigated for less severe Well Z kick scenarios. Fig illustrates an application of the Stepwise Q in Incr method to a 2 bbl kick from the HP zone of the Well Z (at 4500 ft) with high permeability and a formation pressure that provides a Circ UB of 0.5 ppge. Since the BHA and open hole clearance are large for Well Z, a significant increase in P AF cannot be achieved, and the ECD is practically the same as ESD. After taking 2 bbl of kick, it may be seen that ramping up the pump rate increases the Q out, while the BHP continues to drop. Consequently, the pit gain increases. This response was not successful for any of the Well Z kick scenarios, and therefore, no results are shown in Table
135 Summary of the Best Circulating Responses Based on the results of simulating the application of all CRs on high k kick cases, shown in the previous section and the more comprehensive data in Appendix C, two initial CRs have favorable applications, CR3 and CR4. The Stepwise P c Incr, CR1 is a less complex alternative to CR3 but is slower and less effective. Fig. 6.15: Well Z, application of Stepwise Q in Incr on 2 bbl kick / high k / 0.5 ppge Circ UB The Rapid P c Incr method, CR3, stopped all the kicks and generally allowed minimal additional kick into the well. The Stepwise Q in Incr method, CR4, was successful on low volume kicks in the Well X slimhole applications and imposed the least pressure at the shoe. Nevertheless, the application of CR4 has limitations, and hence requires careful pre-planning. No major differences were observed between the low k cases, compared to the high k cases in terms of best identified CRs. The pressures at the shoe and the choke, as well as additional gain, were comparatively lower for the low k cases, due to lower well deliverability. More simulation plots 121
136 and tables confirming the usefulness of the CR3 and CR4 initial circulating responses can be seen in Appendix C Advantages of the Best Circulating Responses There are several advantages in applying the CRs and specifically, the Rapid P c Incr method, CR3. The most important are the lower choke pressure and pressure applied to the casing shoe as compared to the best NCR; the SI response, NCR1. For a SI response, the choke pressure to stop a kick is always higher, because it must to be increased to offset the loss of ECD. This fact is not significant in the larger wellbore of Well Z. Additionally, CR3 is designd to be a rapid procedure. Therefore, its application in the simulations was relatively fast and effective and did not allow the well to be underbalanced for a long period. Consequently, this procedure generally resulted in a lower additional gain compared to the SI response. Application of the Stepwise Q in Incr response, CR4, on 2 bbl kicks in Well X also resulted in relatively rapid control. It is also used ECD rather than choke pressure to increase BHP. Accordingly, CR4 resulted in the least shoe pressure among all initial responses for all of the kick scenarios studied. Therefore, it can potentially minimize the risk of lost returns at casing shoe. Moreover, CR4 inherently had minimum choke pressure. The advantages mentioned for CR3 and CR4 versus NCR1 can be observed by comparing Tables 6.8 and 6.9 which display the results of the applications of the CRs to 2 and 20 bbl kicks with Table 6.6, which included the application of NCR1 to the same respective kick scenarios. Another benefit in applying CR3 or CR4 lies in their ability to proceed to the kick control and circulation operation directly, after stopping the kick. Therefore, pump shut downs and start ups, a routine part of a SI response and subsequent circulation, are unnecessary. Consequently, the application of CR3 or CR4 reduces the NPT and imposes less BHP fluctuations compared to a SI response. 122
137 Limitations or Disadvantages of the Best Circulating Responses There are common disadvantages or limitations to the application of the best circulating responses of CR3 and CR4. The most important limitation is that their application requires accurate Q out metering for comparing Q out with Q in. Also, the application of CR3 and CR4 imposes ECD throughout the response. Therefore, there is a higher risk of lost returns, especially for deep and slim wellbores such as Well X, if the HP zone is above a weak zone 91 (for example, drilling in lower, depleted sands in Fig. 4.2). For Well X cases studied in this research, where the HP zone is exactly on bottom while the weak zone is at shoe, the BHP for CR3 is generally higher than for the SI response, NCR1, which confirms this concern (see BHP 10 minutes after the kick stoppage in Appendix C for respective cases). There is no direct application to confirm kick stoppage for these methods. Therefore, an interpretation of Q out is required. This can create different complications pertinent to each response. For the CR3 method applied to low rate kicks (low k) or large gains, the interpretation of Q out can be difficult, as explained in Section 6.4. However, the method developed to confirm kick stoppage worked satisfactorily in the CR3 simulations. Nevertheless, its practicality should be explored in real field situations or full-scale laboratory well experiments. For the CR4 method however, no practical way was found to confirm the kick stoppage for large gains in Well X although BHP data confirmed the kick stoppage in those simulations where formation pressure is known. There are limitations specific to Rapid P c Incr method, CR3. Appendix C shows that the effective application of CR3 to all Well X and Z kick scenarios took an average of 2 to 3 minutes. Slower application of this response causes more gas influx and expansion in the annulus, which results in the interpretation of Q out being more difficult. Therefore, it should be 123

138 applied as fast as is practical, which may require automated choke operation. Moreover, the application of choke pressure to match Q out with Q in can create and mask lost returns 91. There are other limitations specific to the Stepwise Q in Incr method, CR4. For large holes like Well Z, it was seen that this response was not functional at all, due to insignificant P AF in the annulus. Therefore, the application of CR4 only accelerates the gas expansion in the annulus, which may rapidly develop into a surface blowout. Additionally, the rig equipment may not have the capability required for CR4. These limitations may include the pressure rating of the pump and surface piping, the maximum pump rate, and the maximum operational limits of the mud-gas separator The Results of the Best Alternative Initial Responses Four out of the nine initial responses evaluated were identified with relative advantages. These responses are: SI (NCR1) and MPD pump SD W/CFC and SI (NCR2) from noncirculating responses, and Rapid P c Incr (CR3) and Stepwise Q in Incr (CR4) from circulating responses. The rest of the studied initial responses show very specific and limited applications at best and consequently, are not considered generally applicable. The application of these best responses to the high permeability kick scenarios of Well X are tabulated in Table Table 6.12: Well X, application of the best initial responses on high k kick scenarios 124
139 The application of the MPD pump SD method of NCR2 is only recommended when the evidence of a kick is not conclusive. The largest additional gain and highest pressure applied to shoe results from using NCR2, when it is conclusive that a kick has been taken. Therefore, this response is only good for low rate or uncertain kicks. The SI response is simple, effective, and may be applied without specialized equipment. Neither NCR1 nor NCR2 require accurate Q out metering. However, if a weak zone is above the kick zone, like the Well X and Z cases in this research, these increase a risk of lost returns at the shoe. Table 6.12 shows that the NCR response causes higher pressure at the shoe and on the average, larger additional gains compared to CRs. Consequently, the application of NCR1 and NCR2 require a careful consideration of the well design, that provides an appropriate kick margin. The NCRs also generally increase NPT and BHP fluctuations. The rapidly increasing choke pressure method, CR3, stopped kicks and showed advantages in lowering choke and shoe pressure, as well as minimizing additional gain. Therefore, this response is advantageous when there are constraints in terms of well design margins. However, it requires accurate Q out metering, is most practical when using an automated drilling choke, and requires a special interpretation of Q out versus Q in for common size kicks. The stepwise increasing Q in method, CR4, showed the expected potential to minimize the pressure applied to the shoe. However, it cannot be a standard response due to several critical limitations. These include well geometry providing significant annulus friction pressure losses, surface equipment pressure ratings, and difficulty in interpreting kick stoppage. The application of CR4 also requires accurate Q out metering. An additional advantage of CR3 and CR4 responses is that they usually tend to reduce NPT and reduce BHP fluctuations. 125
140 6.6 Initial Response Plan for kicks Taken during the CBHP Method of MPD Operations The most applicable initial responses identified herein can be appropriate if conditions and constraints pertinent to their successful application are known and planned. Significant considerations are an availability of accurate Q out metering, the location of weak zones relative to a kick zone, the hole size and its implications for the practicality of a response, and the well design and surface equipment operational limits. These conditions should be considered and collectively satisfied for a practical response. Unfortunately, these conditions vary case by case, and hence, a single initial response that was generally the best was not realized. Yet four initial responses were identified with different advantages and limitations. Therefore, a general guideline was deemed necessary to help choose an initial response that can successfully stop an influx and minimize any associated risks. Careful planning is required in order to provide the conditions and equipment to ensure that a particular response is the best for a given set of well requirements. Fig summarizes the two key considerations for selecting an initial response into a graphical flow chart. The Stepwise Q in Incr method, CR4, is not considered a standard response due to its limitations but can be an alternative to the Rapid Pc Incr, CR3, response. It is not shown in the flow chart. If an increasing flow rate response, including the necessary equipment, has been designed for successful application, then it may replace the Rapid P c Incr method in the flow. A specific consideration when applying the flow chart occurs when accurate Q out metering is available, but an automated drilling choke is not. When an automated drilling choke is not available, manual application of Rapid P c Incr method, CR3, should be practiced by rig personnel prior to drilling the relevant hole interval, in order to assess its practicality. This approach has not been investigated, and its limitations are not known. A more detailed decision 126

141 tree for well control operations in the CBHP method of MPD has been developed by the LSU MPD research team. That decision tree, which considers well design in choosing a best initial response is not the focus of this research and is therefore not documented herein. Fig. 6.16: Plan of selecting an initial response to kicks taken during CBHP method of MPD 127
142 7. CONCLUSIONS AND RECOMMENDATIONS 7.1 Summary MPD is a set of new equipment and techniques which aims to reduce problems associated with and the cost of a drilling operation. MPD technology demonstrates a unique application in environments with narrow drilling margins where the drilling-related hazards are more pronounced. The CBHP method, as a variant of MPD, is where pressure at a certain downhole zone is maintained at a constant. A statically underbalanced mud weight is typically used. The downhole pressure is held almost constant at a small overbalance relative to the formation pressure by application of ECD and/or back pressure within a closed annulus. This is mainly to reduce hole problems and may also increase the ROP. In such a drilling environment with restricted kick margins, proper preparation for responding to kicks is important. The initial response to a kick is an immediate action taken to stop the formation fluid flow into the well. A SI response is the standard initial response to kicks taken in conventional drilling. In the closed annulus of the CBHP method however, there are alternative initial responses to stop an influx. The objective of this research was to identify and evaluate the best initial response to kicks as a basis for reliable well control procedures during MPD operations. Dynaflodrill TM, a multi-phase transient simulator, was used to study the application of the initial responses to kicks after a satisfactory validation of the software was performed. Gas kicks in water-based mud were selected as the most troublesome kick scenarios for a conservative approach. Kicks taken while drilling into the high pressure (HP) zone of two representative wells: the 6 hole interval of Well X, and the 17.5 hole interval of Well Z, were simulated. Initial pit gains of 2 bbl and 20 bbl were used to represent accurate and conventional kick detection limits for a sensitivity evaluation of a response to initial kick volume. Additionally, two different permeabilities and three different formation pore pressures were selected to provide a 128
143 broad range of kick severities. Having the casing shoe above the HP zones in both wells, as a typical weak zone in the annulus, allowed an investigation of potential risks imposed on the shoe, while each response focused on stopping a kick. Other criteria for evaluation of the initial responses included the ability to stop an influx while minimizing risks to surface equipment and the ability to minimize additional gains allowed into the well. These criteria helped to identify the most effective responses that caused the least risks. Nine initial responses to kicks were defined in two categories of responses: noncirculating responses (NCRs) and circulating responses (CRs), based on the mechanism each used to stop a kick. The NCRs included: Shut In (SI), MPD pump shut-down (SD) w/ choked flow check (CFC) and SI, MPD pump SD and SI, Automated MPD pump SD w/ CFC and SI, and Automated MPD pump SD and SI. The CRs, which required accurate flow rate-out (Q out ) metering to be applicable, were: Stepwise casing pressure (P c ) Increase, Increase P c to 80% of MAASP, Rapid P c Increase, and Stepwise Q in Increase. 7.2 Conclusions Four initial responses were identified as most applicable. Consequently, an initial response plan was developed, which was based on advantages, practicality, and the conditions required for these responses to be effective. The best initial responses with their associated advantages and limitations follow: 1. Shut-in (SI): SI is the most generally applicable response. The specific SI response investigated in this research included shutting down the mud pump followed by closing the choke as rapidly as possible. The advantages of this response are that: It stopped all the simulated kicks successfully. It is a very simple operational procedure, well known to the industry. It can be completed quickly, often resulting in minimal additional gain. 129
144 It allows determining the pressure required for the kick control operation with a simple interpretation of the shut-in casing pressure versus time. It does not require special equipment. It may be implemented using a rig BOP and choke for containment of higher surface pressure. It is the most apt response if the surface equipment fails 95 or if the appropriate conduct for the well control procedure is uncertain. It can minimize risk of lost returns at TD or any weak zones below the kick zone 91. The limitations and disadvantages associated with SI response are that: It can increase the risk of lost returns at casing shoe or any other weak points above the kick zone in the annulus. It requires pump start ups and shut downs that potentially increase bottomhole pressure fluctuations and usually add to the NPT. Due to gas migration, the choke and therefore annulus pressures keep increasing with time after a gas kick is taken in a water-based fluid. This carries a potential risk to well and surface equipment. Due to the nature of the hard shut-in associated with this response, extra pressure may be trapped in the well. 2. MPD pump SD W/ CFC and SI: This NCR has limited, but useful applications. It includes a MPD stepwise pump SD schedule, which ends by holding the choke pressure constant for a short period as a choked flow check or CFC, followed by shutting in the well. If the formation is flowing, then the choke pressure can only be kept constant during the CFC by bleeding pressure through the choke. A choke pressure buildup above the scheduled choke 130
145 pressure when the well is shut in after bleeding will also confirm the kick. The main advantages with this response are: It allows an opportunity for a flow check for uncertain or low rate kicks. Therefore, it can be used as a precaution or on connections for a flow check. Like the SI response, it can minimize risk of lost returns at TD or at any weak zones below the kick zone. Like the SI response, it determines the pressure required for the kick control operation. There are limitations and disadvantages associated with this response are: Like the SI response, it can increase the risk of lost returns at casing shoe or any other weak points above the kick zone in the annulus. It can result in very large gains that seriously complicate the well control operation if applied to a known or high rate kick. 3. Rapid P c Increase: This is the most applicable of the circulating responses. This response, which was applied manually during the simulations, is intended to represent a proprietary automated response. At a constant mud pumping rate, the choke is closed rapidly until Q out approaches Q in, then smaller manipulations are attempted to match Q out to Q in. The main advantages with this response are: It was effective over all kick scenarios. It generally resulted in a lower choke pressure and pressure at the shoe than both noncirculating responses and than the other circulating responses that used increased casing pressure. Therefore, it has a lower risk of lost returns at shoe than those responses, including SI. It generally allowed less additional gain into the well. 131
146 Conceptually, it is a relatively simple operational procedure. No pump shut downs or start ups are required. Therefore, it imposes minimal bottomhole pressure fluctuations. After successful application of this initial response, it can continue as a kick control operation. Hence, it reduces non-productive time (NPT) versus a SI response. There are limitations and disadvantages associated with this response, which are: This response requires accurate Q out metering in order to assess whether formation flow has been stopped. Even with accurate Q out metering, it requires an interpretation to confirm kick stoppage. The presumed method of matching Q out to Q in may be difficult, especially for low rate kicks or large gas influxes. A new approach, described herein, of bumping the choke twice to evaluate the trend of Q out versus time showed practical advantages for this purpose. This approach, however, was not quantified in this research. It was effective when applied rather quickly, within 2 to 3 minutes. Therefore, the real application of this response requires an automated choke system or personnel who have successfully practiced applying it. If the wellbore is not intact, the matching of Q out to Q in by control of choke pressure can mask lost returns 91. It increases the chance of lost returns at TD or into any weak zones below the kick zone Stepwise Q in Increase: This CR has special, but limited applications. At a constant choke pressure, the pump rate is increased in stepwise fashion to raise the Q in, and raise the ECD in the well, to match with Q out. The main advantages with this response, include: 132
147 This response applied the minimum pressure at shoe and hence it can reduce the risk of lost returns at casing shoe. There are serious limitations and disadvantages associated with this response, including: It does not apply to wells with low annular frictional pressure losses, e.g. large hole sizes. It requires accurate Q out metering. It requires interpretation to confirm kick stoppage. This interpretation was not possible for large gas kicks, as gas expansion in the annulus is rapidly accelerated by the increased pumping rate. This combination of interpretation difficulty and increased gas expansion can lead quickly to having a surface blowout. The Q in and/or pump pressure required to stop a kick may be higher than possible with the available pumps. The resulting high surface flow rates can also exceed the mud-gas separator capabilities. This response causes the greatest likelihood of lost returns if there are any weak zones below the kick zone 91. Based on a large number of simulations of initial responses to a variety of kicks and different sensitivities, a single best initial response to all kind of kicks during the CBHP method of MPD operations was not identified. Multiple factors impose limitations on which response will be most successful, including accurate Q out metering, well design aspects, location of a weak zone relative to the kick zone, hole size, and surface equipment ratings. Therefore, proper planning and implementation are necessary for an effective initial response. 7.3 Recommendations Based on the results of this research, the following are recommendations for future work. 133
148 1. The choked flow check was simulated using a choke pressure input which corresponded to automated application. It should also be attempted using a manual choke to evaluate its practicality (done by Jose Chirinos on actual well). 2. The realistic feasibility of bumping the choke to confirm the kick stoppage, during the Rapid P c Increase method, should be checked on field or full-scale test wells to confirm the simulation results. A quantitative approach to examining the trend of flow rate out after a gas kick is stopped may be feasible by means of computer aided programs. In that case, one proposal may be to develop a model based on specific well geometry, reservoir conditions and kick volume to predict a steady-state flow rate out trend due to gas expansion in the annulus. This trend could actually be compared to the flow rate-out response during the choke bumping steps discussed in this research. 3. The Rapid P c Increase response was simulated in DFD using the choke opening; however, the results showed a faster choke response, possibly due to the simulator model. A manual application of this response in a full-scale test facility might evaluate how fast the task can be completed based on real well response. This would be valuable when an automated choke is not available. 4. Since the simulation of only intact wellbores was possible in DFD, the results of best initial responses should be investigated for cases where borehole fracture occurred to evaluate their sensitivity to a broken wellbore. 5. The demonstration of the best initial responses should be conducted at a full-scale test facility to examine the practicality of the responses. 6. A method should be developed to estimate the kick zone pore pressure during the application of circulating responses. 134
149 7. A kick circulation study should be conducted as a complement to this study. It should include the application of any current methods, such as the drillers method, after the successful application of an initial response to a kick. The study should aim to evaluate whether the best initial responses would pose any unidentified risks to the well, during or after the circulation work. 8. It would also be valuable to study the effect of equipment problems, such as drillstring or choke washouts, plugged bit or choke on kick responses and circulation. 9. An evaluation of the proposed Implied Pit Gain 103 method as a basis for identifying lost returns and/or underground blowouts following a kick during MPD operations is recommended. Simulation-based study to evaluate this possibility should be conducted. 135
150 REFERENCES 1. Dodson, J.K.: 2004 Survey of Problem Incidents GOM Shelf Gas Wells, Dodson Company, Hannegan, D.M.: Managed Pressure Drilling in Marine Environments Case Studies, SPE/IADC presented at the SPE/IADC Drilling Conference, Amsterdam, The Netherlands, February, Miller, R.A., Payne, M.L. and Erpelding, P.: Designer Casing for Deepwater HPHT Wells, SPE presented at the SPE Applied Technology Workshop on HP/HT Sour Well Design, Woodlands, May, Bourgoyne, A.T., Chenevert, M.E., Millheim, K.K. and Young, F.S.: Applied Drilling Engineering, SPE Text Book Series, Vol. 2, Richardson, TX, Well Control Manual, Petroleum Engineering Research and Technology Transfer Laboratory, Louisiana State University, undated. 6. Malloy, K.P.: A Probabilistic Approach to Risk Assessment of Managed Pressure Drilling in Offshore Applications, Minerals Management Service Joint Industry Project (DEA155), 31 October, Malloy, K.P.: Managed Pressure Drilling- What is it anyway?, World Oil, P , March Malloy, K.P., Stone, C.R., Medley, G.H., Hannegan, D., Coker, O., Reitsma, D., Santos, H., Kinder, J., Eck-Olsen, J., McCaskill, J., May, J., Smith, K., Sonneman, P.: Managed- Pressure Drilling: What It Is and What It Is Not, SPE/IADC presented at the Managed Pressure Drilling and Underbalanced Operations Conference and Exhibition, San Antonio, Texas, February, Frink, P.J.: MPD Presentation to LSU, a presentation to the petroleum engineering graduate students at LSU, 8 November, Duhe, J.: Managed Pressure Drilling, a presentation to the AADE LSU chapter, 25 March, Finley, D., Shayeghi, S., Ansah, J. and Gil, I.: Reservoir Knowledge and Drilling Benefits Comparison for Underbalanced and Managed Pressure Drilling Operations, SPE/IADC presented at the SPE/IADC Drilling Technology Conference and Exhibition, Mumbai, India, October,
151 12. Finley, D., Ansah, J., Gil, I., Lovorn, R. and Shayeghi, S.: Comparisons of Reservoir Knowledge, Drilling Benefits, and Economic Advantages for Underbalanced and Managed-Pressure Drilling, SPE/IADC presented at the SPE/IADC Managed Pressure Drilling and Underbalanced Operations Conference and Exhibition, Galveston, Texas, March, IADC UBO / MPD committee Website, Retrieved March 2009, from Spriggs, P. and Frink, P.J.: MPD Planning: How Much is Enough?, SPE/IADC presented at the SPE/IADC Managed Pressure Drilling and Underbalanced Operations Conference and Exhibition, Abu Dhabi, U.A.E., January, Nauduri, S., Medley, G.H. and Schubert, J.J.: MPD: Beyond Narrow Pressure Windows, SPE/IADC presented at the SPE/IADC Managed Pressure Drilling and Underbalanced Operations Conference and Exhibition, San Antonio, Texas, February, Hannegan, D.M.: SPE Distinguished Lecturer Series on Managed Pressure Drilling, SPE DL. 17. LSU MPD Consortium Well Control project description, July Hannegan, D., Todd, R.J., Pritchard, D.M. and Jonasson, B.: MPD Uniquely Applicable to Methane Hydrate Drilling, SPE/IADC presented at the SPE/IADC Underbalanced Technology Conference and Exhibition, Houston, Texas, October, Hannegan, D. and Fisher, K.: Managed Pressure Drilling in Marine Environments, IPTC presented at the International Petroleum Technology Conference, Doha, Qatar, November, Hannegan, D.: Case Studies Offshore Managed Pressure Drilling, SPE , presented at the SPE Annual Technical Conference and Exhibition, San Antonio, Texas, September, Villatoro, J., Boutalbi, S., Schmigel, K., Qutob, H., Van Galen, M. and Lakshminarayanan, S.: Controlled Pressure Drilling (CPD) Candidate Screening Methodology, SPE presented at the SPE Middle East Oil & Gas Show and Conference, Kingdom of Bahrain, March, Grayson, B.: Precise Management of Downhole Pressure Enhances Safety and Enables Access of Challenging Offshore Reserves, SPE presented at the SPE Middle East Oil & Gas Show and Conference, Kingdom of Bahrain, March,
152 23. Grayson, B.: Increased Operational Safety and Efficiency with Managed Pressure Drilling, SPE presented at the SPE American E & P Environmental & Safety Conference, San Antonio, Texas, March, Ramalho, J.: Underbalanced Drilling in the Reservoir, An Integrated Technology Approach, SPE presented at the SPE Oil and Gas Technical Conference and Exhibition, Moscow, Russia, 3-6 October, Kozicz, J.R., Juran, T.L. and de Boer, L.: Integrating Emerging Drilling Methods From Floating Drilling Rigs Enabling Drilling Solutions for the Future, SPE/IADC presented at the SPE/IADC Drilling Conference, Miami, Florida, February, Kozicz, J.: Managed Pressure Drilling Recent Experience, Potential Efficiency Gains, and Future Opportunities, SPE/IADC presented at the SPE/IADC Asia Pacific Drilling Technology Conference and Exhibition, Bangkok, Thailand, November, Kozicz, J.: Innovation, Who Pays Making the Economic Case for Adopting New Technologies, SPE/IADC presented at the SPE/IADC Middle East Drilling Technology Conference and Exhibition, Cairo, Egypt, October, Stone, C.R., Durkee, T., Kozicz, J. and Smith, K.: What is the Future Direction of MPD, a presentation to the SPE/IADC Managed Pressure Drilling and Underbalanced Operations Conference and Exhibition, San Antonio, Texas, February, Nas, S., Toralde, J.S. and Wuest, C.: Offshore Managed Pressure Drilling Experiences in Asia pacific, SPE/IADC presented at the SPE/IADC Drilling Conference and Exhibition, Amsterdam, The Netherlands, March, Cantu, J.A., May, J. and Shelton, J.: Using Rotating Control Devices Safely in Today s Managed Pressure and Underbalanced Drilling Operations, SPE/IADC presented at the SPE/IADC Underbalanced Technology Conference and Exhibition, Houston, Texas, October, Hannegan, D., Bailey, T. and Chambers, J.: Subsea Rotating Control Head Shop Testing A key Step to Assure Subsea Reliability, SPE/IADC presented at the SPE/IADC Asia Pacific Drilling Technology Conference and Exhibition, Kuala Lumpur, Malaysia, November, Wade M.: Coriolis Technology Is Elegant, Tough New Signal-Processing Techniques Conquer Two-Phase Flow Barrier, International Society of Automation, Retrieved April 2009, from nagement/contentdisplay.cfm&contentid=
153 33. EMERSON Process Management: Micro Motion, 2-Wire Coriolis Flow & Density Technology, Product Data Sheet Retrieved April 2009, from Demirdal, B., Miska, S., Takach, N. and Cunha, J.C.: Drilling Fluids Rheological and Volumetric Characterization under Downhole Conditions, SPE , presented at the SPE Latin America and Caribbean Petroleum Engineering Conference, Buenos Aires, Argentina, April, Demirdal, B. and Cunha, J.C.: Olefin Based Synthetic Drilling Fluids Volumetric Behavior under Downhole Conditions, SPE , presented at the SPE Rocky Mountain Oil & Gas Technology Symposium, Denver, Colorado, April, Gravdal, J.E., Lorentzen, R.J., Fjelde, K.K. and Vefring, E.H.: Tuning of Computer Model Parameters in Managed Pressure Drilling Applications Using an Unscented Kalman Filter Technique, SPE presented at the SPE Annual Technical Conference and Exhibition, Dallas, Texas, 9-12 October, Petersen, J., Bjorkevoll, K.S. and Rommetveit, R.: Dynamic Pre-Modeling of MPD Operations Enabled Optimal Procedures and Operations, SPE/IADC presented at the SPE/IADC Asia Pacific Drilling Technology Conference and Exhibition, Jakarta, Indonesia, August, Bjorkevoll, K.S., Rommetveit, R., Ronneberg, A. and Larsen, B.: Successful Field Use of Advanced Dynamic Models, SPE/IADC presented at the SPE/IADC Drilling Conference, Miami, Florida, February, Iversen, F., Gravdal, J.E., Dvergsnes, E.W., Nygaard, G., Gjeraldstveit, H., Carlsen, L.A., Low, E., Munro, C. and Torvund, S.: Feasibility Study of Managed Pressure Drilling With Automatic Choke Control in Depleted HP/HT Field, SPE presented at the SPE Annual Technical Conference and Exhibition, San Antonio, Texas, September, Godhavn, J.M.: Control Requirements for High-End Automatic MPD Operations, SPE/IADC presented at the SPE/IADC Drilling Conference and Exhibition, Amsterdam, The Netherlands, March, Bansal, R.K., Brunnert, D., Todd, R., Bern, P.A., Baker, R.V. and Richard, C.: Demonstrating Managed Pressure Drilling with the ECD Reduction Tool, SPE/IADC presented at the SPE/IADC Drilling Conference, Amsterdam, The Netherlands, February, Tian, S., Medley, G. and Stone, C.R.: Parametric Analysis of MPD Hydraulics, SPE/IADC presented at the SPE/IADC Managed Pressure Drilling and 139
154 Underbalanced Operations Conference and Exhibition, Galveston, Texas, March, Nygaard, G.H., Johannessen, E., Gravdal, J.E. and Iversen, F.: Automatic Coordinated Control of Pump Rates and Choke Valve for Compensating Pressure Fluctuations during Surge and Swab Operations, SPE/IADC presented at the SPE/IADC Managed Pressure Drilling and Underbalanced Operations Conference and Exhibition, Galveston, Texas, March, Rasmussen, O.S. and Sangesland, S.: Evaluation of MPD Methods for Compensation of Surge-and-Swab Pressures in Floating Drilling Operations, SPE/IADC presented at the SPE/IADC Managed Pressure Drilling and Underbalanced Operations Conference and Exhibition, Galveston, Texas, March, Tian, S., Medley, G. and Stone, C.R.: Tripping Operations of Managed Pressure Drilling, a presentation to the SPE/IADC Managed Pressure Drilling and Underbalanced Operations Conference and Exhibition, San Antonio, Texas, February, Ronaes, E., Prebensen, O.L., Mikalsen, R., Taugbol, K., Syltoy, S. and Torvund, S.: An Innovative Fluid Pressure Transmission Pill Successfully Used during Managed Pressure Drilling Operations in an HPHT Environment, SPE/IADC presented at the SPE/IADC Drilling Conference, Orlando, Florida, 4-6 March, Stone, C.R. and Tian, S.: Sometimes Neglected Hydraulic Parameters of Underbalanced and Managed Pressure Drilling, SPE/IADC presented at the SPE/IADC Managed Pressure Drilling and Underbalanced Operations Conference and Exhibition, Abu Dhabi, U.A.E., January, Medley, G.H., Moore, D. and Nauduri, S.: Simplifying MPD: Lessons Learned, SPE/IADC presented at the SPE/IADC Managed Pressure Drilling and Underbalanced Operations Conference and Exhibition, Abu Dhabi, U.A.E., January, Arnone, M. and Vieira, P.: Drilling Wells With Narrow Operating Windows Applying the MPD Constant Bottom Hole Pressure Technology How Much the Temperature and Pressure Affects the Operation s Design, SPE/IADC presented at the SPE/IADC Drilling Conference and Exhibition, Amsterdam, The Netherlands, March, Santos, H., Leuchtenberg, C. and Shayegi, S.: Micro-Flux Control: The Next Generation in Drilling Process, SPE presented at the SPE Latin American and Caribbean Petroleum Engineering Conference, Port of Spain, Trinidad, April, Santos, H., Reid, P., Jones, J. and McCaskill, J.: Developing the Micro-Flux Control Method Part1: System Development, Field Test Preparation, and Results, SPE/IADC 140
155 97025 presented at the SPE/IADC Middle East Drilling Technology Conference and Exhibition, Dubai, U.A.E., September, Santos, H., Reid, P., McCaskill, J., Kinder, J. and Kozicz, J.: Deepwater Drilling Made More Efficient and Cost-Effective Using the Microflux Control Method and an Ultralow Invasion Fluid to Open the Mud-Weight Window, SPE /OTC presented at the Offshore Technology Conference, Houston, Texas, 1-4 May, Santos, H., Catak, E., Kinder, J., Franco, E., Lage, A. and Sonnemann, P.: First Field Applications of Microflux Control Show Very Positive Surprises, SPE/IADC presented at the SPE/IADC Managed Pressure Drilling and Underbalanced Operations Conference and Exhibition, Galveston, Texas, March, Santos, H., Perez Tellez, C., Lupo, C., Colleta, C., Duno, H., Sanchez, H., Giral, L. and Gomez, G.: Micro-Flux Control Provides Drilling Optimization and Risk Reduction onshore, in Mexic, a presentation to the SPE/IADC Managed Pressure Drilling and Underbalanced Operations Conference and Exhibition, San Antonio, Texas, February, Van Riet, E.J., Reitsma, D. and Vandercraen, B.: Development and Testing of a Fully Automated System to Accurately Control Downhole Pressure during Drilling Operations, SPE/IADC presented at the SPE/IADC Middle East Drilling Technology Conference and Exhibition, Abu Dhabi, U.A.E., October, Reitsma, D. and van Riet, E.: Utilizing an Automated Annular Pressure Control System for Managed Pressure Drilling in Mature Offshore Oilfields, SPE presented at Offshore Europe, Aberdeen, Scotland, 6-9 September, Reitsma, D.: Development and Application of Combining a Real-Time Hydraulics Model and Automated Choke to Maintain a Relatively Constant Bottomhole Pressure While Drilling, IPTC presented at the International Petroleum Technology Conference, Doha, Qatar, November, Roes, V., Reitsma, D., Smith, L., McCaskill, J. and Hefren, F.: First Deepwater Application of Dynamic Annular Pressure Control Succeeds, SPE/IADC presented at the SPE/IADC Drilling Conference, Miami, Florida, February, Laird, A., McFadzean, K., Edgar, J. and Harty, I.: Offshore Implementation of Through- Tubing Dynamic Annulus Pressure Controlled (DAPC) Coiled-Tubing Drilling, SPE presented at Offshore Europe, Aberdeen, Scotland, 6-9 September, Taggart, M. and King, J.A.: Challenges in Planning, Installation and Operation of Coiled-Tubing Drilling Equipment on a North Sea Platform, SPE presented at 141
156 the SPE/ICoTA Coiled Tubing and Well Intervention Conference and Exhibition, Woodlands, Texas, 4-5 April, Geddes, M., Deady, A., Speagell, M. and Fernandez, R.: Real-Time Onshore Control Center Enables Offshore Personnel Reduction in Coiled-Tubing Managed Pressure Drilling Operation, SPE/IADC presented at the SPE/IADC Managed Pressure Drilling and Underbalanced Operations Conference and Exhibition, Galveston, Texas, March, Chustz, M.J., May, J., Wallace, C., Reitsma, D., Fredericks, P., Dickinson, S. and Smith, L.D.: Managed Pressure Drilling with Dynamic Annular Pressure Control System Proves Successful in Redevelopment Program on Auger TLP in Deepwater Gulf of Mexico, SPE/IADC presented at the SPE/IADC Managed Pressure Drilling and Underbalanced Operations Conference and Exhibition, Galveston, Texas, March, Chustz, M.J., Smith, L.D. and Dell, D.: Managed Pressure Drilling Success Continues on Auger TLP, SPE/IADC presented at the SPE/IADC Drilling Conference, Orlando, Florida, 4-6 March, Fredericks, P., Reitsma, D., Runggai, T., Hudson, N., Zaeper, R., Backhaus, O. and Hernandez, M.: Successful Implementation of First Closed Loop, Multiservice Control System for Automated Pressure Management in a Shallow Gas Well Offshore Myanmar, SPE/IADC presented at the SPE/IADC Drilling Conference, Orlando, Florida, 4-6 March, Vogelsberg, P., Fredericks, P., Sehsah, O. and Reitsma, D.: Development and Deployment of an MPD System Optimized for Onshore Fields with Uncertain Pressure Environments, a presentation to the SPE/IADC Managed Pressure Drilling and Underbalanced Operations Conference and Exhibition, San Antonio, Texas, February, Reitsma, D., phone discussion, 18 March, Jenner, J.W., Elkins, H.L., Springett, F., Lurie, P.G. and Wellings, J.S.: The Continuous Circulation System: An Advanced in Constant Pressure Drilling, SPE presented at the SPE Annual Technical Conference and Exhibition, Houston, Texas, September, Calderoni, A., Brugman, J.D., Vogel, R.E. and Jenner, J.W.: The Continuous Circulation System: From Prototype to Commercial Tool, SPE presented at the SPE Annual Technical Conference and Exhibition, San Antonio, Texas, September,
157 69. Vogel, R. and Brugman, J.: Continuous Circulating System adds efficiency in drilling difficult/hpht wells, World Oil, P , March Calderoni, A., Chiura, A., Valente, P., Soliman, F., Squintani, E.,Vogel, R.E. and Jenner, J.W.: The Continuous Circulation System: From Prototype to Commercial Tool, SPE presented at the SPE Annual Technical Conference and Exhibition, San Antonio, Texas, September, Calderoni, A., Girola, G., Maestrami, M., Santos, H. and Holt, C.: Micro-Flux Control and E-CD Continuous Circulation Valves Allow Operator to Reach HPHT Reservoirs for the First Time, SPE/IADC presented at the SPE/IADC Managed Pressure Drilling and Underbalanced Operations Conference and Exhibition, San Antonio, Texas, February, Kadaster, A.G., Millheim, K.K. and Thompson, T.W.: The Planning and Drilling of Hot Ice #1 Gas Hydrate Exploration Well in the Alaskan Arctic, SPE/IADC presented at the SPE/IADC Drilling Conference, Amsterdam, The Netherlands, February, Saponja, J., Adeleye, A. and Hucik, B.: Managed Pressure Drilling (MPD) Field Trials Demonstrate Technology Value, SPE/IADC presented at the SPE/IADC Drilling Conference, Miami, Florida, February, Vieira, P., Arnone, M., Russel, B., Cook, I., Moyse, K., Torres, F., Qutob, H., Yuesheng, C. and Qing, C.: Constant Bottomhole Pressure: Managed Pressure Drilling Technique Applied in an Exploratory Well in Saudi Arabia, SPE/IADC presented at the SPE/IADC Managed Pressure Drilling and Underbalanced Operations Conference and Exhibition, Abu Dhabi, U.A.E., January, Tellez, C.P., Duno, H., Casanova, O., Colombine, W., Lupo, C., Palacios, J.R. and Medina, L.: Successful Application of MPD Technique in a HP/HT Well Focused on Performance Drilling in Southern Mexico Deep Fractured Carbonates Reservoirs, SPE/IADC presented at the SPE/IADC Managed Pressure Drilling and Underbalanced Operations Conference and Exhibition, San Antonio, Texas, February, Solvang, S.A., Leuchtenberg, C., Gil, I.C. and Pinkstone, H.: Managed Pressure Drilling Resolves Pressure Depletion Related Problems in the Development of the HPHT Kristin Field, SPE/IADC presented at the SPE/IADC Managed Pressure Drilling and Underbalanced Operations Conference and Exhibition, Abu Dhabi, U.A.E., January, Syltoy, S., Eide, S.E., Torvund, S., Berg, P.C., Larsen, T., Fjeldberg, H., Bjorkevoll, K.S., McCaskill, J., Prebensen, O.L. and Low, E.: Highly Advanced Multitechnical 143
158 MPD Concept Extends Achievable HPHT Targets in the North Sea, SPE/IADC presented at the SPE/IADC Managed Pressure Drilling and Underbalanced Operations Conference and Exhibition, Abu Dhabi, U.A.E., January, Bjorkevoll, K.S., Molde, D.O., Rommetveit, R. and Syltoy, S.: MPD Operation Solved Drilling Challenges in a Severely Depleted HP/HT Reservoir, SPE/IADC presented at the SPE/IADC Drilling Conference, Orlando, Florida, 4-6 March, Schubert, J.J., Juvkam-Wold, H.C. and Choe, J.: Well-Control Procedures for Dual- Gradient Drilling as Compared to Conventional Riser Drilling, SPE 99029, 24 June Carlsen, L.A., Nygaard, G., Gravdal, J.E., Nikolaou, M. and Schubert, J.: Performing the Dynamic Shut-In Procedure Because of a Kick Incident When Using Automatic Coordinated Control of Pump Rates and Choke-Valve Opening, SPE/IADC presented at the SPE/IADC Managed Pressure Drilling and Underbalanced Operations Conference and Exhibition, Abu Dhabi, U.A.E., January, Soto, R., Malave, J., Medina, M. and Diaz, C.: Managed Pressure Drilling (MPD): Planning a Solution for San Joaquin Field, Venezuela, SPE/IADC presented at the SPE/IADC Drilling Conference, Miami, Florida, February, Beltran, J.C., Gabaldon, O., Puerto, G., Alvarado, P. and Varon, V.: Case Studies Proactive Managed Pressure Drilling and Underbalanced Drilling Application in San Joaquin Wells, Venezuela, SPE , presented at the SPE Annual Technical Conference and Exhibition, San Antonio, Texas, September, Miller, A., Boyce, G., Moheno, L., Arellano, J., Murillo, J., de la Serna, M.A.A., Lopez, A.U. and Corona, A.M.: Innovative MPD Techniques Improve Drilling Success in Mexico, SPE presented at the International Oil Conference and Exhibition, Cancun, Mexico, 31 August - 2 September, Shen, C., Niu, X., Nas, S. and Holt, C.: Managed Pressure Drilling Reduces China Hard- Rock Drilling by Half, SPE/IADC presented at the SPE/IADC Drilling Conference, Amsterdam, The Netherlands, February, Foster, J.K. and Steiner, A.: The Use of MPD and an Unweighted Fluid System for Drilling ROP Improvement, SPE/IADC presented at the SPE/IADC Managed Pressure Drilling and Underbalanced Operations Conference and Exhibition, Galveston, Texas, March, Dietrich, E., Denton, S., Cadena, J., Ortiz, R. and Ohanian, M.: Coiled Tubing MPD for Tight Gas Field Re-Entry Work, SPE/IADC presented at the SPE/IADC 144
159 Managed Pressure Drilling and Underbalanced Operations Conference and Exhibition, San Antonio, Texas, February, Hernandez, J., Perez Tellez, C., Lupo, C., Scarcelli, D., Salinas, N., Bedino, H., Gallo, F. and Sehsah, O.: Successful Application of Automated Choke MPD System to Prevent Salt Kicks While Drilling in a High-Pressure Tertiary Salt Diapir With OBM in Southern Mexico, SPE/IADC presented at the SPE/IADC Managed Pressure Drilling and Underbalanced Operations Conference and Exhibition, San Antonio, Texas, February, Dharma, N. and Toralde, J.S.S.: Managed Pressure Drilling and Downhole Isolation Technologies Deliver High Rates Gas Wells, SPE/IADC presented at the SPE/IADC Managed Pressure Drilling and Underbalanced Operations Conference and Exhibition, Abu Dhabi, U.A.E., January, Niznik, M.R., Elks Jr., W.C. and Zeilinger, C.: Pressurized Mud Cap Drilling in Qatar s North Field, SPE/IADC presented at the SPE/IADC Managed Pressure Drilling and Underbalanced Operations Conference and Exhibition, San Antonio, Texas, February, Notices to Lessees and Operators in the Gulf of Mexico OCS Region for Managed Pressure Drilling Projects, Minerals Management Service, NTL 2008-G07, 15 June, 2008, Retrieved from Das, A.K.: Simulation Study Evaluating Alternative Initial Responses to Formation Fluid Influx During Managed Pressure Drilling, a MS thesis submitted to Louisiana State University, May Das, A.K., Smith, J.R. and Frink, P.J.: Simulations Comparing Different Initial Responses to Kicks taken During Managed Pressure Drilling, SPE/IADC presented at the SPE/IADC Drilling Conference, Orlando, Florida, 4-6 March, Abdul Mujeer, S., Boyce, G.R. and Davis, P.: Choice of Hydraulics Flow Model: A Step Towards a Successful High-Pressure MPD Operation in Offshore India, SPE/IADC presented at the SPE/IADC Managed Pressure Drilling and Underbalanced Operations Conference and Exhibition, San Antonio, Texas, February, Rommetveit, R. and V.M. Lage, A.C.: Designing Underbalanced and Lightweight Drilling Operations; Recent Technology Developments and Field Applications, SPE presented at the SPE Latin America and Caribbean Petroleum Engineering Conference, Buenos Aires, Argentina, March,
160 95. Guner, H.: Simulation Study of Emerging Well Control Methods for Influxes Caused by Bottomhole Pressure Fluctuations during Managed Pressure Drilling, a MS thesis submitted to Louisiana State University, December Scanpower Petroleum Technology (SPT) Group s website, looked in October Dynaflodrill TM Training Manuals, Scandpower Petroleum Technology group, Norway, undated. 98. American Petroleum Institute (API), RCD and Choke standard specifications (16 RCD and 16C), Amoco Production Company: Field Analysis of Well Control in a Vertical Well, project DEA#7, July LSU MPD consortium presentation, January Patel, B.: A study of real gas expansion in the annulus versus Dynaflodrill TM predictions, a memo to LSU MPD consortium members, April Langlinais, J.: Well Design Production, Craft and Hawkins department of petroleum engineering text book, Baton Rouge, undated Bourgoyne, D.A., Barbato, T., Smith, J.R. and McGaugh, M.: Implied Pit Gain; A Tool for Detecting Complications during Well Control Operations, a presentation to the IADC Well Control Conference of Americas, Galveston, Texas, August,
161 APPENDIX A: WELL X SIMULATIONS INPUT DATA Case Description Project: Alternative initial responses to gas kicks during MPD operations Data description: Simulation inputs for no kick case (Base) with high permeability Well: X Well section: 6 in. Software: Drillbench (Dynaflodrill module) Company: SPT (Scandpower Petroleum Technology) Group Creator: Majid Davoudi Date: 01-Aug-2009 Survey Md Inclination Azimuth Vertical depth [ft] [deg] [deg] [ft]
162 Wellbore Geometry Name Hanger Setting Inner Outer depth depth diameter diameter [ft] [ft] [in] [in] 7" T lbs/ft Target depth (ft): Open hole length (ft): Open hole diameter (in): 6.00 String Component Type Section Inner Outer length diameter diameter [ft] [in] [in] DC 4 3/4" NC DrillCollar HWDP 3 1/2" NC38(3 1/2 IF) Drillpipe dp 3 1/2" S lb/ft Drillpipe
163 Average stand length (ft): Bit outer diameter (in): 6.00 Flow area (sq in): 0.37 Number of bit nozzles: 4 Nozzles diameter (1/32 in): 11 Choke Inner diameter (in): 3.00 Closure time (min): 0.50 Choke control: Opening Working pressure (psi): Mud Type: Water Based Mud (WBM) Base oil density (ppg): Water density (ppg): Solids density (ppg): Density (ppg): Reference temperature (deg F): Fluid type: Liquid Oil water ratio: 0 / 100 Rheology type: Non-Newtonian; Fann tables PVT model: Black oil Fann Reading Shear Shear rate stress [rpm] [lbf/100ft2] Reservoir Name Top Bottom Type Press Temp Porosity Perm Fluid [ft] [ft] [psi] [degf] [0-1] [md] Form Matrix Gas HP Sand Matrix Gas Flow model Reservoir model Reservoir model Hole cleaning criterion: Max concentration Cuttings density (ppg): 0.1 Max concentration:
164 Water Density (ppg) Compressibility (1/psi) 7.58 E-08 Volume factor 1.00 Viscosity (cp) 1.00 Oil Density (ppg) Compressibility (1/psi) 1.38 E-06 Volume factor 1.10 Viscosity (cp) 2.00 Gas Density (SG) 0.65 N CO Hydrocarbon 1.00 H2S 0.00 Temperature Drillstring Temperature Depth [ft] [def F] Annulus Temperature Depth [ft] [def F] Optional Input Open hole roughness: Steel roughness: Pressure loss model: Semi-empirical Gas density model: Hall-Yarborough Friction factor model: Dodge-Metzner Rheology model: Robertson-Stiff End of data. 150
165 APPENDIX B: WELL Z SIMULATIONS INPUT DATA Case Description Project: Alternative initial responses to gas kicks during MPD operations Data description: Simulation inputs for no kick case (Base) with high permeability Well: Z Well section: in. Software: Drillbench (Dynaflodrill module) Company: SPT (Scandpower Petroleum Technology) Group Creator: Majid Davoudi Date: 01-Aug-2009 Survey Md Inclination Azimuth Vertical depth [ft] [deg] [deg] [ft] Wellbore Geometry Name Hanger Setting Inner Outer depth depth diameter diameter [ft] [ft] [in] [in] 20" C lbs/ft Target depth (ft): Open hole length (ft): Open hole diameter (in): String Component Type Section Inner Outer length diameter diameter [ft] [in] [in] DC 9" DrillCollar HWDP 5" Drillpipe DP 5" Drillpipe Average stand length (ft): Bit outer diameter (in): Flow area (sq in): 0.75 Number of bit nozzles: 3 Nozzles diameter (1/32 in): 18 Choke Inner diameter (in): 3.00 Closure time (min): 0.50 Choke control: Pressure Working pressure (psi):
166 Mud Type: Water Based Mud (WBM) Base oil density (ppg): Water density (ppg): Solids density (ppg): Density (ppg): Reference temperature (deg F): Fluid type: Liquid Oil water ratio: 0 / 100 Rheology type: Non-Newtonian; Fann tables PVT model: Black oil Fann Reading Shear Shear rate stress [rpm] [lbf/100ft2] Reservoir Name Top Bottom Type Press Temp Porosity Perm Fluid [ft] [ft] [psi] [deg F] [0-1] [md] Form Matrix Gas HP Sand Matrix Gas Flow model Reservoir model Reservoir model Hole cleaning criterion: Max concentration Cuttings density (ppg): 0.1 Max concentration: 0.04 Water Density (ppg) Compressibility (1/psi) 7.58 E-08 Volume factor 1.00 Viscosity (cp) 1.00 Oil Density (ppg) Compressibility (1/psi) 1.38 E-06 Volume factor 1.10 Viscosity (cp) 2.00 Gas 152
167 Density (SG) 0.65 N CO Hydrocarbon 1.00 H2S 0.00 Temperature Drillstring Temperature Depth [ft] [def F] Annulus Temperature Depth [ft] [def F] Optional Input Open hole roughness: Steel roughness: Pressure loss model: Semi-empirical Gas density model: Hall-Yarborough Friction factor model: Dodge-Metzner Rheology model: Robertson-Stiff End of data. 153
168 APPENDIX C: WELL X AND Z TABLES OF RESULTS AND SIMULATION PLOTS Content Index Results Description Case code Page Well X non-circulating responses C1 - C Tables Well X circulating responses C13 - C Well Z non-circulating responses C25 - C Well Z circulating responses C37 - C Well X simulations index Well X non-circulating responses C1 - C Plots Well X circulating responses C13 - C Well Z simulations index Well Z non-circulating responses C25 - C Well Z circulating responses C37 - C

169 155
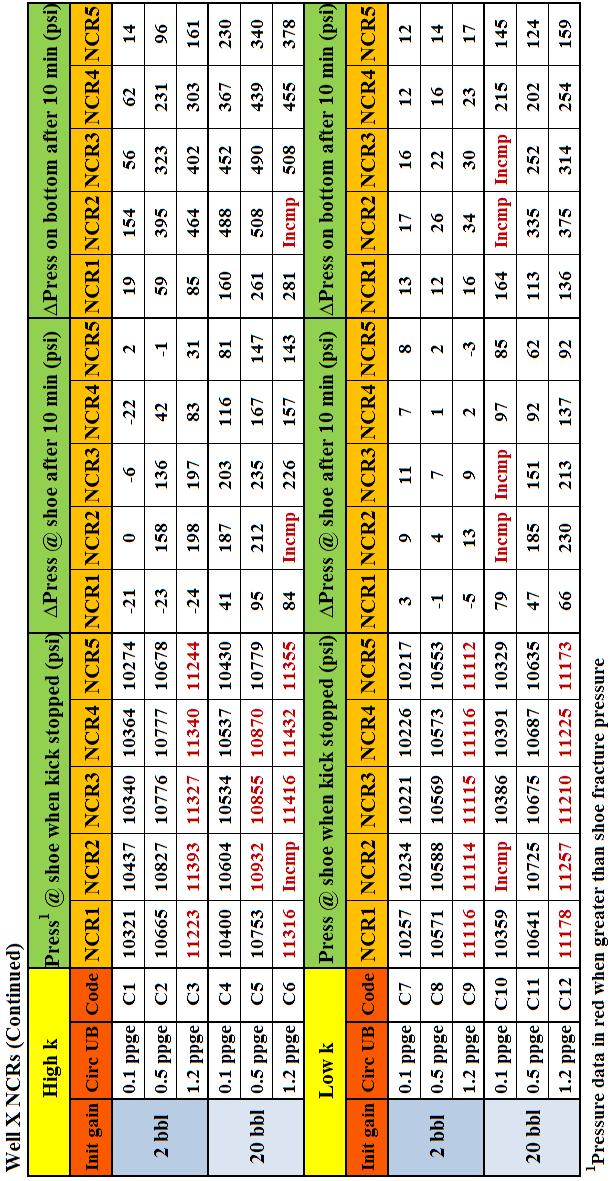
170 156
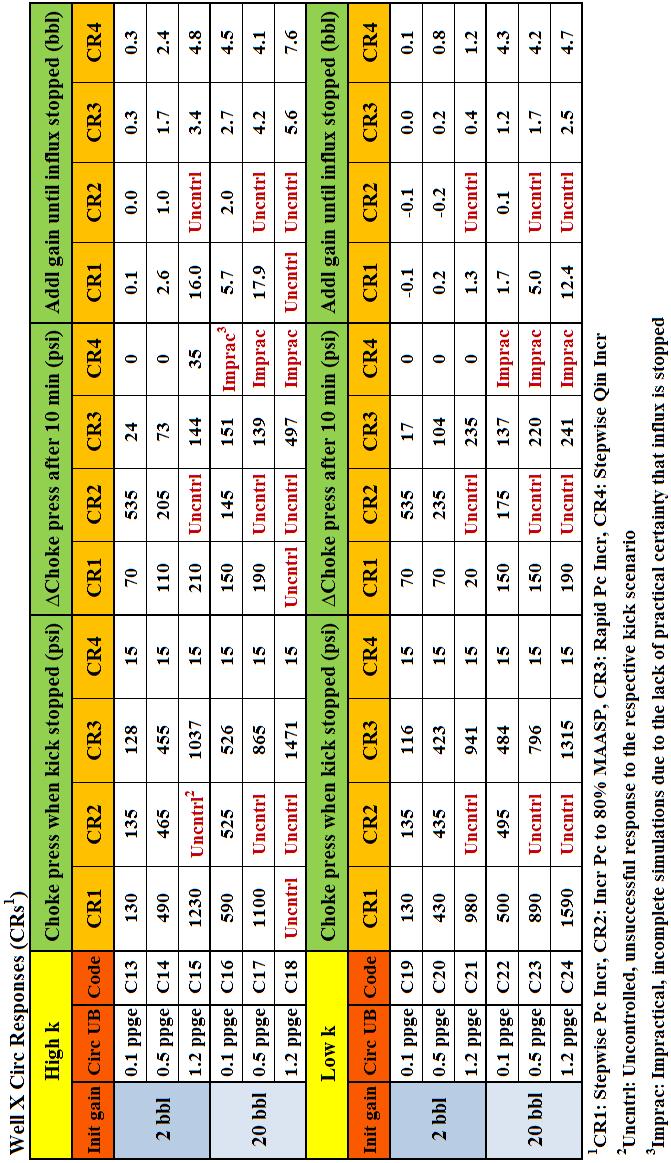
171 157

172 158
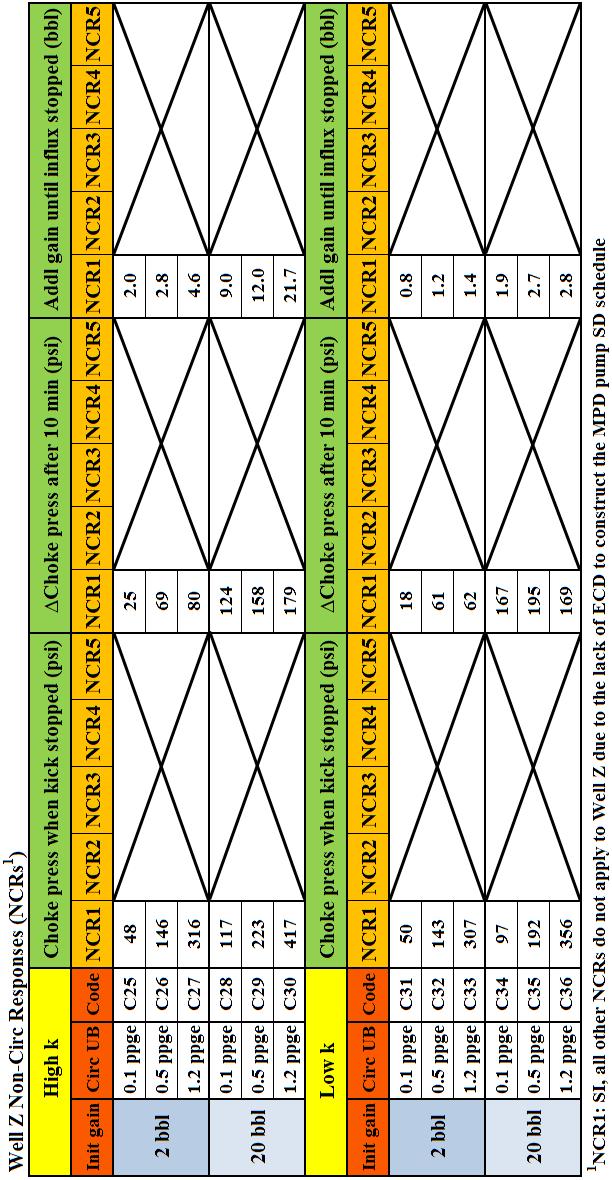
173 159
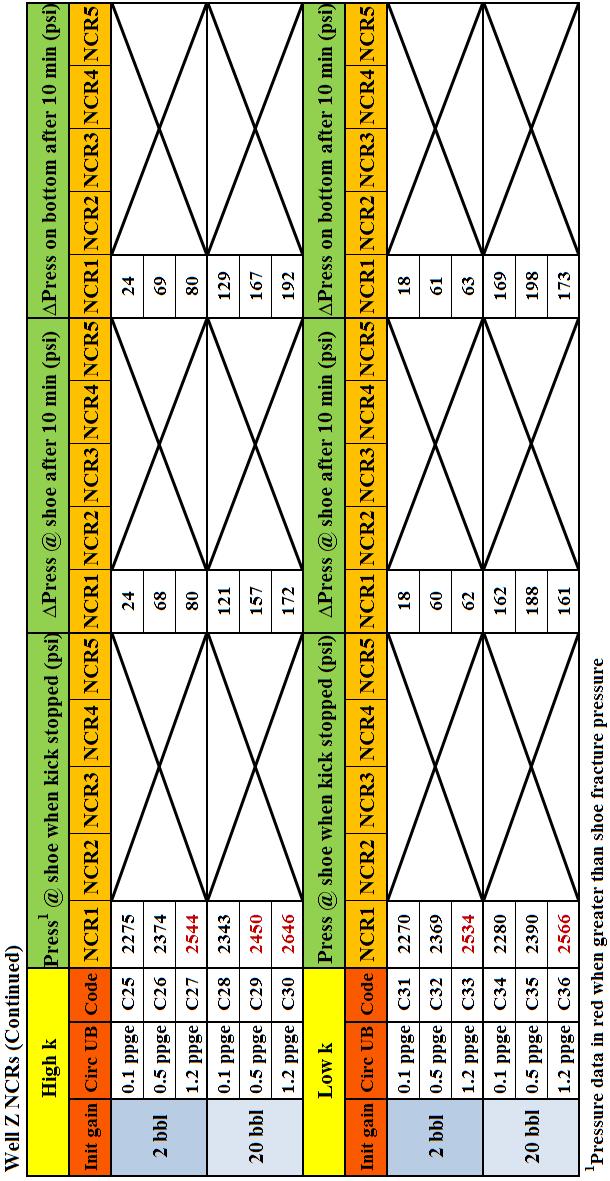
174 160

175 161
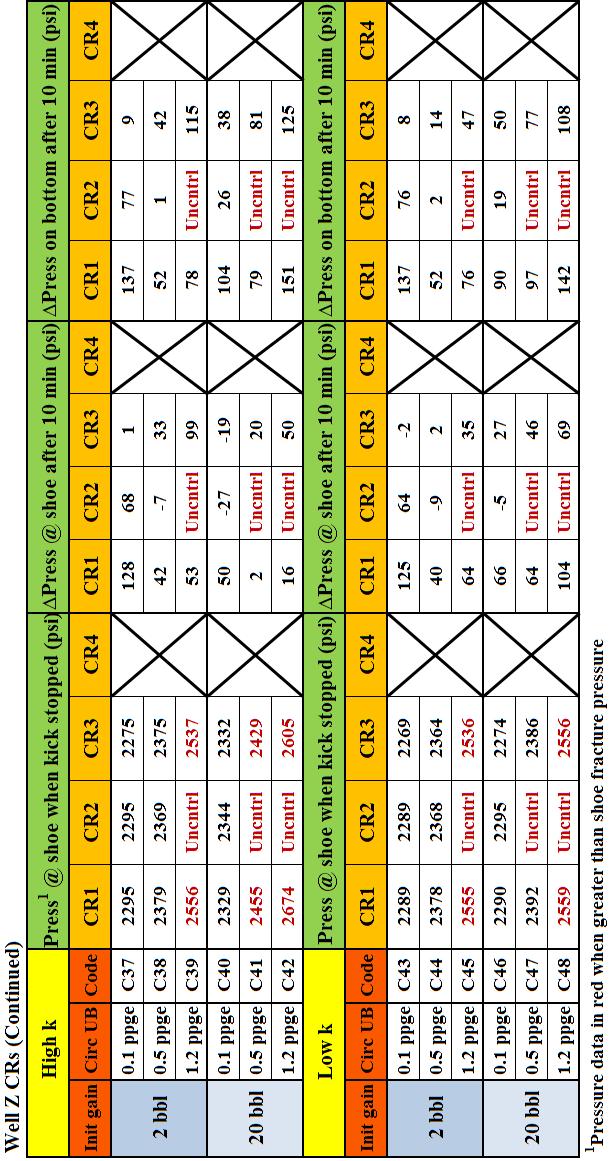
176 162
177 INDEX FOR WELL X SIMULATION PLOTS Initial response Permeability Initial gain Circ 190 gpm Case code Page 0.1 ppge C bbl 0.5 ppge C2 165 High k 1.2 ppge C ppge C bbl 0.5 ppge C5 168 Non-Circ 1.2 ppge C ppge C bbl 0.5 ppge C8 171 Low k 1.2 ppge C ppge C bbl 0.5 ppge C ppge C ppge C bbl 0.5 ppge C High k 1.2 ppge C ppge C bbl 0.5 ppge C Circ 1.2 ppge C ppge C bbl 0.5 ppge C Low k 1.2 ppge C ppge C bbl 0.5 ppge C ppge C


178 C1: Well X, application of NCRs on 2 bbl kick / high k / 0.1 ppge Circ UB 164


179 C2: Well X, application of NCRs on 2 bbl kick / high k / 0.5 ppge Circ UB 165


180 C3: Well X, application of NCRs on 2 bbl kick / high k / 1.2 ppge Circ UB 166


181 C4: Well X, application of NCRs on 20 bbl kick / high k / 0.1 ppge Circ UB 167


182 C5: Well X, application of NCRs on 20 bbl kick / high k / 0.5 ppge Circ UB 168


183 C6: Well X, application of NCRs on 20 bbl kick / high k / 1.2 ppge Circ UB 169


184 C7: Well X, application of NCRs on 2 bbl kick / low k / 0.1 ppge Circ UB 170


185 C8: Well X, application of NCRs on 2 bbl kick / low k / 0.5 ppge Circ UB 171


186 C9: Well X, application of NCRs on 2 bbl kick / low k / 1.2 ppge Circ UB 172


187 C10: Well X, application of NCRs on 20 bbl kick / low k / 0.1 ppge Circ UB 173


188 C11: Well X, application of NCRs on 20 bbl kick / low k / 0.5 ppge Circ UB 174


189 C12: Well X, application of NCRs on 20 bbl kick / low k / 1.2 ppge Circ UB 175

190 C13: Well X, application of CRs on 2 bbl kick / high k / 0.1 ppge Circ UB 176
191 C14: Well X, application of CRs on 2 bbl kick / high k / 0.5 ppge Circ UB 177


192 C15: Well X, application of CRs on 2 bbl kick / high k / 1.2 ppge Circ UB 178

193 C16: Well X, application of CRs on 20 bbl kick / high k / 0.1 ppge Circ UB 179

194 C17: Well X, application of CRs on 20 bbl kick / high k / 0.5 ppge Circ UB 180
195 C18: Well X, application of CRs on 20 bbl kick / high k / 1.2 ppge Circ UB 181

196 C19: Well X, application of CRs on 2 bbl kick / low k / 0.1 ppge Circ UB 182

197 C20: Well X, application of CRs on 2 bbl kick / low k / 0.5 ppge Circ UB 183

198 C21: Well X, application of CRs on 2 bbl kick / low k / 1.2 ppge Circ UB 184

199 C22: Well X, application of CRs on 20 bbl kick / low k / 0.1 ppge Circ UB 185

200 C23: Well X, application of CRs on 20 bbl kick / low k / 0.5 ppge Circ UB 186

201 C24: Well X, application of CRs on 20 bbl kick / low k / 1.2 ppge Circ UB 187
202 INDEX FOR WELL Z SIMULATION PLOTS Initial response Permeability Initial gain Circ 900 gpm Case code Page 0.1 ppge C bbl 0.5 ppge C High k 1.2 ppge C ppge C bbl 0.5 ppge C Non-Circ 1.2 ppge C ppge C bbl 0.5 ppge C Low k 1.2 ppge C ppge C bbl 0.5 ppge C ppge C ppge C bbl 0.5 ppge C High k 1.2 ppge C ppge C bbl 0.5 ppge C Circ 1.2 ppge C ppge C bbl 0.5 ppge C Low k 1.2 ppge C ppge C bbl 0.5 ppge C ppge C

203 C25-27: Well Z, SI response on 2 bbl kick / high k / 0.1, 0.5 and 1.2 ppge Circ UB C28-30: Well Z, SI response on 20 bbl kick / high k / 0.1, 0.5 and 1.2 ppge Circ UB 189


204 C31-33: Well Z, SI response on 2 bbl kick / low k / 0.1, 0.5 and 1.2 ppge Circ UB C34-36: Well Z, SI response on 20 bbl kick / low k / 0.1, 0.5 and 1.2 ppge Circ UB 190
205 C37: Well Z, application of CRs on 2 bbl kick / high k / 0.1 ppge Circ UB 191
206 C38: Well Z, application of CRs on 2 bbl kick / high k / 0.5 ppge Circ UB 192

207 C39: Well Z, application of CRs on 2 bbl kick / high k / 1.2 ppge Circ UB 193
208 C40: Well Z, application of CRs on 20 bbl kick / high k / 0.1 ppge Circ UB 194
209 C41: Well Z, application of CRs on 20 bbl kick / high k / 0.5 ppge Circ UB 195

210 C42: Well Z, application of CRs on 20 bbl kick / high k / 1.2 ppge Circ UB 196
211 C43: Well Z, application of CRs on 2 bbl kick / low k / 0.1 ppge Circ UB 197
212 C44: Well Z, application of CRs on 2 bbl kick / low k / 0.5 ppge Circ UB 198

213 C45: Well Z, application of CRs on 2 bbl kick / low k / 1.2 ppge Circ UB 199
214 C46: Well Z, application of CRs on 20 bbl kick / low k / 0.1 ppge Circ UB 200

215 C47: Well Z, application of CRs on 20 bbl kick / low k / 0.5 ppge Circ UB 201

216 C48: Well Z, application of CRs on 20 bbl kick / low k / 1.2 ppge Circ UB 202
Simulation study evaluating alternative initial responses to formation fluid influx during managed pressure drilling
 Louisiana State University LSU Digital Commons LSU Master's Theses Graduate School 2007 Simulation study evaluating alternative initial responses to formation fluid influx during managed pressure drilling
W I L D W E L L C O N T R O L PRESSURE BASICS AND CONCEPTS
 PRESSURE BASICS AND CONCEPTS Pressure Basics and Concepts Learning Objectives You will be familiarized with the following basic pressure concepts: Defining pressure Hydrostatic pressure Pressure gradient
August 21, Deepwater MPD / PMCD
 August 21, 2011 Deepwater MPD / PMCD Managed Pressure Drilling (MPD) Pressure held on top of riser while drilling. Drill in overbalance condition Pressurized Mud Cap Drilling (PMCD) Pressure of mud column
Drilling Efficiency Utilizing Coriolis Flow Technology
 Session 12: Drilling Efficiency Utilizing Coriolis Flow Technology Clement Cabanayan Emerson Process Management Abstract Continuous, accurate and reliable measurement of drilling fluid volumes and densities
Offshore Managed Pressure Drilling Experiences in Asia Pacific. SPE paper
 Offshore Managed Pressure Drilling Experiences in Asia Pacific SPE paper 119875 Authors: Steve Nas, Shaun Toralde, Chad Wuest, SPE, Weatherford Solutions Sdn Bhd, SPE, Weatherford Indonesia SPE, Weatherford
ECD Reduction Tool. R. K. Bansal, Brian Grayson, Jim Stanley Control Pressure Drilling & Testing
 ECD Reduction Tool R. K. Bansal, Brian Grayson, Jim Stanley Control Pressure Drilling & Testing Drilling Engineering Association, Fourth Quarter Meeting November 20, 2008 1 Presentation outline Description
Worked Questions and Answers
 Worked Questions and Answers A Learning Document for prospective Candidates For the Rotary Drilling Well Control Test Programme Copyright, IWCF June 2000 Revision No.1, November 2000 IWCF 2000 page 1 of
AADE 2009NTCE-04-04: PRACTICAL ASPECTS AND VALUE OF AUTOMATED MPD IN HPHT WELLS
 sudden appearance of permeable sequences abnormally pressured to higher than anticipated levels in an already narrow margin. 2009 NATIONAL TECHNICAL CONFERENCE & EXHIBITION, NEW ORLEANS, LOUISIANA AADE
The Diagnosis of Well Control Complications during Managed Pressure Drilling
 Louisiana State University LSU Digital Commons LSU Master's Theses Graduate School 213 The Diagnosis of Well Control Complications during Managed Pressure Drilling Brian Piccolo Louisiana State University
DRILLING MANAGED PRESSURE REGIONAL OUTLOOK: EAST AFRICA REDUCED EMISSION COMPLETIONS SHALE TECHNOLOGY REVIEW
 MARCH 2014 / DEFINING TECHNOLOGY FOR EXPLORATION, DRILLING AND PRODUCTION / WorldOil.com MANAGED PRESSURE DRILLING How automated MPD enables drilling of an impossible well in Mexico REGIONAL OUTLOOK: EAST
Dilution-Based Dual Gradient Well Control. Presented at the 2011 IADC Dual Gradient Workshop, 5 May 2011 by Paul Boudreau, Dual Gradient Systems LLC
 Dilution-Based Dual Gradient Well Control Presented at the 2011 IADC Dual Gradient Workshop, 5 May 2011 by Paul Boudreau, Dual Gradient Systems LLC In this very short presentation, we will Review Dilution-based
DRILLSCENE PROACTIVE DRILLING DECISIONS
 DRILLSCENE PROACTIVE DRILLING DECISIONS RISE TO THE CHALLENGE OF REAL-TIME DRILLING CONTROL Today s oil and gas drilling operations present significant technical challenges in remote locations and increasingly
Understanding pressure and pressure
 CHAPTER 1 1-1 PRESSURE BASICS Remember to think downhole. The concepts provided in this section cover the foundations for good well control. Understanding pressure and pressure relationships is important
DAY ONE. 2. Referring to the last question, what mud weight would be required to BALANCE normal formation pressure?
 DAY ONE 1. Normal formation pressure gradient is generally assumed to be: A..496 psi/ft B..564 psi/ft C..376 psi/ft D..465 psi/ft 2. Referring to the last question, what mud weight would be required to
Study Guide IADC WellSharp Driller and Supervisor
 Times to Flow Check: Before pulling out of the hole Before pulling BHA into the BOP When bit is pulled into the casing Increase in cuttings at shakers with same ROP On connections Upon abnormal trip tank
A New and Simplified Method for Determination of Conductor Surface Casing Setting Depths in Shallow Marine Sediments (SMS)
") AADE-07-NTCE-41 A New and Simplified Method for Determination of Conductor Surface Casing Setting Depths in Shallow Marine Sediments (SMS) Paknejad, A., Texas A&M University; Schubert, J., Texas A&M University
AADE-07-NTCE-41 A New and Simplified Method for Determination of Conductor Surface Casing Setting Depths in Shallow Marine Sediments (SMS) Paknejad, A., Texas A&M University; Schubert, J., Texas A&M University
A MATHEMATICAL MODEL TO PREDICT BACK PRESSURE USING CONSTANT BOTTOM HOLE PRESSURE TECHNIQUE IN MANAGED PRESSURE DRILLING
 A MATHEMATICAL MODEL TO PREDICT BACK PRESSURE USING CONSTANT BOTTOM HOLE PRESSURE TECHNIQUE IN MANAGED PRESSURE DRILLING Nsikak M. Marcus University of Port Harcourt NIGERIA Boniface A. Oriji University
Well Control Modeling Software Comparisons with Single Bubble Techniques in a Vertical Well
 Well Control Modeling Software Comparisons with Single Bubble Techniques in a Vertical Well Jace R. Larrison, P.E. Blowout Engineers, LLC Recent advances in well control modeling simulators have incorporated
Why Do Not Disturb Is a Safety Message for Well Integrity
 Why Do Not Disturb Is a Safety Message for Well Integrity Presented at the Practical Well Integrity Conference 9-10 December, 2014 in Houston By Ron Sweatman, Principal Advisor, Reservoir Development Services,
INTERPRETATION NOTE ISSUED UNDER THE PETROLEUM DRILLING REGULATIONS (CNR 1150/96)
") BOP CLASSIFICATION SYSTEM FOR ONSHORE NEWFOUNDLAND AND LABRADOR INTERPRETATION NOTE ISSUED UNDER THE PETROLEUM DRILLING REGULATIONS (CNR 1150/96) PREPARED BY THE PETROLEUM RESOURCE DEVELOPMENT DIVISION
BOP CLASSIFICATION SYSTEM FOR ONSHORE NEWFOUNDLAND AND LABRADOR INTERPRETATION NOTE ISSUED UNDER THE PETROLEUM DRILLING REGULATIONS (CNR 1150/96) PREPARED BY THE PETROLEUM RESOURCE DEVELOPMENT DIVISION
Solid Expandable Tubular Technology: The Value of Planned Installation vs. Contingency
 Solid Expandable Tubular Technology: The Value of Planned Installation vs. Contingency Chris Carstens Unocal Corporation 14141 Southwest Freeway Sugar Land, Texas 77478 Mike Breaux Unocal Corporation 14141
1. The well has been shut in on a kick and the kill operation has not started.
 Well Control Methods Day 2 1. The well has been shut in on a kick and the kill operation has not started. Shut in drill pipe pressure Shut in casing pressure 500 psi 700 psi After stabilization, both pressures
Hard or Soft Shut-in : Which is the Best Approach?
 HARD - SOFT shut-in? Hard or Soft Shut-in : Which is the Best Approach? March '93 INTRODUCTION There is now reasonable acceptance through-out the industry for the use of a hard shut-in procedure following
Along-string pressure, temperature measurements hold revolutionary promise for downhole management
 Along-string pressure, temperature measurements hold revolutionary promise for downhole management IT S WIDELY KNOWN that the majority of stuck pipe incidents occur while pulling out of hole. If we can
Low Pressure AutoChoke Console Precise wellbore pressure control for your underbalanced and managed-pressure drilling operations
 Low Pressure AutoChoke Console Precise wellbore pressure control for your underbalanced and managed-pressure drilling operations High resolution pressure control at your fingertips, during your UBD and
SPE/IADC Abstract. Introduction
 SPE/IADC 156888 Demonstrating the Value of Integrating FPWD Measurements With Managed Pressure Drilling To Safely Drill Narrow Mud Weight Windows in HP/HT Environment L. Umar, I. Azian, N. Azree, A.R.M.
Safety and Risk Analysis of Deepwater Drilling using Managed Pressure Drilling Technology
 Safety and Risk Analysis of Deepwater Drilling using Managed Pressure Drilling Technology Jyoti Bhandari 1, Faisal Khan* 1, and Vikram Garaniya 1 1.Offshore Safety and Risk Management Group, Australian
R.K. Bansal, Weatherford; P.A. Bern, BP Exploration; Rick Todd, Weatherford; R.V. Baker, BP America; Tom Bailey, Weatherford
 AADE-07-NTCE-69 A Downhole Tool for Reducing ECD R.K. Bansal, Weatherford; P.A. Bern, BP Exploration; Rick Todd, Weatherford; R.V. Baker, BP America; Tom Bailey, Weatherford Copyright 2007, AADE This paper
Niko Deepwater Weatherford MPD DODI Ocean Monarch Nelson Emery Niko Indonesia Drilling Superintendent
 Niko Deepwater Weatherford MPD DODI Ocean Monarch Nelson Emery Niko Indonesia Drilling Superintendent 26 Feb - 2014 SPE Thailand 1 Outline Drivers for MPD: 1. Safety of personnel in remote operations 2.
EVALUATION OF LIQUID LIFT APPROACH TO DUAL GRADIENT DRILLING
 EVALUATION OF LIQUID LIFT APPROACH TO DUAL GRADIENT DRILLING A Thesis by UGOCHUKWU NNAMDI OKAFOR Submitted to the Office of Graduate Studies of Texas A&M University in partial fulfillment of the requirements
NOT TO COPY -- NO DISSEMINATE WITHOUT WRITTEN AGREEMENT. Presentation JB AG JCN JR 1
 Presentation JB AG JCN JR 1 Kicks & blowouts A kick is an unexpected influx into a well of a formation fluid. Should this influx be uncontrolled... -- during its way from the bottom of the hole up in the
Chapter 4 Key Findings. 4 Key Findings
 Chapter 4 Key Findings 211 4 Key Findings 212 Chapter 4 Key Findings This summarizes the key findings of the investigation team based on its extensive review of available information concerning the Macondo
The SPE Foundation through member donations and a contribution from Offshore Europe
 Primary funding is provided by The SPE Foundation through member donations and a contribution from Offshore Europe The Society is grateful to those companies that allow their professionals to serve as
APPENDIX A1 - Drilling and completion work programme
 APPENDIX A1 - Drilling and completion work programme Information about the well and drilling To the extent possible, the international system of units (SI) should be adhered to, and the drilling programme
Extended leak off testing
 Extended leak off testing Rev: 1.0 03/01/01 Purpose To ensure minimal operational time and risk exposure to personnel, process, production and equipment. The following extended leak off test procedures
New generation of solid expandable liners help give operators a jump on trouble zones
 New generation of solid expandable liners help give operators a jump on trouble zones By Pat York, Weatherford SINCE SOLID EXPANDABLE technology has gained credibility as an effective contingency option,
ANALYSIS OF ALTERNATIVE WELL CONTROL METHODS FOR DUAL DENSITY DEEPWATER DRILLING
 ANALYSIS OF ALTERNATIVE WELL CONTROL METHODS FOR DUAL DENSITY DEEPWATER DRILLING A Thesis Submitted to the Graduate Faculty of the Louisiana State University and Agricultural and Mechanical College in
WILD WELL CONTROL WARNING SIGNS OF KICKS
 WARNING SIGNS OF KICKS Warning Signs of Kicks Learning Objectives You will learn the warning signs that indicate the well may be kicking: Warning signs of kicks False kick indicators You will also learn
RPSEA UDW Forum June 22 & 23, Secure Energy for America
 RPSEA UDW Forum June 22 & 23, 2010 Secure Energy for America PROJECT TEAM RPSEA Operator Advisory Committee Anadarko Chevron Shell ConocoPhillips Subcontractors IntecSea NOV CTES General Marine Contractors
OPTIMUM SELECTION OF WELL CONTROL METHODS
 OPTIMUM SELECTION OF WELL CONTROL METHODS Md AHAMMAD SHARIF Assistant professor, Department of Petroleum Engineering, GIET College of Engineering, Rajahmundry. Dr. S. SRIGOWRI REDDY Professor, GIET College
Faculty of Science and Technology. Master Thesis. Writer: Audun Tufte Veisene (Writer s signatures)
") Faculty of Science and Technology Master Thesis Study program/ Specialization: Petroleum Engineering/ Drilling Technology Spring semester, 2014 Open Writer: Audun Tufte Veisene (Writer s signatures) Faculty
Faculty of Science and Technology Master Thesis Study program/ Specialization: Petroleum Engineering/ Drilling Technology Spring semester, 2014 Open Writer: Audun Tufte Veisene (Writer s signatures) Faculty
Chapter 5 HORIZONTAL DRILLING
 Chapter 5 HORIZONTAL DRILLING Chapter 5 How much money am I about to put on the table for a horizontal well? Did I do sufficient planning? Keys to Successful Horizontal Wells Multi-disciplined teams working
SPE/IADC Abstract
 SPE/IADC 125311 Pressurized Mud Cap Drilling Drastically Reduces Non-Productive Time in Soka Field, South Sumatera Michael Runtuwene, Sanny Suprihono, and Dany Rizka, SPE, Medco E&P Indonesia, Andi Eka
Step-Rate Formation Integrity Test Method for Geothermal Wells
 GRC Transactions, Vol. 41, 2017 Step-Rate Formation Integrity Test Method for Geothermal Wells William M. Rickard, Ozgur Balamir and Ernesto Rivas Geothermal Resource Group, Inc. services@geothermalresourcegroup.com
Evaluation of deepwater kicks and future countermeasures
 WELLS AND WELL INTERVENTION Evaluation of deepwater kicks and future countermeasures Paal Skalle, Per Holand 2 and Sigbjørn Sangesland Norwegian University of Science and Technology and 2 SINTEF/ExproSoft
Blowout during Workover Operation A case study Narration by: Tarsem Singh & Arvind Jain, OISD
 1. Introduction An incident of gas leakage from a well took place during workover operations. Subsequently, the gas caught fire on the fourth day in which twelve persons were injured. Two contract workers,
SUBSEA KILL SHEET EXERCISE No. 5
 Subsea Kill Sheet Exercise No. 5 SUBSEA KILL SHEET EXERCISE No. 5 Name: Date: Complete the Subsea vertical kill sheet provided on pages 2 and 3. Then answer questions 1 to 12. Please round calculations
UPM A Virtual Wellbore Modelling System to Prevent and Enhance the Detection of Well Control Events in Deepwater Drilling
 UPM 16080 A Virtual Wellbore Modelling System to Prevent and Enhance the Detection of Well Control Events in Deepwater Drilling Brian Piccolo, Austin Johnson, Scott Petrie, Henry Pinkstone, Christian Leuchtenberg
IWCF Equipment Sample Questions (Combination of Surface and Subsea Stack)
") IWCF Equipment Sample Questions (Combination of Surface and Subsea Stack) 1. Given the volumes below, how much hydraulic fluid will be required to carry out the following operations (no safety margin)?
IWCF Equipment Sample Questions (Combination of Surface and Subsea Stack) 1. Given the volumes below, how much hydraulic fluid will be required to carry out the following operations (no safety margin)?
VOLUMETRIC METHODS and STRIPPING OPERATIONS
 VOLUMETRIC METHODS and STRIPPING OPERATIONS WELL CONTROL SCHOOL Muscat, Oman Training Center VOLUMETRIC METHODS and STRIPPING OPERATIONS The material contained here, is based on the best sources available
MPD Technique in Haynesville Shale Delivers Significant Value in Over Pressured Zones, A Case Study on Four Wells.
 AADE-11-NTCE-55 MPD Technique in Haynesville Shale Delivers Significant Value in Over Pressured Zones, A Case Study on Four Wells. Serkan Cenberlitas, Jim Crenshaw, and Ferhat Gumus, Weatherford International;
DEPARTMENT OF ENVIRONMENTAL PROTECTION Office of Oil and Gas Management
 DEPARTMENT OF ENVIRONMENTAL PROTECTION Office of Oil and Gas Management DOCUMENT NUMBER: 800-0810-003 TITLE: EFFECTIVE DATE: AUTHORITY: POLICY: PURPOSE: APPLICABILITY: DISCLAIMER: Guidelines for Development
Coiled Tubing string Fatigue Management in High Pressure Milling Operation- Case Study
 Coiled Tubing string Fatigue Management in High Pressure Milling Operation- Case Study Abstract: Paper Presenter: Ebrahim Rabbani 1 e.rabbani@mehranservices.com Ebrahim Rabbani, Danial Davoodi 2, Fatemeh
International Well Control Forum. IWCF Drilling Well Control Syllabus Level 3 and 4 March 2017 Version 7.0
 International Well Control Forum IWCF Drilling Well Control Syllabus and 4 March 2017 Version 7.0 IWCF Drilling Well Control Syllabus and 4 Contents Guidance Notes... 5 1.1. Introduction... 5 1.2. Who
Practice Exam IADC WellSharp Driller and Supervisor
 Workover & Completion Day 4 1. In a workover operation of a shut in well a Lubricator is being used together with a Wireline BOP / Wireline Valve. Which Barrier is classified as the Primary Barrier? A.
SIMULATION OF A RE-ENTRY WITH CASING DRILLING UNDER HPHT CONDITIONS Gabriella Federer-Kovacs 1. Introduction
 Simulation of a re-entry with casing drilling under HPHT conditions SIMULATION OF A RE-ENTRY WITH CASING DRILLING UNDER HPHT CONDITIONS Gabriella Federer-Kovacs 1. Introduction Due to the ongoing depletion
RISER GAS MIGRATION IN EC-DRILL OPERATIONS. A Thesis OMER KALDIRIM
 RISER GAS MIGRATION IN EC-DRILL OPERATIONS A Thesis by OMER KALDIRIM Submitted to the Office of Graduate and Professional Studies of Texas A&M University in partial fulfillment of the requirements for
WellCAP IADC WELL CONTROL ACCREDITATION PROGRAM
 WellCAP IADC WELL CONTROL ACCREDITATION PROGRAM WELL SERVICING OPERATIONS (WIRELINE, COILED TUBING & SNUBBING) CORE CURRICULUM AND RELATED FORM WCT-2WSI INTRODUCTORY LEVEL For information on how an course
WellCAP IADC WELL CONTROL ACCREDITATION PROGRAM
 WellCAP IADC WELL CONTROL ACCREDITATION PROGRAM DRILLING OPERATIONS CORE CURRICULUM AND RELATED JOB SKILLS FORM WCT-02DS SUPERVISORY LEVEL The purpose of the core curriculum is to identify a body of knowledge
PTTCO Drilling Well Control Training Course
 www.pttco.org PTTCO Drilling Well Control Training Course 1.1 Course objectives 1.2 Course duration 1.3 Number of trainees in a course 1.4 Prerequisites 1.5 Instructor s specific qualifications 1.6 Course
W I L D W E L L C O N T R O L FLUIDS
 FLUIDS Fluids Learning Objectives You will learn about different fluids that can be used in well control. You will become familiar with the characteristics and limitations of fluids. You will learn general
MASTER S THESIS. A Discussion of Well Control Methods. Faculty of Science and Technology. Study program/ Specialization: Spring semester, 2013
 Faculty of Science and Technology MASTER S THESIS Study program/ Specialization: Petroleum Engineering Spring semester, 2013 Open Writer: Øystein Røssland (Writer s signature) Faculty supervisor: Professor
WellCAP IADC WELL CONTROL ACCREDITATION PROGRAM
 WellCAP IADC WELL CONTROL ACCREDITATION PROGRAM WIRELINE OPERATIONS CORE CURRICULUM AND RELATED FORM WCT-2WLF FUNDAMENTAL LEVEL The purpose of the core curriculum is to identify a body of knowledge and
BANDAR PANJI-1 WELL CONTROL INCIDENT REPORT
 BANDAR PANJI-1 WELL CONTROL INCIDENT REPORT EXECUTIVE SUMMARY I was requested by management to review the Banjar Panji-1 drilling operations from the conception of the Integrated Drilling Management approach
Development of a Subsurface Mudline Packer to Reduce Risk of Flow after Cementing and Sustained Casing Pressure, While Providing a Platform for P&A.
 Development of a Subsurface Mudline Packer to Reduce Risk of Flow after Cementing and Sustained Casing Pressure, While Providing a Platform for P&A. Sean Yakeley, Ed Wood and Yang Xu (Baker Hughes Inc)
Kicks Controlling Techniques Efficiency in Term of Time
 Engineering, 2017, 9, 482-492 http://www.scirp.org/journal/eng ISSN Online: 1947-394X ISSN Print: 1947-3931 Kicks Controlling Techniques Efficiency in Term of Time Ali K. Darwesh, Thorkild Maack Rasmussen,
Well Control Drill Guide Example Only. Drill Guide is the list of drills, questions and attributes that are in DrillPad.
 Well Control Drill Guide Example Only Drill Guide is the list of drills, questions and attributes that are in DrillPad. This Well Control Drill Guide will be used in conjunction with the rig-specific well
BaraShield -664 LCM Standard Field Application Procedure
 BaraShield -664 LCM Standard Field Application Procedure Prepared for: Prepared by: Submitted by: Submittal Date: All Customers Sharath Savari, Donald L. Whitfill Halliburton March 2016 1 Copyright 2011
W I L D W E L L C O N T R O L CIRCULATION & WELL CONTROL
 CIRCULATION & WELL CONTROL Learning Objectives You will learn: The importance of pump rates and pressures during well control operations Pressure relationships Basic calculations necessary in well control
SUPPLEMENT Well Control for Drilling Operations Workover & Completion for Supervisors Core Curriculum and Related Learning Objectives
 SUPPLEMENT Well Control for Drilling Operations Workover & Completion for Supervisors Core Curriculum and Related Learning Objectives Form WSP-02-DO-SU-WOC-S Revision 0 13 February 2015 DC 2015 COPYRGHT
SUPPLEMENT Well Control for Drilling Operations Workover & Completion for Drillers Core Curriculum and Related Learning Objectives
 SUPPLEMENT Well Control for Drilling Operations Workover & Completion for Drillers Core Curriculum and Related Learning Objectives Form WSP-02-DO-SU-WOC-D Revision 0 13 February 2015 DC 2015 COPYRGHT PROTECTED
MASTER S THESIS. Faculty of Science and Technology. Study program/ Specialization: Petroleum Engineering/ Well Engineering. Writer: Nikita Potokin
 Faculty of Science and Technology MASTER S THESIS Study program/ Specialization: Petroleum Engineering/ Well Engineering Spring semester, 2015 Open Writer: Nikita Potokin (writer s signature) Faculty supervisor:
SPE The paper gives a brief description and the experience gained with WRIPS applied to water injection wells. The main
 SPE 102831 Online Water-Injection Optimization and Prevention of Reservoir Damage Bjørn Øyvind Bringedal, Svein Arne Morud, Nicolas Alexander Hall, ABB; Gary Huseman, Shell Copyright 2006, Society of Petroleum
Modern Perforating Techniques: Key to Unlocking Reservoir Potential
 Modern Perforating Techniques: Key to Unlocking Reservoir Potential DEVEX 2016 0052 Andy Martin Perforating Domain Advisor Schlumberger Aberdeen martin17@slb.com +44 7802 495068 Presentation Outline Introduction:
DEPARTMENT OF ENVIRONMENTAL PROTECTION Office of Oil and Gas Management
 DEPARTMENT OF ENVIRONMENTAL PROTECTION Office of Oil and Gas Management DOCUMENT NUMBER: 800-0810-003 TITLE: EFFECTIVE DATE: AUTHORITY: POLICY: PURPOSE: APPLICABILITY: DISCLAIMER: Guidelines for Development
Well Control for Drilling Operations Personnel Core Curriculum and Related Learning Objectives
 Well Control for Drilling Operations Personnel Core Curriculum and Related Learning Objectives Form WSP-02-DO-D Second Edition, Revision 1 19 June 2015 ADC 2015 COPYRGHT PROTECTED DOCUENT All rights reserved.
Managed Pressure Drilling Automation Techniques for Horizontal Applications
 AADE-13-FTCE-11 Managed Pressure Drilling Automation Techniques for Horizontal Applications C.J. Bernard, Randy Lovorn, Derrick Lewis, Emad Bakri and Saad Saeed, Halliburton Copyright 2013, AADE This paper
DUO-SQUEEZE H LCM Mixing Tables and Operating Procedures
 BAROID DUO-SQUEEZE H LCM Mixing Tables and Operating Procedures Prepared for: Prepared by: Submitted by: Submittal Date: All Customers Sharath Savari, Donald L. Whitfill Halliburton January 2014 1 Copyright
WELL SCAVENGER. Versatile wellbore clean-up tool for the most demanding operations
 WELL SCAVENGER Versatile wellbore clean-up tool for the most demanding operations WELL SCAVENGER: A versatile wellbore cleanup tool for flowrestricted applications The inability to recover wellbore debris
Protecting People and the Environment during Stimulation Treatments in Offshore Settings
 Protecting People and the Environment during Stimulation Treatments in Offshore Settings NASEM Workshop: Offshore Well Completion and Stimulation using Hydraulic Fracturing and Other Technologies Paul
IWCF Equipment Sample Questions (Surface Stack)
") IWCF Equipment Sample Questions (Surface Stack) 1. During a well control operation 4000 psi was shut in below the middle pipe rams. Ram type BOP data: Model: Cameron U type Rated Working Pressure: 15000
IWCF Equipment Sample Questions (Surface Stack) 1. During a well control operation 4000 psi was shut in below the middle pipe rams. Ram type BOP data: Model: Cameron U type Rated Working Pressure: 15000
SURFACE CASING SELECTION FOR COLLAPSE, BURST AND AXIAL DESIGN FACTOR LOADS EXERCISE
 SURFACE CASING SELECTION FOR COLLAPSE, BURST AND AXIAL DESIGN FACTOR LOADS EXERCISE Instructions Use the example well data from this document or the powerpoint notes handout to complete the following graphs.
ARTICLE. Overcome casing integrity issues in your plug-and-perf operations
 ARTICLE Overcome casing integrity issues in your plug-and-perf operations CONTENT A challenge to plug-and-perf success 3 Causes of casing restrictions 9 How extended-range frac plugs keep operations moving
Well Control Institute (WCI) Core Curriculum and Related Learning Outcomes: Supervisory Level
 Core Curriculum and Related Learning Outcomes: Supervisory Level") Well Control nstitute (WC) Core Curriculum and Related Learning Outcomes: Level Revision 4B ay 14, 2014 Prepared by Black & Veatch Corp. DRAFT WORK PRODUCT FOR NDUSTRY COENT Well Control nstitute (WC)
Well Control nstitute (WC) Core Curriculum and Related Learning Outcomes: Level Revision 4B ay 14, 2014 Prepared by Black & Veatch Corp. DRAFT WORK PRODUCT FOR NDUSTRY COENT Well Control nstitute (WC)
The key to connectivity
 The key to connectivity Kerry Daly, Global BD Manager, Tubing Conveyed Perforating (TCP) First published by Oilfield Technology, November 2015 Connecting oil or gas-bearing formations with the wellbore
Courses of Instruction: Controlling and Monitoring of Pipelines
 Courses of Instruction: Controlling and Monitoring of Pipelines Date December 2010 Dr. Peter Eschenbacher Partner Angergraben 4 85250 Altomünster Germany Tel. +49-(0)8254 / 99 69 57 Fax +49-(0)8254 / 99
Marine Technology Society
 Marine Technology Society Dynamic Positioning Conference 21-22 October, 1997 Session I Review of DP Applications, Consequences and Cost of Failures Drilling Fundamentals-DP Operations-Drilling with Riser
Tibor Szabó DRILLING THROUGH SHALLOW GAS ZONES IN HUNGARY
 Tibor Szabó Petroleum Engineering Department University of Miskolc, Hungary DRILLING THROUGH SHALLOW GAS ZONES IN HUNGARY The prospecting activity for CH is more than 60 years old in Hungary. During this
BLOCK: CB-ONN-2010/8 GUJRAT-INDIA
 Well Control Manual Bharat PetroResources Limited BLOCK: CB-ONN-2010/8 GUJRAT-INDIA Prepared By: EnQuest PetroSloutions Pvt. Ltd. Contents 1.0.0 Definitions 2.0.0. Causes of Kicks 3.0.0. Kick indications
CHDT Cased Hole Dynamics Tester. Pressure testing and sampling in cased wells
 CHDT Cased Hole Dynamics Tester testing and sampling in cased wells Applications Evaluation of old wells for bypassed hydrocarbons Development of critical economic data for well evaluation Reduced-risk
Module No. # 04 Lecture No. # 3.1 Case studies (continued) (Refer Slide Time: 00:10)
 (Refer Slide Time: 00:10)") Health, Safety and Environmental Management in Petroleum and offshore Engineering Prof. Dr. Srinivasan Chandrasekaran Department of Ocean Engineering Indian Institute of Technology, Madras Module No. #
Health, Safety and Environmental Management in Petroleum and offshore Engineering Prof. Dr. Srinivasan Chandrasekaran Department of Ocean Engineering Indian Institute of Technology, Madras Module No. #
SPE MS Well Collision Avoidance Management and Principles
 SPE 184730-MS Well Collision Avoidance Management and Principles S.J. Sawaryn, Consultant On behalf of the SPE Wellbore Positioning Technical Section (WPTS) Collision Avoidance Sub-Committee also referred
Situated 250km from Muscat in
 CYAN MAGENTA YELLOW BLACK GRAVITY GAINS A novel method of determining gas saturation has proved successful in Oman s Natih Field where conventional methods were giving anomalous results in difficult conditions.
Deepwater Horizon Incident Internal Investigation
 Not all Information has been verified or corroborated. Subject to review based on additional information or analysis. Deepwater Horizon Incident Internal Investigation 1 Areas of Discussion Investigation
AADE 01-NC-HO-08. Copyright 2001 AADE National Drilling Technical Conference
 AADE 01-NC-HO-08 Planning and Field Validation of Annular Pressure Predictions Gregory Mullen, Chakravarthy Singamsetty, William Dye, Baker Hughes, INTEQ Drilling Fluids, Danny Ledet, Andrew Rawicki, Todd
TECHNICAL BENEFITS OF CJS / RAISE HSP. Technical Advantages
 TECHNICAL BENEFITS OF CJS / RAISE HSP Technical Advantages The HSP is designed for low- to mid- volume applications at flow rates of 1 cubic meter to 30 c. m per day. The benefits are in the details. The
FIRE PROTECTION. In fact, hydraulic modeling allows for infinite what if scenarios including:
 By Phil Smith, Project Manager and Chen-Hsiang Su, PE, Senior Consultant, Lincolnshire, IL, JENSEN HUGHES A hydraulic model is a computer program configured to simulate flows for a hydraulic system. The
Perforating Center of Excellence TESTING SERVICES OVERVIEW
 Perforating Center of Excellence TESTING SERVICES OVERVIEW Jet Research Center (JRC) is the leader in energetic research and testing for the oil and gas industry. Since introducing jet perforators for
What are the Well Control Complications While Drilling with Casing or Liner? Tawfik Elshehabi and H. Ilkin Bilgesu, West Virginia University
 AADE-16-FTCE-79 What are the Well Control Complications While Drilling with Casing or Liner? Tawfik Elshehabi and H. Ilkin Bilgesu, West Virginia University Copyright 2016, AADE This paper was prepared
SPE Forum: Source Control for Wells in Shallow Water. Lars Herbst, Gulf of Mexico Regional Director
 SPE Forum: Source Control for Wells in Shallow Water Lars Herbst, Gulf of Mexico Regional Director Agenda Introduction and Background Historical Well Control Events Scope of Discussion Scenario Driven