Faculty of Science and Technology. Master Thesis. Writer: Audun Tufte Veisene (Writer s signatures)
|
|
|
- Pamela O’Brien’
- 5 years ago
- Views:
Transcription
1 Faculty of Science and Technology Master Thesis Study program/ Specialization: Petroleum Engineering/ Drilling Technology Spring semester, 2014 Open Writer: Audun Tufte Veisene (Writer s signatures) Faculty supervisor: Mesfin Belayneh External supervisor: Ola M. Vestavik Title of thesis: Well Control during Extended Reach Drilling conventional drilling compared to the Reelwell Drilling Method Credits (ECTS): 30 Key words: Reelwell ERD Wellplan DrillSIM Kick Kick tolerance Choke and shoe pressures Driller s method Wait & Weight method Pages: 89 + enclosure: 28 Stavanger,
2 I Abstract Well control is always of great importance during well operations. The main purpose of well control is to keep downhole pressures in the operating window between pore and fracture pressure. In the case of a well control situation where either the formation is fractured causing loss of circulation or the pressure in the well drops below pore pressure causing a kick, measures have to be taken in order to get the situation under control. When drilling horizontal and extended reach wells the same basic principles of well control apply, but also other aspects have to be considered. In this thesis the basics of well control has been discussed, along with considerations by use in Extended Reach Drilling, both conventionally and for the Reelwell Drilling Method, which is a new drilling method developed by REELWELL TM. The first part of the thesis contains literature review of well-established well control procedures and an overview of the Reelwell Drilling Method. Due to RDM being a new drilling method, well control issues haven t been studied to the same extent as for conventional, and less literature exists on the matter. The second part consists of simulation studies performed for 2 extended reach case wells. Landmark Wellplan was used for the conventional simulations, while DrillSIM- 5 was used for the RDM simulations. The focus of the simulations has been on circulating kicks of different volumes out of the well. The effect of different mud densities and kick intensities was also included for the Wellplan simulations. 2
3 II ACKNOWLEDGEMENTS I would like to thank Reelwell and Ola M. Vestavik, for providing me with the thesis and for help and guidance during my work and when using the DrillSIM software. I would also like to thank my supervisor at UiS, Mesfin A. Belayneh, for guidance with the Wellplan software and for being available whenever I had a question. You have been of great help throughout the semester. 3
4 III TABLE OF CONTENTS I ABSTRACT... 2 II ACKNOWLEDGEMENTS... 3 III TABLE OF CONTENTS INTRODUCTION BACKGROUND EXTENDED REACH DRILLING PROBLEM FORMULATION OBJECTIVES REELWELL TECHNOLOGY REELWELL VS CONVENTIONAL REELWELL EQUIPMENT BASICS OF WELL CONTROL WHAT IS A KICK? REASONS FOR KICK KICK DETECTION WELL CONTROL METHODS IN CONVENTIONAL DRILLING Driller s Method Wait & Weigh WELL CONTROL CONSIDERATIONS FOR RDM Heavy Over Light return up inner pipe kick circulation method WELL CONTROL CONSIDERATIONS IN EXTENDED REACH DRILLING WHICH CIRCULATION METHOD TO CHOOSE FOR HORIZONTAL WELLS WELL CONTROL SIMULATION SIMULATION ARRANGEMENT Well 1 - Shallow extended reach well geometry Well 2 - Ultra extended reach well geometry DRILLING FLUID PROPERTIES Wellplan simulation DrillSIM simulation SIMULATION RESULTS IN CONVENTIONAL WELLS Simulation results Well Simulation results Well Section 1: Shoe at 1000m, TD at 5000m Section 2: Shoe at 14000m, TD at m RDM SIMULATION USING DRILLSIM Well
5 Displacement of mud inside DDS with lighter drilling fluid Circulation 1 Circulate out influx through Inner Pipe Circulation 2 Pump Kill Mud down Well Annulus Circulation 3 Circulate out any remaining Kill Mud Well 2 section bbl influx bbl influx Well 2 section HOL mud displacement Circulation 1 Well COMPARISON OF DRILLSIM AND WELLPLAN SIMULATIONS USING SIMILAR INPUTS Well 1 comparison Well 2 comparison DISCUSSION WELLPLAN Kick tolerance Shoe pressure Choke pressures DRILLSIM HOL displacement Circulation Circulation Circulation COMPARISON CONCLUSION REFERENCES APPENDIX APPENDIX A: MUD VOLUME CALCULATIONS APPENDIX B: CHARTS FROM WELLPLAN SIMULATIONS APPENDIX C: TABLES FROM DRILLSIM SIMULATIONS APPENDIX D: RDM DOWN HOLE VALVE SYSTEM AND HYDRAULIC WOB DESCRIPTION. 108 APPENDIX E: WELL CONTROL PROCEDURE COMPARISON - INFLUX WHILE DRILLING APPENDIX F: LIST OF FIGURES APPENDIX G: LIST OF TABLES APPENDIX H: NOMENCLATURE
6 1. Introduction REELWELL TM Company has developed a new Extended Reach Drilling (ERD) solution with the aim of drilling beyond 20km horizontal reach. The ERD solution is still in the development phase, however, most of the equipment and engineering related to the system has been tested in full scale drilling trials and with numerical software. Recently field scale feasibility tests have been performed in Canada and the result shows positive. As part of the project, evaluation of well control is an important issue. Therefore, this thesis work deals with the well control phenomenon in REEWELL and conventional ERD. Two example wells are used for the simulations presented here: - Well 1 - a shallow extended reach well having a vertical depth (TVD) of 264,5m and a total measured depth (MD) of 1500 m. - Well 2 - an ultra-extended reach well with a TVD of 2337m and a total MD of 15800m. The following presents the background, problem formulation and technology. Subsequently the simulation results are presented and discussed. 6
![1.1 Background Reelwell was founded in 2004, and started the development of the Reelwell Drilling Method (RDM) [15].](/docs-images/90/104331061/images/7-0.jpg "Reelwell intends to expand the existing boundaries of drilling processes, with the ultimate aim of recovering more hydrocarbons in a safe, eco-friendly and cost efficient")

7 1.1 Background Reelwell was founded in 2004, and started the development of the Reelwell Drilling Method (RDM) [15]. Reelwell intends to expand the existing boundaries of drilling processes, with the ultimate aim of recovering more hydrocarbons in a safe, eco-friendly and cost efficient manner. Figure 1.1 shows the comparison of conventional and the RDM drilling envelope. Figure 1.1: Drilling envelope for conventional vs Reelwell The outer big circle in Figure 1.2 represents the Reelwell reach and the inner small circles are the conventional reaches. Reelwell shows a longer offset and reducing the number of rigs required. Figure 1.2: Comparisons of conventional and Reelwell drainage area [18] 7

8 1.2 Extended Reach Drilling ERD is commonly defined as drilling of a well with departure- to- depth ratio above 2:1. Going back to 1975 this was the limit of what was possible. Today, the departure- to- depth record is over 10:1. This shows it has been a great development in extended reach drilling. However, during the last years, the advance has slowed down. This means that extended reach drilling might have reached its limits using conventional methods and equipment. [3] Figure 1.3: Extended reach envelope [16] 8
![Table 1.1: Top ten extended reach wells in the world *MDRT **TVDRT [17] The most recent world record is Sakhalin- 1, with MD of 12345 m (40,502 ft.](/docs-images/90/104331061/images/9-0.jpg ") and a horizontal displacement of 11475 m (37,648 ft.), drilled at the Odoptu field in 2011. [12] 1.3 Problem formulation Well control during ERD is the main issue to be analyzed.")
9 Table 1.1: Top ten extended reach wells in the world *MDRT **TVDRT [17] The most recent world record is Sakhalin- 1, with MD of m (40,502 ft.) and a horizontal displacement of m (37,648 ft.), drilled at the Odoptu field in [12] 1.3 Problem formulation Well control during ERD is the main issue to be analyzed. In conventional wells, there are established well control procedures. The Reelwell Drilling Method is a new technology, and has adapted well control procedures. The issues to be addressed are: - Difference between well control kill procedures used for RDM as compared to conventional extended reach wells. - Pressure development at casing shoe and choke when using different values for mud weight, influx rate and influx volume. - Kick tolerance for extended reach wells - Kill circulation time when using RDM compared to conventional. 9
10 1.4 Objectives The objectives of the thesis are, a) Review the well control issues and the kill methods b) Perform well control simulations for conventional ERD, using Wellplan industry standard software. c) Perform well control simulations using DrillSIM 5 drilling and well control simulator developed for the RDM and using hand calculations based on well- established theories. d) Analyze kick tolerance and choke pressure from simulations. e) Compare the analysis of the conventional drilling vs the RDM 10

11 2. Reelwell technology 2.1 Reelwell vs conventional The main difference between the RDM and conventional is the dual drill string, which consists of a conventional drill string with an inner string. The RDM uses the inner annulus of the dual drill string to pump the fluid down, and the inner string to transport the drilling fluid and cuttings back to surface. This leaves the mud in the well annulus static, giving a smaller active mud volume than for conventional drilling. Figure 2.1 shows the flow arrangement of the RDM compared to conventional. Using the inner sting for cuttings transport have shown to cause less grinding of the cuttings and significantly reducing the time needed to transport the cuttings to surface [5]. RDM also uses managed pressure drilling. By adjusting the annulus pressure at surface the BHP can be easily controlled, and because of the mud in the annulus being static, a different mud can be used for drilling. Figure 2.1: Flow arrangement Conventional and RDM Another difference is the ability to close the drill string using the DFV, which can be used to bleed off the drill pipe pressures during pipe connections. 11
 The dual drill string (Figure 2.3) is the main difference between the Reelwell Drilling Method and Conventional drilling.")
12 2.2 Reelwell equipment Compared to conventional drilling the RDM requires a different fluid flow arrangement (Figure 2.2) and equipment based around the concentric drill string. Figure 2.2: Flow arrangement RDM Dual Drill String (DDS) The dual drill string (Figure 2.3) is the main difference between the Reelwell Drilling Method and Conventional drilling. The drilling fluid is pumped down the annulus of the DDS, and directed from the DDS trough a conventional BHA. The return flow, including cuttings is transported back through the inner string. The mud enters the inner string just above the BHA, through the flow x- over (FXO) and inner pipe valve (IPV), leaving the rest of the well annulus with a static mud clean of cuttings. 12
![Figure 2.3: Dual Drill String [5] Top Drive Adapter (TDA) The TDA (Figure 2.](/docs-images/90/104331061/images/13-0.jpg "4) is a special swivel to adapt and allow the DDS for rotation with the top")

13 Figure 2.3: Dual Drill String [5] Top Drive Adapter (TDA) The TDA (Figure 2.4) is a special swivel to adapt and allow the DDS for rotation with the top drive. The TDA is connected to the Reelwell Flow Control Unit trough an additional mounted standpipe and mud hose. Figure 2.4: Top Drive Adapter [5] 13
 is a control valve arrangement equipped with pressure and flow sensors for pressure and flow control of the system.")
 The DFV (Figure 2.6) terminates the DDS into a conventional BHA.")
14 Flow Control Unit (FCU) The FCU (Figure 2.5) is a control valve arrangement equipped with pressure and flow sensors for pressure and flow control of the system. The control unit connects to all of the flow paths of the system. Figure 2.5: Flow Control Unit [5] Dual Float Valve (DFV) The DFV (Figure 2.6) terminates the DDS into a conventional BHA. Includes a flow x- over from the annulus into the return channel of the DDS and include valves to isolate the drill sting during connections. Figure 2.6: Down hole valve system 14
 solution is to reduce the torque by causing a buoyancy effect on the drill string, allowing longer horizontal reach. Figure 2.")
15 Heavy Over Light The Reelwell Multi Gradient System (RMGS) allows for the use of a heavy static mud in the well annulus and a lighter active drilling fluid. The main purpose of Heavy Over Light (HOL) solution is to reduce the torque by causing a buoyancy effect on the drill string, allowing longer horizontal reach. Figure 2.7 shows the HOL configuration, with the red fluid in the annulus representing the heavy static fluid. The blue fluid inside the DDS represents the light drilling fluid. The well annulus is connected to the FCU allowing kill mud to be pumped down the annulus. For a more detailed description of HOL see ref. [10] Figure 2.7: HOL fluid configuration [10] 15
.")
16 3. Basics of well control Well control is one of the most important issues during the planning and drilling of a well. The main purpose of well control is to prevent unwanted inflow of fluid into the wellbore, which can lead to kicks and in worst- case blowouts (Figure 3.1). Especially during ERD a well- designed plan for well control is very important, as the margins becomes smaller the further you drill. In this section, the basics of well control will be discussed and methods and procedures for well control in conventional drilling will be compared to the Reelwell Drilling Method. This part of the comparison will be based on literature review, and in later sections simulations for both methods will be performed. Figure 3.1: Blow out 16
17 3.1 What is a Kick? A kick is a well control problem that occurs when you get unwanted influx of formation fluid into the wellbore due to a BHP lower than the formation pressure. A too low mud density is considered the main reason for a kick, this is called an underbalanced kick, and occurs because the mud column itself in not enough to balance the formation pressure. An induced kick happens due to dynamic effects such as surge and swab, this can happen even when the well is overbalanced. When a kick is detected, the well has to be shut in as soon as possible. If a kick is not detected in time, it can cause a blowout. There are two kinds of blowouts, surface and underground. A surface blowout is when an uncontrolled flow of formation fluids reaches the surface facilities, with potentially catastrophic consequences for rig personnel, environment and equipment. An underground blowout can happen even if the personnel close the BOP in time. When a high- pressure zone is penetrated, the pressure in the well builds up until a weaker formation is fractured, and an uncontrolled flow of formation fluids from the high- pressure zone into the new formation occurs. Even if an underground blowout might not be as dangerous for surface equipment and personnel, it can be even more expensive than a surface blowout, since the drilling of a secondary relief well might be the only solution. After the kick has been detected and the well shut in, the pressure in the well has to stabilize before the kick can be circulated out. There are different methods of circulating out the kick and killing the well; the 2 most common are Drillers Method and Wait & Weigh. For both methods, the goals is to circulate out the influx by keeping the BHP constant and pump down a new, heavier mud, which is able to balance the formation pressure on its own. 17
18 3.2 Reasons for kick A kick occurs when the formation pressure exceeds the hydrostatic pressure in the well. However, other factors like porosity and permeability are also of importance. For example, for a slightly underbalanced wellbore a kick is less likely to occur if the permeability and porosity is low. The differential pressure between the wellbore and formation has to be higher than the pressure needed to push the fluid out of the formation. Reasons for kick can be [1]: Insufficient mud weight Improper hole fill- ups during tripping Swabbing Gas cut mud Lost circulation Mud weight Insufficient mud weight is one of the predominant reasons for kick. The mud column in the well is the primary well barrier and if the mud weight is too low it will not be able to balance the formation pressure, thus risking a kick. Especially when drilling into a permeable formation with a high pore pressure. When drilling into a formation with an abnormal formation pressure, the mud weight of the mud already in the wellbore is usually not enough. When drilling the pressure fall from pumping the mud will apply an additional pressure to the borehole so a lighter mud is possible. However, in most conventional operations mud heavy enough to balance the formation pressure on its own is used. Failure to keep hole full Improper hole fill- ups during trips is another predominant cause of kicks. When tripping the drill string out of the hole the volume originally occupied by the drill string will have to be filled with mud. If the volume isn t replaced by mud while tripping, the mud column height in the annulus will decrease, causing the hydrostatic pressure in the well to decrease. Because of this it s very important to pay attention when tripping, and if needed the trip tank is used to refill the well. 18
19 Swabbing Swabbing means to pull the drill string out of the borehole. This will cause a piston like effect causing the effective hydrostatic pressure below the drill collar to fall, risking influx. Pulling speed, mud properties, hole configuration and balled equipment are variables that affect swab pressures. Cut mud Cut mud means gas contaminated mud and can sometimes cause a kick, although it s not a common cause. Gas cut mud occurs when drilling in formations containing hydrocarbons. Small amounts of gas from the drilled formation will be brought to surface along with the cuttings and will expand potentially causing a kick. However in most cases this is a very small amount, usually not enough to cause a kick. Lost circulation In the case of lost circulation, the mud level in the annulus will sink, causing the hydrostatic pressure to decrease, potentially causing a kick. 19
20 3.2 Kick detection Warning signs and indicators of a kick can be observed at surface. The warning signs are identified as primary or secondary relative to their importance. Warning signs include [1]: - Flow rate increase - Pit volume increase - Flow when pumps are off - Pump pressure decrease and pump stroke increase - Improper hole fill- up on trips - Change in string weight - Drilling break - Cut mud weight Flow rate increase (Primary indicator) An increase in flow rate with constant pump rate is a primary indicator. Increased flow can be interpreted to mean an influx from the formation is aiding the pumps in moving fluid up the annulus. Pit volume increase (Primary indicator) If the pit volume increases while pumping at a constant rate this is an indicator of influx, displacing the mud in the wellbore causing the pit volume to increase. Flow with pumps off (Primary indicator) If the well continues to flow when the pumps are turned off could mean a kick in progress. An exception can be if the mud in the drill string is considerably heavier than the mud in the annulus due to a slug. Improper hole fill- up (Primary indicator) When the drill sting is tripped out of the hole, the mud level should decrease by a volume equivalent of the volume of the removed drill pipe. If a mud volume less than expected is required to bring the mud level back to surface, a kick might be in progress. 20
21 Pump pressure decrease and stroke increase (Secondary indicator) A change in pump pressure may indicate a kick. If an influx occurs there s a chance the mud might flocculate temporarily increasing the pump pressure. As the influx continues to displace heavier mud the pressure might start to decrease. As the fluid in the annulus becomes less dense, the mud in the pipe will fall and the pump rate might increase. This is considered a secondary indicator as other drilling problems might cause the same signs. A washout in the open hole annulus or a pipe twist- off can cause the same signs, however, one should check for a kick if these signs occur. String weight change (Secondary indicator) Changes to the weight of the drill string might be an indicator that an influx of formation fluid has decreased the density of the mud in the wellbore decreasing the effect of buoyancy. An increased observed weight at surface would indicate an influx of light fluid. Drilling break (Secondary indicator) A drilling break is an abrupt increase in penetration rate. When the drilling rate suddenly increases, it means the bit has entered a new formation, which is assumed to have a potential to kick. For example, drilling from a shale formation to a sandstone formation might cause an increased penetration rate. However, an increased rate doesn t necessarily have to mean a kick is in progress, just that the new formation have the potential to kick. Recommended practice in the case of a drilling break is to continue to drill a few feet into the new formation, then stop and check for flowing formation fluids. Cut mud weight (Secondary indicator) Reduced mud weight observed at the flow line can occasionally cause a kick to occur. The reduction in mud weight due to expanded gas from the cuttings is usually very small, and if the well did not kick in the time needed to drill the formation containing gas and transport it to the surface, there s just a small possibility it will kick. Generally, gas cuttings only indicates that the formation drilled contains gas, and doesn t necessarily mean the mud weight have to be increased. 21
22 3.3 Well control methods in conventional drilling Shut- in procedures If one or more kick indicators occur, steps should be taken to shut in the well. Even when there s doubt about if there s a kick or not, the well should be shut in and the pressures checked. A small flow should be treated the same as a full flowing well as it potentially could lead to a big blowout. There have been concerns about pipe- sticking and underground blowouts as a result of shutting the well in, but when there s a possibility of a kick the primary concern should be to safely kill the well and the secondary concern to avoid pipe sticking. As for underground blowout there s a bigger chance of this occurring if the well is able to flow for a while after the initial kick detection compared to shutting in the well immediately after detecting the kick. Initial shut- in Two different methods are used for initial shut- in, hard and soft. There have been discussions about which one should be used. Hard shut- in means to close the annular preventers immediately after the pumps are stopped. In soft shut in the choke is opened prior to closing the annular preventers, and shut after the annulus is closed. The main difference between the two methods is the pressure change in the annulus after shut- in. The main argument for choosing the soft shut- in is that by using the hard shut- in, a water hammer effect will occur causing a spike in casing pressure. It also provides an alternate mean of well control in the case of excessive casing pressure (low choke pressure method). However, the water hammer effect has no proven substance [8], and the low choke pressure method is an unreliable method. The main argument against the soft shut- in is that a continuous influx is allowed for the duration it takes to execute the procedures. 22
23 Obtaining and interpreting shut- in pressures [1] Shut- in pressures are the stabilized surface pressures in the pipe and casing when the well is closed. These pressures are called shut- in drill pipe pressure (SIDPP) and shut- in casing pressure (SICP). Both pressures are important, but mainly the drill pipe pressure is used in killing the well. When a kick is detected and the well shut in, the pressure at surface will build up due to influx of formation fluid into the wellbore and the difference between the hydrostatic mud pressure and the formation pressure. The surface pressure will build until it is high enough to balance the formation pressure. When the pressures have stabilized the surface pressure plus the hydrostatic pressure from the column of mud and influx fluid should be equal to the formation pressure. At this point the influx should stop. SIDPP + Drill pipe mud hydrostatic pressure = Bottom hole formation pressure (1) SICP + Annular mud hydrostatic pressure + Annular influx hydrostatic pressure = Bottom hole formation pressure (2) Shut- in pressure is equal to bottom- hole formation pressure minus the hydrostatic pressure of the mud column. As the annulus will contain formation fluid, which has a lower density than the mud, the SICP will always be higher than the SIDPP. Trapped pressure [1] Trapped pressure is any pressure in the pipe or casing more than needed to balance off the formation pressure. Reasons for trapped pressure can be that the well was closed before the pumps were shut off, or gas migrating up the annulus causing it to expand. Using recorded pressures including trapped pressure will cause errors in the kill calculations. As the trapped pressure isn t needed to balance the formation pressure, it can be bled off without causing any additional influx. It should be bled from the casing, as this is where the choke is located and to avoid contamination of the mud in the drill pipe. Since the SIDPP is a direct 23
24 bottom- hole pressure indicator, it should be used as a guide when bleeding the trapped pressure. If bleeding is continued after the trapped pressure is bled, more influx will be allowed into the wellbore. Therefore, the pressure should be bled small amounts at a time, then closing the choke before observing the pressure in the drill pipe. The trapped pressure is bled of when the SIDPP stops to decrease. This will be the true SIDPP, and should be used for further calculations. Observed SIDPP = True SIDPP + Trapped pressure (3) True SIDPP = Formation pressure Hydrostatic mud pressure (4) Observed SIDPP = Formation pressure Hydrostatic mud pressure + Trapped pressure (5) As the Formation pressure and the hydrostatic mud pressure in the drill pipe is constant, the observed SIDPP will stop decreasing when the trapped pressure is 0, and observed SIDPP is equal to true SIDPP. Kill weight mud calculation After a kick is detected and the well shut in it is necessary to calculate the mud weight needed to balance the formation pressure. Kill weight mud is defined as the exact weight needed to balance the well. Since the SIDPP is defined as a bottom hole pressure gauge, it can be used to calculate the K.W.M. Kill mud formula: KWM = SIDPP OWM (6) depth KWM = Kill Weight Mud, ppg 19.23= Reciprocal of 0.052, ppg/psi/ft Depth= TVD, ft OWM= Original weight mud in drill pipe, ppg Since the casing pressure is not used in the formula, a high SICP does not necessarily mean a high KWM is needed. The same is true for pit gain [1]. 24
25 Well control procedures Several methods of circulating out a kick have been developed over the years. Prior to the early 1960s, keeping the pit level constant, also known as the barrel in - barrel out method, did the circulation of the influx. When the influx was mostly liquid, the method was successful, but if the influx was gas, the result could be disastrous. In the late 1950s and early 1960s, some began to realize that the barrel in - barrel out method wasn t reliable. If the influx was gas, it had to be allowed to expand as it came to the surface. [2] The most common kill procedures are the driller s method and wait & weigh. Others are the concurrent method, volumetric method, bull heading etc. Mainly driller s method and wait & weigh will be discussed here Driller s Method Driller s method is most commonly used well control procedure. It is also called the two circulation method, since the influx is circulated out before kill mud is added. It requires less complicated calculations than wait & weigh and is considered easier to use. The first circulation is started as soon as the well is shut in and the SICP and SIDPP have stabilized. The purpose of the first circulation is to circulate the influx out of the well, using the original mud weight. The bottom hole pressure is held constant for the entire procedure, preferably slightly higher than the formation pressure, to avoid further influx into the wellbore. When starting the pumps, casing pressure is held constant until kill rate is reached. Then the drill pipe pressure is held constant to keep the bottom hole pressure equal to or slightly higher than formation pressure. The drill pipe pressure is held constant until the influx is circulated out. If the influx is gas, it will expand as it is brought up the wellbore, causing an increase in pit volume and casing pressure. When the entire influx is circulated out, the well is shut in, and casing and drill pipe pressures recorded. ((1) in Figure 3.2)) 25
26 Figure 3.2: Drill pipe pressure during Drillers Method [19] These should now be equal. If not, there might still be influx left in the well, or trapped pressure. Before startup of the second circulation, the kill mud weight must be calculated and prepared, kill mud weight is calculated using equation 6. The second circulation is then performed to kill the well. Kill mud is pumped down the drill string to displace the original mud. First the pumps are brought to kill rate by keeping the casing pressure constant. The casing pressure is held constant until the kill mud reaches the bit ((2) in Figure 3.2), to keep bottom hole pressure constant. When the kill mud reaches the bits and starts to go up the annulus the drill pipe pressure needs to be kept constant until the mud reaches the surface. When the kill mud reaches the surface the pumps are shut down and the drill pipe and casing pressures recorded. These should both be zero if the kill operation was successful. If not means there s still influx left in the well Wait & Weigh The wait & weigh method, also called engineers method or one circulation method [1]. The main difference compared to driller s method is that wait & weigh is done in only one circulation. As for driller s method the well is shut in when the kick is detected, and the casing and drill pipe pressures are allowed to stabilize. The SICP and SIDPP is then recorded and SIDPP is used to calculate kill mud weight. Since the operation is done in only one circulation, the kill mud 26
27 needs to be prepared before the circulation can start. A drill pipe schedule also has to be figured out. Since the drill pipe is full of the original mud and the influx is still in the annulus when kill mud circulation is started, both hydrostatic pressures will change until the kill mud reaches the bit. Because of this it s not enough to keep one of the pressures constant wile pumping. At the beginning of the circulation, the drill pipe pressure will be SIDPP plus pumping pressure ((3) in Figure 3.3). This should be decreased linearly until the kill mud reaches the bit. At this point, the drill pipe pressure should be equal to pumping pressure ((4) in Figure 3.3) since the hydrostatic column of kill mud should balance the formation pressure. Since the drill pipe now is completely filled with kill mud, the drill pipe pressure should be kept constant for the rest of the circulation. When the influx is circulated out and the well is filled with kill mud the pumps are shut down and surface pressures recorded. As for the driller s method both drill pipe and casing pressure should be zero. If not there s still influx left in the well. Figure 3.3: Drill pipe pressure during Wait & Weigh [19] 27
28 3.4 Well control considerations for RDM Most conventional well control methods can be applied when using RDM [5], however, there are a few differences. In this section different well control procedures will be discussed and how they will work during ERD using the RDM. Causes of kick and detection The different reasons for a kick happening will also apply when using the RDM. Managed Pressure Drilling will help keeping a stable BHP, decreasing the chance of well control problems. In the case of lost circulation, a sliding Piston can be used to limit the loss, by isolating the annulus fluid above it. Most kick detection methods will also be the same when using RDM. Due to less active fluid volume, a pit gain of under 100l (under 2/3 bbl) can be recorded, [4] resulting in quicker reaction times and smaller kick size. Smaller active drilling mud and return through small diameter IP will cause higher surf pressure for same kick size (longer gas column). Due to the kick is circulated out the inner pipe the casing shoe pressure will not be affected, assuming the influx doesn t migrate up the well annulus. Shut- in and kill procedures Detailed comparison of shut- in and HOL kill procedure and driller s method in appendix E. 28

29 3.4.1 Heavy Over Light return up inner pipe kick circulation method The HOL return up inner pipe is a kill method developed for the Reelwell Drilling Method. It is performed in 3 separate circulations, shown in Figure 3.4. The kick is circulated out through the inner pipe and the kill mud is pumped down the well annulus. Heavy Over Light means using a heavy mud in the well annulus and a lighter mud as the active drilling fluid. [9] Figure 3.4: HOL return up inner pipe circulation steps [9] Calculate kill mud weight Pump down inner annulus at very slow circulation rate and record inner annulus pressure. Record casing pressure and pressure to open Inner Pipe Valve (IPV). Apply safety margin to heavy mud in annulus. Start mixing new heavy mud for circulation 2 and simultaneously go to circulation 1. Ensure that a pit plan has been prepared and that means of volume control is in place as mud with three different densities are involved. Circulation 1 - Circulate light mud down Inner Annulus - Take returns up Inner Pipe through the rig choke - Use rig choke to keep well annulus pressure stable - Circulate until influx is out and the gas reading is down 29
30 Circulation 2 - Circulate light mud down Inner Annulus at a very slow constant rate to monitor BHP - Pump kill mud down the well annulus. The rate can be increased until max pump pressure is reached. - Take returns up Inner Pipe through the rig choke - Adjust rig choke to keep Inner Annulus pressure stable - Stop pumping when kill mud at FXO Circulation 3 - Circulate light mud down Inner Annulus to displace kill mud from Inner Pipe - Take returns up Inner Pipe through rig choke - Adjust rig choke to keep well annulus pressure stable - Continue until kill mud is displaced out of Inner Pipe If influx is expected taken at the bit, it is sufficient to pump kill mud down to the casing shoe. If influx is taken behind the FXO, circulation 2 can contain influx. [9] 30

31 3.5 Well control considerations in Extended Reach Drilling Although there are a lot of factors limiting the possible reach of a drilling operation, well control is very important, especially when it comes to safety. Losing control of a well can in the worst- case scenario lead to a blowout. Compared to vertical wells, most of the basic well control procedures will be the same for horizontal/extended reach wells, such as kick reasons, detection methods, shut- in and kill procedures. However, there are also differences, which will be discussed in this section. Even though ERD doesn t necessarily have to mean that the well has a completely horizontal section, the situations described assume a well with a horizontal section. ECD for long horizontal sections One of the limiting factors of conventional ERD is the ECD in the horizontal section. For very long horizontal open hole sections the ECD will cause a high BHP, risking formation fracture and lost circulation. Reducing circulation rate and mud weight can reduce the BHP, but this on the other hand can cause a kick at the casing shoe, where the ECD will be much lower compared to TD (Figure 3.5). When using RDM this problem will be eliminated due to no flow going through the well annulus, giving a static gradient. [13] Figure 3.5: RDM vs Conventional dynamic gradient 31
32 Faults During horizontal drilling, the formation pressure will usually stay the same as long as the TVD is constant. However, drilling through faults can cause abrupt changes in formation pressure, both higher and lower than the normal formation pressure. For example, drilling trough two or more originally unconnected faults, where one or more has an abnormally high pressure, can lead to an underground blowout. On the other hand, lost circulation can occur by drilling into a low- pressured fault. [1] Influx volumes Most extended reach wells is designed to expose more of the producing formation to the wellbore than vertical wells [1]. Because of this the influx rate into the wellbore might be significantly higher than for vertical wells, when the conditions of pressure differential and time of underbalance otherwise are the same. Higher influx rate mean a greater total influx volume by the time the well is shut in, potentially causing high pressures that can burst the casing or result in an underground blow out. Kick tolerance Equation 7 is used to calculate the kick tolerance of a vertical well, where LVkc is vertical length of the kick. Compared to a vertical well, the vertical length of a kick in an extended reach well is close to zero, assuming the entire influx volume is located in the horizontal section of the well. Setting LVkc to zero in eq. 7 will cause the kick tolerance to be higher in a horizontal well compared to a vertical well [11]. This implies that horizontal wells have a greater tolerance to contain a kick without fracturing the weakest formation than vertical wells. When using RDM the influx is taken up the inner pipe, leaving the mud in the annulus static and thus the shoe pressure unaffected by the kick circulation. K = D! D!" ρ!"#$ ρ! L!"# D!" ρ! ρ!" (7) 32
33 K= Kick tolerance lbm/gal Ds= Casing shoe depth ft DVt= TVD ft ρfrac= fracture equivalent density lbm/gal ρl= Liquid density lbm/gal ρl= Kick density lbm/gal Shut- in procedures The procedure for shut- in is the same for horizontal wells as for vertical wells. However, it has been shown that hard shut- in should be used in most situations, since the water hammer effect has been proven to be insignificant [8]. Since the influx rate is likely to be higher in extended reach wells, hard shut- in is preferred, as soft shut- in is more time consuming, causing a larger volume of influx to be allowed into the wellbore. SICP and SIDPP in a horizontal well Assuming the kick happens due to drilling into a high- pressure formation in the horizontal section of the well, and the well is shut in time to contain the influx in the horizontal section, the recorded SICP and SIDPP will be equal. Figure 3.6 shows an example of shut- in pressures as a function of kick volume for a horizontal well [14]. Because of this, a small amount of gas left in the horizontal section after a kill operation will not affect SICP as in a vertical well. Therefore it is no way to tell if there is left influx from the shut- in pressures. If there is the remaining gas will expand when it is circulated up the vertical section when drilling continues, possibly causing a second kick. Because of this, kicks should be circulated out with the bit at the bottom of the hole in horizontal wells, to avoid influx being left behind below the bit. 33
34 Figure 3.6: SICP and SIDPP as a function of kick volume in horizontal well [14] Swabbing Because the formation pressure usually doesn t change over the horizontal section in extended reach wells, tripping out of the well will be more critical than in vertical wells, as the pressure drop from swabbing will be a function of the measured length of the pipe [11]. Also, for a swabbing induced kick, the shut- in pressures will remain zero if the influx stays in the horizontal section. Gas migration rates For horizontal wells, the gas migration rates will be zero, even when using WBM. Of course, this is only the case when the gas is located in the horizontal section and the well is shut in. 34
35 Drill pipe pressure schedule Displacement of the mud in the drill string with heavier kill mud is usually aided with the use of a pressure schedule, to control the BHP at all times. It shows the surface drill pipe pressure needed to balance the formation pressure. The drill pipe pressure needed will decrease as the kill mud is pumped down. For vertical wells this decrease is linear, from the point the kill mud enters the pipe until it reaches the bit. For horizontal wells the pressure schedule will be different. The difference between vertical and horizontal is shown in Figure 3.7. Overbalance will occur if a vertical pressure schedule is used, causing a risk of lost circulation [1]. Figure 3.7: Illustration of drill pipe pressure schedule for vertical and horizontal wells 3.6 Which circulation method to choose for horizontal wells Influx circulation Highly deviated and horizontal wells might require more than one circulation to get rid of all the influx, because of gas pockets in the top side of the inclined section. If the horizontal section has an inclination of more than 90 degrees, the influx will accumulate at the end of the section, making it even more difficult to circulate it out. 35
36 Hole problems A horizontal section means higher chance of cuttings to settle and accumulate. Better to start circulating right away. Casing shoe pressure One of the advantages of Wait & Weigh is that is can might cause a lower pressure at the casing shoe. However in horizontal wells, this problem will be of less significance, as the casing shoe usually is located at nearly the same depth as the TVD of the well. Mud mixing time and circulation time For long horizontal wells, a large volume of kill mud is required, and depending on the mixing capabilities of the rig, this can be time consuming. This is especially the case for older rigs. By using Driller s Method, circulation can be started as soon as the shut- in pressures are recorded. However, one extra circulation is required when using DM, increasing the total circulation time. The total time needed for each of the methods therefore depends on both mixing time and circulation time. [6] Formation ballooning Formation ballooning can occur in certain rock formations, and can easily be misinterpreted as kick. Driller s Method allows reassessing the situation after circulating with original MW. [6] Considering these factors, Driller s Method should be the best choice for extended reach drilling. This is also supported by other sources [6, 7]. For the simulations performed, mainly Driller s Method will be the used. 36
37 4. Well control simulation Two different wells were used for the well control simulations, one shallow extended reach well with a total MD of 1500 m, and one ultra- extended reach well with MD m. Both were drilled from an onshore location. For the conventional simulations Landmark Wellplan was used. Only well control problems were considered, using the simulators kick tolerance mode. The simulations were done assuming a kick while drilling at TD, into an over pressured formation. For the RDM simulations DrillSIM 5 was used. This is a simulator developed to use the RDM well geometry. The same casing and hole sizes as for the conventional were used, but different drill pipe sizes, as the dual drill string was used. Also when using DrillSIM the kick was assumed to occur at TD during drilling. 37
38 4.1 Simulation arrangement Well 1 - Shallow extended reach well geometry The well was constructed as a vertical, bend and horizontal extended reach well. The KOP was set at 27m, followed by a build section of 473m. The casing was set at the end of the build section, at 500m MD. The final inclination was 93 O. The operational window between fracture and pore pressure was 8,84ppg and 15,51ppg respectively. The open hole well diameter was 8,5. Well, casing and drill pipe data is found in tables Figure 4.1 shows the section view of well 1. The pore and fracture pressure gradients was assumed to be the same for the entire open hole section. KOP 27 m 88,58 ft Casing Shoe MD 500 m 1640,42 ft (End of build section) Casing Shoe TVD 316,8 m 1039,5 ft Well depth MD 1500 m 4921,3 ft Well depth TVD 264,5 m 867,8 ft Open hole diameter 8,5 in Pore Pressure 10,4 kpa/m 8,84 ppg Fracture Pressure 19,42 kpa/m 15,51 ppg Table 4.1: Shallow ERD well data Casing Length OD (in) ID (in) Capacity Weight Grade Data ft (bbl/ft) (lbs/ft) 1640,4 9,625 9,001 0, ,3 H- 40 Table 4.2: Shallow ERD casing data (Same configuration for Conventional and RDM) Drill pipe data Conventional Reelwell Drilling Method Length (ft) 4920,3 4920,3 OD (in) 5 6,625 ID (in) 4,276 5,901 IP OD (in) - 3,5 IP ID (in) - 3 Table 4.3: Shallow ERD drill pipe data 38
39 Section view TVD (m) Horizontal displacement (m) Figure 4.1: Shallow extended reach well section view 39
40 4.1.2 Well 2 - Ultra extended reach well geometry Well 2 was constructed the same way as well 1, with KOP at 1700m. The build section had a buildup rate of 2 degrees per 30 meters reaching the final inclination of 91 degrees at 3065 m MD. The entire horizontal section had a inclination of 91 degrees. The total MD of the well was 15800m. Figure 4.2 shows the section view of the well. Two sections of the well was used for the simulations; drilling at 5000 m with the shoe at 1000 m (section 1), and drilling at m with the shoe at m (section 2). Pore and fracture pressure was 9,33 and 15,4 ppg, respectively, and assumed to be the same for both open hole sections. The same drill pipe diameters were used for the two sections. KOP 1700 m 5577,43 ft BUR 2 deg/30m 2,032deg/100ft Well depth MD m 51837,27 ft Well depth TVD 2337 m 7667,5 ft Pore Pressure 9,33 ppg 1,12 sg Fracture Pressure 15,4 ppg 1,85 sg Table 4.4: Ultra ERD well data Hole size Casing OD Shoe depth m Shoe depth ft , , / ,20 13 ½ 10 ¾ 10, ,76 9 7/ ,27 Table 4.5: Ultra ERD casing data Drill pipe data Conventional Reelwell Drilling Method OD (in) 6,625 6,625 ID (in) 5,965 5,965 IP OD (in) - 4 IP ID (in) - 3,54 Table 4.6: Ultra ERD drill pipe data 40


41 Figure 4.2: Ultra extended reach well section view Figure 4.3 shows the first section from m was the only one with a significant vertical difference between the casing shoe and bottom hole. The TVD at 5000MD is 2525,5m giving a vertical difference of 1525,5m. Figure 4.3: Well 2 section 1 schematics Figure 4.4 shows the second section used for the simulations with a total MD of 15800m, and casing shoe set at 14000m MD. Inclination of the open hole section was 91 degrees. Figure 4.4: Well 2 section 2 schematics 41
42 4.2 Drilling fluid properties Wellplan simulation For the Wellplan simulations 4 different mud weights was used. These ranged from 9-12ppg for well 1 and from 9,5-12,5ppg for both sections of well 2. The rheology was the same for all simulations. In addition, a 10,12 ppg mud with different properties specially developed for Reelwells HOL configuration was used, to compare the results. The fluid data is given in table 4.7. Oil based mud was used for all simulations, even though this did not seem to give any different results than water based. Drilling fluid HOL fluid Well 1 MW (ppg) 9/10/11/12 10,12 Well 2 MW (ppg) 9,5/10,5/11,5/12,5 10,12 Rheology model Power law Herschel- Bulkley Rheology data Fann Data Fann Data Temperature 70 F 70 F Fann data Fann data HOL drilling fluid: fluid: Speed (rpm) Dial ( ) Speed (rpm) Dial ( ) Table 4.7: Wellplan simulation fluid data
43 4.2.2 DrillSIM simulation For the DrillSIM simulations only one fluid setting was used for each well. For well 1 and section 2 of well 2 HOL was used, with a heavy static mud in the annulus and a lighter drilling fluid. For section 1 of well 2 the same mud weight was used in the entire well. Except for different densities, the same fluid properties were used for all simulations. Well 1 Well 2 Section 1 Well 2 Section 2 Active fluid density (ppg) Static fluid density (ppg) Active fluid YP (Pa) Static fluid YP (Pa) Active fluid PV (cp) Static fluid PV (cp) Table 4.8: DrillSIM simulation fluid data 43
44 4.3 Simulation results in conventional wells Landmark Wellplan TM was used for all the simulations of the conventional wells. Only the Well Control module kick tolerance was used. Simulations were performed using several different mud weights assuming kick while drilling into formations of various pressure gradients Simulation results Well 1 Because of the entire open hole section being above the casing shoe, and the same fracture gradient apply, a kick at TD shouldn t cause a big risk of fracturing at the shoe. Because of this, 4 different initial mud weights were used, ranging from 9-12 ppg. In addition a 10,12 ppg mud specially developed for Reelwells HOL arrangement was used. However, this didn t give any significant different results, except for the expected difference due to density. Both circulation rate during drilling and kill rate was set to 120 gallons per minute, as the rates didn t seem to affect the results much, and the main objective was to simulate the pressure development for different mud weights, kick intensities and influx volumes. 44
45 Kick tolerance Kick tolerance is defined as the maximum allowable influx volume that can safely be safely circulated out of the well without fracturing the formation at the casing shoe. Kick intensity is defined as the over pressure of the formation, given in ppg. For example, drilling into a formation with pressure equivatent to 11ppg with a BHP of 10ppg will cause a kick intensity of 1ppg. The maximum allowable influx volume presented in Figure 4.5 shows very constant pressures for different influx volumes. The reason for this is the small vertical difference between the shoe and TD. Because the casing shoe is located at the deepest point of the open hole section, and the entire section has the same fracture gradient, the formation at the shoe is the least likely to fracture. This means that values for max allowable influx volume cannot be obtained. Allowable inhlux volumes for 0.5 ppg kick intensity Shoe Pressure (psi) ppg 10 ppg 11 ppg 12 ppg Pore Pressure at Shoe Fracture Pressure at Shoe ppg HOL xluid Inhlux Volume (bbl) Figure 4.5: Allowable influx volume, well 1 (0,5ppg kick intensity) By choosing higher kick interval pressures giving greater kick intensities it is shown that the shoe pressure is starting to increase with total influx volume. However, because of the entire open hole section is assumed to have the same fracture gradient, this would cause the formation closer to total measured depth to fracture first. (Figure B.1 in appendix) 45
46 Shoe pressures Figure 4.6 presents shoe pressures during the kill procedure (Drillers method) for a 10 bbl influx. The pressure is increasing as the influx moves along the horizontal section before it decreases to initial pressure as the influx moves up the vertical section. The pressure increases back to the max value when the influx reaches the choke and falls back to starting pressure when the kick is circulated out. None of the curves come close to the fracture pressure but all of them drops below the pore pressure line at least once during the circulations. As all fluid densities used are greater than the pore pressure gradient, this shouldn t happen. The shoe pressure was also expected to stay more stable during the circulation, as the BHP during driller s method is supposed to be constant, and the shoe pressure should follow a similar pressure development, especially after the influx has passed the shoe. Shoe Pressures during circulation (10bbl inhlux, 0.5 ppg kick intensity) Shoe Pressure (psi) ppg 10 ppg 11 ppg 12 ppg Pore Pressure at Shoe Fracture Pressure at Shoe ppg HOL xluid Volume Pumped (bbl) Figure 4.6: Shoe pressure, well 1 (10bbl influx, 0,5ppg kick intensity) For the same initial mud weight and kick intensity, but different influx volumes, the max and min shoe pressures is showed to be the same during the circulation. The pressure development is different, because of the different influx volumes, causing the kick to reach the shoe and choke at different times. (Figure B.2 in appendix) 46
47 Max annulus pressure Figure 4.7 presents the max annulus pressures for the entire well when considering a 10 bbl influx and 0,5 ppg kick intensity. Only when using the 12 ppg mud the annulus pressure exceeds the fracture pressure, which occurs at a measured depth of approximately 4500 ft and below. Maximum Annulus Pressure (10 bbl inhlux, 0.5 ppg kick intensity) Measured Depth (ft) Annulus Pressure (psi) ppg 10 ppg 11 ppg 12 ppg Pore Pressure Fracture Pressure ppg HOL xluid Figure 4.7: Maximum annulus pressure, well 1 (10bbl influx, 0,5ppg kick intensity) Choke pressure Figure 4.8 presents the choke pressure for an influx volume of 10bbl and a kick intensity of 0,5 ppg. The max pressures ranges from approx psi. Max choke pressure occurs when the top of the influx reaches the choke. 47
48 Choke Pressure (psi) Choke Pressure (10 bbl inhlux, 0.5 ppg kick intensity) Volume Pumped (bbl) 9 ppg 10 ppg 11 ppg 12 ppg ppg HOL xluid Figure 4.8: Choke pressure, well 1 (10bbl influx, 0,5ppg kick intensity) Using a mud weight of 12 ppg and 10 bbl influx causes a max choke pressure from app for kick intensities 0,5-2,0 ppg (Figure 4.9). The different kick intensities doesn t cause a very big difference in max choke pressure, but a difference equivalent to the hydrostatic pressure difference of 0,5 ppg at the start (shut- in pressure) and end of the circulation. This is because the kick interval pressure has to be balanced by a higher choke pressure before the initial mud is displaced with kill mud. 250 Choke Pressure for different kick intensities (12 ppg MW, 10 bbl inhlux) Choke Pressure (psi) ,5 ppg 1,0 ppg 1,5 ppg 2,0 ppg Volume Pumped (bbl) Figure 4.9: Choke pressure for different kick intensities, well 1 (12ppg MW, 10bbl influx) 48
49 Figure 4.10 presents the choke pressures for different influx volumes, when using a 12 ppg mud weight and 0,5 ppg kick intensity. Greater influx volumes causes higher choke pressures and the max pressure to occur earlier during the circulation Choke Pressures for different inhlux volumes (12 ppg MW, 0.5 ppg kick intensity) Choke Pressure (psi) bbl 1 bbl 5 bbl 50 bbl 100 bbl Volume Pumped (bbl) Figure 4.10: Choke pressure for different influx volumes (12ppg MW, 0,5ppg kick intensity) Maximum obtainable choke pressure will occur if the entire annulus is evacuated to gas (Figure B.3 in appendix). This will cause a choke pressure slightly lower than the kick interval pressure, depending on the influx density. In this case the influx gradient was 0,011 psi/ft. 49
50 4.3.2 Simulation results Well 2 The simulation for this well was split into 2 different sections. - Drilling at 5000m MD, with the entire build up section as open hole and casing set at 1000m in the vertical section. - Drilling at 15800m MD, open hole section 91 degrees, casing set at 14000m. Pore and fracture pressure gradient were assumed to be the same for all open hole sections. Used initial mud weights 9,5-12,5 ppg Section 1: Shoe at 1000m, TD at 5000m Section 1 of well 2 is the only one with the casing shoe higher in the formation than the true depth. The shoe is located in the vertical section of the well at 1000m. As for well 1, both drilling rate and kill rate was set to 120 gpm, as the focus was on the effects of different mud weights, kick intensities and influx volumes. Max allowable influx volume Compared to well 1 section 1 of well 2 has obtainable values for max influx volume (Figure 4.11). This is because the shoe is located higher in the formation than the kick formation, which causes the shoe pressure to increase as the influx travels up the wellbore. The highest shoe pressure occurs when the top of the influx reaches the shoe, and this will be higher for larger influx volumes. The kick tolerance is defined as the max influx volume allowable without the formation at the shoe fracturing. The chart show kick tolerance for different mud densities, assuming 0,5ppg kick intensity. Higher density gives lower kick tolerance, because the difference between the mud and influx density is greater. 50
51 Allowable inhlux volumes for 0.5 ppg kick intensity Shoe Pressure (psi) Inhlux volume (bbl) 9.5 ppg 10,5 ppg 11.5 ppg 12.5 ppg Pore Pressure at Shoe Fracture Pressure at Shoe ppg HOL xluid Figure 4.11: Allowable influx volume, well 2 section 1 (0,5ppg kick intensity) Changing the kick intensity when using the same mud density gives a similar chart where the pressure difference between the curves is the additional hydrostatic pressure from the kick formation. When considering the same kick formation pressure a lower mud density gives a lower kick tolerance. (Figure B.4 in appendix) Shoe pressure Presented in Figure 4.12, the shoe pressures start of by decreasing as the influx moves along the horizontal section, then start to increase reaching the maximum value as it reaches the shoe before dropping to the initial pressure when the influx has passed the shoe. 51
52 Shoe Pressure during circulation (10bbl inhlux, 0.5 ppg kick intensity) Shoe Pressure (psi) Volume Pumped (bbl) 12.5 ppg 11.5 ppg 10.5 ppg 9.5 ppg Pore Pressure at Shoe Fracture Pressure at Shoe ppg HOL xluid Figure 4.12: Shoe pressure, well 2 section 1 (10bbl influx, 0,5ppg kick intensity) Figure 4.13 presents the shoe pressure when changing the influx volume. The pressure stays the same as long as the influx is located in the horizontal section of the well. The difference is shown from when the kick starts to move up the build/vertical section of the well until it has passed the shoe. Greater influx volumes show at faster increase in pressure and a higher max pressure as the influx reaches the shoe. Shoe Pressures for different inhlux volumes (9.5 ppg MW, 0.5 ppg kick intensity) Shoe Pressure (psi) Volume pumped (bbl) 1 bbl 5 bbl 10 bbl 50 bbl 100 bbl Pore Pressure at Shoe Fracture Pressure at Shoe Figure 4.13 Shoe pressure for different influx volumes, well 2 section 1 (9,5ppg MW, 0,5ppg kick intensity) 52
53 Max annulus pressure Figure 4.14 presents max annulus pressures. None of the pressures come close to fracturing the formation for a 10 bbl influx and 0,5 ppg kick intensity. Max Annulus Pressures (10 bbl inhlux, 0.5 ppg kick intensity) Measured Depth (ft) Annulus Pressure (psi) ppg 10.5 ppg 11.5 ppg 12.5 ppg Pore Pressure Fracture Pressure ppg HOL xluid Figure 4.14: Max annulus pressure, well 2 section 1 (10bbl influx, 0,5ppg kick intensity) Choke Pressure The shut- in pressures at the choke are approximately 230psi for all fluid densities when assuming 10bbl influx and 0,5ppg kick intensity (Figure 4.15). The pressure decreases as the influx is pumped along the horizontal section and starts to increase as it enters the vertical section. Max pressure is obtained when the influx reaches the choke. Final choke pressure is equal to shut- in pressure Choke Pressures (10 bbl inhlux, 0.5 ppg kick intensity) Choke Pressure (psi) Volume pumped (bbl) 9.5 ppg 10.5 ppg 11.5 ppg 12.5 ppg ppg HOL xluid Figure 4.15: Choke pressure, well 2 section 1 (10bbl influx, 0,5ppg kick intensity) 53
54 The choke pressure presented in Figure 4.16 seems to develop in the same way when using different kick intensities, with shut- in and final pressure differences equal to the difference in kick formation pressure. However, the difference between shut- in and max pressure seems to decrease with higher kick intensities Choke Pressures for different kick intensities (12.5 ppg MW, 10 bbl inhlux) Choke Pressure (psi) ppg 1.0 ppg 1.5 ppg 2.0 ppg Volume Pumped (bbl) Figure 4.16: Choke pressure for different kick intensities, well 2 section 1 (12,5ppg MW, 10bbl influx) The choke pressure presented in Figure 4.17 shows the same behavior as the shoe pressure when using different influx volumes, with the same pressure for all influx volumes before the influx enters the vertical section and is circulated out of the well. Max choke pressure occurs when the influx reaches the choke and increases with greater influx volumes. 54
55 Choke Pressures for different inhlux volumes (12.5 ppg MW, 0.5 ppg kick intensity) Choke Pressure (psi) Volume Pumped (bbl) 1 bbl 5 bbl 10 bbl 50 bbl 100 bbl Figure 4.17: Choke pressure for different influx volumes, well 2 section 1 (12,5ppg MW, 0,5ppg kick intensity) In the case of full evacuation to gas the choke pressure would be approximately 4900psi. That s about 700psi less than the kick formation pressure because of an influx density of 0,083psi/ft. (Figure B.5 in appendix) 55
56 Section 2: Shoe at 14000m, TD at m Section 2 of well 2 has a similar geometry to well 1, with the shoe at a greater depth than the influx formation. The same circulation and kill rate of 120gpm was used, and the same drilling fluids as for section 1. Allowable influx volume Figure 4.18 presents results similar to those for well 1, because the casing shoe is located in the horizontal section at a deeper point vertically than the influx formation. Allowable inhlux volume for 0.5 ppg kick intensity Shoe Pressure (psi) Inhlux Volume (bbl) 9.5 ppg 10.5 ppg 11.5 ppg 12.5 ppg ppg HOL xluid Pore Pressure at Shoe Fracture Pressure at Shoe Figure 4.18: Allowable influx volume, well 2 section 2 (0,5ppg kick intensity) Choosing kick intensities from 0,5 to 2,0 ppg gave no change in max shoe pressure, but for 2,5 and higher the maximum shoe pressure increased. However, the max pressure didn t increase with greater influx volumes. (Figure B.6 in appendix) 56
57 Shoe pressure The shoe pressures presented in Figure 4.19 showed the same behavior as for well 1, with increasing pressure as the kick moved along the horizontal section, decreasing when moving up the vertical and another top when reaching the choke. Shoe Pressure (10 bbl inhlux, 0.5 ppg kick intensity) Shoe Pressure (psi) Volume Pumped (bbl) 9.5 ppg 10.5 ppg 11.5 ppg 12.5 ppg ppg HOL xluid Pore Pressure at Shoe Fracture Pressure at Shoe Figure 4.19: Shoe pressure, well 2 section 2 (10bbl influx, 0,5ppg kick intensity) Using different influx volumes gives results similar to well 1. The max and min shoe pressure was the same for the different influx volumes, with different development when the influx moved up the vertical section. (Figure B.7 in appendix) 57
58 Maximum annulus pressure Figure 4.20 presents similar results as for well 1, with max annulus pressures increasing with measured depth. None of the simulations did exceed fracture pressure for a 10 bbl influx and 0,5 ppg kick intensity. Maximum annulus pressure (10 bbl inhlux, 0.5 ppg kick intensity) Measured Depth (ft) Pressure (psi) ppg 10.5 ppg 11.5 ppg 12.5 ppg Pore Pressure Fracture Pressure ppg HOL xluid Figure 4.20: Maximum annulus pressure, well 2 section 2 (10bbl influx, 0,5ppg kick intensity) Choke Pressure Choke pressures presented in Figure 4.21 show small differences for the different mud densities, when using the same influx volume and kick intensity Choke pressure (10 bbl inhlux, 0.5 ppg kick intensity) Choke Pressure (psi) ppg 10.5 ppg 11.5 ppg 12.5 ppg Volume Pumped (bbl) Figure 4.21: Choke pressure, well 2 section 2 (10bbl influx, 0,5ppg kick intensity) 58
59 Using different kick intensities gave a significant difference in choke pressure at the start and end of the circulation, as the kick formation pressure had to be balanced by the choke before the kill mud had been pumped (Figure 4.22). Choke pressure for different kick intensities (12.5 ppg MW, 10 bbl inhlux) Choke Pressure (psi) Volume Pumped (bbl) 0.5 ppg 1.0 ppg 1.5 ppg 2.0 ppg Figure 4.22: Choke pressure for different kick intensities, well 2 section 2 (12,5ppg MW, 10bbl influx) An increase in influx volume gave no significant change in shut- in pressure but higher pressure as the influx reached the choke (Figure 4.23). Choke pressure for different inhlux volumes (12.5 ppg MW, 0.5 ppg kick intensity) Choke Pressure (psi) Volume Pumped (bbl) 1 bbl 5 bbl 10 bbl 50 bbl 100 bbl Figure 4.23: Choke pressure for different influx volumes, well 2 section 2 (12,5ppg MW, 0,5ppg kick intensity) A full evacuation to gas gave a choke pressure of 4442 psi. In this case the influx had a density gradient of 0,079 psi/ft. (Figure B.8 in appendix) 59
60 4.4 RDM simulation using DrillSIM The RDM simulations were performed by using DrillSIM- 5 (version ) by Drilling Systems Lt. This is a drilling and well control simulator mainly meant for training. It is more time consuming to use than Wellplan and simulation results will not be as accurate, as is is operated more manually and in real time. Therefore, only a few cases were simulated using DrillSIM, to get a general impression of the well control capabilities using the RDM. The simulations performed included displacement of initial mud with lighter mud for HOL drilling, and HOL kill procedure. HOL was only used for well 1 and section 2 of well 2. The entire HOL kill procedure was only performed for well 1. For both sections of well 2 only the first circulation of the HOL kill procedure was performed, because of the time needed to do the entire simulation. Influx volumes used for well 1 was approximately 2, 5 and 14bbl, 2 and 10bbl for well 2 section 1 and 50 bbl for well 2 section 2. The accurate values are given in cuft in appendix C. As simulations in DrillSIM are performed in real time with the option to pause or speed up the simulation the logging of the different pressures is different than for Wellplan. For all of the simulations the different pressures were recorded continually every 2 seconds, even when the simulation was paused or the speed of the simulation was increased. Because of this the time on the x- axis will not represent the real time used. Only pump rate in spm, drill pipe pressure, choke pressure and casing pressure was logged. Pump rate in gpm was calculated using 4,32 gal/stk for both pumps used. However, this gave a rate higher than the rate in gpm used during the simulations. BHP and shoe pressure was calculated from casing pressure: BHP=Casing pressure + (Bottom hole TVD)*12*0,052 (8) Shoe Pressure=Casing pressure + (Shoe TVD)*12*0,052 (9) This was not possible for circulation 2 as the mud in the casing had to be static in order to use the casing pressure. 60
61 4.4.1 Well 1 The case simulated for the shallow extended reach well was a HOL kill procedure. The displacement of the mud in the well with lighter drilling mud prior to the kick is also included. An initial mud weight of 12 ppg was used. The active drilling fluid used was 9 ppg, leaving the well annulus filled with the initial weight mud. A kill mud density of 12,5 ppg was used Displacement of mud inside DDS with lighter drilling fluid HOL was used for the simulations for well 1, and because the DDS was initially filled with the 12 ppg mud, this had to be circulated out prior to drilling. At startup the pump rate was slowly ramped up until shoe pressure was about 810 psi, at this point the pump rate was 84 gpm. The pump pressure was increasing as the drilling fluid moved down the vertical and build section of the well, in order to keep BHP constant. The rate of 84 gpm was kept until the drilling fluid reached the end of the horizontal section on the way back through the inner pipe. As the drilling fluid started to move up the vertical section of the inner pipe the BHP started to drop and the pump rate was increased slowly. The BHP was kept at around 600 psi, 50 psi higher than static BHP in order to avoid the heavy mud of entering the drill string. Figure 4.24 represents the pump rate during the HOL fluid displacement; the procedure was started at approximately 300 seconds. The rate was logged as strokes per minute. Gallons per minute were calculated using 4,32 gal/stk. The calculated value was higher than the input pump rate during the simulations (Found in tables in appendix C). This is the case for all of the simulations, but the reason is unknown. 61
62 Pump rate HOL displacement - Well Pump rate (spm,gpm) Strokes per minutte Gallons per minute Time (seconds) Figure 4.24: Pump rate HOL displacement, well 1 Figure 4.25 represents casing, choke and drill pipe pressures from the HOL fluid displacement, as well as shoe pressure and BHP calculated from casing pressure. Pressures during HOL displacement - Well 1 Pressure (psi) Time (seconds) Casing Pressure Choke Pressure Drill Pipe Pressure BHP Shoe Pressure Pore Pressure at bottom hole Fracture Pressure at shoe Figure 4.25: Pressures during HOL displacement, well 1 62
63 Circulation 1 Circulate out influx through Inner Pipe The kick was taken at 1500 m MD during drilling at a 115 gpm pump rate. The influx was gas with 0,2 ppg density. The total influx volume after shutdown was 10,78 cuft. When the pressures had stabilized circulation 1 was started. The kick was circulated out the Inner Pipe by pumping down inner annulus at 115gpm. When the influx reached the vertical section, the flow rate was decreased and the choke was adjusted to keep the BHP as constant as possible until all of the influx was circulated out. DrillSIMs malfunctions mode was used to induce kick during the simulation. The kick was set at 1500m, with an influx rate of 1 cuft/s and an influx density assumed to be 0,2 ppg. In order to stop the influx, the malfunctions mode had to be turned off, causing the BHP to drop after the first circulation stage was initiated. Because of the bottom hole pore pressure being unaffected by the kick, the behavior would be more similar to a kick taken while swabbing, even though it happened while drilling. Figure 4.26 represents pump rate for circulation 1, for a 2 bbl kick. (Accurate volume is 10,78 cuft) Pump rate kill circulation 1 (2bbl) - Well1 Pump Rate, (spm,gpm) Time (seconds) Strokes per minute Gallons per minute Figure 4.26: Pump rate HOL kill circulation 1 (2bbl), well 1 63
64 Figure 4.27 represents well pressures during circulation 1 of a 2bbl kick. The choke pressure reached a maximum of approximately 300 psi. Kill circulation 1 (2bbl) - well1 Pressure (psi) Time (seconds) Casing Pressure Choke Pressure Drill Pipe Pressure BHP Shoe Pressure Pore Pressure at bottom hole Fracture Pressure at shoe Figure 4.27: HOL kill circulation 1 (2bbl), well 1 Two additional simulations were performed for circulation 1, assuming approximately 5 and 14 bbl influx volume. Other than the influx volume the same input parameters was used. When using greater kick volumes, the influx wouldn t stay concentrated in one slug, and was therefore circulated out as several separate slugs. 5 bbl influx (28,5 cuft) Figure 4.28 represents pump rate for circulation 1 of a 5 bbl kick. The pump rate was adjusted to keep the BHP stable during the circulation. 64
65 Pump rate kill circulation 1 (5bbl) - Well 1 Pump Rate (spm,gpm) Time (seconds) Strokes per minute Gallons per minute Figure 4.28: Pump rate HOL kill circulation 1 (5bbl), well 1 Figure 4.29 represents well pressures during circulation 1 for a 5 bbl kick. The kick was circulated out as 3 separate slugs, giving 3 spikes in choke pressure. Kill circulation 1 (5bbl) - Well 1 Pressure (psi) Time (seconds) Casing Pressure Choke Pressure Drill Pipe Pressure BHP Frac at Shoe Pore Pressure at bottom hole Fracture Pressure at shoe Figure 4.29: HOL kill circulation 1 (5bbl), well 1 65
66 14bbl influx (75,02 cuft) For the 14 bbl kick the pump rate was kept stable during circulation 1, using the choke to control BHP (Figure 4.30). Pump rate kill circulation 1 (14bbl) - Well Pump Rate (spm,gpm) Strokes per minute Gallons per minute Time (seconds) Figure 4.30: Pump rate HOL kill circulation 1 (14bbl), well 1 The kick was circulated out as 5 separate slugs, giving 5 spikes in choke pressure represented in Figure Kill circulation 1 (14bbl) - Well 1 Pressure (psi) Time (seconds) Casing Pressure Choke Pressure Drill Pipe Pressure BHP Shoe Pressure Pore Pressure at bottom hole Fracture Pressure at shoe Figure 4.31: HOL kill circulation 1 (14bbl), well 1 66
67 Circulation 2 Pump Kill Mud down Well Annulus Because of the constant bottom hole pore pressure, a heavier kill mud shouldn t be necessary, but was still performed in order to simulate all steps of the HOL kill procedure. A kill mud of 9,5 ppg was chosen and started to circulate down the well annulus as soon as the kick was circulated out the inner pipe. To keep a stable BHP, the circulation rate was slowly increased as the circulation down the inner annulus was decreased, until the wanted rates was reached. When the entire well annulus was filled with kill mud, the circulation was slowly shut down, while increasing the circulation down the inner annulus. Figure 4.32 represents pump rates for circulation 2 and 3. Pump 2 was ramped up during circulation 2, pumping kill mud down the well annulus. During circulation 2 the pump rate down the drill pipe was kept at a minimum. For circulation 3 only pump 1 was used Pump rate Circulation 2/3 - Well 1 Pump Rate (spm,gpm) Pump 1 - SPM Pump 1 - GPM Pump 2 - SPM Pump 2 - GPM Time (seconds) Figure 4.32: Pump rate HOL kill circulation 2/3, well 1 67
68 Figure 4.33 represents casing, choke and drill pipe pressures for circulation 2 and 3. Due to pumping kill mud down the well annulus, accurate values for shoe pressure and BHP couldn t be calculated from casing pressure. Kill circulation 2/3 2bbl - Well 1 Pressure (psi) Time (seconds) Casing Pressure Choke Pressure Drill Pipe Pressure Figure 4.33: HOL kill circulation 2/3, well Circulation 3 Circulate out any remaining Kill Mud When the entire well annulus was filled with kill mud one more circulation was performed by pumping down the inner annulus. The purpose is to circulate out the remaining influx and kill mud inside the drill string. The same fluid density was used as the bottom hole formation pressure was the same as before the kick, but in the case of drilling into an over pressured formation the density of the active fluid should also be increased in order to balance the new formation pressure. The pump rate down the inner annulus was slowly increased as the rate down the well annulus was decreased. The pump rate was increased during the entire circulation, in order to keep the BHP from dropping. Because of the increase in static fluid density, the final BHP was kept at about 630 psi at a pumping rate of 124 gpm. New BHP = Old BHP + (0,5*TVD*0,052) (10) (Increase BHP by hydrostatic increase of new static mud) 68
69 4.4.2 Well 2 section 1 Only circulation 1 was performed for section 1 of well 2. Two different influx volumes of approximately 2 and 10 bbl were used. As section 1 can t be considered extended reach it was driller without HOL, using the same fluid density of 12ppg in the entire well. Both kicks were taken at 4971m MD at a drilling circulation rate of 89 gpm. The influx density was set to 0,2 ppg bbl influx The pump rate was kept constant during the entire circulation (Figure 4.34), using the choke to control the pressures. 30 Pump rate kill circulation 1 (2bbl) - Well 2 section1 Pump Rate (spm,gpm) Strokes per minute Gallons per minute Time (seconds) Figure 4.34: Pump rate HOL kill circulation 1 (2bbl), well 2 section 1 Figure 4.35 represents the well pressures when circulating out the 2bbl kick. The maximum choke pressure was approximately 500 psi. 69
70 Kill circulation 1 (2bbl) - Well 2 section Pressure (psi) Time (seconds) Casing Pressure Choke Pressure Drill Pipe Pressure BHP Shoe Pressure Pore Pressure at bottom hole Fracture Pressure at Shoe Figure 4.35: HOL kill circulation 1 (2bbl), well 2 section bbl influx The 10 bbl kick was circulated out the same way, by keeping the pump rate constant (Figure 4.36). 120 Pump rate kill circulation 1 (10bbl) - Well 2 section 1 Pump Rate (spm,gpm) Strokes per minute Gallons per minute Time (seconds) Figure 4.36: Pump rate HOL kill circulation 1 (10bbl), well 2 section 1 70
71 The maximum choke pressure obtained when circulation the 10 bbl kick was approximately 800 psi (Figure 4.37) Kill circulation 1 (10bbl) - Well 2 section 1 Pressure (psi) Time (seconds) Casing Pressure Choke Pressure Drill Pipe Pressure BHP Shoe Pressure Pore Pressure at bottom hole Fracture Pressure at shoe Figure 4.37: HOL kill circulation 1 (10bbl), well 2 section Well 2 section 2 For section 2 HOL was used, so the fluid displacement was included. Only one kick of approximately 50 bbl was simulated, taken at MD m HOL mud displacement For the HOL fluid displacement the pump rate was increased during the entire circulation (Figure 4.38). The BHP was kept as close to fracture pressure as possible in order to avoid heavy mud from the annulus to enter the inner pipe. Due to high drill pipe pressure the max pump rate used was 182 gpm (Figure 4.38 shows a rate over 200 gpm). At this point the drill pipe pressure was approximately 5500 psi. (Pump limit was 7000 psi) 71
72 Pump rate HOL displacement - Well 2 section Pump Rate (spm,gpm) Strokes per minute Gallons per minute Time (seconds) Figure 4.38: Pump rate HOL displacement, well 2 section 2 Figure 4.39 represents the well pressures during the HOL fluid displacement for well 2. Casing pressure was kept close to the fracture pressure in order to avoid annulus fluid flowing into the inner pipe. Drill pipe pressure is increasing during most of the circulation, reaching a maximum value of approximately 5500 psi. Pressures during HOL displacement - Well 2 section 2 Pressure (psi) Time (seconds) Casing Pressure Choke Pressure Drill Pipe Pressure Casing Shoe Pressure BHP Pore Pressure at bottom hole Fracture Pressure at shoe Figure 4.39: HOL displacement, well 2 section 2 72
73 Circulation 1 Well 2 For the kick circulation the initial pump rate was 160, then decreased to 125 for the rest of the circulation (Figure 4.40). Pump rate kill circulation 1 - Well 2 section Pump Rate (spm,gpm) Time (seconds) Strokes per minute Gallons per minute Figure 4.40: Pump rate HOL kill circulation 1, well 2 section 2 A maximum choke pressure of approximately 3000 psi was obtained during circulation of the 50bbl kick. (Figure 4.41) 7000 Kill circulation 1 - Well 2 section 2 Pressure (psi) Casing Pressure Choke Pressure Drill Pipe Pressure Casing Shoe Pressure BHP Time (seconds) Pore Pressure at bottom hole Fracture Pressure at shoe Figure 4.41: HOL kill circulation 1, well 2 section 2 73
74 4.5 Comparison of DrillSIM and Wellplan simulations using similar inputs A simulation using similar input parameters in Wellplan was performed, to compare results for RDM and conventional. While the bottom hole formation pressure was constant during the entire DrillSIM simulation, it had to be set at 0,468 psi/ft (9 ppg) when using Wellplan, to be able to get the wanted outputs. Both driller s method and wait & weigh were considered for the comparison. Wellplan inputs well 1 Circulation Flow Rate 115 gpm Kick Interval Gradient 0,624 psi/ft 12 ppg Type of Influx Gas Kill Rate 115 gpm Total Influx Volume 2, 5 and 14 (bbl) Kill Mud Gradient 0,65 psi/ft 12,5 ppg Influx Gradient 0,011 psi/ft 0,2 ppg Table 4.9: DrillSIM Wellplan comparison input, well 1 Wellplan inputs well 2 Section1 /section 2 Circulation Flow Rate 89/182 (gpm) Kick Interval Gradient 0,624/0,676 psi/ft 12/13 ppg Type of Influx Gas Kill Rate (gpm) 89/125 Total Influx Volume 2 and 10/50 (bbl) Kill Mud Gradient 0,65/0,702 psi/ft 12,5/13,5 ppg Influx Gradient 0,083/0,079 psi/ft 1,6/1,5 ppg Table 4.10: DrillSIM Wellplan comparison input, well 2 Wait & Weigh was also included in the simulations, but only section 1 of well 2 showed any significant differences between Driller s and W&W. The rest of the charts from the simulations can be found in the appendix B. 74
75 4.5.1 Well 1 comparison Same as for the previous Wellplan simulations, the casing shoe pressures show large variations during the circulations (Figure 4.42). Shoe Pressure 1000 Pressure (psi) Driller's Method Wait & Weigh Pore Pressure at Shoe Fracture Pressure at Shoe 5bbl Driller's 5bbl W&W Volume Pumped (bbl) 14bbl Driller's 14bbl W&W 90 degrees 5bbl Figure 4.42: Shoe pressure Wellplan comparison, well 1 The BHP shows the same pressure development (Figure 4.43), even though the BHP is supposed to be constant during the circulation. The pressure variations decreased when increasing the kick intensity, and a kick intensity increase equal to the difference between the max and min BHP was required in order to get a constant BHP. By changing the inclination of the horizontal section from 93 to 90 degrees, both the shoe pressure and the BHP development changed to constant for the entire circulation. 75
76 BHP Pressure (psi) Wait & Weigh Driller's Method Pore Pressure at bottom hole Fracture Pressure at bottom hole Driller's 5bbl W&W 5bbl Driller's 14bbl Volume Pumped (bbl) W&W 14bbl 90 degrees 5bbl Figure 4.43: BHP Wellplan comparison, well 1 The maximum choke pressure obtained from well 1 was approximately 225 psi (Figure 4.44), significantly less than for the RDM simulations. 250 Choke Pressure Pressure (psi) Driller's Method Wait & Weigh Driller's 5bbl W&W 5bbl Driller's 14bbl W&W 14bbl Volume pumped (bbl) 90 degrees 5bbl Figure 4.44: Choke pressure Wellplan comparison, well 1 76
77 4.5.2 Well 2 comparison For Well 2 the choke pressures also showed much lower values than for the RDM simulations. Figure 4.45 represent the choke pressures for section 1, with a maximum pressure of approximately 290 psi for the 10 bbl kick. Choke pressure Pressure (psi) W&W 10bbl Driller's 10bbl Driller's 2bbl W&W 2bbl Volume Pumped (bbl) Figure 4.45: Choke pressure Wellplan comparison, well 2 section 1 The choke pressure from section 2 is represented in Figure 4.46, and shows a maximum pressure of approximately 620 psi. Choke Pressure 50 bbl inhlux Pressure (psi) Driller's Method Wait & Weigh Volume Pumped (bbl) Figure 4.46: Choke pressure Wellplan comparison, well 2 section 2 77
78 5. Discussion Several simulations were performed, both in Wellplan and DrillSIM, comparing well pressures when using several different inputs. The same well geometries and similar inputs were used for both simulators, in order to get comparable results. The Landmark simulations concerned conventional extended reach drilling, and the simulations were performed using different values for fluid density, influx volume and kick intensities. Mainly Driller s method was used as kill procedure, due to better extended reach capabilities. A few results using Wait & Weigh were also included, for comparison. The DrillSIM simulations focused more on the general pressure development during the HOL returns up inner pipe kill procedure, using kicks of different volumes. Displacement of the mud inside the DDS with a lighter drilling fluid used for HOL was also included. The question that will be discussed: Wellplan: Kick tolerance Shoe pressures Choke pressures DrillSIM: Development of well pressures Methods used for kill procedure Comparison: Kick tolerance, shoe and choke pressures Mud volumes and circulation times 78
79 5.1 Wellplan 5.1.1Kick tolerance Kick tolerance is defined as the maximum influx volume allowed into the wellbore without fracturing the formation at the casing shoe during the kick circulation. For extended reach wells, the shoe is usually located in the horizontal section, and a vertical depth similar to any kick formations drilled into. This means that as long as the kick formation pressure doesn t exceed the fracture pressure at the shoe, the amount of influx will not affect the risk of fracturing at the shoe. The simulation results for well 1 and well 2 section 2 confirm this, with constant shoe pressures unaffected by the influx volume. By increasing the kick intensity to 3,5ppg or more, the shoe pressure in well 1 started getting affected by the amount of influx, but at this point the kick formation pressure was close to the fracture pressure at the shoe, making the influx volume less important. For section 1 of well 2, the shoe was located in the vertical section of the well. When using the same kick intensity and different mud weights, it was shown the heavier mud caused the kick tolerance to decrease. Using the same mud but different kick intensities showed similar results, with higher kick intensities causing the kick tolerance to decrease. It can be seen form the charts that when comparing the same kick interval of 11ppg, the 9,5ppg mud gives a lower kick tolerance than the 10,5ppg mud due to the difference in hydrostatic pressure Shoe pressure When using driller s method, the BHP is supposed to be constant for the entire circulation. Due to the shoe being in the horizontal section for both extended reach wells the shoe pressure was expected to be similar to the BHP, without much pressure variations. However, this was not the case. For both well 1 and section 2 of well 2 the shoe pressure showed big fluctuations, with max pressures occurring when the kick was at the bottom of the vertical section and at the choke. The minimum pressures occurred at the start of the circulation, when the kick was in the vertical section and after the kick was circulated out of the well. For well 1 the pressures ranged between approximately 473psi and 667psi, and for well 2 between 5147 and 5892 (10bbl influx, 0,5 ppg kick 79
80 intensity). Later simulations showed that this was also the case for the BHP. The reason for this seemed to be the inclination of the wells, which were 93 and 91 degrees. By changing the inclination to 90 degrees, both shoe pressure and BHP was constant for the entire circulation. Changing the kick intensity affected the shoe pressure behavior. By increasing the kick intensity the minimum pressure increased, while the max pressure stayed the same. By increasing the kick intensity enough, the min pressure eventually became equal to the max pressure, giving a close to constant shoe pressure. This occurred at a kick intensity of approximately 0,248psi/ft (4,77ppg) for well 1 and 0,124psi/ft (2,38ppg) for well 2. For kick intensities above these values the shoe pressure development stayed the same. For section 1 of well 2 the shoe pressure was more as expected. The pressure decreased until the influx reached the end of the horizontal section, where it started to increase. Max pressure was reached when the influx was at the choke, before dropping to shut- in pressure, which stayed constant for the rest of the circulation. This section of the well also had an inclination of 91 degrees, but the results didn t seem to get as much affected by it as it showed constant BHP for low kick intensities Choke pressures The choke pressures showed more expected behavior for the extended reach wells, with a small decrease at the start of the circulation, and then constant until the influx reached the vertical section. Max pressure occurred when the influx was at the choke. The pressure at the end of the circulation was slightly higher than shut- in pressure, in order to balance the kick formation pressure. Using different kick intensities didn t cause a very big increase in pressure when influx was at the choke, but caused an increase of shut- in and final pressures equal to the increase in kick formation pressure. Increasing the influx volume didn t cause any increase in shut- in or final pressure but a significant increase in max pressure, equal to the hydrostatic pressure of the mud displaced by the additional influx. Section 1 of well 2 showed different behavior than the extended reach wells, with a decrease in choke pressure until the influx reached the end of the 80
81 horizontal section. The pressure then increased until max value when the influx reached the choke. Dropped then to a final pressure slightly higher than shut- in when the influx was circulated out. When using different kick intensities the pressures for each value were separated for the entire circulation, meaning a choke pressure difference of approximately the same as the kick intensity difference. Using different influx volumes gave results similar to the other wells; with the same choke pressure before the influx entered the vertical section and after it was circulated out. However, the increase in choke pressure as the influx moved up the vertical section was more gradual than for the extended reach wells. 5.2 DrillSIM Due to the different flow configuration of the Reelwell Drilling Method it s not directly comparable to conventional. By taking the influx through the inner pipe the kick tolerance question is eliminated, as the influx volume doesn t directly affect the annulus volume. Of course this is under the assumption that none of the influx migrates up the well annulus. Because of this, the shoe pressure isn t of the same importance, as it will follow the same development as the casing surface pressure and the BHP, due to the well annulus fluid being static. During the simulations drill pipe, casing and choke pressure was logged, while shoe pressure and BHP was calculated from casing pressure HOL displacement For well 1 and section 2 of well 2, the entire well was initially filled with the same mud, and in order to use Heavy Over Light the mud inside the DDS had to be displaced by a lighter drilling fluid. First the pump rate was ramped up as much as possible without letting the shoe pressure get to close to the fracture pressure. The same fracture gradient was used for the entire open hole section, and because of the annulus fluid being static is was equal risk of fracturing along the entire open hole. For well 1 the pump rate was then kept constant until the drilling fluid entered the vertical section on the return up the inner pipe. For well 2, problems occurred when the drilling fluid reached the bit and started the 81
82 return through the inner pipe. Even with a BHP significantly higher than the hydrostatic pressure of the annulus fluid, some of the heavy fluid from the annulus entered the inner pipe. This was solved by slowly ramping up the pressure when the drilling fluid entered the inner pipe, to keep the BHP from dropping and as close as possible to the fracture pressure. As the drilling fluid entered the vertical section, the BHP started to drop and the pump rate was increased in order to keep it from dropping to low, risking annulus fluid to enter the inner pipe. The pump rate was kept as high as possible, while keeping the BHP stable between the hydrostatic annulus fluid pressure and the fracture pressure. For well 2, increasing the pump rate caused an excessive drill pipe pressure, so the rate wasn t increased above 182gpm. For the rest of the displacement the choke was used to adjust the pressures. For well 1 and well 2 the total strokes of the displacement circulation was 1498 and 22718, respectively (at 4,32 gal/stk). Converting to barrels this gives 154 and 2337 bbl. In comparison the calculated values for the DDS volume was 150 and 1616 bbl. BBL=STK*4,32/42 (11) Circulation 1 Circulation 1 of the HOL kill procedure was the only step performed for all wells and influx volumes. For all simulations BHP, casing and choke pressure experienced a drop and drill pipe pressure an increase as the circulation was initiated. Well 1 3 different influx volumes was used, approximately 2, 5 and 14 bbl. Due to problems with adjusting the influx rate the kicks of 5 and 14 bbl got separated into several slugs. Slightly different methods were used for circulating out the kicks. For the two smallest only the pump rate was adjusted during the circulation. For the 2bbl kick the pump rate was decreased as the kick moved up the vertical section, and then increased as it went through the choke ending up at the initial pump rate. 82
83 The choke pressure reached a maximum of approximately 300psi, while the other pressures stayed quite stable through the circulation. The 5bbl kick was circulated the same way, but due to being separated into 3 slugs, it was experienced 3 spikes in choke pressure, of approximately 450,350 and 300 psi. If the kick had been concentrated in only one slug the max choke pressure would have been expected to be higher. Due to more variations in pump rate, the drill pipe pressure fluctuated more than for the 2bbl kick. The 14bbl kick was separated into 5 slugs and was circulated out by keeping a constant pump rate of 44 gpm until the entire influx was circulated out, only adjusting the choke. The max choke pressure of slightly more than 550psi occurred when the first slug reached the choke, followed by 4 pressure spikes as the other slugs reached the choke. For some reason pressure spike 2-4 increased from about 400psi to slightly less than 450psi, respectively. This was the opposite of the 5bbl simulation where there was a decrease in pressure for each pressure spike. The reason might have been the size of each slug, but these volumes were not recorded. Total strokes pumped for each of the simulations was 319, 297 and 425. In comparison the calculated inner pipe volume is 43bbl/418stk. Total strokes were higher for the 14bbl kick due to annulus fluid entering the inner pipe, which needed to be circulated out. Compared to the volume calculations the volume pumped for the 2 smallest kicks wouldn t be sufficient to displace the entire volume of the inner string. Well 2 section 1 For this section two kicks of approximately 2 and 10bbl were simulated. HOL was not used for this section, meaning the same fluid was used in the entire well. Both kicks were circulated out at a constant pump rate of 89gpm, using the choke to control the pressures. The pressure development was similar for both cases, with no significant fluctuations except for the max choke pressures, of approximately 400 and 800 psi. However, of the initial influx volumes of 12,81 and 51,84 cuft, 4,97 and 26,92 cuft was still left. This would have been circulated out during circulation 2, but this was not simulated for this well. Because of the 91- degree inclination, the remaining influx was kept from migrating up the annulus risking excessive shoe pressures. Total strokes pumped were 1904 and
84 Well 2 section 2 For the last section only one influx volume of approximately 50bbl was simulated. Due to problems with keeping the influx as a single slug for volumes any larger than a few barrels the pump had to be shut off while allowing the influx to accumulate before shut in. When the circulation was started the pump rate was ramped up to 160gpm and kept constant until the influx reached the end of the horizontal section. The pump rate was decreased to 125gpm and the choke used to control the pressures. The choke pressure experienced a steady increase and reached a maximum pressure of about 3100psi. 20,5 of initially 271,89 cuft influx was left in the well after the circulation. Total strokes pumped were In comparison the calculated inner pipe volume was 631bbl/6135stk Circulation 2 This step of the HOL kill procedure was only performed on well 1, in the same simulation as the 2bbl kick. After the kick was circulated out a second pump started circulating kill mud down the well annulus. Since the formation pressure was the same as before the kick, a heavier mud wasn t required but was increased with 0,5 ppg in order to check how the pressures would change. The BHP was kept stable by keeping the total pump rate constant. The kill mud pump rate was ramped up to a maximum of 29 and the rate down the drill pipe was kept at a minimum of 1spm. The kill mud rate was decreased during the circulation. When the kill mud reached the bit the pump rate was ramped down to 0 at the same time the rate down the drill pipe was ramped back up. The drill pipe pressure experienced a drop as the rate was ramped down at the start of the circulation and the casing pressure increased as the kill mud rate was increased. Total strokes were only 156 due to only pumped volume from pump 1 was being recorded Circulation 3 The last step of the kill procedure was to circulate out the remaining kill mud from the inner pipe. The pump rate was increased during the entire circulation. Because of the drilling fluid density not being increased the final BHP was 84
85 increased by an equal amount to the increased hydrostatic pressure of the kill mud. The total strokes pumped were Comparison A few simulations using similar inputs as for DrillSIM was performed in Wellplan, mainly to compare the shoe pressure, BHP and choke pressure of well 1. As for the previous Wellplan simulations the shoe pressure and BHP showed big fluctuations. When changing the inclination to 90 degrees, both shoe pressure and BHP changed to being constant, where shoe pressure (666,25psi) was equal to the max pressure for the 93- degree inclination and BHP between max and min (672,11psi). By comparison the pressures were approximately 700 psi (shoe) and 600 psi (BHP). However, this is not a good basis for comparison as the difference in shoe pressure and BHP for the 90 degree well is only due to pressure loss and none because of vertical difference. As for the choke pressures Wellplan gave pressures of approximately 30, 85 and 220 psi for influx volumes of 2, 5 and 14bbl. In comparison DrillSIM gave 300, 440 and 550 psi for the same influx volumes, even though the kick was circulated out in several smaller slugs, giving lower values than expected. Over all the results were as expected due to the return going through the low capacity inner pipe for the RDM. The HOL fluid arrangement will also have an effect on the pressure, as the annulus fluid controls the BHP. When circulating out the kick, the hydrostatic pressure of the light active fluid will not be enough to balance this pressure, causing higher choke pressure. A high choke pressure will cause less volume fluctuations from expanding gas, making it easier to keep the well pressure constant. This is because of significantly reduced differential flow volume out of and into the well during the kick circulation. Because the aim of ERD is to drill as far as possible horizontally, the TVD will be relatively shallow, and excessive choke pressure shouldn t normally be an issue. However, the comparison cannot be considered accurate due to too many uncertainties and differences between the simulations. 85
86 Mud volumes and circulation times Due to the already mentioned differences between the simulators there is no easy way of comparing mud volumes and circulation times from the simulations. For the Wellplan simulations the total volume pumped is shown in barrels but only the first circulation of Driller s method is considered. For DrillSIM only the pump rate was logged automatically. The total strokes pumped for the different circulations were manually recorded, but due to uncertainties and differences between the simulations there are limited benefits from direct comparisons. As for circulation times this is not given in the Wellplan result but can be calculated using volume pumped and pump rate. In DrillSIM the time was recorded in real- time, which was recording both when the simulation was paused and the speed set to 50 times normal. Due to the lack of results in terms of comparing mud volumes and circulation times for conventional and RDM, some simple calculations were performed (appendix A). The same drill pipe, casing and open hole diameters as for the simulations was used. Pipe connections and any open hole irregularities was not considered in the calculations. The calculations showed that for well 1 the active volume of mud when using RDM was less than the half of conventional (151:327). For a circulation rate of 120 gpm this meant circulation times of 15 min compared to 84 min for circulating out a kick, and 53 min compared to 114 min for displacing the entire active mud volume. For an entire kill operation in conventional using driller s method (2 circulations), the required time was 198 minutes. The total time needed to perform the entire HOL kill procedure (3 circulations) was in comparison 120 minutes, less than 2/3 of the time require for driller s method. For well 2 (only section 2 considered) the active mud ratio was 1616:4759. Assuming the same pump rate of 120 gpm this gave circulation times of 220 vs 1039 minutes to circulate out a kick and 566 vs 1666 minutes for the entire active mud volume. HOL kill procedure and driller s method were performed in 1825 and 2705 minutes respectively, meaning just over 2/3 of the time for RDM. The times calculated are theoretical, assuming constant circulation rate and not considering any stops or delays during the procedures. 86
87 6. Conclusion The main points of the literature review can be summarized as: Conventional - Horizontal reach limited by the ECD in the open hole wellbore - Drilling through pressurized faults causing risk of both kick and loss - Greater influx volumes due to more exposed kick formation - Higher kick tolerance - Driller s method preferred kill procedure Reelwell Drilling Method - ECD problem eliminated due to return flow through inner pipe - Built- in MPD for better pressure control - Less active fluid volume quicker reaction times - Kick tolerance and gas pocket problem eliminated due to kick circulation through inner pipe - Reduced hole problems due to cuttings transported through inner pipe - Higher choke pressure due to low capacity IP and HOL configuration - Different kill procedure In short, return through inner pipe has the potential of solving several well control problems, but will cause higher choke pressure during kill procedures. From the simulations, the main findings can be summarized as: Wellplan (conventional): - Confirmed high kick tolerance in horizontal wells - Choke pressures lower compared to RDM - Unreliable results due to inclinations over 90 degrees DrillSIM (RDM): - Problems with Influx of heavy annulus fluid during displacement - Max pump rate limited by drill pipe pressure - High choke pressure can help keeping the well pressures stable Mud volumes and circulation times: - From calculations: Well killed in approx. 2/3 of the time with RDM 87
88 7. References 1. Neal Adams, Larry Kuhlman, Kicks and Blowout Control- Second Edition, PennWell Publishing Company, Tulsa, Oklahoma, Robert D. Grace, Blowout and Well Control Handbook, Gulf Professional Publishing, Thomas M. Redlinger, John McCormick, Longer, deviated wells push drill pipe limits, Drilling Contractor, Mars/April O. Vestavik, S.Kerr, S. Brown, Reelwell Drilling Method, SPE/IDAC , Vestavik O. et. al. Deployment of the Reelwell Drilling Method in a Shale Gas Field in Canada, SPE , Aberdeen, Rana S Roy, Conroy James Nini, Paul Sonnemann, Berton Thomas Gillis, Driller s Method vs Wait and Weigh Method: One Offers distinct well control advantages, s- method- vs- wait- and- weight- method- one- offers- distinct- well- control- advantages- 1444, Posted , Downloaded Feb Bjorn Gjorv, Well Control Procedures for Extended Reach Wells, Master thesis, Texas A&M University, August Jardine, S.I., Johnson, A.B., and White, D.B. Hard or Soft Shut- In: Which Is the Best Approach?, SPE/IADC 25712, SPE/IADC Drilling Conference, Amsterdam, February Reelwell, Kill procedure - returns up Inner Pipe.xlsm, kill procedure description, January O. Vestavik, M. Egorenkov, B. Schmalhorst, J. Falcao, M. Roedbro, Extended Reach Drilling new solution with a unique potential, SPE/IADC , O.L.A. Santos, Well- Control Operations in Horizontal Wells, SPE 21105, , june Reach- Drilling/MPD, june O.L.A. Santos, Important Aspects of Well Control for Horizontal Drilling Including Deepwater Situations, SPE/IADC 21993,
89 15. Reelwell/Timeline, june Sonowal K., Bennetzen B., Maersk Oil Qatar AS, K&M Technology group, Schlumberger D&M, How Continuous Improvement Lead to the Longest Horizontal Well in the World, SPE/IADC , Allen,F., Tooms,P., Extended Reach Drilling: Breaking the 10km Barrier, d_review/1997/or1997win03_extended_reachdrilling.aspx Reach- Drilling/JIP- ERD- beyond- 20- km, june june
90 APPENDIX APPENDIX A: Mud volume calculations Simple calculations comparing the mud volumes and circulation times for conventional and RDM. For the calculations the drill pipe is assumed to go all the way to total well depth, and pipe connections are not considered in the calculations. Conventional 𝐷𝑟𝑖𝑙𝑙 𝑝𝑖𝑝𝑒 𝑐𝑎𝑝𝑎𝑐𝑖𝑡𝑦 𝐴𝑛𝑛𝑢𝑙𝑢𝑠 𝑐𝑎𝑝𝑎𝑐𝑖𝑡𝑦!!"!"!!"!"! = (! 𝐼𝐷! 12)/9702 (A1) =!!!""#$#%!"#$%&%'!!!"#$$!"!#!"!!"!"#$ (A2) 1 𝑏𝑏𝑙 = 9702 𝑖𝑛! RDM The same calculations apply when using RDM. The difference is that the mud is pumped down the inner annulus and returning up the inner string. 𝐼𝑛𝑛𝑒𝑟 𝑠𝑡𝑟𝑖𝑛𝑔 𝑐𝑎𝑝𝑎𝑐𝑖𝑡𝑦!!"!"! = (! 𝐼𝐷! 12)/9702 (A3) 𝐼𝑛𝑛𝑒𝑟 𝑎𝑛𝑛𝑢𝑙𝑢𝑠 𝑐𝑎𝑝𝑎𝑐𝑖𝑡𝑦!!!!"!" =!""#$!""#$#%!"#$%&%'!!!""#$!"!#!"!!"!"#$ (𝐴4) 𝑊𝑒𝑙𝑙 𝑎𝑛𝑛𝑢𝑙𝑢𝑠 𝑐𝑎𝑝𝑎𝑐𝑖𝑡𝑦!! 𝑏𝑏𝑙 = 𝑓𝑡!""#$#%!"#$%&%'!!!"#$$!"!#!"!!"!"#$ (𝐴5) 90
91 Well 1 Well 1 Casing shoe MD Total MD Table A.1: Well 1 MD 1640, ft 4921, ft Conventional Drill pipe OD 5 in DP ID 4,276 in DP capacity (cu in/ft) 172, DP capacity (bbl/ft) 0, DP volume 87, bbl Casing ID 9,001 in Cased annulus cap (cu in/ft) 527, Cased annulus cap (bbl/ft) 0, Cased annulus volume 89, bbl Open hole diameter 8,5 in Open hole annulus cap (cu in/ft) 445,095 Open hole annulus cap (bbl/ft) 0, Open hole annulus volume 150, bbl Total annulus volume 239, bbl Total Mud Volume 327, bbl Table A.2: Well 1 conventional mud volume calculations 91
92 Reelwell Drilling Method Inner string OD 3,5 in Inner string ID 3 in Inner string capacity 84,78 cu in/ft Inner string capacity 0, bbl/ft Inner string volume 43, bbl Outer string OD 6,625 in Outer string ID 5,901 in Outer string capacity 212, cu in/ft Outer string capacity 0, bbl/ft Outer string volume 107, bbl Cased well annulus capacity Cased well annulus capacity Cased well annulus volume Open hole well annulus capacity Open hole well annulus capacity Open hole well annulus volume 349, cu in/ft 0, bbl/ft 59, bbl 267, cu in/ft 0, bbl/ft 90, bbl Total active mud volume 150, bbl Total static mud volume 149, bbl Table A.3: Well 1 RDM mud volume calculations 92
93 Well 2 Well 2 section 2 Casing shoe MD 45931,76 ft Total MD 51837,27 ft Table A.4: Well 2 section 2 MD Conventional Drill pipe OD 6,625 in DP ID 5,965 in DP capacity (cu in/ft) 335, DP capacity (bbl/ft) 0, DP volume 1790, bbl Casing ID 10,192 in Cased annulus cap (cu in/ft) 565, Cased annulus cap (bbl/ft) 0, Cased annulus volume 2675, bbl Open hole diameter 9,75 in Open hole annulus cap (cu in/ft) 482, Open hole annulus cap (bbl/ft) 0, Open hole annulus volume 293, bbl Total annulus volume 2968, Total Mud Volume 4759, bbl Table A.5: Well 2 conventional mud volume calculations 93
94 Reelwell Drilling Method Inner string OD 4 in Inner string ID 3,54 in Inner string capacity 118, cu in/ft Inner string capacity 0, bbl/ft Inner string volume 630, bbl Outer string OD 6,625 in Outer string ID 5,965 in Outer string capacity 184, cu in/ft Outer string capacity 0, bbl/ft Outer string volume 985, bbl Cased well annulus capacity Cased well annulus capacity Cased well annulus volume Open hole well annulus capacity Open hole well annulus capacity Open hole well annulus volume 565, cu in/ft 0, bbl/ft 2675, bbl 482, cu in/ft 0, bbl/ft 293, bbl Total active mud volume 1616, bbl Total static mud volume 2968, bbl Table A.6: Well 2 RDM mud volume calculations 94
95 Circulation times To get the circulation times required equation A6 is used. Time minutes =!"#$%&!!"!" (!"#!!" )!"#!"#$%&'(")*!"#$!"#$%& (A6) Well 1 volumes (bbl) Conventional RDM Inner string (RDM) - 43, Outer string (RDM) - 107, Drill pipe (Conventional) 87, Well annulus 239, , Active mud 327, , Total mud 327, , Table A.7: Well 1 mud volumes Time required at 120gpm (minutes) Conventional RDM Circulate out kick 83, , Circulate entire string 114, , Driller's method (2 circulations) 198, HOL kill procedure (3 circulations) - 120, Table A.8: Well 1 circulation times Well 2 volumes (bbl) Conventional RDM Inner string (RDM) - 630, Outer string (RDM) - 985, Drill pipe (Conventional) 1790, Well annulus 2968, , Active mud 4759, , Total mud 4759, ,85705 Table A.9: Well 2 mud volumes Time required at 120gpm (minutes) Conventional RDM Circulate out kick 1039, , Circulate entire string 1665, , Driller's method (2 circulations) 2704, HOL kill procedure (3 circulations) , Table A.10: Well 2 circulation times 95
96 APPENDIX B: Charts from Wellplan simulations Alllowable inhlux volumes for different kick intensities (12 ppg MW) Shoe Pressure (psi) Inhlux Volume (bbl) 0.5 ppg 3.5 ppg 4.5 ppg 5.5 ppg Pore Pressure at Shoe Fracture Pressure at Shoe Figure B.1: Allowable influx volume for different kick intensities, well 1 (12ppg MW) 550 Shoe Pressure for different inhlux volumes (9 ppg MW, 0.5 ppg kick intensity) Shoe Pressure (psi) bbl 5 bbl 10 bbl 50 bbl 100 bbl Volume Pumped (bbl) Figure B.2: Shoe pressure for different influx volumes, well 1 (9ppg MW, 0,5ppg kick intensity) 96
97 Full evacuation to gas Measured Depth (ft) Pressure (psi) Annulus Pressure Pore Pressure Fracture Pressure Figure B.3: Full evacuation to gas, well 1 (12,5ppg kick interval) Allowable inhlux volumes for different kick intensities (9.5 ppg MW) Shoe Pressure (psi) Inhlux Volume (bbl) 0.5 ppg 1.0 ppg 1.5 ppg 2.0 ppg Fracture Pressure at Shoe Pore Pressure at Shoe Figure B.4: Allowable influx volumes for different kick intensities, well 2 section 1 (9,5ppg MW) 97
98 Full evacuation to gas Measured Depth (ft) Pressure (psi) Annulus Pressure Pore Pressure Fracture Pressure Figure B.5: Full evacuation to gas, well 2 section 1 (13ppg kick interval) 6500 Allowable inhlux volume for different kick intensities (12 ppg MW) Shoe Pressure (psi) Inhlux Volume (bbl) 0.5 ppg 2.5 ppg 3.0 ppg 3.5 ppg Pore Pressure at Shoe Fracture Pressure fp Figure B.6: Allowable influx volume for different kick intensities, well 2 section 2 (12ppg MW) 98
99 Shoe Pressure (psi) Shoe Pressure for different inhlux volumes (9.5 ppg MW, 0.5 ppg kick intensity) Volume Pumped (bbl) 1 bbl 5 bbl 10 bbl 50 bbl 100 bbl Figure B.7: Shoe pressure for different influx volumes, well 2 section 2 (9,5ppg MW, 0,5ppg kick intensity) Full evacuation to gas 0 Pressure (psi) Measured Depth (ft) Annulus Pressure Pore Pressure Fracture Pressure Figure B.8: Full evacuation to gas, well 2 section 2 (13ppg kick interval) 99
100 Comparison simulation charts Maximum Annulus Pressure (Driller's and W&W) Measured Depth (ft) Pressure (psi) Pore Pressure Fracture Pressure Driller's 5bbl W&W 5bbl Driller's 14bbl W&W 14bbl 90 degrees 5bbl Pore Pressure 90deg Fracture Pressure 90deg Figure B.9: Maximum annulus pressure Wellplan comparison, well Shoe Pressure (Driller's and W&W) 2500 Pressure (psi) Volume Pumped (bbl) Driller's 2bbl W&W 2bbl W&W 10bbl Driller's 10bbl Pore Pressure at Shoe Fracture Pressure at Shoe Figure B.10: Shoe pressure Wellplan comparison, well 2 section 1 100
101 BHP 7000 Pressure (psi) Volume Pumped (bbl) Driller's 10bbl Driller's 2bbl W&W 2bbl W&W 10bbl Pore Pressure at bottom hole Fracture Pressure at bottom hole Figure B.11: BHP Wellplan comparison, well 2 section 1 Max annulus pressure Measured Depth (ft) Pressure (psi) Driller's 2bbl Driller's 10bbl W&W 2bbl W&W 10bbl Pore Pressure Fracture Pressure Figure B.12: Maximum annulus pressure Wellplan comparison, well 2 section 1 101
102 Shoe Pressure 50 bbl inhlux (Driller's and W&W) Pressure (psi) Volume Pumped (bbl) Driller's 50bbl W&W 50bbl Pore Pressure at Shoe Fracture Pressure at Shoe Figure B.13: Shoe pressure Wellplan comparison, well 2 section BHP 50 bbl inhlux (Driller's and W&W) Pressure (psi) W&W 50bbl Driller's 50bbl Pore Pressure at bottom hole Fracture Pressure at bottom hole Volume Pumped (bbl) Figure B.14: BHP Wellplan comparison, well 2 section 2 102
103 0 Maximum Annulus Pressure 50 bbl inhlux Pressure (psi) Measured Depth (ft) Driller's Method Wait & Weigh Pore Pressure Fracture Pressure Figure B.15: Maximum annulus pressure Wellplan comparison, well 2 section 2 103
104 APPENDIX C: Tables from DrillSIM simulations HOL mud No Circulation Drilling Drilling Drilling Displacement displacement Circulation at Rate Fluid at Fluid at Fluid at Finished Shoe (Inner Bottom Hole Shoe (Inner annulus) pipe) Casing Shoe 659,45 763,12 811,47 809,62 790,13 710,54 Pressure Bottom Hole Pressure 552,52 656,2 704,55 702,7 683,21 603,62 Pump Rate (gpm) Total Strokes Pumped Table C.11: HOL displacement, well 1 Circulation Shut- in Circulation Kick at Kick at Circulation 1 2bbl at rate shoe choke 1 finished Casing 813,79 706,37 707,54 723,51 712,09 Shoe Pressure BHP 706,77 599,34 600,51 616,48 605,06 Pump rate (gpm) Total strokes pumped Influx Volume in Well (cuft) 10,78 12,5 12,9 22,41 1,07 Table C.12: HOL kill circulation 1 (2bbl), well 1 Circulation 1 5bbl Shut- in Kick at shoe Kick 1 at choke Kick 2 at choke Kick 3 at choke Circulation 1 finished Casing 811,66 703,24 700,28 695,36 710,25 712,4 Shoe Pressure BHP 704,59 596,12 593,12 588,18 603,06 605,18 Pump rate (gpm) Total strokes pumped Influx Volume in Well (cuft) 28,5 39,93 59,34 36,71 24,05 5,75 Table C.13: HOL kill circulation 1 (5bbl), well 1 104
105 Circulation 1 14bbl Casing Shoe Pressure Shut- in Kick 1 at choke Kick 2 at choke Kick 3 at choke Kick 4 at choke Kick 5 at choke Circulation 1 finished 813,12 715,39 713,64 725,1 720,2 719,82 713,04 BHP 706,01 608,27 606,51 617,94 613,03 612,63 605,79 Pump rate (gpm) Total strokes pumped Influx volume in well (cuft) 75,02 116,3 94,64 85, ,15 4,97 Table C.14: HOL kill circulation 1 (14bbl), well 1 Circulation 2 Casing Shoe Pressure Bottom Hole Pressure Pump Rate (spm) Pump 1/2 Total Strokes Pumped Influx Volume in Well (cuft) Circulation at rate Remaining Kick at Shoe Remaining Kick at Choke Kill Mud at Shoe Kill Mud at Bottom Hole 727,58 723,21 720,61 713,86 717,4 609,97 606,91 610,88 606,78 604,85 1/29 1/27 1/14 1/10 1/ Table C.15: HOL Kill circulation 2, well 1 105
106 Circulation 3 Casing Shoe Pressure Bottom Hole Pressure Pump Rate (gpm) Total Strokes Pumped Circulation Remaining Circulation 3 at rate KM at finished Shoe 716,78 727,92 740,18 605,29 616,44 628, Table C.16: HOL kill circulation 3, well 1 Circulation 1 2bbl Shut- in Kick at end of horizontal section Kick at shoe Kick at choke Circulation finished Casing Shoe Pressure 2349, , , , ,29 BHP , , , ,39 Pump rate (gpm) Total strokes pumped Influx volume in well (cuft) Table C.17: HOL kill circulation 1 (2bbl), well 2 section 1 12,81 15,08 19,83 64,81 4,97 Circulation 1 10bbl Shut- in Kick at end of horizontal section Kick at shoe Kick at choke Circulation finished Casing Shoe Pressure 2359, , , , ,6 BHP 5480, , , , ,7 Pump rate (gpm) Total strokes pumped Influx volume in well (cuft) Table C.18: HOL kill circulation 1 (10bbl), well 2 section 1 51,84 52,43 68,55 124,56 26,92 106
107 Well 2 HOL No circ. Circ. at Drilling Drilling Drilling Circ. displacement rate fluid at fluid at fluid at finished horizontal bit end of section horizontal section (inner string) Casing Shoe 5244, , ,4 6043,5 6124, ,91 Pressure BHP 5176, , , , , ,45 Pump rate (gpm) Total strokes pumped Table C.19: HOL displacement, well 2 section 2 Circulation 1 50bbl Shut- in Circulation at Kick at Kick at Circulation rate KOP choke finished Casing Shoe Pressure 5734, , , , ,79 BHP 5665, , , , ,33 Pump rate (gpm) Total strokes pumped Influx volume in well (cuft) 271,89 276,86 291,39 362,45 20,5 Table C.20: HOL kill circulation 1, well 2 section 2 107

 and inner annulus pressure (PIA) is equal, and lower than PBHP.")
 to open.")

108 APPENDIX D: RDM down hole valve system and hydraulic WOB description Down hole valve system The down hole valve system consists of 3 different valves and the flow x- over. These valves makes it possible close the inner and outer pipe, which in turn makes it possible to bleed off the pressures without affecting the bottom hole pressure (PBHP). Opening sequence When both inner and outer string is empty, all the valves are closed. At this point inner pipe pressure (PIP) and inner annulus pressure (PIA) is equal, and lower than PBHP. The first step is to pump fluid into inner pipe and inner annulus until PIP=PIA=PBHP. Then fluid is pumped into the inner annulus until PIA>PBHP, which will cause inner pipe valve (IPV) to open. The pump rate through the inner annulus is then ramped up until the booster valve (BV) and non- return valve (NRV) opens. The flow will return trough the FXO and IPV up the inner string. The complete opening sequence is shown in Figure D.1. OPENING SEQUENCE PIP PIA PBHP Initial condition: Downhole valve system is CLOSED: PIA = PIP < PBHP Pump into both Inner Annulus and Inner Pipe: PIA = PIP = PBHP System equalizes Pump into Inner Annulus: PIA > PBHP IPV opens Ramp up flow into Inner Annulus: BV opens NRV opens Return flow through FXO and IPV Figure D.1: Down hole valve opening sequence 108

109 Closing Sequence When the pumps are running and all the valves are open PIA>PBHP. To start the closing sequence the pump is ramped down until PIP=PIA=PBHP. This will cause the BV and NRV to close. The next step is to bleed off inner annulus, IPV will close when PIA<PBHP. The last step is to bleed off the inner pipe. When finished the pressures should be PIP=PIA<PBHP. The closing sequence is shown in Figure D.2. Figure D.2: Down hole valve closing sequence Hydraulic WOB The sliding piston is an optional component attached to the drill string in the cased section of the wellbore. Its purpose is to provide hydraulic WOB and pressure control, and isolate the fluids in the upper annulus from the rest of the well. By increasing the casing pressure at surface, the sliding piston is forced down the well giving an additional WOB. This solution is independent of gravity, increasing the possible horizontal reach. As the piston seals off the annulus, different fluids can be used above and below it. 109


110 Figure D.3: Sliding Piston used for additional WOB Figure D.4: Well fluids separated by Sliding Piston 110
111 APPENDIX E: Well Control Procedure Comparison - Influx while drilling 111
112 112
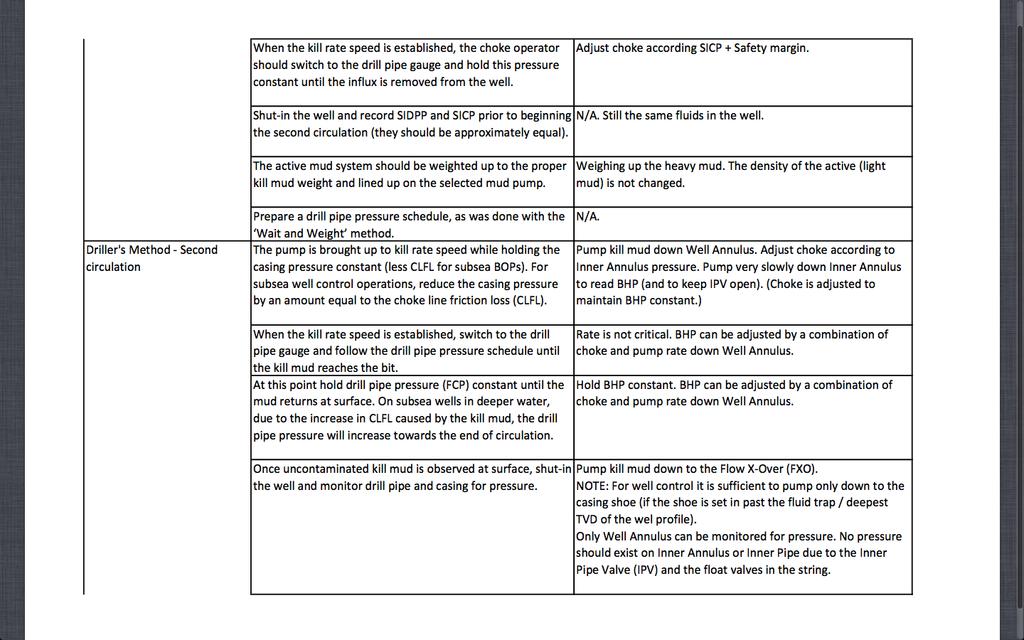
113 113
DAY ONE. 2. Referring to the last question, what mud weight would be required to BALANCE normal formation pressure?
 DAY ONE 1. Normal formation pressure gradient is generally assumed to be: A..496 psi/ft B..564 psi/ft C..376 psi/ft D..465 psi/ft 2. Referring to the last question, what mud weight would be required to
1. The well has been shut in on a kick and the kill operation has not started.
 Well Control Methods Day 2 1. The well has been shut in on a kick and the kill operation has not started. Shut in drill pipe pressure Shut in casing pressure 500 psi 700 psi After stabilization, both pressures
Study Guide IADC WellSharp Driller and Supervisor
 Times to Flow Check: Before pulling out of the hole Before pulling BHA into the BOP When bit is pulled into the casing Increase in cuttings at shakers with same ROP On connections Upon abnormal trip tank
W I L D W E L L C O N T R O L PRESSURE BASICS AND CONCEPTS
 PRESSURE BASICS AND CONCEPTS Pressure Basics and Concepts Learning Objectives You will be familiarized with the following basic pressure concepts: Defining pressure Hydrostatic pressure Pressure gradient
Dilution-Based Dual Gradient Well Control. Presented at the 2011 IADC Dual Gradient Workshop, 5 May 2011 by Paul Boudreau, Dual Gradient Systems LLC
 Dilution-Based Dual Gradient Well Control Presented at the 2011 IADC Dual Gradient Workshop, 5 May 2011 by Paul Boudreau, Dual Gradient Systems LLC In this very short presentation, we will Review Dilution-based
Practice Exam IADC WellSharp Driller and Supervisor
 Workover & Completion Day 4 1. In a workover operation of a shut in well a Lubricator is being used together with a Wireline BOP / Wireline Valve. Which Barrier is classified as the Primary Barrier? A.
SUBSEA KILL SHEET EXERCISE No. 5
 Subsea Kill Sheet Exercise No. 5 SUBSEA KILL SHEET EXERCISE No. 5 Name: Date: Complete the Subsea vertical kill sheet provided on pages 2 and 3. Then answer questions 1 to 12. Please round calculations
Understanding pressure and pressure
 CHAPTER 1 1-1 PRESSURE BASICS Remember to think downhole. The concepts provided in this section cover the foundations for good well control. Understanding pressure and pressure relationships is important
WILD WELL CONTROL WARNING SIGNS OF KICKS
 WARNING SIGNS OF KICKS Warning Signs of Kicks Learning Objectives You will learn the warning signs that indicate the well may be kicking: Warning signs of kicks False kick indicators You will also learn
MASTER S THESIS. A Discussion of Well Control Methods. Faculty of Science and Technology. Study program/ Specialization: Spring semester, 2013
 Faculty of Science and Technology MASTER S THESIS Study program/ Specialization: Petroleum Engineering Spring semester, 2013 Open Writer: Øystein Røssland (Writer s signature) Faculty supervisor: Professor
Rig Math. Page 1.
 Page 1 The Calculator and Main Keyboard Display Numerical 10-key pad used for entering numerical values Trigonometric Functions These keys will be used where wellbore angle is an issue These are the keys
Extended leak off testing
 Extended leak off testing Rev: 1.0 03/01/01 Purpose To ensure minimal operational time and risk exposure to personnel, process, production and equipment. The following extended leak off test procedures
ECD Reduction Tool. R. K. Bansal, Brian Grayson, Jim Stanley Control Pressure Drilling & Testing
 ECD Reduction Tool R. K. Bansal, Brian Grayson, Jim Stanley Control Pressure Drilling & Testing Drilling Engineering Association, Fourth Quarter Meeting November 20, 2008 1 Presentation outline Description
OPTIMUM SELECTION OF WELL CONTROL METHODS
 OPTIMUM SELECTION OF WELL CONTROL METHODS Md AHAMMAD SHARIF Assistant professor, Department of Petroleum Engineering, GIET College of Engineering, Rajahmundry. Dr. S. SRIGOWRI REDDY Professor, GIET College
VOLUMETRIC METHODS and STRIPPING OPERATIONS
 VOLUMETRIC METHODS and STRIPPING OPERATIONS WELL CONTROL SCHOOL Muscat, Oman Training Center VOLUMETRIC METHODS and STRIPPING OPERATIONS The material contained here, is based on the best sources available
August 21, Deepwater MPD / PMCD
 August 21, 2011 Deepwater MPD / PMCD Managed Pressure Drilling (MPD) Pressure held on top of riser while drilling. Drill in overbalance condition Pressurized Mud Cap Drilling (PMCD) Pressure of mud column
Well Control Modeling Software Comparisons with Single Bubble Techniques in a Vertical Well
 Well Control Modeling Software Comparisons with Single Bubble Techniques in a Vertical Well Jace R. Larrison, P.E. Blowout Engineers, LLC Recent advances in well control modeling simulators have incorporated
BLOCK: CB-ONN-2010/8 GUJRAT-INDIA
 Well Control Manual Bharat PetroResources Limited BLOCK: CB-ONN-2010/8 GUJRAT-INDIA Prepared By: EnQuest PetroSloutions Pvt. Ltd. Contents 1.0.0 Definitions 2.0.0. Causes of Kicks 3.0.0. Kick indications
W I L D W E L L C O N T R O L CIRCULATION & WELL CONTROL
 CIRCULATION & WELL CONTROL Learning Objectives You will learn: The importance of pump rates and pressures during well control operations Pressure relationships Basic calculations necessary in well control
Worked Questions and Answers
 Worked Questions and Answers A Learning Document for prospective Candidates For the Rotary Drilling Well Control Test Programme Copyright, IWCF June 2000 Revision No.1, November 2000 IWCF 2000 page 1 of
Along-string pressure, temperature measurements hold revolutionary promise for downhole management
 Along-string pressure, temperature measurements hold revolutionary promise for downhole management IT S WIDELY KNOWN that the majority of stuck pipe incidents occur while pulling out of hole. If we can
Why Do Not Disturb Is a Safety Message for Well Integrity
 Why Do Not Disturb Is a Safety Message for Well Integrity Presented at the Practical Well Integrity Conference 9-10 December, 2014 in Houston By Ron Sweatman, Principal Advisor, Reservoir Development Services,
What are the Well Control Complications While Drilling with Casing or Liner? Tawfik Elshehabi and H. Ilkin Bilgesu, West Virginia University
 AADE-16-FTCE-79 What are the Well Control Complications While Drilling with Casing or Liner? Tawfik Elshehabi and H. Ilkin Bilgesu, West Virginia University Copyright 2016, AADE This paper was prepared
International Well Control Forum. IWCF Drilling Well Control Syllabus Level 3 and 4 March 2017 Version 7.0
 International Well Control Forum IWCF Drilling Well Control Syllabus and 4 March 2017 Version 7.0 IWCF Drilling Well Control Syllabus and 4 Contents Guidance Notes... 5 1.1. Introduction... 5 1.2. Who
Drilling Efficiency Utilizing Coriolis Flow Technology
 Session 12: Drilling Efficiency Utilizing Coriolis Flow Technology Clement Cabanayan Emerson Process Management Abstract Continuous, accurate and reliable measurement of drilling fluid volumes and densities
A New and Simplified Method for Determination of Conductor Surface Casing Setting Depths in Shallow Marine Sediments (SMS)
") AADE-07-NTCE-41 A New and Simplified Method for Determination of Conductor Surface Casing Setting Depths in Shallow Marine Sediments (SMS) Paknejad, A., Texas A&M University; Schubert, J., Texas A&M University
AADE-07-NTCE-41 A New and Simplified Method for Determination of Conductor Surface Casing Setting Depths in Shallow Marine Sediments (SMS) Paknejad, A., Texas A&M University; Schubert, J., Texas A&M University
IWCF Equipment Sample Questions (Combination of Surface and Subsea Stack)
") IWCF Equipment Sample Questions (Combination of Surface and Subsea Stack) 1. Given the volumes below, how much hydraulic fluid will be required to carry out the following operations (no safety margin)?
IWCF Equipment Sample Questions (Combination of Surface and Subsea Stack) 1. Given the volumes below, how much hydraulic fluid will be required to carry out the following operations (no safety margin)?
Hard or Soft Shut-in : Which is the Best Approach?
 HARD - SOFT shut-in? Hard or Soft Shut-in : Which is the Best Approach? March '93 INTRODUCTION There is now reasonable acceptance through-out the industry for the use of a hard shut-in procedure following
IWCF Equipment Sample Questions (Surface Stack)
") IWCF Equipment Sample Questions (Surface Stack) 1. During a well control operation 4000 psi was shut in below the middle pipe rams. Ram type BOP data: Model: Cameron U type Rated Working Pressure: 15000
IWCF Equipment Sample Questions (Surface Stack) 1. During a well control operation 4000 psi was shut in below the middle pipe rams. Ram type BOP data: Model: Cameron U type Rated Working Pressure: 15000
R.K. Bansal, Weatherford; P.A. Bern, BP Exploration; Rick Todd, Weatherford; R.V. Baker, BP America; Tom Bailey, Weatherford
 AADE-07-NTCE-69 A Downhole Tool for Reducing ECD R.K. Bansal, Weatherford; P.A. Bern, BP Exploration; Rick Todd, Weatherford; R.V. Baker, BP America; Tom Bailey, Weatherford Copyright 2007, AADE This paper
Well Control Drill Guide Example Only. Drill Guide is the list of drills, questions and attributes that are in DrillPad.
 Well Control Drill Guide Example Only Drill Guide is the list of drills, questions and attributes that are in DrillPad. This Well Control Drill Guide will be used in conjunction with the rig-specific well
W I L D W E L L C O N T R O L COMPLICATIONS
 COMPLICATIONS Complications Learning Objectives You will learn to detect changes that deviate from established trends. You will learn how to respond to problems such as: Pump problems String problems Hole
DRILLSCENE PROACTIVE DRILLING DECISIONS
 DRILLSCENE PROACTIVE DRILLING DECISIONS RISE TO THE CHALLENGE OF REAL-TIME DRILLING CONTROL Today s oil and gas drilling operations present significant technical challenges in remote locations and increasingly
WellCAP IADC WELL CONTROL ACCREDITATION PROGRAM
 WellCAP IADC WELL CONTROL ACCREDITATION PROGRAM DRILLING OPERATIONS CORE CURRICULUM AND RELATED JOB SKILLS FORM WCT-02DS SUPERVISORY LEVEL The purpose of the core curriculum is to identify a body of knowledge
OCEAN DRILLING PROGRAM
 BIH OCEAN DRILLING PROGRAM www.oceandrilling.org Scientifi c Application Packers A packer is an inflatable rubber element that inflates to seal the annular space between the drill string and the borehole
W I L D W E L L C O N T R O L SHUT-IN PROCEDURES
 SHUT-IN PROCEDURES Shut-in Procedures Learning Objectives You will learn general shut-in procedures: For surface BOPs. For subsea BOPs. You will learn to interpret shut-in pressures and be able to perform
Chapter 4 Key Findings. 4 Key Findings
 Chapter 4 Key Findings 211 4 Key Findings 212 Chapter 4 Key Findings This summarizes the key findings of the investigation team based on its extensive review of available information concerning the Macondo
INTERPRETATION NOTE ISSUED UNDER THE PETROLEUM DRILLING REGULATIONS (CNR 1150/96)
") BOP CLASSIFICATION SYSTEM FOR ONSHORE NEWFOUNDLAND AND LABRADOR INTERPRETATION NOTE ISSUED UNDER THE PETROLEUM DRILLING REGULATIONS (CNR 1150/96) PREPARED BY THE PETROLEUM RESOURCE DEVELOPMENT DIVISION
BOP CLASSIFICATION SYSTEM FOR ONSHORE NEWFOUNDLAND AND LABRADOR INTERPRETATION NOTE ISSUED UNDER THE PETROLEUM DRILLING REGULATIONS (CNR 1150/96) PREPARED BY THE PETROLEUM RESOURCE DEVELOPMENT DIVISION
Blowout during Workover Operation A case study Narration by: Tarsem Singh & Arvind Jain, OISD
 1. Introduction An incident of gas leakage from a well took place during workover operations. Subsequently, the gas caught fire on the fourth day in which twelve persons were injured. Two contract workers,
Kicks Controlling Techniques Efficiency in Term of Time
 Engineering, 2017, 9, 482-492 http://www.scirp.org/journal/eng ISSN Online: 1947-394X ISSN Print: 1947-3931 Kicks Controlling Techniques Efficiency in Term of Time Ali K. Darwesh, Thorkild Maack Rasmussen,
DRILLING MANAGED PRESSURE REGIONAL OUTLOOK: EAST AFRICA REDUCED EMISSION COMPLETIONS SHALE TECHNOLOGY REVIEW
 MARCH 2014 / DEFINING TECHNOLOGY FOR EXPLORATION, DRILLING AND PRODUCTION / WorldOil.com MANAGED PRESSURE DRILLING How automated MPD enables drilling of an impossible well in Mexico REGIONAL OUTLOOK: EAST
Well Control for Drilling Operations Personnel Core Curriculum and Related Learning Objectives
 Well Control for Drilling Operations Personnel Core Curriculum and Related Learning Objectives Form WSP-02-DO-D Second Edition, Revision 1 19 June 2015 ADC 2015 COPYRGHT PROTECTED DOCUENT All rights reserved.
APPENDIX A1 - Drilling and completion work programme
 APPENDIX A1 - Drilling and completion work programme Information about the well and drilling To the extent possible, the international system of units (SI) should be adhered to, and the drilling programme
Float Equipment TYPE 925/926
 Type 925 Float Collar Plunger Valve Float Equipment For less demanding well conditions, such as shallower depths or lower pressures, Top- Co offers economical float equipment certified to API RP 10F category
SIMULATION OF A RE-ENTRY WITH CASING DRILLING UNDER HPHT CONDITIONS Gabriella Federer-Kovacs 1. Introduction
 Simulation of a re-entry with casing drilling under HPHT conditions SIMULATION OF A RE-ENTRY WITH CASING DRILLING UNDER HPHT CONDITIONS Gabriella Federer-Kovacs 1. Introduction Due to the ongoing depletion
Casing Design. Casing Design. By Dr. Khaled El-shreef
 Casing Design By Dr. Khaled El-shreef 1 Casing Design CONTENTS Function of Casing Casing Types & Tools Strength Properties Casing Specification Casing Design 2 1 RUNNING AND CEMENTING CASING Reasons for
Blowout Engineers personnel have worked in over 40 countries and have a wide range of experience in addition to blowout control operations.
 1.888.505.6346 1 Blowout Engineers provides operators the full complement of well control engineering and services. Blowout Control Well Control Project Management Relief Well Design and Execution Underground
Offshore Managed Pressure Drilling Experiences in Asia Pacific. SPE paper
 Offshore Managed Pressure Drilling Experiences in Asia Pacific SPE paper 119875 Authors: Steve Nas, Shaun Toralde, Chad Wuest, SPE, Weatherford Solutions Sdn Bhd, SPE, Weatherford Indonesia SPE, Weatherford
MPD Technique in Haynesville Shale Delivers Significant Value in Over Pressured Zones, A Case Study on Four Wells.
 AADE-11-NTCE-55 MPD Technique in Haynesville Shale Delivers Significant Value in Over Pressured Zones, A Case Study on Four Wells. Serkan Cenberlitas, Jim Crenshaw, and Ferhat Gumus, Weatherford International;
SURFACE CASING SELECTION FOR COLLAPSE, BURST AND AXIAL DESIGN FACTOR LOADS EXERCISE
 SURFACE CASING SELECTION FOR COLLAPSE, BURST AND AXIAL DESIGN FACTOR LOADS EXERCISE Instructions Use the example well data from this document or the powerpoint notes handout to complete the following graphs.
AADE 2009NTCE-04-04: PRACTICAL ASPECTS AND VALUE OF AUTOMATED MPD IN HPHT WELLS
 sudden appearance of permeable sequences abnormally pressured to higher than anticipated levels in an already narrow margin. 2009 NATIONAL TECHNICAL CONFERENCE & EXHIBITION, NEW ORLEANS, LOUISIANA AADE
PowerDrive X6. Rotary Steerable System for high-performance drilling and accurate wellbore placement
 Rotary Steerable System for high-performance drilling and accurate wellbore placement The PowerDrive X6 RSS maintains control under the most difficult conditions, bringing the benefits of rotary steerable
HydroPull. Extended-Reach Tool. Applications
 Extended-Reach Tool HydroPull This tool incorporates a cycling valve that momentarily interrupts the flow to create water-hammer pressure pulses inside coiled or jointed tubing used in horizontal well
Step-Rate Formation Integrity Test Method for Geothermal Wells
 GRC Transactions, Vol. 41, 2017 Step-Rate Formation Integrity Test Method for Geothermal Wells William M. Rickard, Ozgur Balamir and Ernesto Rivas Geothermal Resource Group, Inc. services@geothermalresourcegroup.com
W I L D W E L L C O N T R O L FLUIDS
 FLUIDS Fluids Learning Objectives You will learn about different fluids that can be used in well control. You will become familiar with the characteristics and limitations of fluids. You will learn general
The Diagnosis of Well Control Complications during Managed Pressure Drilling
 Louisiana State University LSU Digital Commons LSU Master's Theses Graduate School 213 The Diagnosis of Well Control Complications during Managed Pressure Drilling Brian Piccolo Louisiana State University
WellCAP IADC WELL CONTROL ACCREDITATION PROGRAM
 WellCAP IADC WELL CONTROL ACCREDITATION PROGRAM WELL SERVICING OPERATIONS SNUBBING CORE CURRICULUM AND RELATED FORM WCT-2SS SUPERVISORY LEVEL The purpose of the core curriculum is to identify a body of
W I L D W E L L C O N T R O L AIR DRILLING
 AIR DRILLING Air Drilling Learning Objectives You will learn the basics of: Air drilling equipment Types of air drilling Differences between mud and air drilling You will learn how to apply well control
PTTCO Drilling Well Control Training Course
 www.pttco.org PTTCO Drilling Well Control Training Course 1.1 Course objectives 1.2 Course duration 1.3 Number of trainees in a course 1.4 Prerequisites 1.5 Instructor s specific qualifications 1.6 Course
BANDAR PANJI-1 WELL CONTROL INCIDENT REPORT
 BANDAR PANJI-1 WELL CONTROL INCIDENT REPORT EXECUTIVE SUMMARY I was requested by management to review the Banjar Panji-1 drilling operations from the conception of the Integrated Drilling Management approach
Book 3 - Well Control Calculations
 Welltrain Distance Learning Programme - DRILLING CALCULATIONS www.welltrain.com.au Welltrain Distance Learning Programme Book 3 - Well Control Calculations 162 Colin Street, West Perth, WA 6005 Tel: +61
The SPE Foundation through member donations and a contribution from Offshore Europe
 Primary funding is provided by The SPE Foundation through member donations and a contribution from Offshore Europe The Society is grateful to those companies that allow their professionals to serve as
Solid Expandable Tubular Technology: The Value of Planned Installation vs. Contingency
 Solid Expandable Tubular Technology: The Value of Planned Installation vs. Contingency Chris Carstens Unocal Corporation 14141 Southwest Freeway Sugar Land, Texas 77478 Mike Breaux Unocal Corporation 14141
Chapter 5 HORIZONTAL DRILLING
 Chapter 5 HORIZONTAL DRILLING Chapter 5 How much money am I about to put on the table for a horizontal well? Did I do sufficient planning? Keys to Successful Horizontal Wells Multi-disciplined teams working
WellCAP IADC WELL CONTROL ACCREDITATION PROGRAM
 WellCAP IADC WELL CONTROL ACCREDITATION PROGRAM WELL SERVICING OPERATIONS (WIRELINE, COILED TUBING & SNUBBING) CORE CURRICULUM AND RELATED FORM WCT-2WSI INTRODUCTORY LEVEL For information on how an course
Well Control Institute (WCI) Core Curriculum and Related Learning Outcomes: Supervisory Level
 Core Curriculum and Related Learning Outcomes: Supervisory Level") Well Control nstitute (WC) Core Curriculum and Related Learning Outcomes: Level Revision 4B ay 14, 2014 Prepared by Black & Veatch Corp. DRAFT WORK PRODUCT FOR NDUSTRY COENT Well Control nstitute (WC)
Well Control nstitute (WC) Core Curriculum and Related Learning Outcomes: Level Revision 4B ay 14, 2014 Prepared by Black & Veatch Corp. DRAFT WORK PRODUCT FOR NDUSTRY COENT Well Control nstitute (WC)
EVALUATION OF LIQUID LIFT APPROACH TO DUAL GRADIENT DRILLING
 EVALUATION OF LIQUID LIFT APPROACH TO DUAL GRADIENT DRILLING A Thesis by UGOCHUKWU NNAMDI OKAFOR Submitted to the Office of Graduate Studies of Texas A&M University in partial fulfillment of the requirements
Safety and Risk Analysis of Deepwater Drilling using Managed Pressure Drilling Technology
 Safety and Risk Analysis of Deepwater Drilling using Managed Pressure Drilling Technology Jyoti Bhandari 1, Faisal Khan* 1, and Vikram Garaniya 1 1.Offshore Safety and Risk Management Group, Australian
Operations planning for optimal hole cleaning
 Operations planning for optimal hole cleaning Rev 1.0 14 th March 2004. Technical comments? info@kingdomdrilling.co.uk Page 1 Table of contents Operations planning for optimal hole cleaning... 1 Table
Hydraulic Optimization Worksheet for MS Excel All Versions subsequent to 5.0
 Hydraulic Optimization Worksheet for MS Excel All Versions subsequent to 5.0 1. Introduction. 2. Data Input. Header. Bit Information. Mud Information. Casing Program. P.D.M./Turbine. Drill String Design.
Deepwater Horizon Incident Internal Investigation
 Not all Information has been verified or corroborated. Subject to review based on additional information or analysis. Deepwater Horizon Incident Internal Investigation 1 Areas of Discussion Investigation
HPHT Annular Casing Packer. Obex Annular Casing Packer
 HPHT Annular Casing Packer Obex Annular Casing Packer Industry Challenge Casing packer to support second stage cement Reduce hydrostatic pressure on formation Get cement to surface Annular gas migration
New generation of solid expandable liners help give operators a jump on trouble zones
 New generation of solid expandable liners help give operators a jump on trouble zones By Pat York, Weatherford SINCE SOLID EXPANDABLE technology has gained credibility as an effective contingency option,
DUO-SQUEEZE H LCM Mixing Tables and Operating Procedures
 BAROID DUO-SQUEEZE H LCM Mixing Tables and Operating Procedures Prepared for: Prepared by: Submitted by: Submittal Date: All Customers Sharath Savari, Donald L. Whitfill Halliburton January 2014 1 Copyright
WellCAP IADC WELL CONTROL ACCREDITATION PROGRAM
 WellCAP IADC WELL CONTROL ACCREDITATION PROGRAM WIRELINE OPERATIONS CORE CURRICULUM AND RELATED FORM WCT-2WLF FUNDAMENTAL LEVEL The purpose of the core curriculum is to identify a body of knowledge and
OPERATING MANUAL DOUBLE ACTING DRILLING INTENSIFIER HYDRAULIC TYPE
 Page 1 of 8 OPERATING MANUAL DOUBLE ACTING DRILLING INTENSIFIER HYDRAULIC TYPE Size Series 6.50" 478 Reviewed And Approved By: Signature: Initials: Date: Page 2 of 8 Section OPERATING MANUAL DOUBLE ACTING
RULES OF THE OIL AND GAS PROGRAM DIVISION OF WATER RESOURCES CHAPTER DRILLING WELLS TABLE OF CONTENTS
 RULES OF THE OIL AND GAS PROGRAM DIVISION OF WATER RESOURCES CHAPTER 0400-52-06 DRILLING WELLS TABLE OF CONTENTS 0400-52-06-.01 Drilling Equipment 0400-52-06-.03 Casingheads 0400-52-06-.02 Blowout Prevention
Abstract Objective Scope of Study Introduction Procedures
 AADE-05-NTCE-71 A Practical Solution to Control Gas Migration Ned Shiflet, Forest Oil Corporation; Michael O. Dion, TAM International; and David P. Flores, TAM International This paper was prepared for
Bridge Plugs, Ball Drop & Caged Ball Plugs For Zone Isolation
 Bridge Plugs, Ball Drop & Caged Ball Plugs For Zone Isolation ADVANTAGE composite bridge plug, caged ball and ball drop (flow thru) frac plug provide a means to isolate multiple zones during high pressure
float equipment OPERATING MANUAL TYPE 505/506 Float Equipment 1. INFORMATION & RECOMMENDATIONS Float Equipment
 Contents 1. GENERAL INFORMATION & RECOMMENDATIONS 1 2. INSTALLATION FLOAT EQUIPMENT 2 2.1 PRE-USE FIELD INSPECTION 2 2.2 POSITION FLOAT ON CASING STRING 3 3. RUNNING OF FLOAT EQUIPMENT 3 3.1 CIRCULATION
Dynamic Underbalance (DUB)
") Dynamic Underbalance (DUB) Perforating Cam Le Perforating Product Champion Agenda Overview DUB Software Tools Case histories 2011 HALLIBURTON. ALL RIGHTS RESERVED. 2 Dynamic Underbalance Software Dynamic
Dynamic Underbalance (DUB) Perforating Cam Le Perforating Product Champion Agenda Overview DUB Software Tools Case histories 2011 HALLIBURTON. ALL RIGHTS RESERVED. 2 Dynamic Underbalance Software Dynamic
UPM A Virtual Wellbore Modelling System to Prevent and Enhance the Detection of Well Control Events in Deepwater Drilling
 UPM 16080 A Virtual Wellbore Modelling System to Prevent and Enhance the Detection of Well Control Events in Deepwater Drilling Brian Piccolo, Austin Johnson, Scott Petrie, Henry Pinkstone, Christian Leuchtenberg
North American sealing solutions Bridge Plug Ball Drop Frac Plug Caged Ball Frac Plug
 North American sealing solutions Bridge Plug Ball Drop Frac Plug Caged Ball Frac Plug The North American Sealing Solutions composite bridge plug, caged ball and ball drop (flow thru) frac plug provide
Simulation study evaluating alternative initial responses to formation fluid influx during managed pressure drilling
 Louisiana State University LSU Digital Commons LSU Master's Theses Graduate School 2007 Simulation study evaluating alternative initial responses to formation fluid influx during managed pressure drilling
6-3/4 DUAL PORTED PBL BYPASS SYSTEM (Applicable to sizes 6-1/4 & 6-1/2 also)
") RECEIVING PBL AT RIG SITE TITLE: Operating Instructions for -3/4 PBL -3/4 DUAL PORTED PBL BYPASS SYSTEM (Applicable to sizes -1/4 & -1/2 also) OPERATING INSTRUCTIONS 1. On receipt of PBL Bypass Tools at
RECEIVING PBL AT RIG SITE TITLE: Operating Instructions for -3/4 PBL -3/4 DUAL PORTED PBL BYPASS SYSTEM (Applicable to sizes -1/4 & -1/2 also) OPERATING INSTRUCTIONS 1. On receipt of PBL Bypass Tools at
RIH intermediate section casing in Bazian-1 exploration oil well
 Energy and Sustainability V 559 RIH intermediate section casing in Bazian-1 exploration oil well A. K. Darwesh Petroleum Engineering Department, Engineering Faculty, Koya University, Kurdistan Abstract
"Sharing To Be Better. Influx through failed cement in shoetrack during completion operations
 "Sharing To Be Better Influx through failed cement in shoetrack during completion operations 2 Well status completion operations Seabed @ 364m 7" liner cemented across reservoir Well filled with 1.54 SG
Air and Gas Drilling
 Air and Gas Drilling Air and Gas Drilling It is a technique in which the more common drilling fluids, (water or mud) are replaced by highly compressible Air or Natural gas. But Compressibility makes pressure
SPE/IADC Abstract
 SPE/IADC 125311 Pressurized Mud Cap Drilling Drastically Reduces Non-Productive Time in Soka Field, South Sumatera Michael Runtuwene, Sanny Suprihono, and Dany Rizka, SPE, Medco E&P Indonesia, Andi Eka
SCORPION HIGH-QUALITY, FULLY COMPOSITE PLUGS
 SCORPION HIGH-QUALITY, FULLY COMPOSITE PLUGS A DIFFERENT KIND OF ENERGY COMPANY Nine Energy Service isn t your typical oilfield services company. Our success stems from a culture driven by performance
Type 967 Diamond Broaching Type 968 Sidewinder reamer shoe
 Type 965 float collar Type 966 float shoe 1. GENERAL INFORMATION & RECOMMENDATIONS Type 967 Diamond Broaching Type 968 Sidewinder reamer shoe Type 969 Sidewinder reamer shoe Float Equipment Top-Co Float
NOT TO COPY -- NO DISSEMINATE WITHOUT WRITTEN AGREEMENT. Presentation JB AG JCN JR 1
 Presentation JB AG JCN JR 1 Kicks & blowouts A kick is an unexpected influx into a well of a formation fluid. Should this influx be uncontrolled... -- during its way from the bottom of the hole up in the
Best Practices - Coiled Tubing Deployed Ball Drop Type Perforating Firing Systems
 Best Practices - Coiled Tubing Deployed Ball Drop Type Perforating Firing Systems As a result of a recent job incident utilizing a Ball Drop Type firing system deployed on coiled tubing, the following
Perforating Options Currently Available in Horizontal Shale Oil and Gas Wells. Kerry Daly, Global BD Manager- DST TCP
 MENAPS 2013 Perforating Options Currently Available in Horizontal Shale Oil and Gas Wells Kerry Daly, Global BD Manager- DST TCP MENAPS 13-17 WELL FLOW MANAGEMENT TM Scope/ Contents: MENAPS 13-17 Study
RISER GAS MIGRATION IN EC-DRILL OPERATIONS. A Thesis OMER KALDIRIM
 RISER GAS MIGRATION IN EC-DRILL OPERATIONS A Thesis by OMER KALDIRIM Submitted to the Office of Graduate and Professional Studies of Texas A&M University in partial fulfillment of the requirements for
Inflatable Packer Single & Double. Single & Double Packer Dimension. Wireline Packer. Water Testing Packer (WTP) Packer
 Packer") Inflatable Packer Single & Double Single & Double Packer Dimension Wireline Packer Water Testing Packer (WTP) Packer Packer Working Pressure & Depth Chart Packer Water Hand Pump Packer Air Driven Pump
Inflatable Packer Single & Double Single & Double Packer Dimension Wireline Packer Water Testing Packer (WTP) Packer Packer Working Pressure & Depth Chart Packer Water Hand Pump Packer Air Driven Pump
SUPPLEMENT Well Control for Drilling Operations Workover & Completion for Drillers Core Curriculum and Related Learning Objectives
 SUPPLEMENT Well Control for Drilling Operations Workover & Completion for Drillers Core Curriculum and Related Learning Objectives Form WSP-02-DO-SU-WOC-D Revision 0 13 February 2015 DC 2015 COPYRGHT PROTECTED
ANALYSIS OF ALTERNATIVE WELL CONTROL METHODS FOR DUAL DENSITY DEEPWATER DRILLING
 ANALYSIS OF ALTERNATIVE WELL CONTROL METHODS FOR DUAL DENSITY DEEPWATER DRILLING A Thesis Submitted to the Graduate Faculty of the Louisiana State University and Agricultural and Mechanical College in
Evaluation of deepwater kicks and future countermeasures
 WELLS AND WELL INTERVENTION Evaluation of deepwater kicks and future countermeasures Paal Skalle, Per Holand 2 and Sigbjørn Sangesland Norwegian University of Science and Technology and 2 SINTEF/ExproSoft
Perforating Center of Excellence TESTING SERVICES OVERVIEW
 Perforating Center of Excellence TESTING SERVICES OVERVIEW Jet Research Center (JRC) is the leader in energetic research and testing for the oil and gas industry. Since introducing jet perforators for