Evaluation of Meter Set Placement and Clearances
|
|
|
- Erica Gardner
- 5 years ago
- Views:
Transcription

1 OTD-17/0002 Evaluation of Meter Set Placement and Clearances Prepared by: Gas Technology Institute Des Plaines, Illinois October 2017

2 FINAL REPORT GTI Project Number Evaluation of Meter Set Placement and Clearances Prepared for: Operations Technology Developments (OTD) OTD Project Number 5.15.h Project Manager: Khalid Farrag, Ph.D., P.E Principal Investigator: Joseph Irwin Gas Technology Institute 1700 S. Mount Prospect Rd. Des Plaines, Illinois October 2017
3 Legal Notice This information was prepared by Gas Technology Institute (GTI) for the Operations Technology Developments (OTD), Neither GTI, OTD, nor any person acting on behalf of any of them: a. Makes any warranty or representation, express or implied with respect to the accuracy, completeness, or usefulness of the information contained in this report, or that the use of any information, apparatus, method, or process disclosed in this report may not infringe privatelyowned rights. Inasmuch as this project is experimental in nature, the technical information, results, or conclusions cannot be predicted. Conclusions and analysis of results by GTI represent GTI's opinion based on inferences from measurements and empirical relationships, which inferences and assumptions are not infallible, and with respect to which competent specialists may differ. b. Assumes any liability with respect to the use of, or for any and all damages resulting from the use of, any information, apparatus, method, or process disclosed in this report; any other use of, or reliance on, this report by any third party is at the third party's sole risk. c. The results within this report relate only to the items tested.
4 Evaluation of Meter Set Placement and Clearances Project Objective The objective of this project is to provide the utilities with knowledge and supported-options regarding the placement of meter sets. Clearance distances from various sources of ignition and house openings have been in place for many years. However, no data or other information exist on why and how these clearance distances were determined. This project will provide the utilities with additional knowledge and data to support meter set placement options and potentially support changes to applicable codes. Project Team Khalid Farrag, Ph.D., P.E., Project Manager: Joseph Irwin, Principal Investigator i
5 Table of Contents Page Table of Contents... ii Table of Figures... iv Executive Summary... 1 a) Tests at Low Flow Rates... 1 b) Tests at Medium Flow Rate... 2 c) Tests with Air-Intake Vents... 4 d) Test at High Flow Rate... 5 e) Gas Leak Measurements with Camera... 5 f) Numerical Modeling of Gas Flow... 6 Chapter 1 - Testing Setup and Configurations... 7 Chapter 2 - Test Results and Discussion Tests at Low Flow Rates Tests Under Various Site Conditions a) Proximity to Open Windows b) Proximity to Open Doors c) Proximity of Wind Shields d) Overhang Above the Meter Set e) Distance from Air Intake f) Measurements around Regulator Vents Tests at High Flow Rates Gas Leak Measurements with Camera Appendix A Meter Placement Standards & Guidelines... A-1 Clearances to Windows and Building Vents... A-1 Clearance to Electric Meters... A-3 Air intake Vents... A-4 References... A-5 Appendix B - Calibration of the Gas Sensors... B-1 Appendix C Modeling Natural Gas Dispersion in the Air... C-1 ii
6 Case 1: Leak hole located at top of the pipe... C-3 Case 2: Effect of Gas Mixture on diffusion profile... C-5 Case 3: Effect of a top cover 8 feet above the pinhole leak... C-5 APPENDIX D - Results of the Testing Program... D-1 iii
7 Table of Figures Page Figure 1 - Low flow rate leaks (a) at meter riser (in %gas) and (b) at regulator (in %LEL)... 2 Figure 2 - Med. flow rate leaks (a) with side shields (b) with overhang... 3 Figure 3 - Med. flow rate leaks (a) with right shield, (b) with left shield... 3 Figure 4 - Gas measurements around leaking regulator... 4 Figure 5 - Measurements with the vents at 3 ft from leak (a) at level with the leak (b) at 3 ft vertical distance from the leak... 4 Figure 6 - Measurements at 55 psig leak in still-wind condition... 5 Figure 7 - View of the gas plume in a high pressure leak rate... 5 Figure 8 - Various examples of limited clearance zones around gas meters... 7 Figure 9 - Gas meters and regulator locations in the outdoor tests... 8 Figure 10 - Location of pinhole leak at the meter riser... 8 Figure 11 - Sensor array and weather station... 9 Figure 12 - Configuration of the sensors locations in some tests with repeated readings... 9 Figure 13 - View of the weather station in the test site Figure 14 - View of the gas sensors and weather station in a typical test setup Figure 15 - Gas measurements (% gas) around a low flow rate leak (a) with wind shield, (b) at higher wind speed Figure 16 - Gas measurements at low flow rate from leaking regulator Figure 17 - In tests with open windows, some sensors were placed inside the room Figure 18 - Gas readings with the window opened (a) at wind speed 5 mph, (b) Higher gas readings at still-wind Figure 19 - Boundary of the 5% gas reading around the leak Figure 20 - Gas measurements at an open door at 4 ft from the meter Figure 21 - Gas reading with wind shields (a) at left side of meter, (b) at right side Figure 22 - Gas reading with the wind blowing perpendicular to the building wall Figure 23 - Gas readings behind the wind shield around the meter set Figure 24 - Readings with overhang above meter (a) closed window, (b) open window Figure 25 - Gas readings inside inlet pipes at various distances from the meter Figure 26 - Gas reading around meter with air intake at 3 ft from the leak source Figure 27 - Measurement around leaking regulator Figure 28 - Measurements at high pressure rate (a) in extended readings above meter, (b) with an overhang Figure 29 - Rebellion Photonics experimental setup Figure 30 - View of the gas plume image from the camera iv
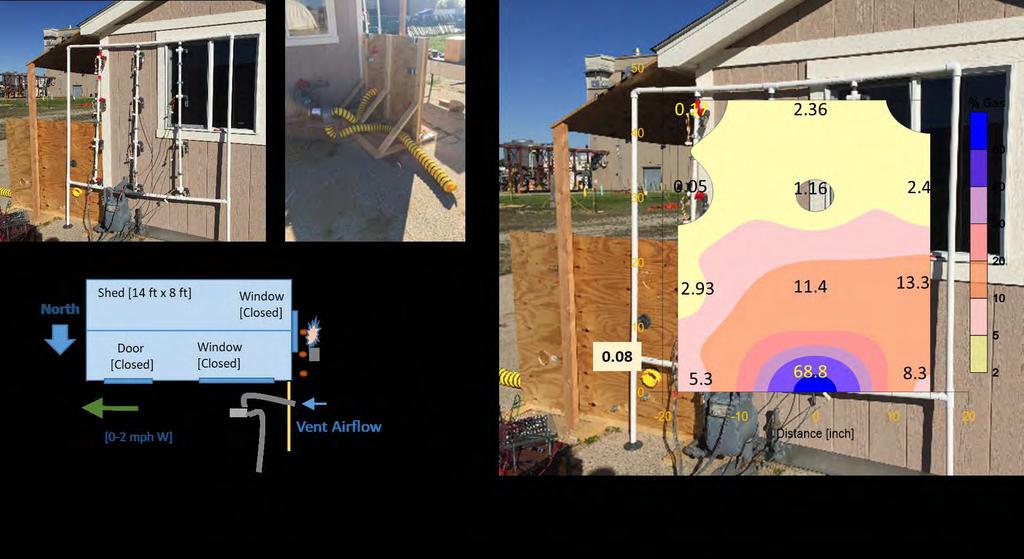
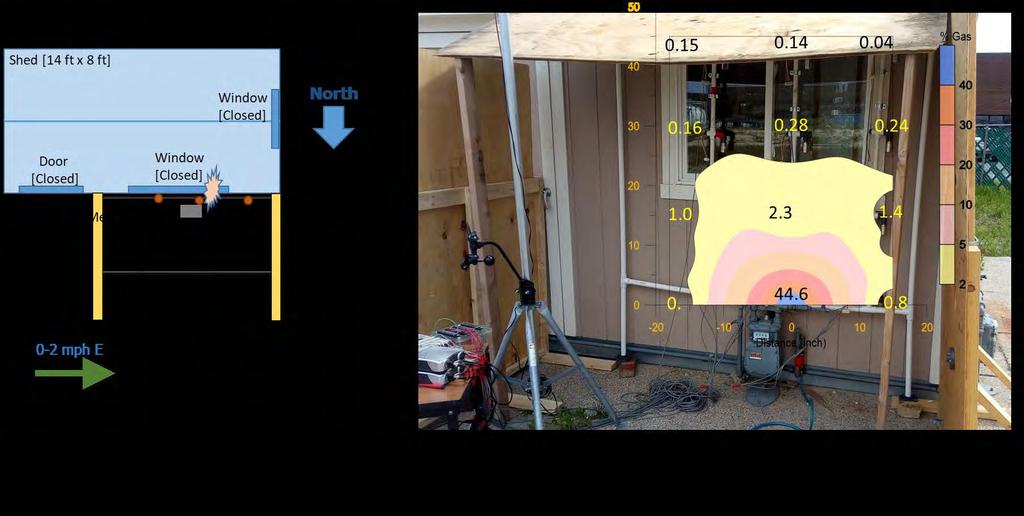
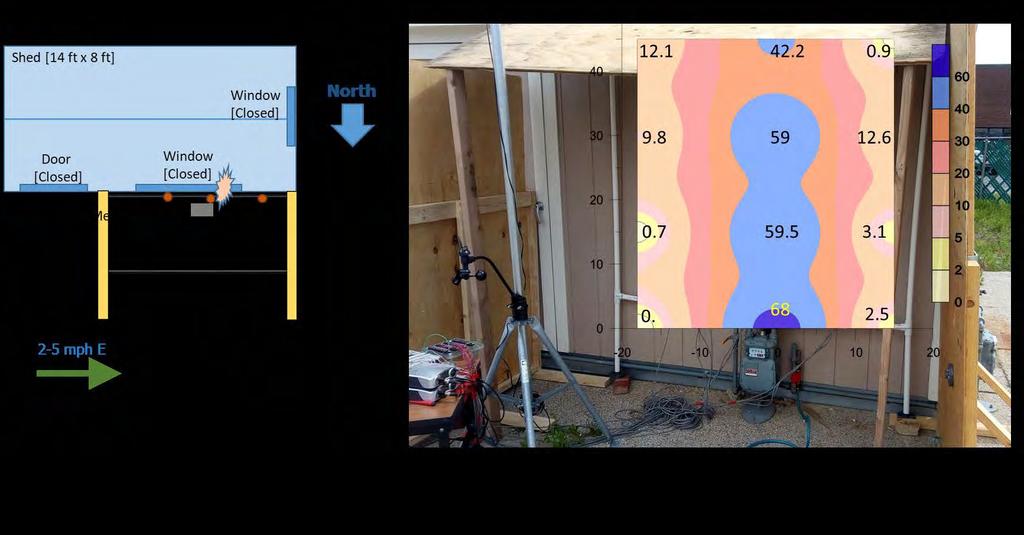
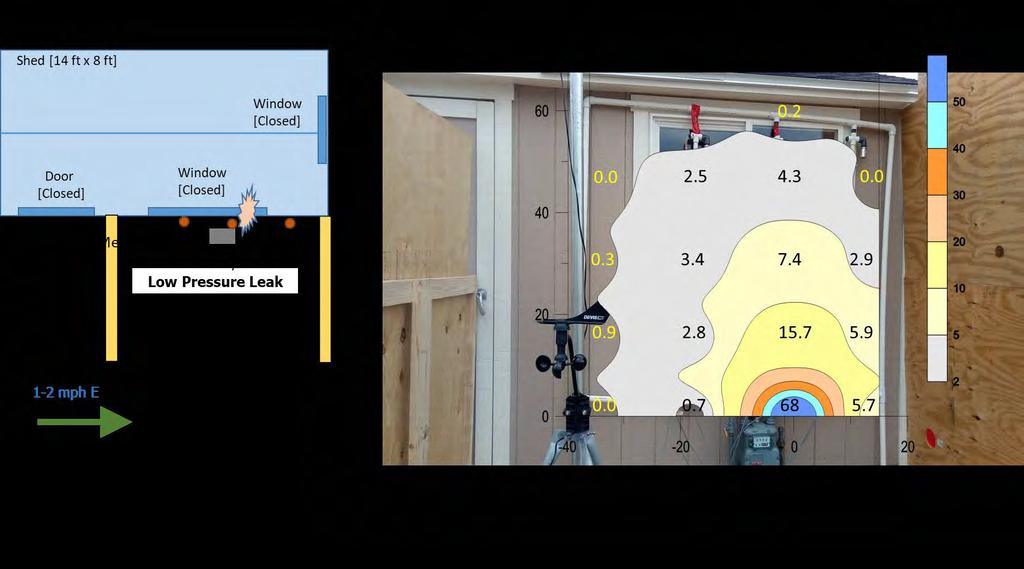
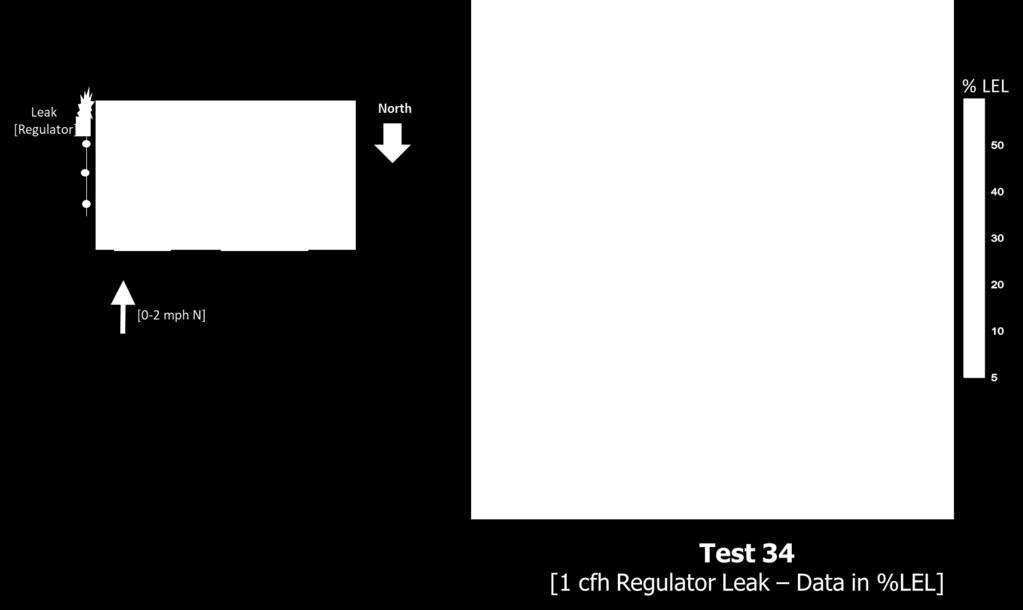
8 Executive Summary Utilities are frequently challenged to find suitable locations to place meter set assemblies that satisfy the various codes and operation requirements. Additionally, meter replacement services are on the rise due to the increase in main and service replacement efforts and increased customer loads. A summary of various codes and utilities guidelines for the placement of meter sets is in Appendix A. A testing program was performed to evaluate the distribution of natural gas concentrations around leaks in outdoor meters and regulators. The test results help in determining if current clearance zones are appropriate with measured levels of safety. The results can also be used to provide utilities with additional knowledge and data to support meter set placement options and to better manage risks through their Distribution Integrity Management Programs (DIMP). The tests were performed in an outdoor building at the GTI testing facility. The setup and configurations of the experimental program are presented in Chapter 1. An array of gas sensors were used to monitor gas concentrations from 0 to 100% gas at 15-inch intervals and at various locations around the leak source. Appendix B provides details of the setup and calibration of these sensors. The results of the testing program are summarized in Chapter 2 and the measurements around the leak sources are presented in detail in Appendix D of the report. The tests were performed with various configurations and the main results can be summarized as follows: a) Tests at Low Flow Rates: These tests were performed at low pressures of 0.25 psig and small 1/16-inch diameter pinhole leaks. The flow rate in these tests was about 3 SCFH (ft 3 /hour). This rate represented typical leaks detected in bubble soap tests of joints at the meter set. The results of these tests in Figure 1-(a) show: - Gas readings at low leak rate in pinholes dissipated quickly at still-wind to 5% gas (100% LEL) at about 1 ft from the leak and were at 2% Gas (40% LEL) within 2 ft from the leak source. Test of small continuous leak in regulator was also performed at a leak rate of 1 SCFH. This rate simulated a rate associated with small periodic venting of a vent-limited regulator. The results in Figure 1-(b) show: - Gas measurements around regulator leaks at low rates of 1 SCFH were 2% gas at distances of about 6 inches from the regulator and dissipated to 5% LEL at 3 ft from the regulator. At this low flow rate, gas measurements below 2% gas were within the minimum clearances of 3 ft to the sides of windows and building vents which are listed in most utilities guidelines. 1

.")
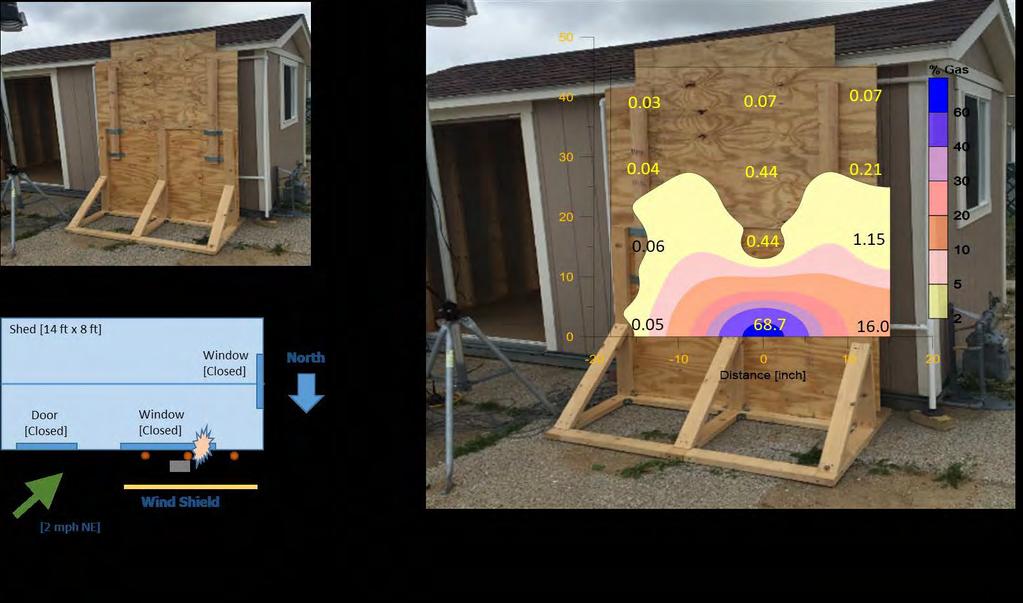
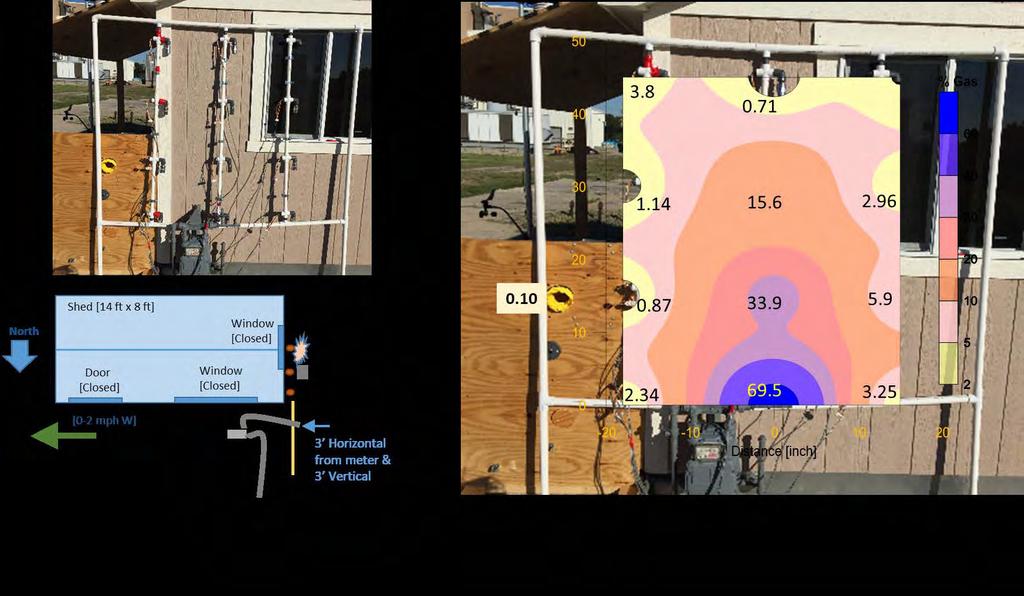
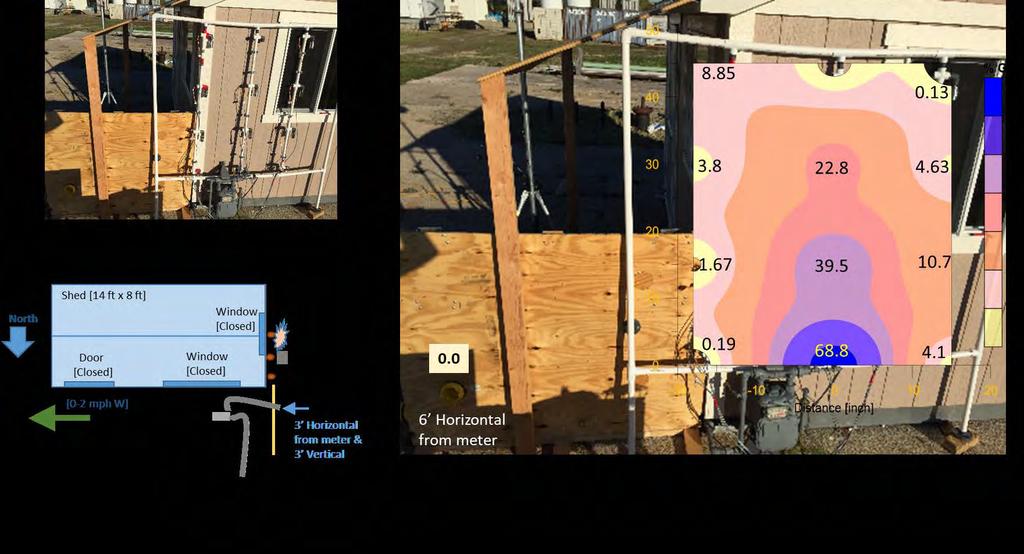
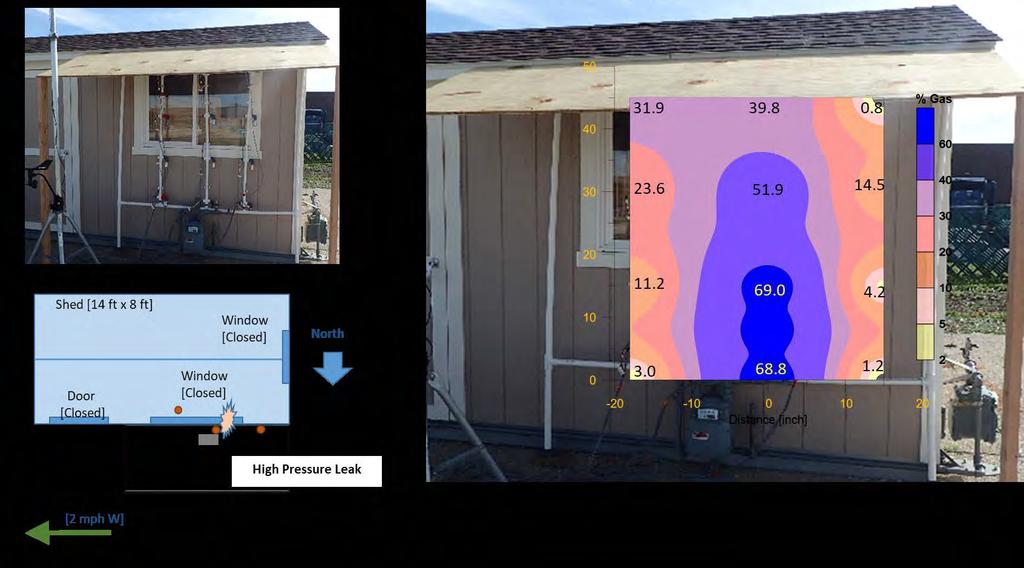
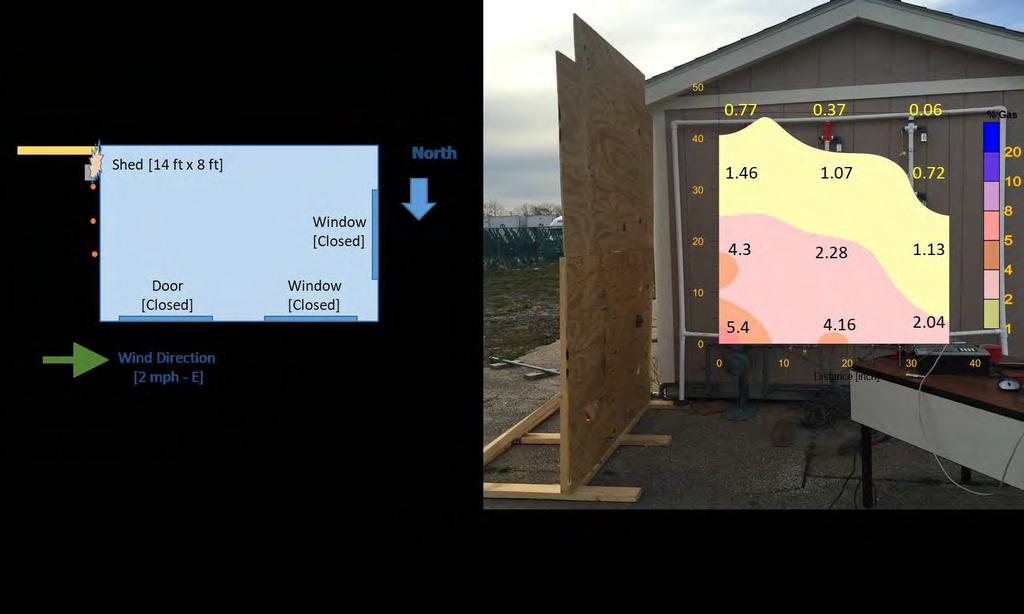
9 Figure 1 - Low flow rate leaks (a) at meter riser (in %gas) and (b) at regulator (in %LEL) b) Tests at Medium Flow Rate: These tests were performed at pressure 0.25 psig and 1/8-inch diameter pinholes, resulting in leak rates of about 11 SCFH. These leaks could be detected by sound and smell several feet away from the source. These tests were performed to evaluate the gas plume in various site conditions and at higher and more conservative flow rate. The results in these tests show: - Measurements at 3 ft horizontal and 5 ft vertical distance from the leak, with side shields and at still-wind, were at the 2% gas level (Figure 2-a). In tests at still-wind conditions and with overhang above the meter, gas concentrations increased to near 5% gas below the overhang (Figure 2-b). - Gas measurements with an open window were not significantly different from the ones with closed window. Gas concentrations between 2% to 5% gas reached the window perimeter for windows 3 ft above and 1 ft at the side of the meter set. No gas measurements were recorded at the opened door located 4 feet east of the meter set. - The unpredictability of wind speed and direction had a large impact on the shape of the leak plume. Wind shields dissipated gas resulting in unsymmetrical distribution around the leak source, depending on the direction of wind and location of the shields as shown in Figure 3. The gas plume dissipated quickly in the presence of high winds. Still-wind conditions at 0-2 mph had higher gas readings than higher speeds of 5-7 mph. - Gas readings around a continuously leaking regulator were made using a regulator with a pinhole in the diaphragm and an upstream pressure of 55 psi. Readings of 2% gas were measured at about 3 ft distance from the bottom of the regulator vent (Figure 4). 2
 with side shields (b) with overhang Figure 3 - Med.")


10 Figure 2 - Med. flow rate leaks (a) with side shields (b) with overhang Figure 3 - Med. flow rate leaks (a) with right shield, (b) with left shield At medium flow rate of 11 SCFH, gas measurements of 2% gas were within a clearance of 3 ft horizontal and 6 ft vertical from the leak source. Some utilities guidelines do not recommend placing the meters directly under windows or building openings. However, when specified, the vertical clearances to the bottom of windows vary from 6 ft to 10 ft. These clearances provide a comparable estimate of the safe zone at this level of flow rate. 3

 and the gas concentration readings in the vent was negligible (at 0 to 0.")
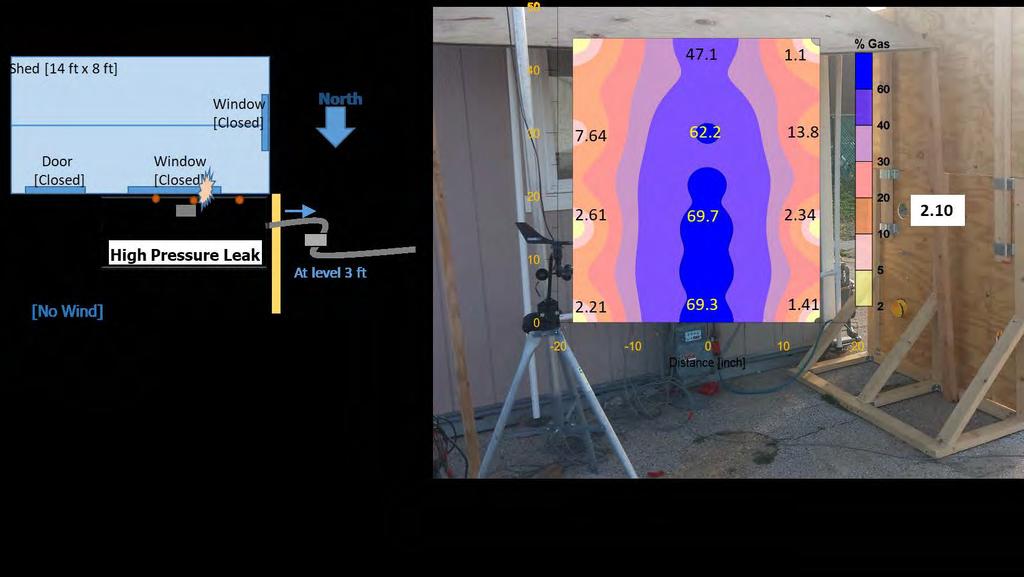
11 Figure 4 - Gas measurements around leaking regulator c) Tests with Air-Intake Vents: Air-intake ports serve as an entrance point for gas to migrate into a building. Tests were performed at leak rates of about 11 SCFH and with various distances between the air-intake port and the leak source. A natural gas sensor was placed inside the port to measure any gas pulled into the duct. An airflow rate through the vacuum fan was applied at 200 SCFM (ft 3 /min) and the gas concentration readings in the vent was negligible (at 0 to 0.1% gas) when the vents were at 3 ft horizontal distance from the leak source (Figure 5). Figure 5 - Measurements with the vents at 3 ft from leak (a) at level with the leak (b) at 3 ft vertical distance from the leak 4


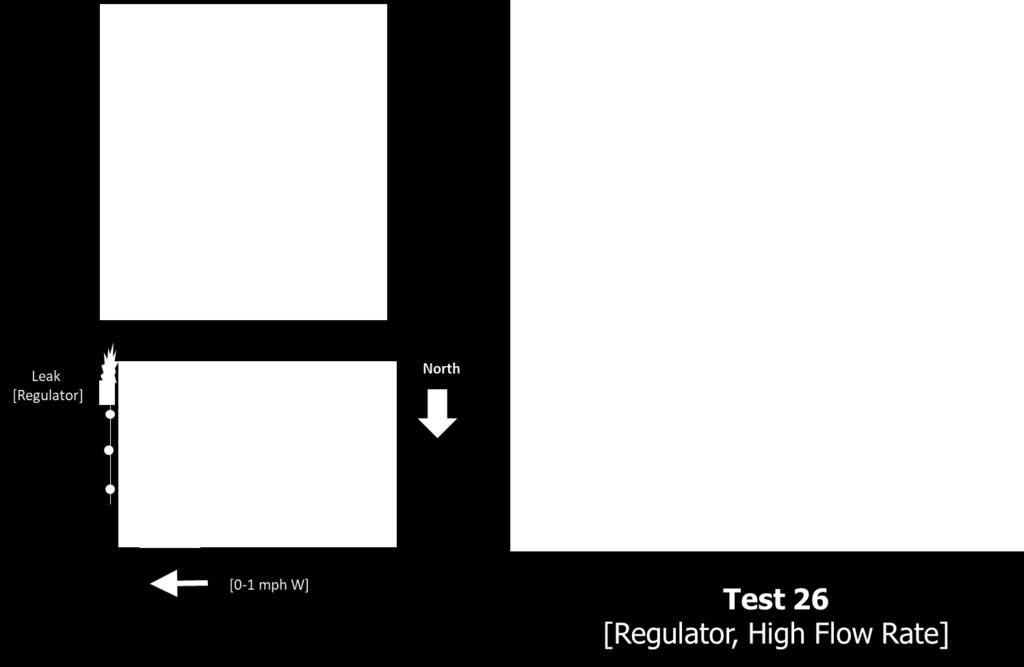
12 d) Test at High Flow Rate: Tests were performed with leaks in the upstream line at 55 psig pressure. These high flow leaks commonly result in line shut off and immediate repair. These tests were performed to identify clearance distance of the 5% gas readings in worst case scenarios. Results of a typical test in Figure 6 show that the 5% gas readings extended to 4 ft horizontal distance and more than 6 ft vertical distance above the meter. Figure 6 - Measurements at 55 psig leak in still-wind condition e) Gas Leak Measurements with Camera: Investigation of the Rebellion Photonics camera was primarily performed to compare the leak plume image with the results of the gas sensors. The camera device however did not provide measurements of actual % gas readings for a correlation with the sensor readings. The camera also did not provide an image of the gas plume with the glass window in the background (Figure 7); resulting in limited comparisons with the results. Figure 7 - View of the gas plume in a high pressure leak rate 5
13 f) Numerical Modeling of Gas Flow: A Finite Element (FE) analytical program was used to model a simple case of methane gas diffusion in the air from a pinpoint leak source. A steady state leak condition with no wind was simulated using the dynamic fluid module in the ANSI FE program. The model simulated a natural gas leaking at pressure 60 psig through various sizes of leak holes. A summary of the FE analysis is presented in Appendix C. The results of the analysis did not compare well with the measurements in the field; mainly due to the assumptions associated with the model and presence of various field conditions; such as wind, air pressure, and characteristics of the leak source; which were not simulated in the analysis. 6


14 Chapter 1 - Testing Setup and Configurations Natural gas operators commonly face the challenge of finding appropriate locations for meter sets to meet their safety requirements. Figure 8 shows field examples of limited clearances between gas meters and electrical boxes, vents, and other building openings. These limitations result in higher risks of natural gas migration to the buildings, not only from regulators but also from miscellaneous leaks that may occur at other fitting connections. Figure 8 - Various examples of limited clearance zones around gas meters In order to realistically demonstrate the profile of a natural gas leak in an outdoor residential meter, measurements of methane concentrations around regulators and gas meters with pinhole leaks were performed in an 8-ft by 14-ft shed installed at the GTI test site. The shed was designed to model leaks in a wide variety of orientations and scenarios. Two meter sets and one regulator were configured on three separate walls, as shown in Figure 9. 7


15 Figure 9 - Gas meters and regulator locations in the outdoor tests Leaks at meter sets were introduced by creating pinholes in the riser next to the meter as shown in Figure 10. Pinholes of sizes 1/8-inch and 1/16-inch diameters were drilled into the riser caps to provide different leak rates. Regulator leaks were also introduced by drilling a 1/8-inch hole into the diaphragm of the regulator and controlling the regulators upstream pressure to provide various leak rates. Figure 10 - Location of pinhole leak at the meter riser Measurements of the gas concentrations around leaks were accomplished by constructing an array of 12 Dynament infrared methane sensors. These dual range sensors were able to measure gas concentrations with high resolution in both the 0-100% LEL (0-5% gas) and 5-100% gas ranges. Appendix B provides details of the setup and calibration of these sensors. Figure 11 shows the configuration of the gas sensors in tests at the north wall of the shed. In some tests, where additional measurements were needed at further distances, one sensor set was moved to further locations and repeated readings were taken at the same testing 8


16 conditions. Figure 12 shows the configuration of the extended measurements. The sensors were connected to a data logger to simultaneously monitor and record the % gas readings. Figure 11 - Sensor array and weather station Figure 12 - Configuration of the sensors locations in some tests with repeated readings A weather station (Figure 13) was installed near the gas meter set in order to monitor the weather conditions such as temperature, air pressure, wind speed, and wind direction near the leak source. Figure 14 shows the setup in a typical test. 9


17 Figure 13 - View of the weather station in the test site Figure 14 - View of the gas sensors and weather station in a typical test setup 10
18 The outdoor tests were performed under a variety of scenarios and environmental conditions and consisted of three main leak rate levels, namely: 1- Tests at low leak flow rates: These tests are performed at low pressure of 0.25 psig and small 1/16-inch diameter pinhole leak. The flow rate in these tests was about 3 SCFH. The results of these tests provided the clearance zones around typical small leaks found in leak surveys and by bubble soap tests of joints at the meter set. 2- Tests at medium flow rate: These tests were performed at pressure 0.25 psig and 1/8- inch diameter pinholes, resulting in leak rates of about 11 SCFH. This higher leak would blow the soap bubble off and could be detected by smell few feet from the source. These tests were performed to evaluate various site conditions, such as building openings, wind speed and direction, wind shield, and overhang. 3- Tests at high flow rate: These tests present leaks in 55 psig pressure line at the upstream from the regulator. Although this high flow leak would commonly result in line shut off and immediate repair, the readings provide insight into the gas plume formation in highpressure leak scenarios. Controllable variables such as wind shields, leaks in the regulator, and locations of openings and vents with respect to the meter set were evaluated mainly at medium flow rate conditions. These variables included: - Tests with windows and doors opened and closed, - Tests with wind shield at one and both sides of the gas meter set, - Tests with overhang above the meter set, - Tests with intake vents at various horizontal and vertical distances from the leak source. The unpredictability of wind speed and direction had a large impact on the shape of the leak plume. The leak plume would dissipate quickly in the presence of high winds. Accordingly, tests were performed at still-wind speeds of 0-2 mph and at relatively medium speeds of 5-7 mph. Once the leak plume was introduced, the wind conditions and gas concentrations were continuously monitored until a fairly steady state was observed. Then the data output from the wind condition and methane sensors was recorded. A summary of the testing parameters and environmental conditions associated with these tests is in Table 1 and details of the results of the tests are shown in Appendix D. 11
19 Table 1 - List of the Parameters and Configurations of the Testing Program Wind Test Shield to Duct Test Name Pressure [psig] Pinhole [inch] Window Door Overhang Speed No. Meter Distance (mph) 1-2 Calibration /8 Closed Closed Calibration-Open W /8 Open Closed Med. Pressure 3 1/8 Closed Closed [Same as #4] 2 6 Med. Rate - Open W /8 Open Closed [Same as #6] 0 8 [Same as #6] 5 9 Med. Rate - Open Door /8 Closed Open Shield-East /8 Closed Closed East Shield East - Open W /8 Open Closed East Shield North /8 Closed Closed North Overhang, Shield - Open W /8 Open Closed West Yes [Same as #13] 7 15 Overhang /8 Closed Closed - Yes Overhang - Open W /8 Open Closed - Yes Duct - A /8 Closed Closed ft Duct - B /8 Closed Closed ft Duct - C /8 Closed Closed ft 0 20 HP - Overhang 55 1/8 Closed Closed - Yes [Same as #20] 2 22 HP - Overhang, Open W 55 1/8 Open Closed - Yes /8 [Same as #22] HP - Shield, Overhang 55 1/8 Closed Closed West Yes 3-ft 0 25 HP - Shield, Overhang 55 1/8 Closed Closed West Yes 3-ft Regulator - HP 55 1/ Regulator - HP, Shield 55 1/8 - - South [Same as #27] Low Flow Rate /16 Closed Closed Low Rate - Shielded /16 Closed Closed E-W Yes High Rate - Shielded 55 1/8 Closed Closed E-W Yes High Rate-Extended Sensors 55 1/8 Closed Closed E-W No Low Rate-Extended sensors /8 Closed Closed E-W No Regulator, Low Rate 55 1/
 reading was about 1 ft from the leak source and the 2% gas (40% LEL) readings were within 2 ft from the leak as shown in Figure 15.")
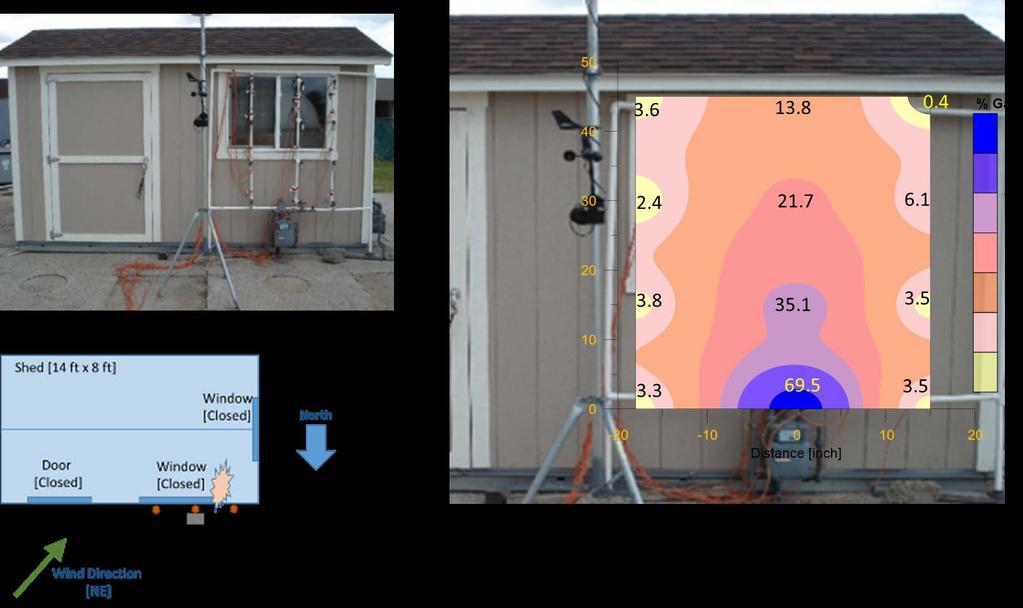
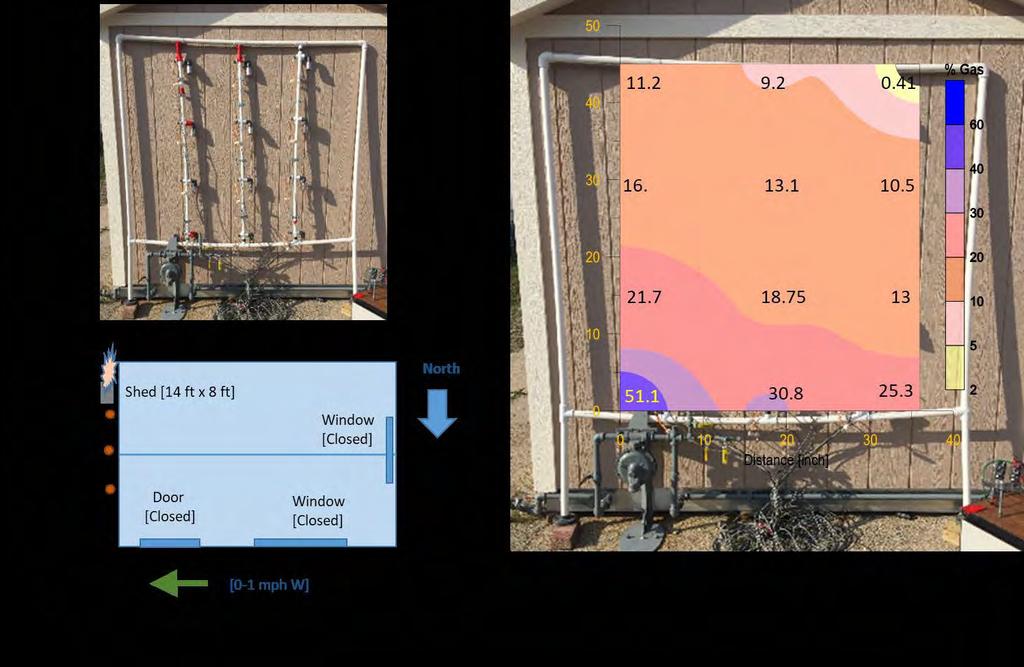
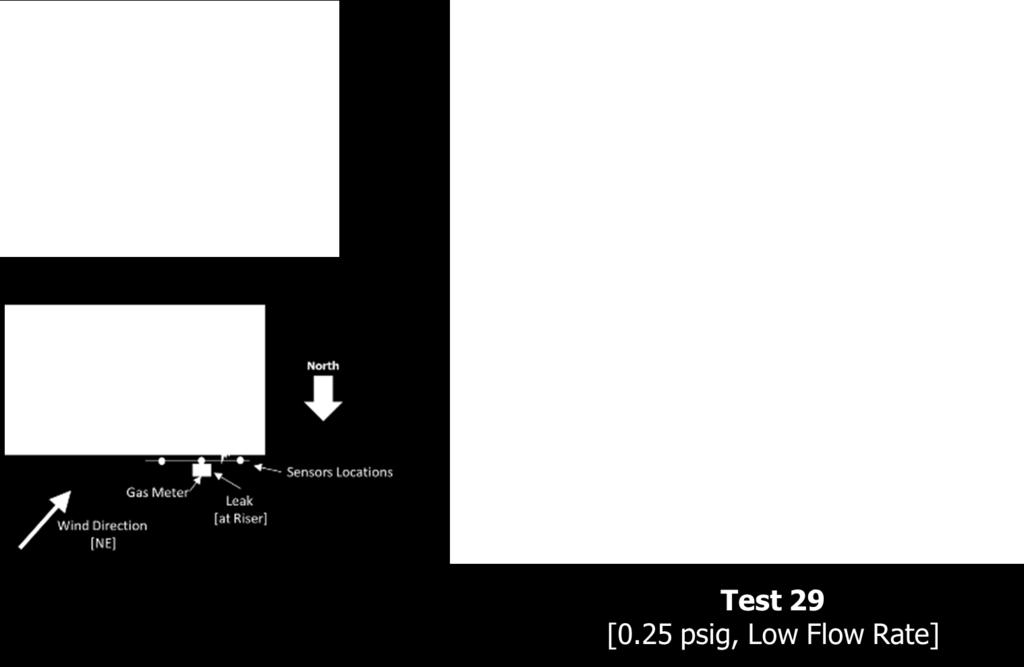
20 Chapter 2 - Test Results and Discussion 1. Tests at Low Flow Rates The gas readings at low leak rate of 3 SCFH measured about 60% gas at about 4 inches from the leak source but dissipated quickly. The 5% gas (100% LEL) reading was about 1 ft from the leak source and the 2% gas (40% LEL) readings were within 2 ft from the leak as shown in Figure 15. Higher readings were monitored with wind-shields and at still-wind conditions (0-2 mph) in Figure 15-a than at higher winds (4 mph) in figure 15-b. Figure 15 - Gas measurements (% gas) around a low flow rate leak (a) with wind shield, (b) at higher wind speed Regulator leaks at a continuous low rate of 1 SCFH was performed with a pinhole in the regulator diaphragm under controlled low pressure. This rate represents possible small venting of a vent-limited regulator types. The gas measurements were small and are plotted in %LEL in Figure 16. Maximum gas readings of 10% LEL (0.5% gas) were recorded at a distance of 1 ft from the regulator. 2. Tests Under Various Site Conditions These tests were performed with a pinhole leak in the meter riser at a rate of 11 SCFH. This rate resulted in higher gas readings at further distances from the meter and allowed for evaluating the gas plume under various site conditions such as proximity to openings, wind speed and direction, wind shield, and overhang over the meter set. 13


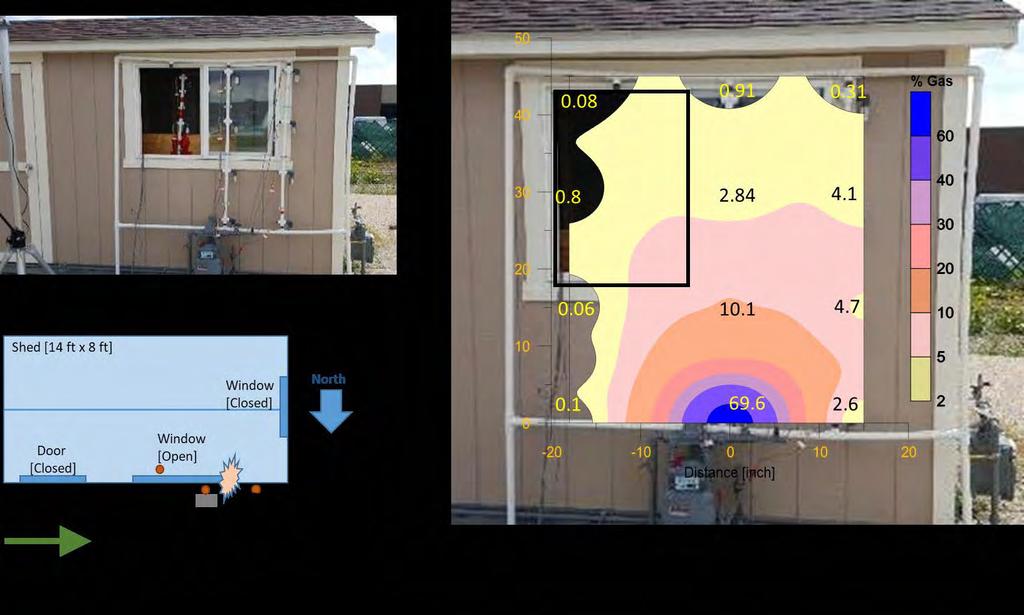
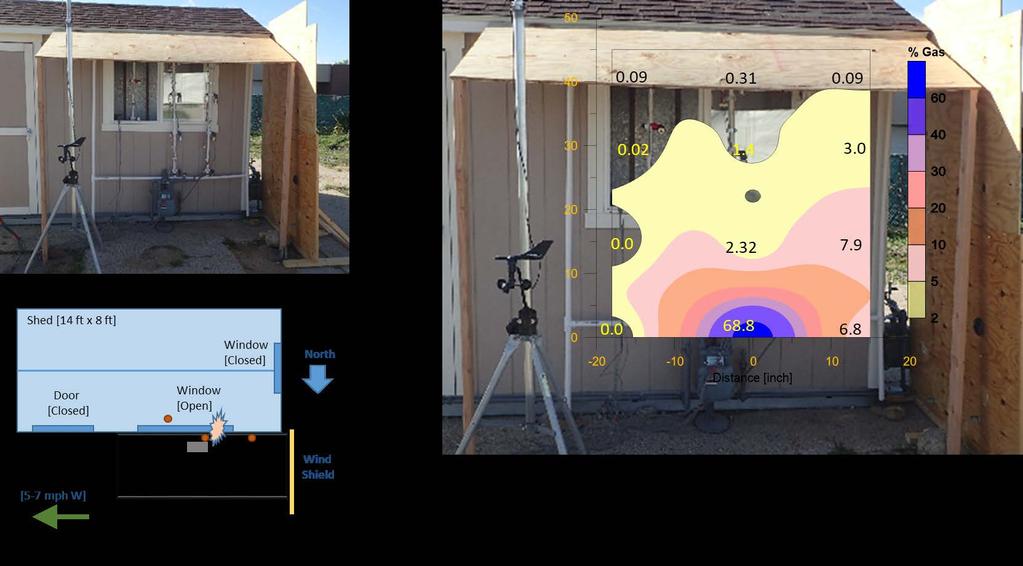
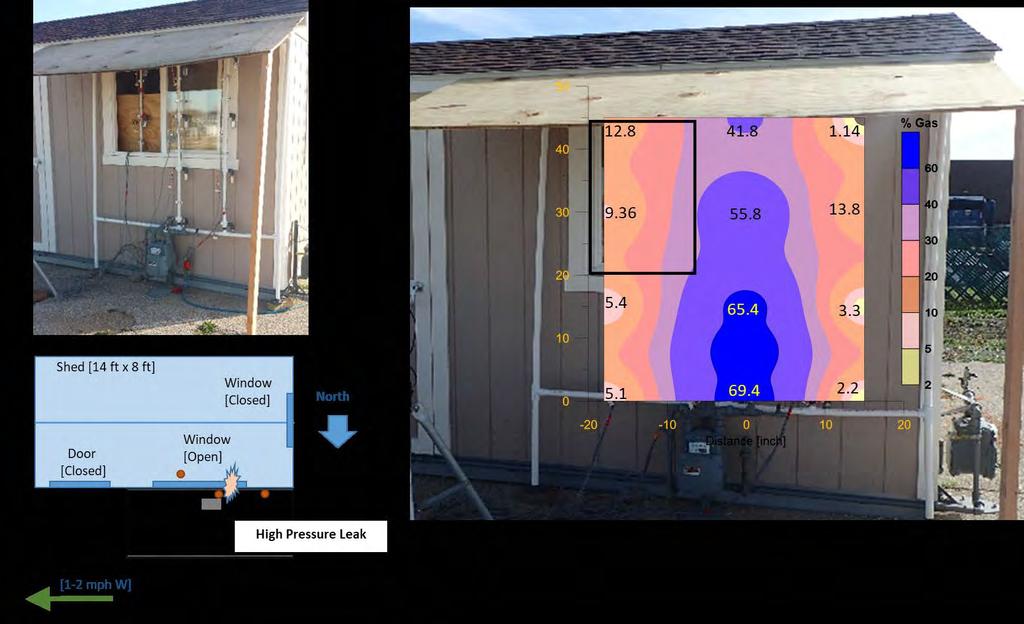
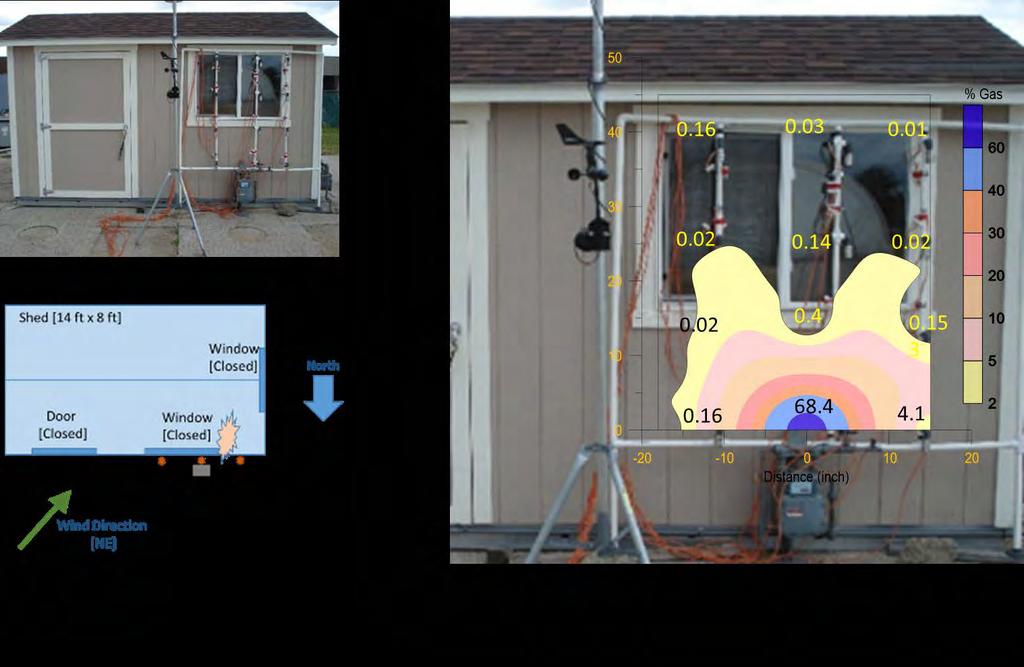
21 Figure 16 - Gas measurements at low flow rate from leaking regulator a) Proximity to Open Windows: One of the crucial clearance values for deciding meter set placement is its proximity to windows that can be opened. Natural gas leak plume is most likely to enter a building through an open window and most meter set location guidelines require horizontal and vertical window clearances of 3 ft and 6 ft, respectively. In tests with open windows, methane sensors were placed behind the open window as shown in Figure 17. The window opening was 3 ft above and 1 ft to the side the leak source. Figure 17 - In tests with open windows, some sensors were placed inside the room 14


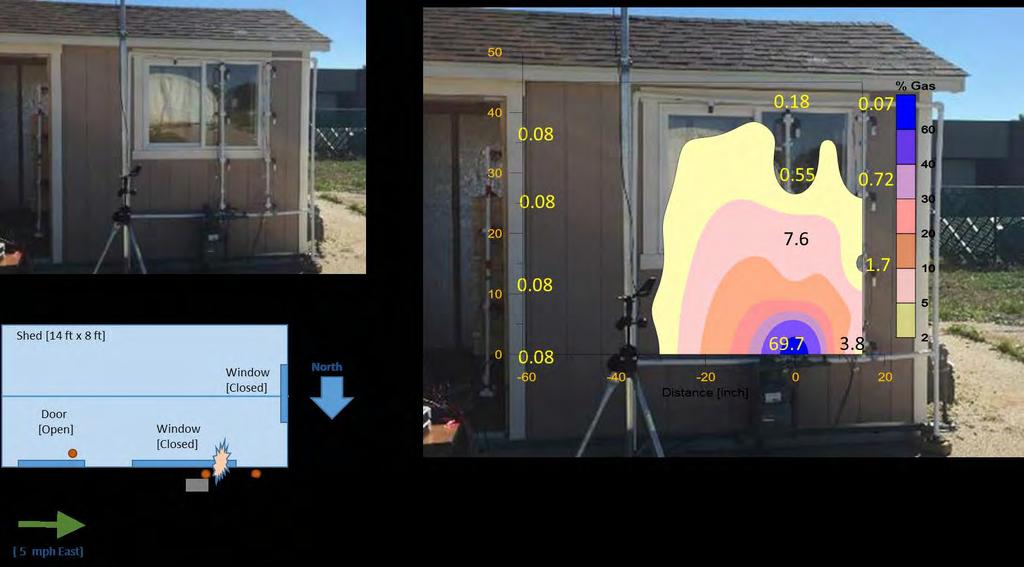
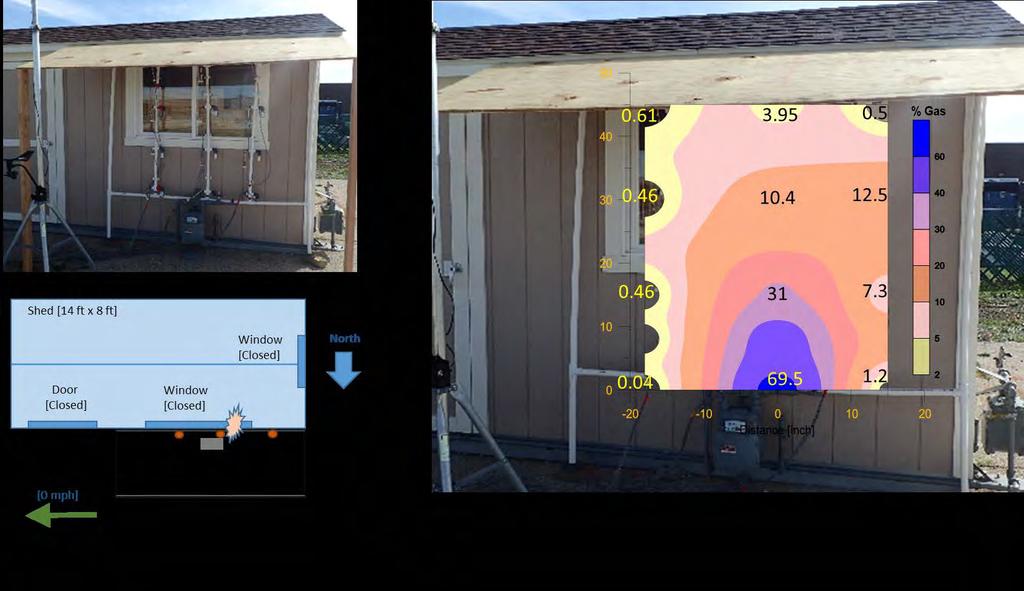
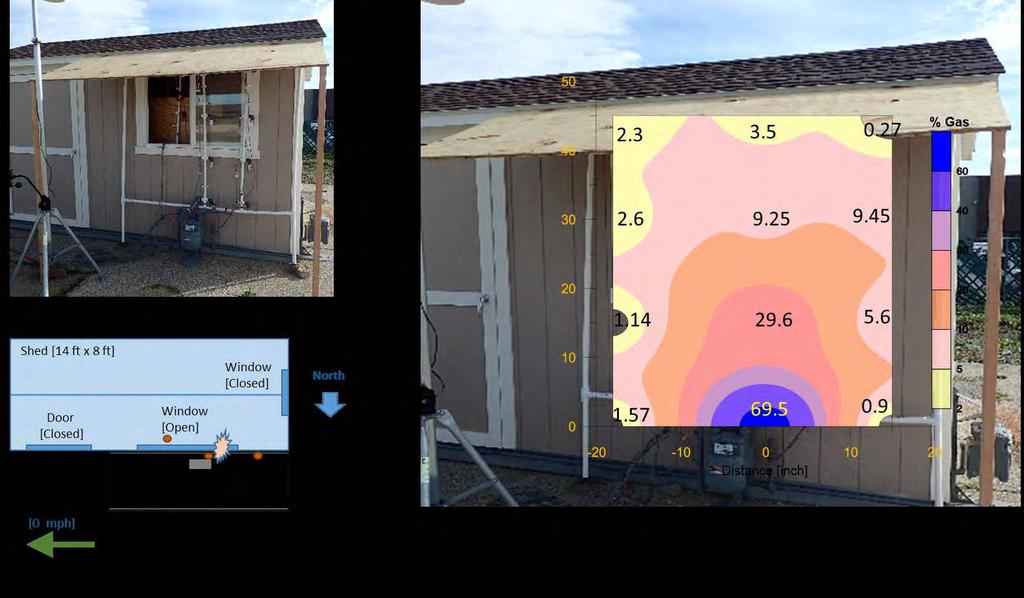
22 The sensors readings behind of the open window were not significantly different from the ones with closed window as shown in Figure 18. However, when all sensors readings were interpolated using a graphing software, the plume s readings of 5% to 10% gas breached the window line. The gas readings near the window depended on the wind speed and direction. Higher gas readings were measured around the window at still-wind condition as shown in Figure 18-b. Extended measurements around the gas meter in Figure 19 show that gas readings at clearance limit at 3 ft horizontal and 5 ft vertical distances were at 2% gas. Figure 18 - Gas readings with the window opened (a) at wind speed 5 mph, (b) Higher gas readings at still-wind Figure 19 - Boundary of the 5% gas reading around the leak 15


23 b) Proximity to Open Doors: Many guidelines require 3-ft horizontal distance, similar to that for windows. The results in Figures 19 show that the reading at 3-ft horizontal distance was about 2% gas at 11 SCFH rate. Gas readings dropped significantly beyond this 3 ft limit. An open door scenario was tested by placing methane sensors inside of an open door frame located 4 feet to the side of the leak source as shown in Figure 20. No significant gas concentration was measured behind the door at this distance. Figure 20 - Gas measurements at an open door at 4 ft from the meter c) Proximity of Wind Shields: Wind speed and direction had a large impact on the shape of the leak plume. Still-wind conditions at 0-2 mph had higher gas readings than wind speeds of 5-7 mph. Wind shields dissipated gas, resulting in unsymmetrical distribution around the source. Figure 21 shows gas plumes with wind shields at the left and right of the gas meter, respectively. Wind speed was reduced behind the shields, resulting in higher accumulation of gas. Figure 21 - Gas reading with wind shields (a) at left side of meter, (b) at right side 16


24 Test performed when the wind was blowing directly at the gas meter is shown in Figure 22. The results show higher dissipation of gas and lower readings around the meter. Alternatively, the placement of a wind shield at a distance of about 1 ft in front of the meter, as shown in Figure 23, resulted in a wind tunnel behind the shield. The air flow behind the shield resulted in lower and uneven distribution of the gas plume. Figure 22 - Gas reading with the wind blowing perpendicular to the building wall Figure 23 - Gas readings behind the wind shield around the meter set 17
 and (b), respectively.")

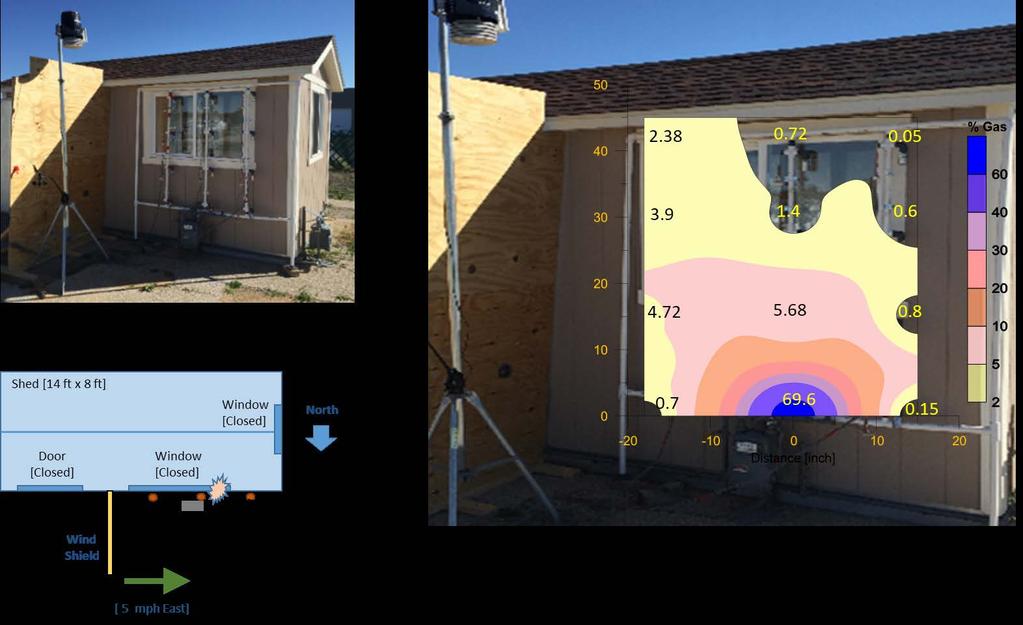
25 d) Overhang Above the Meter Set: An overhanging cover of 2.5 ft wide was placed over the meter set as shown in Figure 24. The gas plumes are shown for a case with the window closed and with an open window in Figures 24 (a) and (b), respectively. The results do not show significant differences in the two cases which were within the standard variations of measurements in similar tests. The results in both figures show higher gas readings of 5% gas below the overhang located about 5 ft above the meter. Figure 24 - Readings with overhang above meter (a) closed window, (b) open window e) Distance from Air Intake: Another parameter affecting the placement of meter sets is air intake and air exhaust ports. Air intake vents, for example, can potentially serve as an entrance point for gas to migrate into a building. An air intake fan was installed in series of tests in which the distance of the air intake was changed relative to the location of the leaking meter set. A natural gas sensor was placed within the vent outlet pipe to measure any gas that was pulled into the fan. The air intake vent was at different horizontal distances of 3 ft and 6 ft away from the leak source. It was placed vertically at the meter level and at 3 ft vertically above ground as shown in Figure 25. The flow rate through the vacuum fan was 200 cfm. Gas measurements inside the vent pipe were compiled from several tests and are shown in the figure. The results are in % gas and show that no measureable gas readings were recorded when the intake vents were more than 3 ft from the meter. Gas measurements around the gas meter are shown in Figure 26 when the air intake pipe was placed 3 ft from the meter. 18


26 Figure 25 - Gas readings inside inlet pipes at various distances from the meter Figure 26 - Gas reading around meter with air intake at 3 ft from the leak source f) Measurements around Regulator Vents: Measurements around a continuously leaking regulator were made using a pinhole in the regulator with an upstream pressure of 55 psi. Leak Readings of 2% gas were measured at about 3 ft distance from the bottom of the regulator vent as shown in Figure

 show a large column of leaking gas traveling straight upward until it reached 5% gas at more than 6 ft above the meter.")
27 Figure 27 - Measurement around leaking regulator 3. Tests at High Flow Rates These tests were made with leaks in 55 psig pressure line at the upstream from the regulator. The results provided an insight into the gas plume formation in high-pressure leaks. The results in Figure 28 (a) show a large column of leaking gas traveling straight upward until it reached 5% gas at more than 6 ft above the meter. Figure 28 (b) shows measurements of gas accumulation when an overhang was placed on the top of the meter set. Figure 28 - Measurements at high pressure rate (a) in extended readings above meter, (b) with an overhang 20
 video camera which displays methane gas leaks in real time. The image uses spectral data for automatic detection and quantification of leaks.")
28 Gas Leak Measurements with Camera: Investigation of the Rebellion Photonics camera was primarily performed to compare the leak plume image with the results of the gas sensors at high pressure leaks. The camera is a Gas Cloud Imaging (GCI) video camera which displays methane gas leaks in real time. The image uses spectral data for automatic detection and quantification of leaks. Figure 29 shows the setup for the camera measurements. The camera device did not provide measurements of actual % gas readings to obtain a correlation with the sensor readings. Figure 30 shows the image of the gas plume at high pressure tests. The image, however, did not detect the gas image at the glass window in the background; resulting in limited comparisons with the sensor results. Figure 29 - Rebellion Photonics experimental setup 21

29 Figure 30 - View of the gas plume image from the camera 22
30 Appendix A Meter Placement Standards & Guidelines The Code of Federal Regulations 49 CFR Part 192 requires that meters and service regulators be installed in accessible locations and be protected from corrosion and other damages, including vehicular damage. The code also provides the following general requirements for the placement of the gas meters and regulators [1]: - Each service regulator must be located as near as practical to the point of service line entrance. - Each meter must be located in a ventilated place and not less than 3 feet from any source of ignition or any source of heat which might damage the meter. - Where feasible, the upstream regulator in a series must be located outside the building, unless it is located in a separate metering or regulating building. With regard to the system protection from damage, the code also specifies the following requirements: - Protection from vacuum or back pressure: If the customer's equipment might create either a vacuum or a back pressure, a device must be installed to protect the system. - Service regulator vents and relief vents: Service regulator vents and relief vents must terminate outdoors, and the outdoor terminal must (1) Be rain and insect resistant; (2) Be located at a place where gas from the vent can escape freely into the atmosphere and away from any opening into the building; and (3) Be protected from damage caused by submergence in areas where flooding may occur. Various other guidelines and manuals specify the minimum spatial clearances between meter sets and windows, vents, utility boxes, and other sources of ignition. The National Fire Protection Association code: NFPA requires that gas meters be located at least 3 ft from sources of ignition [2]. Generally, utility guidelines provide larger clearances to air intake vents and electrical boxes. These guidelines also differ in what is defined as the leak source. Some guidelines, for example, define the leak source as the regulator vent whereas others measure directly from the risers or the edges of the meter set on all sides. Clearances to Windows and Building Vents Minimum horizontal clearances to the sides of windows and building vents range from 18 inches to 36 inches in utility manuals. Some specifications do not recommend placing the meters directly under windows or building openings [3, 6]. However, when specified, the vertical clearances to the bottom of windows vary from 6 ft to 10 ft. Figures A-1 to A-4 show the spatial clearance requirements from several utilities specifications. A-1

31 Figure A-1 Spatial clearances to building openings, vents, and windows [3] Figure A-2 Horizontal clearance of 18 inches to vents and windows [4] A-2
![Figure A-3 Minimum clearances to building openings and vents [5] Figure A-4 Horizontal clearance of 2 ft to openings.](/docs-images/84/90832135/images/32-0.jpg "Here, meter sets are not allowed under an opening [6] Clearance to Electric Meters Most of utilities guidelines specify a minimum horizontal")
![distance of 36 inches from the meterregulator assembly to the edge of an electric meter panel as shown in Figure A-5 [3].](/docs-images/84/90832135/images/32-2.jpg "A vertical clearance of 48 inches is also specified for the electric meter above the gas meter level.")
32 Figure A-3 Minimum clearances to building openings and vents [5] Figure A-4 Horizontal clearance of 2 ft to openings. Here, meter sets are not allowed under an opening [6] Clearance to Electric Meters Most of utilities guidelines specify a minimum horizontal distance of 36 inches from the meterregulator assembly to the edge of an electric meter panel as shown in Figure A-5 [3]. A vertical clearance of 48 inches is also specified for the electric meter above the gas meter level. Table A- 1 shows the clearances to electric boxes and other openings in several utilities guidelines. A-3
![Figure A-5 Electric and gas meter set separation dimensions and clearances [3] Air intake Vents When combustion equipment is a concern, a 3-ft minimum horizontal distance from combustion exhaust fans](/docs-images/84/90832135/images/33-0.jpg "and an 8-ft minimum distance from combustion air-intake vents are also specified as shown in Figure A-6.")
33 Figure A-5 Electric and gas meter set separation dimensions and clearances [3] Air intake Vents When combustion equipment is a concern, a 3-ft minimum horizontal distance from combustion exhaust fans and an 8-ft minimum distance from combustion air-intake vents are also specified as shown in Figure A-6. Figure A-6 Spatial clearance requirements from ignition sources [3] Table A-1 summaries the variances between the guidelines for meter set clearances by various utilities. A-4
34 Table A-1 Summary of utility meter set clearance guidelines Minimum Distance From: Utility State Electrical Equipment/ Ignition Source Window Door Intake Vent Exhaust Vent Alliant Energy Wisconsin 3' from ignition source, 5' horizontal from transformer 3' radial 3' radial 10' radial 3' PSE&G New Jersey 3' radial 2' radial 2' radial 2' radial 2' radial Pacific Gas & Electric National Grid California New York 3' horizontal, 10' vertical 12" from electric meter 3' horizontal, 10' vertical 18" horizontal, 6' vertical 3' horizontal, 10' vertical 18" horizontal, 6' vertical 8' horizontal 3' horizontal Requires Engineering Approval 18" horizontal, 6' vertical City of Richmond Virginia 3' 3' 3' 10' 3' MidAmerican Energy Iowa 3' horizontal, 6' 3' horizontal, 6' 3' horizontal, 6' 3' horizontal, 6' 3' horizontal, 6' vertical vertical vertical vertical vertical Wisconsin Public Service Requires engineering Wisconsin 3' radial 3' radial 3' radial approval 3' radial References 1. Code of Federal Regulations, 49 CFR Parts to , Customer meters and regulators 2. National Fuel Gas Code, NFPA , National Fire Protection Association (NFPA) and the American Gas Association (AGA), ANSI Z Electric & Gas Service Requirements, Pacific Gas Electric Company (PG&E) Greenbook, National Grid Blue Book, Revision 0, June Installation Requirements for Gas Meter Set Assemblies, Puget Sound Energy (PSE), Outside Meter Set Location, Public Service Electric and Gas C. (PSE&G), A-5

35 Appendix B - Calibration of the Gas Sensors Several infrared (IR) methane sensors were investigated for monitoring gas concentration in the outdoor tests. The selection requirements for the sensors were: - Ability to continuously and remotely monitor and record gas concentrations using a data logger system, - Accurate measurements in a dual-range of concentrations from 0-5% and 5-100% gas, - Small size to accurately monitor changes of gas concentrations in an array of sensors of about 1 ft spacing, - Intrinsically safe and able to operate under variable temperature and moisture conditions in an outdoor testing environment. Two IR types were selected and acquired for testing; namely, the Dynament and Sensit sensors shown in Figure B-1. The Sensit sensor was the type used in handheld devices made by Sensit. However, the Sensit sensors were delivered without a protective case and required more elaborate data acquisition setup than the Dynament units. Figure B-1 Infrared sensors, Left: Dynament, Right: Sensit The Dynament Premier MSH-P sensors (manufactured by Dynament Ltd. Derbyshire, UK) were used in the outdoor tests. They are delivered in intrinsically safe housings and monitor 0-100% methane concentrations with an output of 0-5 Volts. The device resolution at high gas concentrations is shown in Figure B-2. A Campbell Scientific CR23X data-logger hardware and software were configured for monitoring and recording the gas concentrations (Figure B-3). The data-logger allowed for continuous recording of multiple sensors placed at different locations. B-1


36 Figure B-2 Dynament Premier resolution at high gas concentrations Figure B-3 Data logger for the sensors output data management The Dynament sensor was calibrated in a controlled chamber in the lab. The sensor was placed inside the sealed chamber and a known volume of methane gas was injected with a syringe as shown in Figure B-4. The gas concentration inside the chamber was verified with a Sensit CGI gas sensor as shown in Figure B-5. Using the data logger, the sensor s voltage outputs were recorded at several gas concentrations. B-2


37 Figure B-4 (a) The calibration chamber, (b) Gas measurement with the sensor inside the chamber Figure B-5 Measurement of % methane in the chamber A comparison between the CGI gas measurements and the sensor output is shown in Figure B-6. The results show a strong correlation between the sensors reading and the applied gas concentration. A calibration curve was generated for the sensor as shown in Figure B-7. B-3
38 Figure B-6 Sensors output and gas concentration in the calibration chamber Figure B-7 Dynament voltage output at various gas concentrations B-4

39 Gas measurements at various distances from the leak source were also performed in the lab under a controlled flow rate from a pinhole leak. The sensor was placed at various distances of 6-inch increments above the pinhole leak source as shown in Figure B-8. The gas measurements by the sensor and a CGI gas meter are plotted in Figure B-9. Gas measurements at various distances from the leak source are shown in Figure B-10. The results show an exponential drop of gas concentration with the increase of the distance from the leak source. Figure B-8 Test rig for gas measurements at various distances from a pinhole leak Figure B-9 Gas measurements by the sensors and a CGI gas meter B-5


40 Figure B-10 Gas Measurements at various distances from the leak source Throughout the outdoor field tests, gas readings were periodically confirmed at various locations by direct measurements using a Sensit gas meter as shown in Figure B-11. Gas flow rates from the leak sources were also measured in some tests using a High-Flow Sampler and a Laminar Flow Meter devices as shown in Figures B-12 and B-13, respectively. Figure B-11 Gas measurements around the leak source using a Sensit gas meter B-6


41 Figure B-12 Gas flow measurements using the High-Flow Sampler device Figure B-13 Gas flow rate measurements using Laminar Flow Meters B-7


42 Appendix C Modeling Natural Gas Dispersion in the Air A Finite Element (FE) analytical program was used to model a simple case of methane gas diffusion in the air from a pinpoint leak source. A steady state leak condition with no wind was simulated using the dynamic fluid module in the ANSI FE program. A three dimensional FE mesh represented a leak at the top of a 2-ft high riser pipe placed 6 inches in from of an impermeable wall boundary as shown in C-1. Gas flow was permitted to flow through all the other boundaries. The model dimensions of 60 ft x 30 ft x 5 ft were chosen in order to reduce the effect of the other boundaries on the gas dispersion. Figure C-1 Schematic of the 3D domain of the leak area In order to model the gas diffusion gradient near the leak source, the FE domain had a fine mesh near the leak hole. The fine mesh extended for 1 feet, followed by a near field region of about 3 feet, and then the far field region covering the rest of the domain. Figure C-2 shows the mesh cells around to the leak hole. The analysis simulated a methane jet in an air environment. Due to the turbulence generated at the borders of the exit, the gas will undergo diffusion and deceleration. A free jet upon leaving the outlet will entrain the surrounding air, expand, and decelerate. A turbulent free jet consists of four regions as shown in Figure C-3. The first region is a short region about 6.4 time the nozzle diameter, followed by a transition region of about 8 times the nozzle diameter. This is followed by an established flow region and the transverse velocity profile in this region is selfpreserving. The final region is where the residual centerline velocity reduces rapidly within a short distance to less than 0.3 m/s. C-1

43 Figure C-2 The FE mesh in the x-z plane showing increased granularity near the leak source C-3 Configuration of turbulent free jet (After Tuve, Heat Piping Air Conditioning, 25(1), 1953) The model simulated a natural gas of 95% and 100% methane content leaking at pressure 60 psig through various sizes of leak holes of ¼-inch, 1/8 inch, and 1/16-inch diameters. Table C-1 shows the model geometry and parameters used in the analysis and he following section present the results of the FE simulations. C-2
 Pipe Diameter 0.75\" Press Vel.")
44 Table C-1 Geometry and Model Parameters Geometry CFD Model Settings Geometry Parameter Details Model Settings Leak Hole - Variable 0.25", 0.125" & " Space, Time 3D, Steady Distance from house wall 6" Turbulence Model k-e (realizable) Pipe Diameter 0.75" Press Vel. Coupling SIMPLE Height of leak hole from ground 24" Methane content 95% and 100% Leak hole location Top and side of pipe Methane Density Incompressible ideal gas Distance from right and left boundary (x-direction) 30 ft. Methane Viscosity 1.72e-05 Distance of top boundary from ground (y-direction) Inlet Pressure 30 ft. Specific Heat Piecewise polynomial 60 psi Case 1: Leak hole located at top of the pipe Figures C-4 and C-5 show the front and side views of three simulations with leak sizes of , 0.125, and 0.25 inches. The results are presented in percentages of methane mole fractions. The analysis is useful in comparing the effect of various parameters on the dispersion profile. However, they do not match the measurements in the outdoor tests and suggest further analysis is needed, with other model selections and more accurate properties, to realistically represent field observations. Figure C-4 Methane diffusion with different pinhole sizes (front view) C-3

45 Figure C-5 Methane diffusion with different pinhole sizes (side view) The discrepancy between the model outputs and field observations are obvious in Figure C-6, which shows the distribution of methane fraction with distance from the leak source. The results show much lower concentration at 5 inches above the leak source than the observed high concentration of about 65% gas in the outdoor tests Methane Volume Fraction (ppm) inch above leak hole exit 10 inch above leak hole exit 30 inch above leak hole exit Transverse Distance above the leak hole (inches) Figure C-6 Distribution of methane volume fraction around the exit of a 0.25" leak hole C-4

 and 95% methane- 5%ethane (right) Case 3: Effect of a top cover 8 feet above the pinhole")
46 Case 2: Effect of Gas Mixture on diffusion profile Analysis was performed with 100% and 95% methane contents in the gas mixture to evaluate its impact on gas diffusion as shown in Figure C-7. The comparison between the diffusion of 100% methane (CH4) and 95% CH4-5% ethane (C2H6) mix does not show significant differences. Figure C-7 Methane mole fraction contours for 100% methane (left) and 95% methane- 5%ethane (right) Case 3: Effect of a top cover 8 feet above the pinhole leak Figure C-8 shows gas diffusion with a top cover at 8 ft above the leak source. Figure C-8 Effect of top cover at 8 feet above a 0.25 leak hole C-5
47 APPENDIX D - Results of the Testing Program Wind Test Shield to Duct Wind Test Name Pressure [psig] Pinhole [inch] Window Door Overhang Speed No. Meter Distance Direction Temp. (F) Humidity Atm. Pressure Notes (%) (Hg) (mph) 1-2 Calibration /8 Closed Closed NE - 3 Calibration-Open W /8 Open Closed NE - 4 Med. Pressure 3 1/8 Closed Closed W [Same as #4] 2 NE Med. Rate - Open W /8 Open Closed W Tests 6-19: Rate 11 CFH 7 [Same as #6] [Same as #6] 5 E Med. Rate - Open Door /8 Closed Open E Shield-East /8 Closed Closed East E Shield East - Open W /8 Open Closed East N Shield North /8 Closed Closed North NE Overhang, Shield - Open W /8 Open Closed West Yes W [Same as #13] 7 W Overhang /8 Closed Closed - Yes W Overhang - Open W /8 Open Closed - Yes E Duct - A /8 Closed Closed ft 0-2 W Duct at meter level 18 Duct - B /8 Closed Closed ft 0-1 W Duct 3-ft from ground 19 Duct - C /8 Closed Closed ft Duc 3-ft from ground 20 HP - Overhang 55 1/8 Closed Closed - Yes - 2 W Tests 20-25: Rate 33 CFH 21 [Same as #20] 2 W HP - Overhang, Open W 55 1/8 Open Closed - Yes W /8 [Same as #22] - 2 W HP - Shield, Overhang 55 1/8 Closed Closed West Yes 3-ft HP - Shield, Overhang 55 1/8 Closed Closed West Yes 3-ft 0-1 W Regulator - HP 55 1/ W Tests 26-28: Rate 24 CFH 27 Regulator - HP, Shield 55 1/8 - - South E [Same as #27] 2-5 E Low Flow Rate /16 Closed Closed NE Low Rate 2.9 CFH 30 Low Rate - Shielded /16 Closed Closed E-W Yes 0-2 E Low Rate 2.9 CFH 31 High Rate - Shielded 55 1/8 Closed Closed E-W Yes 0-4 E High Rate 33. CFH 32 High Rate-Extended Sensors 55 1/8 Closed Closed E-W No E High Rate 33. CFH 33 Low Rate-Extended sensors /8 Closed Closed E-W No E Med. Rate 11.0 CFH 34 Regulator, Low Rate 55 1/ N Low leak, 1. CFH D-1

48 D-2
49 D-3
50 D-4
51 D-5
52 D-6
53 D-7

54 D-8
55 D-9
56 D-10
57 D-11

58 D-12
59 D-13
60 D-14
61 D-15
62 D-16
63 D-17
64 D-18
65 D-19
66 D-20
67 D-21
68 D-22
69 D-23
70 D-24
71 D-25

72 [END OF DOCUMENT] D-26
73 Operations Technology Development, NFP 1700 South Mount Prospect Road Des Plaines, Illinois FAX: Operations Technology Development, NFP All rights reserved
COMPUTATIONAL FLOW MODEL OF WESTFALL'S LEADING TAB FLOW CONDITIONER AGM-09-R-08 Rev. B. By Kimbal A. Hall, PE
 COMPUTATIONAL FLOW MODEL OF WESTFALL'S LEADING TAB FLOW CONDITIONER AGM-09-R-08 Rev. B By Kimbal A. Hall, PE Submitted to: WESTFALL MANUFACTURING COMPANY September 2009 ALDEN RESEARCH LABORATORY, INC.
Outside Air Nonresidential HVAC Stakeholder Meeting #2 California Statewide Utility Codes and Standards Program
 1 Outside Air Nonresidential HVAC Stakeholder Meeting #2 California Statewide Utility Codes and Standards Program Jim Meacham, CTG Energetics Agenda 2 In Situ Testing Results Reduced Ventilation after
Gas Accumulation Potential & Leak Detection when Converting to Gas
 Gas Accumulation Potential & Leak Detection when Converting to Gas Coal to Gas / PCUG Conference Chattanooga, TN October 29, 2013 Robert G. Mudry, P.E. Airflow Sciences Corporation Introduction Coal to
AIRFLOW GENERATION IN A TUNNEL USING A SACCARDO VENTILATION SYSTEM AGAINST THE BUOYANCY EFFECT PRODUCED BY A FIRE
 - 247 - AIRFLOW GENERATION IN A TUNNEL USING A SACCARDO VENTILATION SYSTEM AGAINST THE BUOYANCY EFFECT PRODUCED BY A FIRE J D Castro a, C W Pope a and R D Matthews b a Mott MacDonald Ltd, St Anne House,
VACUUM EXCAVATION BEST PRACTICE & GUIDELINE
 D R A F T VACUUM EXCAVATION BEST PRACTICE & GUIDELINE GENERAL DOCUMENT Gas Technology Institute 1700 S. Mount Prospect Rd. Des Plaines, Illinois 60018 www.gastechnology.org Version 09 November 2011 The
OPTIMIZING THE LENGTH OF AIR SUPPLY DUCT IN CROSS CONNECTIONS OF GOTTHARD BASE TUNNEL. Rehan Yousaf 1, Oliver Scherer 1
 OPTIMIZING THE LENGTH OF AIR SUPPLY DUCT IN CROSS CONNECTIONS OF GOTTHARD BASE TUNNEL Rehan Yousaf 1, Oliver Scherer 1 1 Pöyry Infra Ltd, Zürich, Switzerland ABSTRACT Gotthard Base Tunnel with its 57 km
L 100. Bubble-Tube Level System. Installation, Operation and Maintenance Instructions
 L 100 Bubble-Tube Level System Installation, Operation and Maintenance Instructions Figure 1 Contents Section Description Page 1.0 Introduction 2 2.0 Specifications 3 3.0 Installation 3 4.0 Warranty 6
CFD SIMULATIONS OF GAS DISPERSION IN VENTILATED ROOMS
 CFD SIMULATIONS OF GAS DISPERSION IN VENTILATED ROOMS T. Gélain, C. Prévost Institut de Radioprotection et de Sûreté Nucléaire (IRSN), Saclay, France Abstract In order to better understand the risks due
Residential and Small Commercial
 Page 1 of 7 Companies Affected: NIPSCO CGV CMD CKY COH CMA CPA REFERENCE 49 CFR Part 192.353, 192.355, 192.357 1. GENERAL The purpose of this standard is to provide requirements for the inspection or installation
Single Phase Pressure Drop and Flow Distribution in Brazed Plate Heat Exchangers
 Purdue University Purdue e-pubs International Refrigeration and Air Conditioning Conference School of Mechanical Engineering 2016 Single Phase Pressure Drop and Flow Distribution in Brazed Plate Heat Exchangers
Rotary air valves used for material feed and explosion protection are required to meet the criteria of NFPA 69 (2014)
") Rotary air valves used for material feed and explosion protection are required to meet the criteria of NFPA 69 (2014) 12.2.4.2. 12.2.4.2 rotary valve design criteria (close clearance) 12.2.4.3 THE DESIGN
Rotary air valves used for material feed and explosion protection are required to meet the criteria of NFPA 69 (2014) 12.2.4.2. 12.2.4.2 rotary valve design criteria (close clearance) 12.2.4.3 THE DESIGN
HYDROGEN RISK ANALYSIS FOR A GENERIC NUCLEAR CONTAINMENT VENTILATION SYSTEM
 HYDROGEN RISK ANALYSIS FOR A GENERIC NUCLEAR CONTAINMENT VENTILATION SYSTEM u, Z. 1 and Jordan, T. 2 Karlsruhe Institute of Technology, P.O. Box 3640, 76021 Karlsruhe, Germany 1 zhanjie.xu@kit.edu, 2 thomas.jordan@kit.edu
XDF BURNERS DUAL FUEL EXCESS AIR BURNER FEATURES DESCRIPTION EXCESS AIR OPERATION
 DUAL FUEL EXCESS AIR BURNER MODEL: 3610, 3651 Revision: 0 FEATURES Burns all fuel gases or light oils Nozzle mix design for on ratio control or excess air 350% excess air all sizes on gas or oil Turndown
DEFINING HAZARDOUS ZONES ELECTRICAL CLASSIFICATION DISTANCES
 DEFINING HAZARDOUS ZONES ELECTRICAL CLASSIFICATION DISTANCES Howard, G.W. 1, Tchouvelev, A.V. 2, Cheng, Z. 2 and Agranat, V.M. 1 1 Hydrogenics Corp., 5985 McLaughlin Road, Mississauga, Ontario, L5R 1B8
HYDROGEN - METHANE MIXTURES : DISPERSION AND STRATIFICATION STUDIES
 HYDROGEN - METHANE MIXTURES : DISPERSION AND STRATIFICATION STUDIES A. Marangon, M.N. Carcassi Department of Mechanical, Nuclear and Production Engineering, University of Pisa, Via Largo Lucio Lazzarino,
Computer Simulation Helps Improve Vertical Column Induced Gas Flotation (IGF) System
 System") JOURNAL ARTICLES BY FLUENT SOFTWARE USERS JA187 Computer Simulation Helps Improve Vertical Column Induced Gas Flotation (IGF) System Computer simulation has helped NATCO engineers make dramatic improvements
JOURNAL ARTICLES BY FLUENT SOFTWARE USERS JA187 Computer Simulation Helps Improve Vertical Column Induced Gas Flotation (IGF) System Computer simulation has helped NATCO engineers make dramatic improvements
RESIDENTIAL AND COMMERCIAL REGULATORS FOR ABNORMAL OPERATING CONDITIONS (AOC) WITH 3 FOOT CLEARANCE INSTALLATION REQUIREMENTS.
 WITH 3 FOOT CLEARANCE INSTALLATION REQUIREMENTS.") RESIDENTIAL AND COMMERCIAL REGULATORS FOR ABNORMAL OPERATING CONDITIONS (AOC) WITH 3 FOOT CLEARANCE INSTALLATION REQUIREMENTS Presented by Jon Beam Equipment Controls Company 3 FOOT ABNORMAL OPERATING
RESIDENTIAL AND COMMERCIAL REGULATORS FOR ABNORMAL OPERATING CONDITIONS (AOC) WITH 3 FOOT CLEARANCE INSTALLATION REQUIREMENTS Presented by Jon Beam Equipment Controls Company 3 FOOT ABNORMAL OPERATING
S.A. Klein and G.F. Nellis Cambridge University Press, 2011
 16-1 A flow nozzle is to be used to determine the mass flow rate of air through a 1.5 inch internal diameter pipe. The air in the line upstream of the meters is at 70 F and 95 psig. The barometric pressure
A Computational Assessment of Gas Jets in a Bubbly Co-Flow 1
 A Computational Assessment of Gas Jets in a Bubbly Co-Flow 1 Melissa Fronzeo*, 1 Michael Kinzel 1 The Pennsylvania State University, University Park, PA, USA Abstract In this effort, Computational Fluid
Service Regulator Requirements
 Page 1 of 6 Companies Affected: NIPSCO CGV CMD CKY COH CMA CPA REFERENCE Code of Federal Regulations - Title 49 - Part 192.353, 192.355, 192.357, VA SCC NOPV-2012-00451 1. GENERAL The purpose of this standard
Injector Dynamics Assumptions and their Impact on Predicting Cavitation and Performance
 Injector Dynamics Assumptions and their Impact on Predicting Cavitation and Performance Frank Husmeier, Cummins Fuel Systems Presented by Laz Foley, ANSYS Outline Overview Computational Domain and Boundary
AC : MEASUREMENT OF HYDROGEN IN HELIUM FLOW
 AC 2010-2145: MEASUREMENT OF HYDROGEN IN HELIUM FLOW Randy Buchanan, University of Southern Mississippi Christopher Winstead, University of Southern Mississippi Anton Netchaev, University of Southern Mississippi
OPTIMIZATION OF INERT GAS FLOW INSIDE LASER POWDER BED FUSION CHAMBER WITH COMPUTATIONAL FLUID DYNAMICS. Abstract. Introduction
 Solid Freeform Fabrication 2018: Proceedings of the 29th Annual International Solid Freeform Fabrication Symposium An Additive Manufacturing Conference OPTIMIZATION OF INERT GAS FLOW INSIDE LASER POWDER
NUMERICAL INVESTIGATION OF THE FLOW BEHAVIOUR IN A MODERN TRAFFIC TUNNEL IN CASE OF FIRE INCIDENT
 - 277 - NUMERICAL INVESTIGATION OF THE FLOW BEHAVIOUR IN A MODERN TRAFFIC TUNNEL IN CASE OF FIRE INCIDENT Iseler J., Heiser W. EAS GmbH, Karlsruhe, Germany ABSTRACT A numerical study of the flow behaviour
FLOW CONSIDERATIONS IN INDUSTRIAL SILENCER DESIGN
 FLOW CONSIDERATIONS IN INDUSTRIAL SILENCER DESIGN George Feng, Kinetics Noise Control, Inc., 3570 Nashua Drive, Mississauga, Ontario Vadim Akishin, Kinetics Noise Control, Inc., 3570 Nashua Drive, Mississauga,
Workshop 1: Bubbly Flow in a Rectangular Bubble Column. Multiphase Flow Modeling In ANSYS CFX Release ANSYS, Inc. WS1-1 Release 14.
 Workshop 1: Bubbly Flow in a Rectangular Bubble Column 14. 5 Release Multiphase Flow Modeling In ANSYS CFX 2013 ANSYS, Inc. WS1-1 Release 14.5 Introduction This workshop models the dispersion of air bubbles
SIMULATIONS OF HYDROGEN RELEASES FROM A STORAGE TANKS: DISPERSION AND CONSEQUENCES OF IGNITION
 SIMULATIONS OF HYDROGEN RELEASES FROM A STORAGE TANKS: DISPERSION AND CONSEQUENCES OF IGNITION Angers, B. 1, Hourri, A. 1, Bénard, P. 1, Tessier, P. 2 and Perrin, J. 3 1 Hydrogen Research Institute, Université
Instruction Manual. Pipe Friction Training Panel
 Instruction Manual HL 102 Pipe Friction Training Panel 100 90 80 70 60 50 40 30 20 10 HL 102 Instruction Manual This manual must be kept by the unit. Before operating the unit: - Read this manual. - All
LOW PRESSURE EFFUSION OF GASES revised by Igor Bolotin 03/05/12
 LOW PRESSURE EFFUSION OF GASES revised by Igor Bolotin 03/05/ This experiment will introduce you to the kinetic properties of low-pressure gases. You will make observations on the rates with which selected
Sizing of extraction ventilation system and air leakage calculations for SR99 tunnel fire scenarios
 Sizing of extraction ventilation system and air leakage calculations for SR99 tunnel fire scenarios Yunlong (Jason) Liu, PhD, PE HNTB Corporation Sean Cassady, FPE HNTB Corporation Abstract Extraction
Modulating Valves for Atmospheric, Infrared, and Direct Fired Burners
 BULLETIN MT2035-07/05 Modulating Valves for Atmospheric, Infrared, and Direct Fired Burners M/MR Series M411, M511, M611 M420, M520, M620, MR410, MR510, MR610 MR212D, MR212E, MR212G and MR212J (Flanged),
Ermenek Dam and HEPP: Spillway Test & 3D Numeric-Hydraulic Analysis of Jet Collision
 Ermenek Dam and HEPP: Spillway Test & 3D Numeric-Hydraulic Analysis of Jet Collision J.Linortner & R.Faber Pöyry Energy GmbH, Turkey-Austria E.Üzücek & T.Dinçergök General Directorate of State Hydraulic
Comparison of Large-Scale Vented Deflagration Tests to CFD Simulations for Partially Congested Enclosures
 Comparison of Large-Scale Vented Deflagration Tests to CFD Simulations for Partially Congested Enclosures Peter A. Diakow, Project II Consultant, Baker Engineering and Risk Consultants, Inc. J. Kelly Thomas,
6. EXPERIMENTAL METHOD. A primary result of the current research effort is the design of an experimental
 6. EXPERIMENTAL METHOD 6.1 Introduction A primary result of the current research effort is the design of an experimental setup that can simulate the interaction of a windmill with a vortex wake and record
Free Surface Flow Simulation with ACUSIM in the Water Industry
 Free Surface Flow Simulation with ACUSIM in the Water Industry Tuan Ta Research Scientist, Innovation, Thames Water Kempton Water Treatment Works, Innovation, Feltham Hill Road, Hanworth, TW13 6XH, UK.
International Journal of Technical Research and Applications e-issn: , Volume 4, Issue 3 (May-June, 2016), PP.
, PP.") DESIGN AND ANALYSIS OF FEED CHECK VALVE AS CONTROL VALVE USING CFD SOFTWARE R.Nikhil M.Tech Student Industrial & Production Engineering National Institute of Engineering Mysuru, Karnataka, India -570008
DESIGN AND ANALYSIS OF FEED CHECK VALVE AS CONTROL VALVE USING CFD SOFTWARE R.Nikhil M.Tech Student Industrial & Production Engineering National Institute of Engineering Mysuru, Karnataka, India -570008
Experimental determination of deflagration explosion characteristics of methane air mixture and their verification by advanced numerical simulation
 Structures Under Shock and Impact XII 169 Experimental determination of deflagration explosion characteristics of methane air mixture and their verification by advanced numerical simulation M. Mynarz,
RGC-IR Remote Gas Calibrator for IR400
 Remote Gas Calibrator for IR400 The information and technical data disclosed in this document may be used and disseminated only for the purposes and to the extent specifically authorized in writing by
Cover Page for Lab Report Group Portion. Pump Performance
 Cover Page for Lab Report Group Portion Pump Performance Prepared by Professor J. M. Cimbala, Penn State University Latest revision: 02 March 2012 Name 1: Name 2: Name 3: [Name 4: ] Date: Section number:
Digiquartz Water-Balanced Pressure Sensors for AUV, ROV, and other Moving Underwater Applications
 Digiquartz Water-Balanced Pressure Sensors for AUV, ROV, and other Moving Underwater Applications Dr. Theo Schaad Principal Scientist Paroscientific, Inc. 2002 Paroscientific, Inc. Page 1 of 6 Digiquartz
DEVELOPMENT OF HIGH ALTITUDE TEST FACILITY FOR COLD JET SIMULATION
 DEVELOPMENT OF HIGH ALTITUDE TEST FACILITY FOR COLD JET SIMULATION Aldin Justin 1, Robin James, Shruti Panicker 2,A.N.Subash,Saravana Kumar 1 Assistant Professor,Karunya University, aldinjustin@karunya.edu
Experimental Characterization and Modeling of Helium Dispersion in a ¼-Scale Two-Car Residential Garage
 Experimental Characterization and Modeling of Helium Dispersion in a ¼-Scale Two-Car Residential Garage William M. Pitts, Jiann C. Yang, Kuldeep Prasad, and Marco Fernandez National Institute of Standards
GAS SUPPLY APPLICATION GUIDE
 GAS SUPPLY APPLICATION GUIDE Natural Gas or Propane Modulating & Condensing Boilers and Water Heaters This document applies to the following models: Boilers AM 399B AM 500B AM 750B AM 1000B Gas-Fired Boilers
CFD Modelling of LPG dispersion
 CHAM Limited Pioneering CFD Software for Education & Industry CFD Modelling of LPG dispersion Demonstration example The following describes the numerical analysis of the dispersion of gas release from
ZIN Technologies PHi Engineering Support. PHi-RPT CFD Analysis of Large Bubble Mixing. June 26, 2006
 ZIN Technologies PHi Engineering Support PHi-RPT-0002 CFD Analysis of Large Bubble Mixing Proprietary ZIN Technologies, Inc. For nearly five decades, ZIN Technologies has provided integrated products and
INTERACTION BETWEEN WIND-DRIVEN AND BUOYANCY-DRIVEN NATURAL VENTILATION Bo Wang, Foster and Partners, London, UK
 INTERACTION BETWEEN WIND-DRIVEN AND BUOYANCY-DRIVEN NATURAL VENTILATION Bo Wang, Foster and Partners, London, UK ABSTRACT Ventilation stacks are becoming increasingly common in the design of naturally
Design of a Solid Wall Transonic Wind Tunnel
 Design of a Solid Wall Transonic Wind Tunnel David Wall * Auburn University, Auburn, Alabama, 36849 A solid wall transonic wind tunnel was designed with optical access from three sides to allow for flow
LOW PRESSURE EFFUSION OF GASES adapted by Luke Hanley and Mike Trenary
 ADH 1/7/014 LOW PRESSURE EFFUSION OF GASES adapted by Luke Hanley and Mike Trenary This experiment will introduce you to the kinetic properties of low-pressure gases. You will make observations on the
Full scale measurements and simulations of the wind speed in the close proximity of the building skin
 Full scale measurements and simulations of the wind speed in the close proximity of the building skin Radoslav Ponechal 1,* and Peter Juras 1 1 University of Zilina, Faculty of Civil Engineering, Department
Fire and Safety for Offshore drilling and production Ajey Walavalkar ANSYS Inc.
 Fire and Safety for Offshore drilling and production Ajey Walavalkar ANSYS Inc. 1 ANSYS, Inc. September 12, Fire and safety related applications Gas Dispersion and Ventilation Formation of combustible
Instruction Manual No. 742, 8/98
 Instruction Manual No. 742, 8/98 Eclipse Ratio Regulators ES Series COPYRIGHT Copyright I997 by Eclipse Combustion, Inc. All rights reserved worldwide. This publication is protected by federal regulation
A COMPARATIVE STUDY OF MIX FLOW PUMP IMPELLER CFD ANALYSIS AND EXPERIMENTAL DATA OF SUBMERSIBLE PUMP
 IMPACT: International Journal of Research in Engineering & Technology (IMPACT: IJRET) ISSN 2321-8843 Vol. 1, Issue 3, Aug 2013, 57-64 Impact Journals A COMPARATIVE STUDY OF MIX FLOW PUMP IMPELLER CFD ANALYSIS
Cover Page for Lab Report Group Portion. Head Losses in Pipes
 Cover Page for Lab Report Group Portion Head Losses in Pipes Prepared by Professor J. M. Cimbala, Penn State University Latest revision: 02 February 2012 Name 1: Name 2: Name 3: [Name 4: ] Date: Section
Statesville, NC. Results of AM ASHRAE 110 Laboratory Fume Hood Performance Evaluations Venturi Hood
 Statesville, NC Results of AM ASHRAE 11 Laboratory Fume Hood Performance Evaluations Venturi Hood January, 217 Prepared By: Exposure Control Technologies Inc. 231-C East Johnson Street Cary, NC 27513 Phone:
Lab # 03: Visualization of Shock Waves by using Schlieren Technique
 AerE545 Lab # 03: Visualization of Shock Waves by using Schlieren Technique Objectives: 1. To get hands-on experiences about Schlieren technique for flow visualization. 2. To learn how to do the optics
CONTROL VALVE TESTING
 The optimal functioning of the Control valve not only exists of sufficient body & seat tightness, but more important, the total "performance" of the valve and its controls! For an accurate and reliable
GILMONT ACCUCAL FLOWMETERS
 OPERATING MANUAL GILMONT ACCUCAL FLOWMETERS 28W092 Commercial Ave. Barrington, IL U.S.A. 60010-2392 (847) 381-4888 (847) 381-7053 (Fax) 800-962-7142 www.barnant.com e-mail: barnant@barnant.com A-1299-0766
Well Control Modeling Software Comparisons with Single Bubble Techniques in a Vertical Well
 Well Control Modeling Software Comparisons with Single Bubble Techniques in a Vertical Well Jace R. Larrison, P.E. Blowout Engineers, LLC Recent advances in well control modeling simulators have incorporated
Sprinkler Protection for Cloud Ceilings. SUPDET 2013 Jason Floyd, Ph.D. 28 February 2013
 Sprinkler Protection for Cloud Ceilings SUPDET 2013 Jason Floyd, Ph.D. 28 February 2013 Background Cloud ceilings are a popular architectural feature Lack of clear guidance in the code for sprinkler installation
CFD and Physical Modeling of DSI/ACI Distribution
 CFD and Physical Modeling of DSI/ACI Distribution APC Round Table & Exposition July 09, 2013 Matt Gentry mgentry@airflowsciences.com 734-525-0300 1 Outline Introduction Flow Analysis Techniques Application
The HumiPyc - Model 1 - Gas Pycnometer; Density, Moisture, Permeation Analyzer; RH sensor Calibrator
 The HumiPyc - Model 1 - Gas Pycnometer; Density, Moisture, Permeation Analyzer; RH sensor Calibrator Designed, built, and supported by InstruQuest Inc. Temperature controlled, multi-technique volumetric
Computational fluid dynamics analysis of a mixed flow pump impeller
 MultiCraft International Journal of Engineering, Science and Technology Vol. 2, No. 6, 2010, pp. 200-206 INTERNATIONAL JOURNAL OF ENGINEERING, SCIENCE AND TECHNOLOGY www.ijest-ng.com 2010 MultiCraft Limited.
Advanced Test Equipment Rentals ATEC (2832)
") Established 1981 Advanced Test Equipment Rentals www.atecorp.com 800-404-ATEC (2832) DOCUMENT NO: STP 2203 VERSION: 2008-07-01 Page 1 of 6 1.0 PURPOSE This test procedure is used by the Electrical Safety
Established 1981 Advanced Test Equipment Rentals www.atecorp.com 800-404-ATEC (2832) DOCUMENT NO: STP 2203 VERSION: 2008-07-01 Page 1 of 6 1.0 PURPOSE This test procedure is used by the Electrical Safety
Flow in a shock tube
 Flow in a shock tube April 30, 05 Summary In the lab the shock Mach number as well as the Mach number downstream the moving shock are determined for different pressure ratios between the high and low pressure
Biography. Abstract. Keywords. Body box, garments, validation, calibration, clean garments, IEST-RP-CC003.3, garment. Introduction and Scope
 NEW METHOD CALIBRATION FOR CALIBRATION OF A BODY BOX [Paper presented at IEST s ESTECH 2003 Conference, Phoenix, AZ, May 18-21] Rajan Jaisinghani, Technovation Systems, Inc. Biography Rajan (Raj) Jaisinghani
MODELING AND SIMULATION OF VALVE COEFFICIENTS AND CAVITATION CHARACTERISTICS IN A BALL VALVE
 Proceedings of the 37 th International & 4 th National Conference on Fluid Mechanics and Fluid Power FMFP2010 December 16-18, 2010, IIT Madras, Chennai, India FMFP2010 341 MODELING AND SIMULATION OF VALVE
Exhibit 4. Determination of Static Pressure Performance of the Healy Clean Air Separator (Executive Orders VR-201-N and VR-202-N)
") 1 APPLICABILITY Exhibit 4 Determination of Static Pressure Performance of the Healy Clean Air Separator (Executive Orders VR-201-N and VR-202-N) Definitions common to all certification and test procedures
1 APPLICABILITY Exhibit 4 Determination of Static Pressure Performance of the Healy Clean Air Separator (Executive Orders VR-201-N and VR-202-N) Definitions common to all certification and test procedures
Determination of the wind pressure distribution on the facade of the triangularly shaped high-rise building structure
 Determination of the wind pressure distribution on the facade of the triangularly shaped high-rise building structure Norbert Jendzelovsky 1,*, Roland Antal 1 and Lenka Konecna 1 1 STU in Bratislava, Faculty
Mass Spec will not Autotune
 Mass Spec will not Autotune Applies to 5973A/N MSD What could be the problem? There could be several things that would cause your Mass Spec not to Autotune. The most common, easily corrected Autotune problems
Simulations of hydrogen releases from high pressure storage systems
 Simulations of hydrogen releases from high pressure storage systems Benjamin Angers a, Pierre Bénard a, Ahmed Hourri a, Pascal Tessier b and Jérôme Perrin c a Institut de recherche sur l hydrogène, Université
CTG Certification Protocol -- Version 3.0 SUMMARY
 Date of Test: Test Report Number: SUMMARY Date of Prior Certification: Certified by: Re-certification Due Date: Unit Description: Make : Model: Serial Number: Location: CERTIFIER INFORMATION Name: Client
GAS SUPPLY DESIGN GUIDE
 GAS SUPPLY DESIGN GUIDE Natural Gas, Propane Gas, or Dual Fuel Fired Modulating, Condensing Boilers BENCHMARK Series Gas-Fired Boilers For models: BMK750 to BMK6000 Last Update: 06/20/2014 PR1 06/20/14
Fire safety of staircases in multi-storey buildings The results of measurements in Buildings and Simulations
 Fire safety of staircases in multi-storey buildings The results of measurements in Buildings and Simulations Grzegorz Kubicki, Ph.D. Department of Environmental Engineering, Warsaw University of Technology
TECHNICAL DATA. Low-Flow Foam Preaction System with Hydraulically Actuated Concentrate Control Valve.
 Foam 302 a 1. DESCRIPTION (Refer to Figure 1 on page 302 e.) The Viking Low-Flow Foam/Water Proportioning System is a UL Listed and FM Approved system, for use with 3M and Viking brand foam concentrate.
EFFECTS OF WATER SPRAYS AND SCRUBBER EXHAUST ON FACE METHANE CONCENTRATIONS
 Chapter 65 EFFECTS OF WATER SPRAYS AND SCRUBBER EXHAUST ON FACE METHANE CONCENTRATIONS Ch.D. Taylor NIOSH/Pittsburgh Research Laboratory Pittsburgh, PA J.A. Zimmer NIOSH/Pittsburgh Research Laboratory
Surrounding buildings and wind pressure distribution on a high rise building
 Surrounding buildings and wind pressure distribution on a high rise building Conference or Workshop Item Accepted Version Luo, Z. (2008) Surrounding buildings and wind pressure distribution on a high rise
The Ins and Outs of I/P Transducers
 The Ins and Outs of I/P Transducers By Mark B. Levine, ControlAir Inc. General description I/P transducers are versatile instruments that use an electrical control signal to proportionally regulate gas
Measurement and simulation of the flow field around a triangular lattice meteorological mast
 Measurement and simulation of the flow field around a triangular lattice meteorological mast Matthew Stickland 1, Thomas Scanlon 1, Sylvie Fabre 1, Andrew Oldroyd 2 and Detlef Kindler 3 1. Department of
WP2 Fire test for toxicity of fire effluents
 Pagina 3 di 89 TRA SFEU VTT 22.6.2009 v.2 WP2 Fire test for toxicity of fire effluents Task 2.1.2 Development of small-scale test method for fire effluents Step 1: Use of modeling Plans according to DoW:
Appendix D: SOP of INNOVA 1412 Photoacoustic Multi-Gas Monitor. Description and Principle of Operation
 Page 1 of 19 : SOP of INNOVA 1412 Photoacoustic Multi-Gas Monitor Description and Principle of Operation The photoacoustic multi-gas monitor (INNOVA 1412, Innova AirTech Instruments, Denmark) is a highly
CSC-2000 SERIES. Reset Volume Controllers MADE IN U.S.A. DESCRIPTION MODELS SPECIFICATIONS ORDERING
 CSC-2000 SERIES Reset Volume Controllers MADE IN U.S.A. DESCRIPTION The CSC-2000 series are designed for use on VAV terminal units in HVAC systems. These are submaster air velocity controllers whose velocity
MITIGATING PIPE AND RISER HYDRAULIC PIPELINE ISSUES WITH THE I-RISER PLUS
 24 TH July 2013 MITIGATING PIPE AND RISER HYDRAULIC PIPELINE ISSUES WITH THE I-RISER PLUS Vern Costelow Business Development Consultant AWMA Water Control Solutions INTRODUCTION Surface irrigation is still
Best Practices in Measuring Tank Level
 Whitepaper Best Practices in Measuring Tank Level What to Know About Measuring Tank Level OVERVIEW Whether you are looking for a solution to solve a water supply issue to a building or trying to monitor
Experimental Study of Hydrogen Release Accidents in a Vehicle Garage
 Experimental Study of Hydrogen Release Accidents in a Vehicle Garage Erik Merilo Mark Groethe James Colton Seiki Chiba Poulter Laboratory SRI International 3rd International Conference on Hydrogen Safety
Industrial Compressed Air. Ultrasonic Leak Detection Survey Guide
 Industrial Compressed Air Guide Introduction For many manufacturers compressed air represents the second or third highest utility cost in their facility. Without an effective maintenance program in place
SIMULATION OF ENVIRONMENTAL FLIGHT CONDITIONS
 SIMULATION OF ENVIRONMENTAL FLIGHT CONDITIONS BY ADVANCED ALTITUDE SIMULATION Klaus SCHÄFER Institute of Space Propulsion, German Aerospace Centre (DLR) Lampoldshausen, 74239 Hardthausen, Germany klaus.schaefer@dlr.de
Windcube FCR measurements
 Windcube FCR measurements Principles, performance and recommendations for use of the Flow Complexity Recognition (FCR) algorithm for the Windcube ground-based Lidar Summary: As with any remote sensor,
Inert Air (N2) Systems Manual
 Systems Manual") INSTRUCTION MANUAL Inert Air (N2) Systems Manual N2-MANUAL 2.10 READ AND UNDERSTAND THIS MANUAL PRIOR TO OPERATING OR SERVICING THIS PRODUCT. GENERAL INFORMATION Positive pressure nitrogen gas pressurizing
INSTRUCTION MANUAL Inert Air (N2) Systems Manual N2-MANUAL 2.10 READ AND UNDERSTAND THIS MANUAL PRIOR TO OPERATING OR SERVICING THIS PRODUCT. GENERAL INFORMATION Positive pressure nitrogen gas pressurizing
Numerical Modelling of Unchannelled Balcony Spill Plumes using FDS 5
 Numerical Modelling of Unchannelled Balcony Spill Plumes using FDS 5 By Ho Yong Tiong Supervised by Dr Michael Spearpoint Associate Professor Charles Fleischmann Fire Engineering Research February 2012
CFD AND EXPERIMENTAL STUDY OF AERODYNAMIC DEGRADATION OF ICED AIRFOILS
 Colloquium FLUID DYNAMICS 2008 Institute of Thermomechanics AS CR, v.v.i., Prague, October 22-24, 2008 p.1 CFD AND EXPERIMENTAL STUDY OF AERODYNAMIC DEGRADATION OF ICED AIRFOILS Vladimír Horák 1, Dalibor
Air Eliminators and Combination Air Eliminators Strainers
 Description Air Eliminators and Combination Air Eliminator Strainers are designed to provide separation, elimination and prevention of air in piping systems for a variety of installations and conditions.
RK-IR Sample Draw Aspirator Adapter Operator s Manual
 30-0951RK-IR Sample Draw Aspirator Adapter Operator s Manual Part Number: 71-0018RK Revision: A Released: 6/2/10 www.rkiinstruments.com Product Warranty RKI Instruments, Inc. warrants gas alarm equipment
Deborah Houssin-Agbomson, Jean-Yves Letellier, Philippe Renault, Simon Jallais
 AN EXPERIMENTAL STUDY DEDICATED TO WIND INFLUENCE ON HELIUM BUILD-UP AND CONCENTRATION DISTRIBUTION INSIDE A 1-M 3 SEMI-CONFINED ENCLOSURE CONSIDERING HYDROGEN ENERGY APPLICATIONS CONDITIONS OF USE. Deborah
New Technologies applied to the design and optimization of tunnel ventilation systems
 New Technologies applied to the design and optimization of tunnel ventilation systems Ing. Justo Suárez Area Manager - ZITRON Dot. Ing. Massimiliano Bringiotti Managing Director - GEOTUNNEL Ing. Ana Belén
CFD Simulation and Experimental Validation of a Diaphragm Pressure Wave Generator
 CFD Simulation and Experimental Validation of a Diaphragm Pressure Wave Generator T. Huang 1, A. Caughley 2, R. Young 2 and V. Chamritski 1 1 HTS-110 Ltd Lower Hutt, New Zealand 2 Industrial Research Ltd
CSC-2000 SERIES. Reset Volume Controllers MADE IN U.S.A. DESCRIPTION MODELS SPECIFICATIONS ORDERING
 CSC-2000 SERIES Reset Volume Controllers MADE IN U.S.A. DESCRIPTION The CSC-2000 series are designed for use on VAV terminal units in HVAC systems. These are submaster air velocity controllers whose velocity
Table of contents. I Drawings 33. A1 Design criteria 1 A1.1 Local thermal discomfort indices... 1
 Table of contents A1 Design criteria 1 A1.1 Local thermal discomfort indices........................... 1 A2 Experiment set-up 3 A2.1 Equipment....................................... 3 A2.2 Test cases.......................................
485 Annubar Primary Flow Element Installation Effects
 ROSEMOUNT 485 ANNUBAR 485 Annubar Primary Flow Element Installation Effects CONTENTS Mounting hole diameter Alignment error Piping Geometry Induced Flow Disturbances Pipe reducers and expansions Control
Standard Operating Procedure #COE-SOP-0001 Chemical Fume Hood Operation
 Standard Operating Procedure # Chemical Fume Hood Operation Facility: NMSU College of Engineering Laboratories Written by: Juanita Miller, Safety Specialist, miljgh@nmsu.edu (575)-646-1292 Scope: This
1 Exam Prep NFPA 99 Health Care Facilities Questions and Answers (Plumbing Contractor)
") 1 Exam Prep NFPA 99 Health Care Facilities Questions and Answers (Plumbing Contractor) 1. According to NFPA 99, SCFM is an acronym for. a) Surface Conditions at Fahrenheit Mercury b) Standard Conditions
1 Exam Prep NFPA 99 Health Care Facilities Questions and Answers (Plumbing Contractor) 1. According to NFPA 99, SCFM is an acronym for. a) Surface Conditions at Fahrenheit Mercury b) Standard Conditions