Coastal Morphology Report Essex (part sub-cell 8 Harwich to Canvey Island)
|
|
|
- Christian Douglas Taylor
- 5 years ago
- Views:
Transcription

")
1 Coastal Morphology Report Essex (part sub-cell 8 Harwich to Canvey Island) RP044/E/2015 March 2015
2 We are the Environment Agency. We protect and improve the environment and make it a better place for people and wildlife. We operate at the place where environmental change has its greatest impact on people s lives. We reduce the risks to people and properties from flooding; make sure there is enough water for people and wildlife; protect and improve air, land and water quality and apply the environmental standards within which industry can operate. Acting to reduce climate change and helping people and wildlife adapt to its consequences are at the heart of all that we do. We cannot do this alone. We work closely with a wide range of partners including government, business, local authorities, other agencies, civil society groups and the communities we serve. Published by: Geomatics vironment Agency Kingfisher House Goldhay Way Orton Goldhay Peterborough PE2 5ZR enquiries@environment-agency.gov.uk Further copies of this report are available from our publications catalogue: or our National Customer Contact Centre: T: enquiries@environment-agency.gov.uk. Environment Agency 2014 All rights reserved. This document may be reproduced with prior permission of the Environment Agency.
 part Sub-cell 8: Harwich to Canvey Island March")
3 Anglian Coastal Monitoring Programme Coastal Trends Analysis East Cliffs, The Naze, Essex Essex East Anglia Coastal Group (EACG) part Sub-cell 8: Harwich to Canvey Island March 2015
4 Contents List of abbreviations Glossary Executive Summary i ii iii 1.0 INTRODUCTION PURPOSE AND APPLICATION BACKGROUND BEACH TOPOGRAPHIC PROFILE DATA ANALYSIS METHODOLOGY FUTURE OUTPUTS PROFILE MAPS ESSEX (SUB-CELL 8) COASTAL TRENDS INTRODUCTION GENERAL DESCRIPTION HARWICH TO CANVEY ISLAND OUTLINE OBSERVATIONS Harwich to Hamford Water The Naze (Stone Point) to Lee-over-Sands (Colne Point) Mersea Island Dengie Flat (Bradwell Peninsular to Ray Sand) Maplin Sands (Foulness Point to Havengore Head) Southend-on-Sea (Haven Point to Leigh-on-Sea) GRAPHICAL VIEW OF RESULTS APPENDICES APPENDIX 1 DETAILED RESULTS APPENDIX 2 ESSEX PROFILES, NEW NAMES/OLD NAMES APPENDIX 3 REFERENCES 86
5 List of Abbreviations ACMP Anglian Coastal Monitoring Programme EA Environment Agency FCP Foreshore Change Parameter MHWS Mean High Water Spring MHWN Mean High Water Neap MLWN Mean Low Water Neap MLWS Mean Low Water Spring MSL Mean Sea Level SMP Shoreline Management Plan SMG Shoreline Monitoring Group i
6 Glossary Accretion Bathymetry Chainage Chart Datum Erosion Foreshore Accumulation of sediment on a beach by the action of natural forces or human intervention Topographic relief of the seabed Distance along a topographic survey transect line (measured in metres) Level to which all soundings on a marine navigational chart are based Loss of material from a beach by the action of natural forces or the result of man-made artificial structures interfering with coastal processes Intertidal region between the highest and lowest tide level Foreshore rotation Foreshore steepening or flattening resulting in the convergence or divergence of high and low water marks Longshore drift Movement of sediment along the shoreline Ordnance Datum Recharge MHWS MHWN MLWN MLWS Mean sea level (derived from 6 years of observation at Newlyn, Cornwall) used as a datum for calculating the absolute height of land on official British maps. Practise of adding to the natural amount of sediment on a beach with material from elsewhere. This is also known as beach replenishment or beach nourishment. Level of Mean High Water Spring tides Level of Mean High Water Neap tides Level of Mean Low Water Neap tides Level of Mean Low Water Spring tides Ordnance Datum ii
7 Executive Summary This report is an update of the report produced in There are some differences in the format and this report highlights where the presence of sea defences at Mean High Water Springs (MHWS) and Mean High Water Neaps (MHWN) determine that there is no trend. On 6 th December 2013 the largest storm surge in 60 years hit the East coast. As a result of this surge there was considerable damage to beaches and coastal defences in Norfolk and Suffolk. There was a high water level in Essex but there was nothing of the same significance as in its neighbouring counties to the north. There has been significant erosion for all tide levels at Walton-on-the-Naze. At Mean Sea Level (MSL) and Mean Low Water (MLW) at Mersea Island. At Dengie Flat, Ray Sand, Maplin Sands to Shoeburyness there has been significant accretion at MSL and MLW. There has been moderate accretion at MLW along the Southend-on-Sea frontage. There has been extensive works on the Clacton frontage, which commenced after the latest data used in this report. The scheme is made up of 23 fishtail rock groynes and approximately 950,000 cubic metres of sand and shingle beach recharge. The works will be undertaken in two phases; the first phase of works is from Holland Haven to Cliff Road, Holland on Sea and the second phase will be from Cliff Road to Clacton Pier. The works are proposed to be completed by late autumn See photos below. Barge anchored close inshore and being unloaded on to the beach. Photo courtesy of Mike Badger Tendring District Council. iii
8 Material being placed and graded as required. Photo courtesy of Mike Badger Tendring District Council. iv
9 1.0 Introduction 1.1 Purpose and application The aim of this report is to present data collected along the Essex coast from Harwich to Canvey Island to provide an evidence-based assessment of beach changes. It is produced to assist coastal managers in a variety of their functions including: strategic planning, capital engineering works and maintenance programmes. In addition it will assist with general education and raising awareness of coastal issues. 1.2 Background The Anglian coastline stretches from Grimsby, near the mouth of the River Humber, to Canvey Island on the northern side of the outer Thames estuary. A total length of approximately 470km the coast is a diverse mixture of dune fronted flood plains, shingle barrier beaches, saltmarsh and soft cliffs. There are no major geological hard rock coastal areas and therefore significant proportions of the coast are vulnerable to marine flooding and coastal erosion, which is likely to be compounded by any climatic change and/or sea level rise in the future. Considerable investment has been made in both hard and soft engineering solutions over the last century in order to reduce the impacts of flooding and erosion upon the built and natural coastal environment. This has resulted in significant proportions of the coast being artificially protected to prevent loss of environment, amenities and infrastructure located in vulnerable areas. The Environment Agency (EA) has carried out a programme of annual strategic monitoring of the Anglian coast since 1991, namely Anglian Coastal Monitoring Programme (ACMP). The rationale behind the programme is to assist the implementation of appropriate and sustainable works on the coast, whether undertaken by the EA for the purpose of flood risk management or by various maritime district council partners for coastal protection. An additional output from the monitoring programme is the assessment of coastal dynamics to inform long term strategies for the coastline. The platform for this is the Shoreline Management Plan (SMP) process, which sets out coastal strategies for future epochs, based on evidence from monitoring programmes. Map 1 (below) shows the SMP boundaries for the Anglian coast. The Anglian Coastal Monitoring programme collects a variety of data including; Annual aerial photographs LIDAR surveys Bi-annual topographic beach surveys (winter and summer) at 1km intervals ATV surveys on recharge beaches Bathymetric surveys (nearshore) Continuous wave and tide recording In addition, in-depth monitoring addresses specific sea defence scheme requirements at a variety of locations along the coast. At the time of writing, the Anglian monitoring programme is in Phase VIII ( ). Various reports, based upon data collected over the years, have been produced from time to time but until recently there has been an insufficiently long time series of data to identify any significant trends in coastal change. However, the Agency now possesses over twenty years of beach topographic data and it is therefore possible to analyse these data to determine indicators of longer-term trends. Data collected in the future can be readily added to this analysis to further ascertain the validity of the trends. Further copies of this report can be obtained by ing ACM@environment-agency.gov.uk. 1

10 Map 1 - SMP Boundaries 2
11 1.3 Beach topographic profile data The Environment Agency has collected beach topographic profile data at 1km intervals along the coast since Profile lines (transects) are surveyed twice yearly in the summer and in the winter to establish the cross-section of the beach. They are surveyed from behind the sea defence to Mean Low Water Springs (where possible). Generally the area of interest is the average rate of beach erosion or accretion along the coast. In addition to this, gradual change to the gradient or steepness of the beach is of particular interest to coastal managers as this can determine the resistance to wave energy. The analysis of trends in beach morphological behaviour may have significant impacts upon coastal management decisions in the future. Artificially defended beaches that are experiencing erosion and steepening trends may prove to be increasingly difficult and expensive to maintain. Even with maintenance, the structures may fail because of inadequate structural support or ground movements from diminishing quantities of beach material and subsequent beach platform loss. However, it is not the intention of this report to ascertain such issues at a local scale. Reports of this nature are appropriate for the ongoing revisions of the Shoreline Management Plans (SMPs) and Coastal Strategic Studies, which are currently being compiled along the Anglian coast. The length of the Anglian coast means that there are over 400 strategic topographic profiles for which data have been collected over the years. For the purposes of regional strategic coastal management, the entire UK coast has been divided up into sediment cells and sub-cells (HR Wallingford, 1994 & Defra, 2006). These are individual discrete sections of the coast that are considered to be independent from each other in terms of coastal processes. The relevant sections for the Anglian coast are:- Humber Estuary Coastal Authorities Group (HECAG): Flamborough Head to Gibraltar Point Sub-cell 3 East Anglia Coastal Group (EACG): Gibraltar Point to Old Hunstanton Sub-cell 4 Old Hunstanton to Kelling Sub-cell 5 Kelling to Lowestoft Ness Sub-cell 6 Lowestoft Ness to Felixstowe Sub-cell 7 Harwich to Canvey Island Sub-cell 8 These boundaries are convenient divisions for the separation and publication of the results of the trends analysis reports. Sub-cell 8, Harwich to Canvey Island is the subject of this report. 1.4 Analysis methodology The profile data presented in this report are in the form of beach level analysis. The data was analysed using a function of SANDS software (1). Tidal levels and conversions from Chart Datum to Ordnance Datum were kindly supplied by Proudman Oceanographic Laboratory from their POLTIPS software (2). Figure 1 (below) demonstrates the principle of beach profile change over time along with changes to beach gradient. Along certain stretches of coast where seawalls or other structures constrain the landward movement of the coast, beach volumetric change may be of interest. This is particularly relevant where artificial beach nourishment is undertaken. In other areas, where long frontages are unconstrained by linear defences, the quantification of beach volumetric change is of less importance. 3
12 Figure 1 Conceptual diagram of a beach profile showing shoreline advance/retreat and foreshore change parameter Figure 2 (below) demonstrates how the analysis was performed and a trend is obtained. The example used in Figure 2 is from an eroding beach, which is retreating with an average trend of m/yr. However, in any single year the actual erosion observed varies considerably. For example between 1996 and 2000 very little erosion occurred, whereas between 2000 and 2001 the beach retreated by almost 20m. Therefore the analyses indicated in this report relate to longer term general trends and cannot be used to determine short-term erosion or accretion rates. Figure 2 Suite of coastal profiles after SANDS beach level analysis with linear regression of MSL giving annual trend (data gaps are due to certain profiles not extending down to MLW level) 4
13 An important factor in coastal risk management policy decision making is foreshore steepening. A wide flat beach can dissipate incoming wave energy much better than a narrow steep beach. Using historical Ordnance Survey data, Taylor et al (2004) concluded that 61% of the coastline of England and Wales had steepened since the first OS County Series Survey published between 1843 and Of the remainder 33% had flattened and 6% experienced no rotational movement. Earlier work by Halcrow (1988) used the method to assess the Anglian coast to assist in the development of a management strategy for the Environment Agency s coastal flood defence predecessor, Anglian Water. This study concluded that 78% of the Anglian coast had experienced steepening between the mid 1800 s to the 1970 s. This is a higher percentage than the national average and confirms this coastline to be very dynamic along a large proportion of its length. The analysis in this report uses a similar methodology to that of Taylor et al (2004) and although the length of time covered in this report is an order of magnitude less than their data-set, the data utilised here is likely to be of much greater accuracy. The positional accuracy quoted in Taylor et al for OS maps are +/-5m for pre-1945 County Series Maps and +/-3.5m for post-1945 National Grid mapping. Whereas the accuracy of the Anglian Coastal Monitoring profiles is +/-0.05m vertical and +/-0.02m horizontal. Changes in the gradient of the beach between MHW and MLW are expressed in the form of the Foreshore Change Classification system (Halcrow, 1988) shown in Table 1 (below). Positive Foreshore Change Parameter (FCP) values indicate a beach system advancing seaward and negative values show a system retreating landward. The individual FCP numbers indicate flattening, steepening or no rotation. As no pair of MHW and MLW trend lines was likely to possess exactly the same gradient, every profile could be described as either flattening or steepening. To eliminate insignificant rotational changes, any change of less than 1.0% of the mean width of the foreshore was considered to be no change. In addition to this, judgement was used where some apparent rotational changes were deemed to be unreliable due to high degrees of foreshore variability. 5
14 Table 1 Foreshore change classification system (adapted from Halcrow, 1988). The change is indicated in red. 1.5 Future outputs Future updates of this report will include updated information on beach trends using the latest available profile data. In addition to this, the report may include extended analysis utilising other data sets collected by Geomatics (now responsible for leading on the ACM). 1.6 Profile Maps The following Maps show the position of the 80 profile lines for Essex, which are analysed in this report. However, the profile names have changed since the last analysis report was compiled in 2008 and the new naming convention was introduced in 2013 for simplification (see Appendix 4.2). 6

15 7

16 8
17 2.0 Essex (sub-cell 8) coastal trends 2.1 Introduction The Essex study area for this report extends from Harwich on the southern bank of the Stour Estuary to Southend-on-Sea, on the northern bank of the River Thames. Canvey Island has not been included in this analysis as profiles here have been regarded as estuary (Thames) and not coastal. Essex has an unusual coastline formed by a series of interlinked estuaries (Roach, Crouch, Blackwater, Colne and Hamford Water) giving rise to relatively discrete units of open coast in between the Tendring, Dengie and Foulness peninsulars. Much of the coastline is low lying and protected by earth/clay flood embankments with sea facing revetment works or sea walls together with groynes. The highly developed Tendring peninsular is characterised by long-term shore recession with groyned sand and shingle beaches backed by sea walls. At Jaywick, a number of shore defence works have taken place between West Clacton and Cocketwick to try to keep longshore drift to a minimum, reduce beach scour and subsequent erosion in front of the existing 1930s sea wall. The original scheme at Jaywick ( ) consisted of four rock armoured fishtail breakwaters plus beach recharge and was only the second scheme of its kind to be implemented in the UK. Following construction, however, continued beach loss between the breakwaters confirmed that the fishtails had been spaced too far apart. This led to the instigation of the second Jaywick scheme in 1999 which introduced a further fishtail groyne, offshore breakwater and continued beach recharge. Works continued up to 2008/2009 to add an additional breakwater adjacent to Brooklands which had been omitted from the second scheme. In 2008/2009 approx 250,000 tonnes of sand renourishment was provided to Bay 3. The adjacent frontage at Seawick, west of Cocketwick breakwater, has seen new sea defences established in 1998 consisting of a series of shore normal rock groynes together with a shore parallel rock groyne to replace an old groyne system. Further west of here the beach continues to erode to the sea wall. Works to improve the 2.3km frontage to the Tendring and Holland sea wall were completed in 2001/2002. These sea defences protect properties and land in Holland-on-Sea and Frinton-on- Sea. Significant erosion rates along the cliffs at the Naze led to several proposals for protection works to reduce cliff erosion by stabilising the beach fronting the cliffs. A rock hard point has been constructed at the southern end of the Naze and the beach material imported at the northern end to offset the effects of foreshore erosion. The cliffs at the Naze represent the only example of cliffs of any significant height in the county. They are a designated Geological SSSI and archaeologically significant due to their nationally important Pleistocene exposures which contain some of the first evidence of human occupation in this country. In additional to Tendring, Southend-on-Sea and Harwich represent the other developed areas along the Essex coastline and are characterised by sand/shingle beaches with groynes, backed by sea walls. Recharging of the beach to the east of Southend Pier as far as Thorpe Esplanade in 2002 has created a new beach at Southend-on-Sea. 9
18 The remainder of the coastal frontage is largely rural and supports agricultural land, some nationally and internationally important wildlife habitats and conservation sites. On Dengie and Foulness the shoreline is largely artificial in nature due to a succession of sea wall enclosures and extensive reclamation of saltmarshes during the period 1650 to These low wave energy environments form rare examples of open coast marsh. The protected land here is lower than the saltmarsh on the seaward side of the embankments. Large extents of saltmarsh and mudflat play important roles in coastal defence and is the first line of defence to the land, reducing the pressures on the embankments the formal flood defence. Thames lighter barges, now redundant, were introduced along sections of the Essex coast from the mid 1980s and sunk in the nearshore zone to reduce wave energy and help maintain the saltmarshes. These are located at two sections along the Dengie peninsular and also at Horsey Island in Hamford Water. The saltmarshes are amongst the most extensive in the country with the mudflats and drainage ditches at Maplin Sands forming the largest continuous intertidal area in Britain extending several kilometres offshore down to MLWS. Much of the saltmarsh areas are designated SSSIs. Maplin Sands regularly supports around 130,000 waterfowl, ranking this site (along with the Thames estuary) fourth largest in the country. Major centres of tourism, leisure and recreation along the Essex coastline are located at Southendon-Sea, Tendring (particularly Clacton-on-Sea and Walton-on-the-Naze) and at Canvey Island. Harwich is a predominantly industrial and has the second largest passenger port in the country. Fishing is a major industry the most productive cockle beds in the UK are located at Maplin Sands. Oyster beds and winkle fisheries are also of significant importance. West Mersea supports the largest concentration of trawlers operating from the Essex coast. This study deals with the coastline only and does not analyse any data that has been collected further inland or along the estuaries. The Environment Agency has collected beach profile data, on a bi-annual basis,for 80 transects along the Essex coastline at 1km intervals since
19 2.2 General description Harwich to Canvey Island Figure 3 (overleaf), shows the general results of the analysis, which are summarised in Table 2 and Table 3 below. Percentages are worked out from the total of 80 beach profiles along this section of coast. In addition, Figure 4 and Figure 5 show the trends analyses split into two sections, between Harwich to Mersea Island and Dengie Flat to Southend-on-Sea respectively. This is to show with greater clarity the smaller variation in trends between Harwich and Mersea. Appendix 4.2 shows the Transect IDs and Old Profile names as well as the Monitoring Cell locations of the profiles. NB. Some profiles did not have sufficient MLWN data to determine a reliable FCP score. Movement No of Profiles Percentage (%) Accretion None Erosion Totals Table 2 profiles showing movement Beach gradient No of Profiles Percentage (%) Flattening No rotation Steepening Totals Table 3 profiles showing rotation 11
20 Walton-on-the-Naze Frinton-on-Sea Jaywick/Seawick Mersea Island Dengie Flat Maplin Sands Haven Point Southend-on-Sea 12
21 Harwich Walton-on-the-Naze Frinton-on-Sea Clacton-on-Sea Jaywick Seawick Mersea Island Figure 4 Coastal trends 1991 to 2014 Harwich to Mersea Island. Note main areas of erosion at Walton-on-the-Naze and Mersea Island. NB Vertical scale differs between Figures. 3, 4 and 5. 13
22 14 Dengie Flat Ray Sand Maplin Sands Haven Point Shoebury Ness Southend-on-Sea Figure 5 Coastal trends 1991 to 2014 Dengie Flat to Leigh-on-Sea. Note significant accretion at MSL and MLW along much of this section of coast. NB Vertical scale differs between Figures 3, 4 and 5.
23 2.3 Outline observations The majority of the Essex coastline is artificially held by defences. Along the developed sections of coast at Harwich, Walton-on-the-Naze to Jaywick and at Southend-on-Sea beaches are backed by concrete sea walls with groynes. Clay or earth embankments back the expanses of mudflat and saltmarshes at Dengie Flat and Maplin Sands. As a result of these man-made constructions, beaches may have been unable to behave naturally (to a significant degree) and, where applicable, roll back in response to natural processes. A little over half (56%) of the 80 profiles along this stretch of coastline have shown a general accretion trend over the last 22 years. Significant trends of accretion were apparent along the broad expanses of mudflats at Dengie Flat, Maplin Sands and Shoeburyness where the foreshore can extend several kilometres seaward of MHWS. Over a quarter (28%) of profiles showed some erosional trend of the foreshore. Significant erosion was observed at the Naze and on the east of Mersea Island. The majority of profiles (60%) show a flattening trend of the foreshore and around a fifth (20%) show a foreshore steepening trend. The remaining 20% of profiles have shown no change in the general trend and no change in rotation of the foreshore gradient. The following section offers a description of the results of the analysis as well as graphically showing the trends overlaid over a suite of aerial photographs that were taken during summer The descriptions are divided into six sections which broadly relate to the divisions concluded by Halcrow (1988). Mean annual longshore wave energy values for the entire study area were kn/s except for the section of coast from Stone Point on the Naze to Holland-on-Sea where values increased to kn/s (Halcrow, 1988). The following analysis is profile by profile. The first table show accretion/erosion rates at MHW, MSL and MLW levels (vary from Spring tides to Neap tides depending on data availability and existing sea defence). The second table shows movement of the Mean Low Water Neap (MLWN) line from an early survey (normally 1992), one from 2006 (used in the 2008 trends analysis) and the latest from Some of the profiles show very erratic behaviour at MLWN, which may have distorted the calculated trends. The profile cross-sections are screenshots from bespoke software and show an early survey (normally 1992), one from 2006 (used in the 2008 trends analysis) and the latest from Winter The text is a summary of the changes in the profile. NB. Old profile names in parentheses. 15
24 2.3.1 Harwich to Hamford Water E001 (E1D1A) Harwich, Marine Parade. Defence type: recurved stepped concrete sea wall and groyne. Accretion/ MHWS MSL MLWS Mean Profile is stable at MHWS. Minimal erosion trend at MSL due to groyne protection. MLWS has shown a small accretion trend. MLWN has remained more or less around 50m offshore until 2013 when an additional bar appears intermittently, giving a range of MLWN of 50 to nearly 100m offshore in Surveyed profile crosses groyne between 30m and 40m chainage. E002 (E1D2) Harwich, Lower Marine Parade. Defence type: concrete sea wall. MHWS MSL MLWS Mean Insignificant trends at all levels. No movement and no rotation. 16
 Middle Beach.")
25 E003 (E1D3) Smack. Defence type: recurved concrete sea wall. MHWS MSL MLWS Mean (sea defence) 6 (sea defence) No movement at MHWN and MSL due to hard sea defence. Beach erodes at MLWN and meets the sea defence in Erosion trend at MLWS indicating lowering of the beach. Profile shows steepening, mainly due to the hard sea defence. E004 (E1D4A) Middle Beach. Defence type: grassed clay embankment. MHWS MSL MLWS Mean Erosion trend at all levels. No rotation. There has been a rollback of the dune in the region of 32m since 1992 resulting in reduction of saltmarsh behind the dune. 17


26 E005 (E1D5) Long Bank. Defence type: embankment and rock groyne (shore parallel). MHWS MSL MLWS Mean Stable at MHW due to sea defence above MHWS and rock at MHWN. Erosion trend at MSL and at MLWS. Approximate 12m retreat at MSL from 1992 to 2006 but little movement since. Slightly steepening profile. E006 (E1D6) Irlam s Beach. Defence type: none. MHWS MSL MLWN Mean Erosion trends at MHWN and at MSL but accretion trend at MLWN giving a stable mean trend. Profile shows slight flattening. Profile shows an erosion trend up to 2000, then accretes until 2005 when it reverts to an erosion trend from then onwards. 18

27 2.3.2 The Naze (Stone Point) to Lee-over-Sands (Colne Point) E007 (E1C1) Stone Marsh. Defence type: none. MHWS MSL MLWN Mean Erosion trend at all levels. MLWN has moved shoreward by 60m since Profile showed slight steepening up to 2006 but has flattened slightly since to give no rotation. Large amount of erosion between 2001 and See aerial photos below

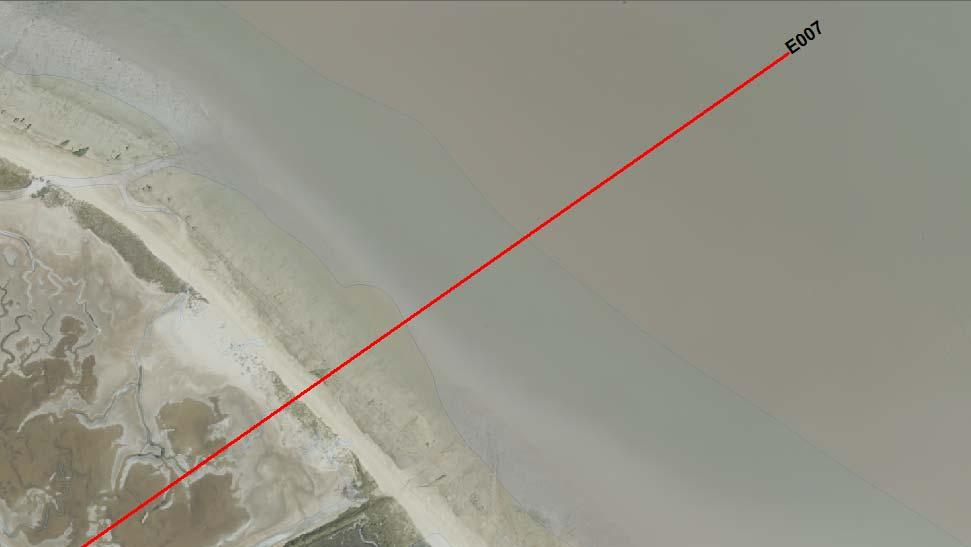
28

29 E008 (E1C2) Stone Creek. Defence type: clay embankment. MHWS MSL MLWN Mean Erosion trend at all levels. Slight flattening of profile. Overall retreat at MSL of around 80m since See aerial photos below


30
 The Naze. Defence type: none. MHWS MSL MLWS Mean -1.79-1.10-1.13-1.")
31 E009 (E1C3) The Naze. Defence type: clay sea wall with concrete slab revetment and asphalt crest path. MHWS MSL MLWS Mean Erosion trend at all levels but showed slight accretion in 2000/2001. Flattening profile. E010 (E1C4A) The Naze. Defence type: none. MHWS MSL MLWS Mean Erosion trend at all levels with greater erosion at MHWN but showed a blip of slight accretion in 2000/2001. Flattening profile. 23
32 E011 (E1C5A) East Cliffs. Defence type: none. MHWS MSL MLWS Mean Slightly lower erosion trends of cliff recession than the rest of the Naze and lower erosion trend at MLWN compared to MSL and MHWN. The base of the cliff has retreated by approx 35m in the period 1992 to Flattening profile. Cliff slumping at the Naze. 24

33 E012 (E1C6) Jubilee Beach. Defence type: concrete recurved sea wall. MHWN MSL MLWN Mean Erosion trends at all levels but minimal at MSL and MLWN. Higher at MHWN until beach eroded back to the concrete sea defence around Profile exhibits sediment loss in the winter and gain in the summer but general overall erosion trend. Profile frequently erodes back to sea defence at MHWS and MHWN. E013 (E1C7) Walton-on-the-Naze, Albion Breakwater. Defence type: concrete recurved sea wall. MHWN MSL MLWS Mean Stable at MHWN due to sea defence. Minimal accretion trend at MSL and minimal erosion trend at MLWS. Very slight steepening of profile. 25
34 E014 (E1B1) Walton-on-the-Naze, Burnt House Breakwater. Defence type: concrete recurved sea wall. MHWN MSL MLWN Mean Stable at MHWN due to hard sea defence. High variability of lower beach at MLWN and MSL with a slight general trend of erosion. No significant change in profile. E015 (E1B2) Frinton-on-Sea, Sandy Hook Breakwater. Defence type: concrete recurved sea wall, stepped revetment and groyne. MHWN MSL MLWN Mean Sea defence at MHWS. Relatively stable at MHWN but variable at MSL and MLWN. Accretion trend at MSL and MLWN. Slightly flattening profile. 26
35 E016 (E1B3) Frinton-on-Sea, The Greensward. Defence type: concrete recurved sea wall and groyne. MHWS MSL MLWS Mean Variable at MHWN. Very slight accretion trend at MSL. Larger accretion trend and MLWN. Slightly flattening profile. E017 (E1B4) Frinton Golf Club. Defence type: concrete recurved sea wall and stepped revetment and groyne. MHWN MSL MLWN Mean Profile stable at MHWN due to hard sea defence. Minimal erosion trend at MSL and MLWN. Very slight flattening of profile. 27
36 E018 (E1B5A) Holland Gap. Defence type: rock armour, stone revetment and concrete crest wall. MHWN MSL MLWN Mean Stable at MHWN and MSL due to hard sea defence with an accretion jump in 2002 due to rock armour placed at seawall after which levels remain stable. MLWN trends are variable but overall trend is erosion. Steepening of profile. E019 (E1B6) Chevaux de frise Point. Defence type: rock armour, slab revetment and concrete crest wall. MHWN MSL MLWN Mean Stable at MHWN and MSL due to hard sea defence. Rock armour has been placed along sea wall here (circa 1994) and shore normal rock groynes near the profile removed during the study period. Profile shows slight steepening trend at MLWN. Showing no overall movement but data points are highly variable. 28
 Holland-on-Sea. Defence type: concrete sea wall with stepped revetment, rock armour. MHWN MSL MLWN Mean 0.00 0.00-0.11-0.")
37 E020 (E1A1S) Holland-on-Sea. Defence type: piling. MHWN MSL MLWN Mean Profile located between groynes and backed by piling. Hard sea defence at MHWS. Insignificant trends at all levels. Slightly steepening profile. E021 (E1A1) Holland-on-Sea. Defence type: concrete sea wall with stepped revetment, rock armour. MHWN MSL MLWN Mean (sea defence) 14 (sea defence) Stable at MHWN and MSL due to hard sea defence. Rock armour added to sea wall circa 2001/2002 meaning insignificant trend at MLWN. 29
38 E022 (E1A2) Holland-on-Sea. Defence type: concrete stepped wall and groyne. MHWN MSL MLWN Mean Stable at MHWN due to hard sea defence. MSL and MLWN show a slight accretion trend from 1996 to around 2001 and then show a very slight erosional trend. Very slightly steepening profile. New sea defence built in From 2003 profile frequently erodes back to sea defence at MSL. E023 (E1A3) Clacton-on-Sea. Defence type: recurved sea wall, revetment and rock armour. MHWN MSL MLWN Mean (sea defence) 17 Rock armour placed along sea wall circa 1993/1994. Accretional trend in this period is due to rock armour placement and hence no movement after this period at MHWN and MSL. Highly variable at MLWN but this is due to presence of rock armour. Profile frequently erodes to rock armour at MLWN. 30
39 E024 (E1A4) Clacton-on-Sea. Defence type: recurved concrete sea wall, concrete revetment and toe piling. MHWN MSL MLWN Mean Groynes removed and toe piling put in between 1992 and Sea defence is present at MHWN, MSL and MLWN (from 1999) hence no Trends at these levels. Below MLWN profile is very variable. E025 (E1A5) South Clacton, Martello Tower. Defence type: concrete sea wall. MHWS MSL MLWN Mean Accretion trend at all levels. Most significant accretion is at MLWN. Slightly flattening profile. 31

40 E026 (E1A6) West Clacton to Jaywick, Burnham Court. Defence type: recurved concrete wall, concrete revetment and beach recharge. MHWS (1999) MSL MLWN Mean Trends for this profile have been calculated from 1999 when an additional fishtail breakwater, a shore parallel breakwater and arm extensions to an existing fishtail breakwater were constructed. These additions, along with beach recharge, took place as part of the West Clacton to Jaywick Sea Defences. This was in addition to the original scheme of 1986 to 1988 when four fishtail breakwaters were constructed together with beach recharge. Pre-1999 trends showed significant erosion trend. Post 1999 trends show a different pattern with slight erosion trend for 3 years, stabilising around 2003 and have remained relatively stable ever since. From around 2006 profile accretes in winter and erodes in summer. Profile shows flattening. E027 (E1A7) West Clacton to Jaywick, The Close. Defence type: recurved concrete sea wall, concrete revetment, fishtail groyne and beach recharge. MHWS (1999) MSL MLWN Mean (rock groyne) 184 (rock groyne) 32


41 Trends for this profile have been calculated from 1999 when an additional fishtail breakwater, a shore parallel breakwater and arm extensions to an existing fishtail breakwater were constructed. These additions, along with beach recharge, took place as part of the West Clacton to Jaywick Sea Defences. This was in addition to the original scheme of 1986 to 1988 when four fishtail breakwaters were constructed together with beach recharge. Pre-1999 trends showed significant erosion trend at all levels. Post 1999 trends show relative stability up to 2002, significant erosion in 2002/2003 then remaining stable ever since. Profile shows slight flattening. E028 (E1A8) West Clacton to Jaywick, Lion Point. Defence type: recurved sea wall, blockwork revetment, rock groynes (shore parallel) and beach recharge. MHWS (1999) MSL MLWN Mean Trends for this profile have been calculated from 1999 when an additional fishtail breakwater, a shore parallel breakwater and arm extensions to an existing fishtail breakwater were constructed. These additions, along with beach recharge, took place as part of the West Clacton to Jaywick Sea Defences. This was in addition to the original scheme of 1986 to 1988 when four fishtail breakwaters were constructed together with beach recharge. Pre-1999 trends showed significant erosion trend. Post 1999 trends show a similar story with significant erosion event in 1999/2000 followed by steady erosion until the end of 2008 when an additional shore-parallel rock groyne was constructed on the line of the profile. Since 2009 the profile has remained stable. Before Breakwater construction After Breakwater construction 33

 adjacent to this profile together with beach recharge.")
42 E029 (E1A9) Seawick, Hutley s Caravan Park. Defence type: recurved sea wall and concrete revetment. MHWS MSL MLWN Mean Prior to 1998 there was an erosion trend at all levels. In 1998 new defences were added at Seawick consisting of a series of shore normal rock groynes to replace the old groyne system, which has stabilised the beach to the east of this profile. In addition there was reinforcement of a shore parallel rock groyne (Hutley s platform) adjacent to this profile together with beach recharge. However, the beach has continued eroding since 1998 but shows slight flattening. Beach tends to erode in summer and accrete in winter. Before groyne construction After groyne construction 34


43 E030 (E1A10) Seawick, St Osyth Beach. Defence type: clay tidal sea wall and block revetment. MHWS MSL MLWN Mean Erosion trend at all levels but larger at MHWN and MSL. Significant erosion event in Smaller erosion trend at MLWN to give flattening profile. E031 (E1A11) Lee-over-Sands. Defence type: clay tidal sea wall and block revetment. MHWS MSL MLWS Mean Profile has remained stable with only seasonal variations. Profile appears to flatten in winter and steepen in summer. 35

44 E032 (E1A12) Colne Point. Defence type: none. MHWS MSL MLWN Mean Strong accretional trends at all levels particularly at MLWN to give flattening profile. Profile appears to go through periods of erosion followed by periods of accretion. Notably significant accretion and erosion in 1998, and large accretion in Mersea Island E033 (E2A1) Cudmore Grove Country Park. Defence type: clay embankment and block revetment. MHWS MSL MLWN Mean No movement at MHWS due to sea defence. Erosion trend at MSL may be misleading as profile erodes to sea defence at MSL on several occasions from 2001 onwards. Strong erosion trend at MLWN. Profile is steepening slightly. Immediately west of this profile are the remains of a polder site in front of the cliffs (see below) and immediately north, a spit which protrudes into the Colne 36 6


45 estuary. Between 1992 and 2013 the base of the spit has accreted north of the profile by c40m, erosion mid-way c25m and a width accretion at the end of the spit by c17m. Immediately adjacent to the northeast of the profile a headland has established between (see below) extending c120m and an extended width of c40m
 Fen Farm Caravan Park. Defence type: none MHWS MSL MLWN Mean -0.51-4.75-0.18-1.")

46 2013 Accretion immediately north of E033 (E2A1) and at distal end of spit with erosion midway along spit from E034 (E2A2) Fen Farm Caravan Park. Defence type: none MHWS MSL MLWN Mean Erosion trend at MHWS. Significant erosion trend at MSL and small erosion trend at MLWN. MLWN appears to be relatively stable compared to the upper beach may be due to a shallow sloping profile at MLWN which gives a very variable MLWN chainage. Steepening profile. 38
47 E035 (E2A3) Hall Farm Caravan Park. Defence type: concrete block wall and revetment. MHWS MSL MLWN Mean Little movement at MHWN. Steady erosion at MSL and severe at MLWN. Slightly steepening profile. Clay embankment with revetment has been extended alongshore in front of the caravan park since E036 (E2A4) Youth Camp. Defence type: clay embankment with and concrete revetment. MHWS MSL MLWN Mean No movement at MHWS due to sea defence. Little movement at MHWN. Moderate erosion trend at MSL. Accretion trend at MLWN may be misleading as the MLWN chainage is very variable, which may distort the data
48 E037 (E2A5) Waldegraves Farm. Defence type: clay embankment with revetment MHWS MSL MLWN Mean Accretion trend at MHWS. Significant erosion trends at MSL and MLWN. The gravel and sand bar which was at approximate chainage 550m in the early 1990s has since rolled back approximately 200m. E038 (E2A6) West Mersea, Sewage Works. Defence type: revetment MHWS MSL MLWN Mean No movement at MHWN. Moderate erosion trend at MSL. Minimal erosion trend at MLWN. 40


49 E039 (E2A7) West Mersea. Defence type: none MHWS MSL MLWS Mean Accretion trend at MHWS. Stable at MSL. Small erosion trend at MLWS. Slight steepening of profile. E040 (E2A8) West Mersea, King s Hard. Defence type: none MHWS MSL MLWN Mean Erosion trend at all levels. Small erosion trend at MHWS. Moderate erosion at MSL. Significant erosion at MLWN. Steepening of beach. Erosion jump in
50 2.3.4 Dengie Flat (Bradwell Peninsular to Ray Sand) E041 (E2A15) Sales Point. Defence type: clay seawall, block revetment and lighter barge. MHWS MSL MLWN Mean Lighter barges (see photo below) placed on profile in late 1980s at 240m chainage. There has been a steady build up of mud landward side of the lighter barges since their installation. No movement at MHWS due to sea defence. No movement at MHWN due to lighter barge. Slight erosion trend at MSL but is adjacent lighter barge. Slight accretion at MLWN. No rotatio Lighter barges with embankment in the foreground 42
51 E042 (E3E1) Othona Roman Fort. Defence type: grassed embankment. MHWS MSL MLWN Mean Strong erosion trend at MHWS and MHWN. Significant accretion trends at MSL and MLWN. There is saltmarsh and mudflats on seaward side of embankment and saltmarsh extent has receded by c75m since 1992 as the embankment has rolled back. Large erosion in winter 2009/2010 followed by large accretion in summer Flattening profile. E043 (E3E2) Dengie Flat, Gunners Creek. Defence type: clay sea wall, block revetment and timber wave break. MHWS MSL MLWN Mean Slight erosion trend at MHWS at edge of saltmarsh. Slight erosion at MHWN. Significant accretion trend at MSL and to a lesser extent at MLWN. The saltmarsh extent has receded by c45m since Slightly flattening profile. 43
52 E044 (E3E3) Dengie Flat, Glebe Outfall. Defence type: clay sea wall, block revetment and concrete wave break. MHWN MSL MLWN Mean Erosion trend at MHWS but relatively stable after Steady erosion trend at MHWN. Significant accretion trend at MSL and MLWN. Slight flattening of profile. E045 (E3E4) Dengie Flat, Sandbeach Outfall. Defence type: clay seawall, block revetment, lighter barge, and timber wave break. MHWS MSL MLWN Mean Lighter barge placed on profile in early to mid 1980s at approximately 600m chainage. Slight accretion trend of saltmarsh at MHWS mainly due to lighter barge at MHWN. No movement at MHWN due to lighter barge. Significant accretion trend at MSL but profile is very erratic. Moderate erosion trend at MLWN but profile is very erratic. Almost negligible steepening of profile. 44

53 E046 (E3E5) Dengie Flat, Marshhouse Outfall. Defence type: clay sea wall and block revetment. MHWN MSL MLWN Mean No movement at MHWS due to sea defence. Slight accretion trend at MHWN. Significant accretion at MSL but profile is very erratic. Significant accretion trend at MLWN. Very slightly flattening profile but varies considerably due to erratic nature of profile. E047 (E3E6) Dengie Flat, Howe Outfall. Defence type: clay sea wall, block revetment and concrete wave break. MHWN MSL MLWN Mean Saltmarsh at MHWS and has retreated by c75m since Moderate erosion trend at MHWN. Significant accretion trend a MSL. Very significant accretion trend at MLWN, however data only regularly available after Profile shows very slight flattening. 45
54 E048 (E3D1) Ray Sand, Grange Outfall. Defence type: earth embankment and concrete revetment. MHWN MSL MLWN Mean Erosion at MHWS, saltmarsh has retreated c50m since Erosion trend at MHWN. Significant accretion trends at MSL and MLWN but both are erratic. Flattening profile. E049 (E3D2) Ray Sand, Round Barn. Defence type: earth embankment and concrete revetment. MHWN MSL MLWN Mean Saltmarsh at MHWS. Moderate erosion trend at MHWN. Slight accretion trend at MSL. Significant accretion trend at MLWN, however, survey only reaches MLWN from 2003 onwards. 46
55 E050 (E3D3) Ray Sand, Bridgewick Outfall. Defence type: clay sea wall, block revetment and timber wave break. MHWN MSL MLWN Mean Not surveyed to MLWN Saltmarsh at MHWS. Moderate erosion trend at MHWN. Significant accretion trends at MSL and MLWN. Very slightly flattening profile. E051 (E3D4) Ray Sand, Coate Outfall. Defence type: clay sea wall, block revetment, timber wave break and old polder site. MHWN MSL MLWN Mean Saltmarsh at MHWS. Slight erosion trend at MHWN. Moderate accretion trend at MSL. Significant accretion trend at MLWN (very mobile at MLWN, which may distort the trend). Profile shows very slight flattening. 47

56 E052 (E3D5) Ray Sand, Shell Bank. Defence type: clay sea wall, block revetment and old polder site. MHWN MSL MLWN Mean Significant erosion trend at MHWN. Dramatic erosion trend at MLWN. However, profile is very erattic at MHWN and MLWN and therefore trends at these levels may be unreliable. There is a slight erosion trend at MSL. Profile shows slight flattening. E053 (E3D6) Ray Sand, Holliwell Point. Defence type: clay sea wall and block revetment. MHWN MSL MLWN Mean Sea defence and MHWS and MHWN gives no trend. Slight accretion trend at MSL. Significant accretion trend at MLWN with large jump in 2008/2009. Flattening profile. 48
57 2.3.5 Maplin Sands (Foulness Point to Havengore Head) E054 (E3C1) Foulness Point. Defence type: earth embankment and concrete revetment. MHWN MSL MLWN Mean Little movement at MHWS due to sea defence. Moderate erosion trend at MHWN. Moderate accretion trend at MSL. Slight accretion trend at MLWN but profile is very erratic. Flattening profile. E055 (E3C2) Foulness Point. Defence type: earth embankment and concrete revetment. MHWS MSL MLWN Mean Moderate erosion trend at MHWS this is mainly due to saltmarsh and secondary sea defence (embankment). Moderate accretion trend at MSL. Very significant accretion trend at MLWN. Profile shows slight flattening. 49
 Fisherman s Head. Defence type: earth embankment, concrete revetment and rock armour.")

58 E056 (E3C3) Fisherman s Head. Defence type: earth embankment, concrete revetment and rock armour. MHWN MSL MLWN Mean No movement at MHWS and MHWN due to saltmarsh. Little or no movement at MSL. Erosion trend at MLWN although very erratic. No rotation. E057 (E3C4) Fisherman s Head. Defence type: earth embankment, concrete revetment and rock armour. MHWN MSL MLWN Mean No movement at MHWS due to sea defence. Slight erosion trend at MHWN but mainly saltmarsh, which shows little overall movement so might be some unreliable data. Very significant accretion at MLWN but very erratic and the profiles were often not surveyed far enough to pick up the small bank at approx 3200m chainage, which may distort this trend. Profile shows very slight flattening. 50
 Rugwood Head.")
59 E058 (E3C5) Eastwick Head. Defence type: earth embankment, concrete revetment and rock armour. MHWN MSL MLWN Mean No movement at MHWS due to sea defence. No movement at MHWN due to rock. Significant accretion trend at MSL. Very significant accretion trend at MLWN. Profile shows very slight flattening. E059 (E3B1) Rugwood Head. Defence type: earth embankment, concrete revetment and rock armour. MHWN MSL MLWN Mean No movement at MHWS due to sea defence. No movement at MHWN. Significant accretion trend at MSL. Very significant accretion at MLWN, very erratic and some profiles stop short of outer bank. Flattening profile. 51
60 E060 (E3B2) Asplin s Head. Defence type: earth embankment and concrete revetment. MHWN MSL MLWN Mean Saltmarsh at MHWS. Moderate accretion trend at MHWN. Significant accretion trend at MSL. Very significant accretion at MLWN profile is erratic at this level and many profile surveys do not reach MLWN at the seaward side of the outer bank, which may distort the trend. Profile shows no rotation. E061 (E3B3) New Burwood Farm. Defence type: earth embankment and concrete block revetment. MHWN MSL MLWN Mean No movement at MHWS due to sea defence. Saltmarsh at MHWN showing accretion trend. Significant accretion at MSL. Very significant accretion trend at MLWN most profiles surveys don t go as far as the outer bank, which distorts the trend. Profile shows no rotation. 52
61 E062 (E3B4) Sharpsness Head. Defence type: grassed earth embankment and concrete revetment. MHWN MSL MLWN Mean No movement at MHWS due to sea defence. Moderate accretion trend at MHWN. Moderate to strong accretion at MSL. Significant accretion at MLWN. Flattening profile. E063 (E3B5) Havengore Head. Defence type: grassed earth embankment. MHWN MSL MLWN Mean Saltmarsh at MHWS. Slight erosion trend at MHWN. Significant accretion trend at MSL. Very significant accretion trend at MLWN erratic profile at this level and many profiles are not surveyed far enough to pick up further banks, which may distort the trend. Flattening profile. 53


62 2.3.6 Southend-on-Sea (Haven Point to Leigh-on-Sea) E064 (E3A1) Haven Point. Defence type: embankment, block revetment and rock armour. MHWN MSL MLWN Mean No movement at MHWS due to sea defence. No movement at MHWN due to rock armour. Significant accretion trend at MSL. Very significant accretion at MLWM erratic profile at this level, which may distort the trend. Slightly flattening profile. E065 (E3A2) Shoeburyness New Ranges. Defence type: embankment and concrete revetment. MHWN MSL MLWN Mean No movement at MHWS due to sea defence. No movement at MHWN due to sea defence. Significant accretion trend at MSL. Very significant accretion at MLWN erratic profile at this level and many early profile surveys never reached the outer bank at 4500m chainage, which may distort the trend. Flattening profile. 54
 Suttons. Defence type: concrete sea wall. MHWN MSL MLWN Mean -0.04 2.")
63 E066 (E3A3) Poynter s Point. Defence type: grassed earth embankment. MHWN MSL MLWN Mean Slight erosion at MHWS saltmarsh has retreated by approx. 10m since Slight erosion trend at MHWN. Strong accretion trend at MSL. Moderate accretion trend at MLWN. Flattening profile. E067 (E3A4) Suttons. Defence type: concrete sea wall. MHWN MSL MLWN Mean No movement at MHWS or MHWN due to sea defence. Moderate accretion trend at MSL. Significant accretion trend at MLWN many of the early profile surveys did not reach MLWN at the outer bank at approx. 3600m chainage. Slightly flattening profile. 55

64 E068 (E3A5) Shoeburyness. Defence type: embankment and gabions. MHWN MSL MLWN Mean Minimal movement at MHWS and MHWN. Significant accretion trend at MSL. Very significant accretion trend at MLWN profile is erratic at this level and some of the early profile surveys don t achieve MLWN seaward side of outer bank at approx. 3200m chainage, which may distort the trend. Very slight flattening profile. E069 (E3A6) Shoeburyness, The Hilly Marsh. Defence type: recurved concrete sea wall. MHWN MSL MLWN Mean No movement at MHWS or MHWN due to sea defence. Minimal movement at MSL due to close proximity of sea defence. Significant accretion trend at MLWN - profile is erratic at this level and some of the early profile surveys don t achieve MLWN seaward side of outer bank at approx. 2000m chainage, which may distort the trend. Very slight flattening profile. 56
65 E070 (E4A1) Shoebury Ness. Defence type: recurved concrete sea wall, revetment and timber groyne. MHWN MSL MLWN Mean Profile crosses shore normal groyne near sea defence. No movement at MHWS or MHWN due to sea defence and groyne. Very slight erosion trend at MSL due to close proximity of sea defence and shore normal groyne. Significant accretion trend at MLWN very erratic profile at this level. Slightly flattening profile. E071 (E4A2) Shoebury Common. Defence type: recurved concrete sea wall, block revetment and timber groyne. MHWN MSL MLWN Mean Stable profile. Profile is very flat out to around 2000m chainage. No movement at MHWS, MHWN, MSL and MLWN. No rotation. 57
 Eastern Esplanade, Warwick Road. Defence type: concrete sea wall. MHWN MSL MLWN Mean 1.42 1.39 4.")
66 E072 (E4A3) Thorpe Esplanade. Defence type: concrete sea wall. MHWS MSL MLWN Mean No movement at MHWS, MHWN and MSL. Strong accretion trend at MLWN erratic profile at this level. Slightly flattening profile. E073 (E4A4) Eastern Esplanade, Warwick Road. Defence type: concrete sea wall. MHWN MSL MLWN Mean Accretion trends at all levels. Moderate at MHWS, MHWN and MSL and more significant at MLWN. No rotation. Reasonably stable up to 2002, large amount of accretion during 2002 and then stable ever since. 58

67 E074 (E4A5) Eastern Esplanade, Victoria Road. Defence type: concrete sea wall. MHWS MSL MLWN Mean Accretion trend at all levels moderate at MHWS, slight at MSL and significant at MLWN. No rotation. Stable up to Feb 2002 and then massive accretion upto Sep 2002 and then stable ever since. E075 (E4B1) Southend-on-Sea Pier. Defence type: concrete block revetment. MHWS MSL MLWN Mean Very little movement at MHWS due to adjacent sea defence. Moderate accretion trend at MSL. Significant accretion trend at MLWN. Slightly flattening profile. 59


68 E076 (E4B2) Western Esplanade. Defence type: stone revetment. MHWS MSL MLWN Mean No movement at MHWS or MHWN due to sea defence. No movement at MSL. Moderate accretion trend at MLWN. Slightly flattening profile. E077 (E4B3) The Leas. Defence type: concrete and stone sea wall and groyne enclosure. MHWN MSL MLWN Mean No movement at MHWS, MHWN and MSL due to sea defence. Accretion trend at MLWN. Slightly flattening profile. 60

69 E078 (E4B4) Chalkwell Station. Defence type: pitching MHWN MSL MLWN Mean The Leigh Swatch (offshore channel) lies 580m offshore from sea wall. No movement at MHWS due to sea defence. Very little movement at MHWN due to proximity of sea defence. Moderate erosion trend at MSL profile crosses MSL several times and this may have distorted the trend. Accretion trend at MLWN - profile crosses MLWN several times and this may have distorted the trend. Profile appears to be relatively stable at all levels when looking at all the survey crosssections. No rotation of profile. E079 (E4B5) Leigh Cliffs. Defence type: pitching. MHWS MSL MLWN Mean No movement at MHWS or MHWN due to sea defence. Significant accretion trend at MSL and MLWN profile crosses MSL several times and this may have distorted the trend. Profile appears to be relatively stable at all levels when looking at all the survey cross-sections. Slightly flattening profile. 61

70 E080 (E4B6) Leigh-on-Sea Station. Defence type: earth embankment and concrete revetment. MHWN MSL MLWN Mean Little movement at MHWS and MHWN due to saltmarsh. Moderate accretion trend at MSL and MLWN. Profile appears to be relatively stable at all levels when looking at all the survey crosssections. No rotation of profile. 3.0 Graphical View of Results The following images show the results of the analysis as arrows along the profile (transect) lines. The white number at the landward end indicates the profile reference (transect id) and the black number at the seaward end indicates the mean rate/year of erosion (-ve) or accretion (+ve). 62
Coastal Morphology Technical Note Lincshore. TN002/L/2013 March Title here in 8pt Arial (change text colour to black) i
 i") Coastal Morphology Technical Note Lincshore TN002/L/2013 March 2013 Title here in 8pt Arial (change text colour to black) i We are the Environment Agency. We protect and improve the environment and make
Coastal Morphology Technical Note Lincshore TN002/L/2013 March 2013 Title here in 8pt Arial (change text colour to black) i We are the Environment Agency. We protect and improve the environment and make
NORTHERN CELL OPTIONS SHORTLIST RECOMMENDATIONS
 OPTIONS SHORTLIST RECOMMENDATIONS Coastal Unit C: Bayview Options recommended for MCDA scoring. Status quo. Planting 3. Renourishment (gravel) 6. Beach-scraping 7. Restore shingle crest. Inundation accommodation
Beach profile surveys and morphological change, Otago Harbour entrance to Karitane May 2014 to June 2015
 Beach profile surveys and morphological change, Otago Harbour entrance to Karitane May 2014 to June 2015 Prepared for Port Otago Ltd Martin Single September 2015 Shore Processes and Management Ltd Contact
Sea State Report. Essex (Year 1 Oct 2006 Sept 2007) RP014/E/2010 January Title here in 8pt Arial (change text colour to black) i
 RP014/E/2010 January Title here in 8pt Arial (change text colour to black) i") Sea State Report Essex (Year 1 Oct 2006 Sept 2007) RP014/E/2010 January 2010 Title here in 8pt Arial (change text colour to black) i We are the Environment Agency. We protect and improve the environment
Sea State Report Essex (Year 1 Oct 2006 Sept 2007) RP014/E/2010 January 2010 Title here in 8pt Arial (change text colour to black) i We are the Environment Agency. We protect and improve the environment
Coastal Change and Conflict
 Coastal Change and Conflict Outline of the Topic Contrasting Coasts why do all coasts not look the same? Geology of the coast the impact rock structure has on the coastline Waves Constructive and destructive
Coastal Morphology Report. Holme-next-the-Sea, North Norfolk RP009/N/2009
 Coastal Morphology Report Holme-next-the-Sea, North Norfolk RP009/N/2009 March 2009 We are the Environment Agency. We protect and improve the environment and make it a better place for people and wildlife.
SHOREHAM BEACH LOCAL NATURE RESERVE
 SHOREHAM BEACH LOCAL NATURE RESERVE Coastal Geography Education Programme 2014-15 S. Savage 2014 COASTAL GEOGRAPHY OPPORTUNITIES Shoreham Beach Shoreham Beach is a shingle spit formed over many centuries
INTRODUCTION TO COASTAL ENGINEERING
 The University of the West Indies Organization of American States PROFESSIONAL DEVELOPMENT PROGRAMME: COASTAL INFRASTRUCTURE DESIGN, CONSTRUCTION AND MAINTENANCE A COURSE IN COASTAL DEFENSE SYSTEMS I CHAPTER
Management Area 19 Management Area 20 Management Area 21 Management Area 22. Mount s Bay West (The Greeb to Point Spaniard)
") PDZ: 8 Mount s Bay West (The Greeb to Point Spaniard) (Including Marazion and St Michael s Mount) Management Area 19 Management Area 20 Management Area 21 Management Area 22 Mount s Bay West (The Greeb
PDZ: 8 Mount s Bay West (The Greeb to Point Spaniard) (Including Marazion and St Michael s Mount) Management Area 19 Management Area 20 Management Area 21 Management Area 22 Mount s Bay West (The Greeb
Australian Coastal Councils Conference
 Australian Coastal Councils Conference Kiama March 2019 Where Has My Beach Gone? (and what can I do about it?) Dr Andrew McCowan Water Technology Where Has My Beach Gone? Where Has My Beach Gone? Where
Shorelines Earth - Chapter 20 Stan Hatfield Southwestern Illinois College
 Shorelines Earth - Chapter 20 Stan Hatfield Southwestern Illinois College The Shoreline A Dynamic Interface The shoreline is a dynamic interface (common boundary) among air, land, and the ocean. The shoreline
DRAFT. Management Area 19 Management Area 20 Management Area 21 Management Area 22
 PDZ: 8 Mounts Bay West (The Greeb to Point Spaniard) (Including Marazion and St Michael s Mount) Management Area 19 Management Area 20 Management Area 21 Management Area 22 Mounts Bay West (The Greeb to
SANDBANKS COAST PROTECTION
 SANDBANKS COAST PROTECTION David Robson, Senior Engineer, Coastal & Drainage Team Borough of Poole Leisure Services (T) 01202 265265 (E) d.robson@poole.gov.uk May 2003 SANDBANKS COAST PROTECTION Introduction
Q1. What are the primary causes/contributors to coastal erosion at Westshore and the concept of longshore / littoral drift.
 Q1. What are the primary causes/contributors to coastal erosion at Westshore and the concept of longshore / littoral drift. In order of (timing related) contribution to present problem 1. Beach is too
SELECTION OF THE PREFERRED MANAGEMENT OPTION FOR STOCKTON BEACH APPLICATION OF 2D COASTAL PROCESSES MODELLING
 SELECTION OF THE PREFERRED MANAGEMENT OPTION FOR STOCKTON BEACH APPLICATION OF 2D COASTAL PROCESSES MODELLING C Allery 1 1 DHI Water and Environment, Sydney, NSW Abstract This paper presents an approach
Coastal Processes Day Criccieth
 Coastal Processes Rivers (Conwy) Rivers (Peris) Urban Studies Lowland Glaciation Tourism and National Parks Soils Sand Dunes Upland Glaciation Rural Settlements The Centre and Staff Fieldwork Equipment
CHAPTER 8 ASSESSMENT OF COASTAL VULNERABILITY INDEX
 124 CHAPTER 8 ASSESSMENT OF COASTAL VULNERABILITY INDEX 8.1 INTRODUCTION In order to assess the vulnerability of the shoreline considered under this study against the changing environmental conditions,
The Physical and Human Causes of Erosion. The Holderness Coast
 The Physical and Human Causes of Erosion The Holderness Coast By The British Geographer Situation The Holderness coast is located on the east coast of England and is part of the East Riding of Yorkshire;
Lecture Outlines PowerPoint. Chapter 15 Earth Science, 12e Tarbuck/Lutgens
 Lecture Outlines PowerPoint Chapter 15 Earth Science, 12e Tarbuck/Lutgens 2009 Pearson Prentice Hall This work is protected by United States copyright laws and is provided solely for the use of instructors
New Jersey Coastal Zone Overview. The New Jersey Beach Profile Network (NJBPN) 3 Dimensional Assessments. Quantifying Shoreline Migration
 3 Dimensional Assessments. Quantifying Shoreline Migration") New Jersey Coastal Zone Overview The New Jersey Beach Profile Network (NJBPN) Objectives Profile Locations Data Collection Analyzing NJBPN Data Examples 3 Dimensional Assessments Methodology Examples Quantifying
New Jersey Coastal Zone Overview The New Jersey Beach Profile Network (NJBPN) Objectives Profile Locations Data Collection Analyzing NJBPN Data Examples 3 Dimensional Assessments Methodology Examples Quantifying
Long Beach Island Holgate Spit Little Egg Inlet Historical Evolution Introduction Longshore Transport Map, Survey and Photo Historic Sequence
 Appendix B Long Beach Island Holgate Spit Little Egg Inlet Historical Evolution Introduction The undeveloped southern end of Long Beach Island (LBI) is referred to as the Holgate spit as it adjoins the
Chapter 10 Lecture Outline. The Restless Oceans
 Chapter 10 Lecture Outline The Restless Oceans Focus Question 10.1 How does the Coriolis effect influence ocean currents? The Ocean s Surface Circulation Ocean currents Masses of water that flow from one
Volume and Shoreline Changes along Pinellas County Beaches during Tropical Storm Debby
 Volume and Shoreline Changes along Pinellas County Beaches during Tropical Storm Debby Ping Wang and Tiffany M. Roberts Coastal Research Laboratory University of South Florida July 24, 2012 Introduction
Coastal Morphology Report
 Coastal Morphology Report Bawdsey (1991 2006) RP001/S/2007 January 2007 Title here in 8pt Arial (change text colour to black) i We are the Environment Agency. We protect and improve the environment and
Oceans and Coasts. Chapter 18
 Oceans and Coasts Chapter 18 Exploring the oceans The ocean floor Sediments thicken and the age of the seafloor increases from ridge to shore The continental shelf off the northeast United States Constituent
Llandudno Beach Management Plan and Options Appraisal
 Llandudno Beach Management Plan and Options Appraisal August, 2017 G.B. Edwards BEng (Hons) CEng FICE Head of, Mochdre Offices, Conway Road, Mochdre, Colwyn Bay, LL28 5AB. Tel. (01492) 574000 Fax. (01492)
Chiswell and Chesil Beach (to Wyke Narrows) 6a02 and 6a03 SUMMARY OF PREFERRED PLAN RECOMMENDATIONS AND JUSTIFICATION
 6a02 and 6a03 SUMMARY OF PREFERRED PLAN RECOMMENDATIONS AND JUSTIFICATION") Location reference: Policy Unit reference: Plan: Chiswell and Chesil Beach (to Wyke Narrows) 6a02 and 6a03 SUMMARY OF PREFERRED PLAN RECOMMENDATIONS AND JUSTIFICATION The long term aim for this section
Location reference: Policy Unit reference: Plan: Chiswell and Chesil Beach (to Wyke Narrows) 6a02 and 6a03 SUMMARY OF PREFERRED PLAN RECOMMENDATIONS AND JUSTIFICATION The long term aim for this section
UPPER BEACH REPLENISHMENT PROJECT RELATED
 ASSESSMENT OF SAND VOLUME LOSS at the TOWNSHIP of UPPER BEACH REPLENISHMENT PROJECT RELATED to the LANDFALL OF HURRICANE SANDY - PURSUANT TO NJ-DR 4086 This assessment is in response to Hurricane Sandy
The Dynamic Coast. Right Place Resources. A presentation about the interaction between the dynamic coast and people
 The Dynamic Coast Houses threatened by coastal erosion in California Right Place Resources A presentation about the interaction between the dynamic coast and people For the rest of the presentations in
Case study 64. Shoreham Harbour Shingle Bypassing and Recycling
 Case study 64. Shoreham Harbour Shingle Bypassing and Recycling Authors: Tony Parker, Uwe Dornbusch Main driver: Improved defences Project stage: Ongoing construction/operation since 1992 Photo 1: Shoreham
Earth Science Chapter 16 Section 3 Review
 Name: Class: Date: Earth Science Chapter 16 Section 3 Review Multiple Choice Identify the choice that best completes the statement or answers the question. 1. The movement of water that parallels the shore
SPECIAL SPRING 2018 STORM REPORT ON THE CONDITION OF THE MUNICIPAL BEACHES FOR THE BOROUGH OF STONE HARBOR, CAPE MAY COUNTY, NEW JERSEY
 SPECIAL SPRING 2018 STORM REPORT ON THE CONDITION OF THE MUNICIPAL BEACHES FOR THE BOROUGH OF STONE HARBOR, CAPE MAY COUNTY, NEW JERSEY Aerial photograph taken April 21, 2018 showing the view up the beach
IMPACTS OF COASTAL PROTECTION STRATEGIES ON THE COASTS OF CRETE: NUMERICAL EXPERIMENTS
 IMPACTS OF COASTAL PROTECTION STRATEGIES ON THE COASTS OF CRETE: NUMERICAL EXPERIMENTS Tsanis, I.K., Saied, U.M., Valavanis V. Department of Environmental Engineering, Technical University of Crete, Chania,
OECS Regional Engineering Workshop September 29 October 3, 2014
 B E A C H E S. M A R I N A S. D E S I G N. C O N S T R U C T I O N. OECS Regional Engineering Workshop September 29 October 3, 2014 Coastal Erosion and Sea Defense: Introduction to Coastal/Marine Structures
Impacts of breakwaters and training walls
 Across the eastern seaboard of Australia, breakwaters and training walls have instigated fundamental perturbations to coastal and estuary processes. This has induced long-term changes to foreshore alignments,
COASTAL SYSTEMS WAVE ENERGY
 WAVE ENERGY The energy of a wave determines its ability to erode and transport material on the coast Wave energy depends on the fetch, the distance the wind has blown the wave Wind strength and wind duration
Map 8: Ayrshire Coast: Ardrossan North Bay to Stevenston Pier Map Content Descriptions
 Map 8: Ayrshire Coast: Ardrossan North Bay to Stevenston Pier Map Content Descriptions 1. Built Heritage and Archaeology A total of twenty four sites were recorded in the area covered by Map 8. Of these
Label the diagram below with long fetch and short fetch:
 Coastal Processes Coasts are shaped by the sea and the action of waves. The processes that take place are erosion, transportation and deposition. The power of waves is one of the most significant forces
OECS Regional Engineering Workshop September 29 October 3, 2014
 B E A C H E S. M A R I N A S. D E S I G N. C O N S T R U C T I O N. OECS Regional Engineering Workshop September 29 October 3, 2014 Coastal Erosion and Sea Defense: Introduction to Coastal Dynamics David
Building Coastal Resiliency at Plymouth Long Beach
 Building Coastal Resiliency at Plymouth Long Beach Department of Marine and Environmental Affairs March 30, 2017 Introducing Green Infrastructure for Coastal Resiliency Plymouth Long Beach & Warren s Cove
Cross-shore sediment transports on a cut profile for large scale land reclamations
 Cross-shore sediment transports on a cut profile for large scale land reclamations Martijn Onderwater 1 Dano Roelvink Jan van de Graaff 3 Abstract When building a large scale land reclamation, the safest
April 7, Prepared for: The Caribbean Disaster Emergency Response Agency Prepared by: CEAC Solutions Co. Ltd.
 April 7, 2006 Prepared for: The Caribbean Disaster Emergency Response Agency Prepared by: Introduction CEAC Solutions Co. Ltd was commissioned in May 2005 to prepare coastal beach erosion hazard maps for
DUNE STABILIZATION AND BEACH EROSION
 DUNE STABILIZATION AND BEACH EROSION CAPE HATTERAS NATIONAL SEASHORE NORTH CAROLINA ROBERT DOLAN PAUL GODFREY U. S. DEPARTMENT OF INTERIOR NATIONAL PARK SERVICE OFFICE OF NATURAL SCIENCE WASHINGTON, D.
Chapter. The Dynamic Ocean
 Chapter The Dynamic Ocean An ocean current is the mass of ocean water that flows from one place to another. 16.1 The Composition of Seawater Surface Circulation Surface Currents Surface currents are movements
Montserrat. Wise practices for coping with. i b bea n Se a
 Wise practices for coping with Montserrat Car i b bea n Se a Fisheries Division, Montserrat Physical Planning Department, Montserrat University of Puerto Rico, Sea Grant College Program Caribbean Development
To: William Woods, Jenni Austin Job No: CentrePort Harbour Deepening Project - Comments on community queries
 Memo To: William Woods, Jenni Austin From: Richard Reinen-Hamill Date: Subject: cc: 1 Purpose This memo sets out our response to issues raised at and after Seatoun community consultation sessions held
Reading Material. Inshore oceanography, Anikouchine and Sternberg The World Ocean, Prentice-Hall
 Reading Material Inshore oceanography, Anikouchine and Sternberg The World Ocean, Prentice-Hall BEACH PROCESSES AND COASTAL ENVIRONMENTS COASTAL FEATURES Cross section Map view Terminology for Coastal
Shoreline Response to an Offshore Wave Screen, Blairgowrie Safe Boat Harbour, Victoria, Australia
 Shoreline Response to an Offshore Wave Screen, Blairgowrie Safe Boat Harbour, Victoria, Australia T.R. Atkins and R. Mocke Maritime Group, Sinclair Knight Merz, P.O. Box H615, Perth 6001, Australia ABSTRACT
COASTAL MANAGEMENT AND PROTECTION METHODS! 1
 COASTAL MANAGEMENT AND PROTECTION METHODS! 1 Strategy What it does Cons Pros Examples SOFT ENGINEERING: The use of ecological principles and practices to reduce erosion and achieve the stabilization and
Figure 4, Photo mosaic taken on February 14 about an hour before sunset near low tide.
 The Impact on Great South Bay of the Breach at Old Inlet Charles N. Flagg and Roger Flood School of Marine and Atmospheric Sciences, Stony Brook University Since the last report was issued on January 31
ATLANTIC COUNTY 2006 to 2008
 ATLANTIC COUNTY 2006 to 2008 The Atlantic County oceanfront shoreline consists of three barrier islands where the northern one, Little Beach Island and a third of the second, Brigantine Island, are undeveloped
SACO RIVER AND CAMP ELLIS BEACH SACO, MAINE SECTION 111 SHORE DAMAGE MITIGATION PROJECT APPENDIX F ECONOMIC ASSESSMENT
 SACO RIVER AND CAMP ELLIS BEACH SACO, MAINE SECTION 111 SHORE DAMAGE MITIGATION PROJECT APPENDIX F ECONOMIC ASSESSMENT Department of the Army New England District, Corps of Engineers 696 Virginia Road
Inlet Management Study for Pass-A-Grille and Bunces Pass, Pinellas County, Florida
 Inlet Management Study for Pass-A-Grille and Bunces Pass, Pinellas County, Florida Final Report Submitted By Ping Wang, Ph.D., Jun Cheng Ph.D., Zachary Westfall, and Mathieu Vallee Coastal Research Laboratory
ALTERNATIVES FOR COASTAL STORM DAMAGE MITIGATION
 ALTERNATIVES FOR COASTAL STORM DAMAGE MITIGATION Dave Basco Old Dominion University, Norfolk, Virginia, USA National Park Service Photo STRUCTURAL (changes to natural, physical system) hardening (seawalls,
Identify one factor which influences wave strength (1 Mark) Factors which affect wave strength
 Factors which affect wave strength") Coasts revision Identify one factor which influences wave strength (1 Mark) Factors which affect wave strength Identify one factor which influences wave strength (1 Mark) Factors which affect wave strength
Coasts revision Identify one factor which influences wave strength (1 Mark) Factors which affect wave strength Identify one factor which influences wave strength (1 Mark) Factors which affect wave strength
Sustainable Decision Making (SDM) (Foundation and Higher Tier)
 (Foundation and Higher Tier)") GENERAL CERTIFICATE OF SECONDARY EDUCATION GEOGRAPHY B Sustainable Decision Making (SDM) (Foundation and Higher Tier) B561/01/02/RB RESOURCE BOOKLET *B523590611* This resource booklet should be available
GENERAL CERTIFICATE OF SECONDARY EDUCATION GEOGRAPHY B Sustainable Decision Making (SDM) (Foundation and Higher Tier) B561/01/02/RB RESOURCE BOOKLET *B523590611* This resource booklet should be available
Overview. Beach Features. Coastal Regions. Other Beach Profile Features. CHAPTER 10 The Coast: Beaches and Shoreline Processes.
 Overview CHAPTER 10 The Coast: Beaches and Shoreline Processes Coastal regions constantly change. The beach is a dominant coastal feature. Wave activity continually modifies the beach and coastal areas.
Nearshore Sediment Transport What influences the loss of sediment on Beaches? - Waves - Winds - Tidal Currents - River discharge - Runoff
 Tides & Beaches Nearshore Sediment Transport What influences the loss of sediment on Beaches? - Waves - Winds - Tidal Currents - River discharge - Runoff Oceans Ocean Topography Physical Structure of the
EX Beach Control Structures, Poole Numerical modelling of scheme options, Sandbanks to Branksome Dene Chine
 EX 5763 Beach Control Structures, Poole Numerical modelling of scheme options, Sandbanks to Branksome Dene Chine Report EX 5763 Release 1.0 August 2008 Document Information Project Beach Control Structures,
Effectiveness of Beach Nourishment in Response to Sea Level Rise
 2014 FSBPA Annual Conference Effectiveness of Beach Nourishment in Response to Sea Level Rise Navarre Beach Santa Rosa County July 18, 2005 Lovers Key Lee County April 23, 2012 South County St. Lucie County
SEDIMENT BUDGET OF LIDO OF PELLESTRINA (VENICE) Written by Marcello Di Risio Under the supervision of Giorgio Bellotti and Leopoldo Franco
 Written by Marcello Di Risio Under the supervision of Giorgio Bellotti and Leopoldo Franco") SEDIMENT BUDGET OF LIDO OF PELLESTRINA (VENICE) Written by Marcello Di Risio Under the supervision of Giorgio Bellotti and Leopoldo Franco Table of contents: 1. Introduction...3 2. Protection structures
SEDIMENT BUDGET OF LIDO OF PELLESTRINA (VENICE) Written by Marcello Di Risio Under the supervision of Giorgio Bellotti and Leopoldo Franco Table of contents: 1. Introduction...3 2. Protection structures
LAB: WHERE S THE BEACH
 Name: LAB: WHERE S THE BEACH Introduction When you build a sandcastle on the beach, you don't expect it to last forever. You spread out your towel to sunbathe, but you know you can't stay in the same spot
Chesil Beach, Dorset UK High energy, shingle coastline. Brighton Beach, Sussex UK Pebble beach
 Beaches: Depositional landform Extends from the highest high tide to the lowest low tide. Very important temporary store in coastal system. Accretion: sediment returning to the visible portion of a beach
GONE! Coastal Erosion Happens During Storms! Why Worry About Coastal Setbacks? Goals for Today
 RI Regulatory Setbacks & Buffers: Coastal Zone Management Issues New England Onsite Wastewater Training Program @ URI OWT 155 November 21, 2013 Goals for Today Understand the impacts of storms, coastal
Julebæk Strand. Effect full beach nourishment
 Julebæk Strand Effect full beach nourishment Aim of Study This study is a part of the COADAPT funding and the aim of the study is to analyze the effect of beach nourishment. In order to investigate the
DUXBURY WAVE MODELING STUDY
 DUXBURY WAVE MODELING STUDY 2008 Status Report Duncan M. FitzGerald Peter S. Rosen Boston University Northeaster University Boston, MA 02215 Boston, MA 02115 Submitted to: DUXBURY BEACH RESERVATION November
Nearshore Morphodynamics. Bars and Nearshore Bathymetry. Sediment packages parallel to shore, that store beach sediment
 Nearshore Morphodynamics http://coastal.er.usgs.gov/bier/images/chandeleur-xbeach-lg.jpg Bars and Nearshore Bathymetry Sediment packages parallel to shore, that store beach sediment Can be up to 50 km
Sea State Report. Chapel Point wave buoy, RP037/L/2013 December Title here in 8pt Arial (change text colour to black) i
 i") Sea State Report Chapel Point wave buoy, 2012-2013 RP037/L/2013 December 2013 Title here in 8pt Arial (change text colour to black) i We are the Environment Agency. We protect and improve the environment
Sea State Report Chapel Point wave buoy, 2012-2013 RP037/L/2013 December 2013 Title here in 8pt Arial (change text colour to black) i We are the Environment Agency. We protect and improve the environment
ALTERNATIVES FOR COASTAL STORM DAMAGE MITIGATION AND FUNCTIONAL DESIGN OF COASTAL STRUCTURES
 The University of the West Indies Organization of American States PROFESSIONAL DEVELOPMENT PROGRAMME: COASTAL INFRASTRUCTURE DESIGN, CONSTRUCTION AND MAINTENANCE A COURSE IN COASTAL DEFENSE SYSTEMS I CHAPTER
RI Regulatory Setbacks & Buffers: Coastal Management Issues
 RI Regulatory Setbacks & Buffers: Coastal Management Issues New England Onsite Wastewater Training Program @ URI OWT 155 - November 29, 2012 James Boyd - Coastal Policy Analyst Photo: October 30, 2012
1.1 Coastal processes produce landforms
 1.1 Coastal processes produce landforms Types of wave: destructive and constructive Destructive Carry out erosion Tall Powerful High frequency Backwash greater than the swash Take sediment from beach to
Morphological Impact of. Coastal Structures
 Morphological Impact of Coastal Structures Student: Remco van der Hoeven Studentno.: 9347290 December, 2010 Hydraulic Engineering Group Hydraulic and Geotechnical Engineering Division Faculty of Civil
page - Laboratory Exercise #5 Shoreline Processes
 page - Laboratory Exercise #5 Shoreline Processes Section A Shoreline Processes: Overview of Waves The ocean s surface is influenced by three types of motion (waves, tides and surface currents). Shorelines
PDZ: 10 Clodgy Point to Godrevy Point Management Area 25 Management Area 26 Management Area 27 Management Area 28
 PDZ: 10 Clodgy Point to Godrevy Point Management Area 25 Management Area 26 Management Area 27 Management Area 28 Looking toward Hayle from Godrevy Towans Clodgy Point to Godrevy Point This area encompasses
Compiled by Uwe Dornbusch. Edited by Cherith Moses
 REPORT ON WAVE AND TIDE MEASUREMENTS Compiled by Uwe Dornbusch. Edited by Cherith Moses 1 Aims...1 2 Summary...1 3 Introduction...1 4 Site selection...1 5 Wave recorder settings...2 6 Results...2 6.1 Water
St Kitts. Wise practices for coping with
 Wise practices for coping with St Kitts Caribbean Sea Department of the Environment, St Kitts Fisheries Division, St Kitts Physical Planning and Development Division, St Kitts University of Puerto Rico,
PDZ: 10 Clodgy Point to Godrevy Point Management Area 25 Management Area 26 Management Area 27 Management Area 28 DRAFT
 PDZ: 10 Clodgy Point to Godrevy Point Management Area 25 Management Area 26 Management Area 27 Management Area 28 Clodgy Point to Godrevy Point This area encompasses St Ives Bay and is made up of both
# Post Consultation and Submissions Resource Consent Conditions for Surfing Impact Mitigation August 2016
 # Post Consultation and Submissions Resource Consent Conditions for Surfing Impact Mitigation August 2016 Surf Mitigation Management Plan 1 1 Not less than 6 months prior to the commencement of the construction
EXISTING AND PLANNED STRATEGIES AND ACTIONS CONNECTED WITH COASTAL PROTECTION IN ASPECT OF PREDICTED SEA LEVEL RISE
 EXISTING AND PLANNED STRATEGIES AND ACTIONS CONNECTED WITH COASTAL PROTECTION IN ASPECT OF PREDICTED SEA LEVEL RISE Andrzej Cieślak Long term coastal protection strategy In 2000 a new 1 Polish long term
Low-crested offshore breakwaters: a functional tool for beach management
 Environmental Problems in Coastal Regions VI 237 Low-crested offshore breakwaters: a functional tool for beach management K. Spyropoulos & E. Andrianis TRITON Consulting Engineers, Greece Abstract Beach
COASTAL ENVIRONMENTS. 454 lecture 12
 COASTAL ENVIRONMENTS Repeated movement of sediment & water constructs a beach profile reflecting the balance between average daily or seasonal wave forces and resistance of landmass to wave action Coasts
INFLUENCE OF DAMAGED GROINS ON NOURISHED SEASHORE
 INFLUENCE OF DAMAGED GROINS ON NOURISHED SEASHORE Ostrowski R 1., Pruszak Z. 1, Schönhofer J. 1, Szmytkiewicz M. 1, Szmytkiewicz P. 1 The system of timber palisade groins can be very helpful as a measure
Chapter 15 SEASONAL CHANGES IN BEACHES OP THE NORTH ATLANTIC COAST OF THE UNITED STATES
 Chapter 15 SEASONAL CHANGES IN BEACHES OP THE NORTH ATLANTIC COAST OF THE UNITED STATES By John M. Darling Hydraulic Engineer, Research Division U. S. Army Coastal Engineering Research Center Corps of
Chapter 12: Coasts (after a brief review of Tides)
") Chapter 12: Coasts (after a brief review of Tides) 1 Questions from previous classes: What happens when a wave meets a current? wave = people walking current = bus If wave goes with the current, the wave
Chapter 12: Coasts (after a brief review of Tides) 1 Questions from previous classes: What happens when a wave meets a current? wave = people walking current = bus If wave goes with the current, the wave
Table 4. Volumetric Change Rates Pre-Project and Post-Project for the Town of Duck
 V. VOLUMETRIC CHANGES General Volumetric changes measured over the entire monitoring area for various time periods are provided in Table 4. The volume changes are given in terms of cubic yards/foot of
STATUS REPORT FOR THE SUBMERGED REEF BALL TM ARTIFICIAL REEF SUBMERGED BREAKWATER BEACH STABILIZATION PROJECT FOR THE GRAND CAYMAN MARRIOTT HOTEL
 August 23 STATUS REPORT FOR THE SUBMERGED REEF BALL TM ARTIFICIAL REEF SUBMERGED BREAKWATER BEACH STABILIZATION PROJECT FOR THE GRAND CAYMAN MARRIOTT HOTEL performed by Lee E. Harris, Ph.D., P.E. Consulting
Estuarine Shoreline Stabilization
 Estuarine Shoreline Stabilization Property Owner s Guide to Determining the Most Appropriate Stabilization Method Estuarine shorelines are dynamic features that experience continued erosion. Land is lost
Coastal storm damage reduction program in Salerno Province after the winter 2008 storms
 Coastal Processes 119 Coastal storm damage reduction program in Salerno Province after the winter 2008 storms G. Benassai 1, P. Celentano 2 & F. Sessa 3 1 Department of Applied Sciences, University of
USE OF SEGMENTED OFFSHORE BREAKWATERS FOR BEACH EROSION CONTROL
 .. CETN-III-22 4/84 PURPOSE: USE OF SEGMENTED OFFSHORE BREAKWATERS FOR BEACH EROSION CONTROL To provide information on the functional application of and general design considerations for using offshore
Delaware Chapter Surfrider Foundation - Indian River Inlet Monitoring
 Delaware Chapter Surfrider Foundation - Indian River Inlet Monitoring In 2012, the Delaware Surfrider Foundation Chapter formed the Surf Quality and Access Committee to focus on issues such as surf spot
Inspection of Clarence City Beaches following Winter 2011 Storm Events
 18 July 2011 WRL Ref: WRL10086TDS L20110718 Messrs P Watson & I Preece Clarence City Council PO Box 96 Rosny Park TAS 7018 By email: pwatson@ccc.tas.gov.au ipreece@ccc.tas.gov.au Dear Phil/Ian, Inspection
Figure79. Location map for the 10 NJBPN profile sites in Atlantic County, NJ 155
 154 Figure79. Location map for the 10 NJBPN profile sites in Atlantic County, NJ 155 ATLANTIC COUNTY SPRING 2009 to FALL 2010 The Atlantic County coastline consists of three barrier islands. Between Little
FINAL REPORT FOR 2013 ON THE CONDITION OF THE MUNICIPAL OCEANFRONT BEACHES THE BOROUGH OF AVALON, CAPE MAY COUNTY, NEW JERSEY
 FINAL REPORT FOR 2013 ON THE CONDITION OF THE MUNICIPAL OCEANFRONT BEACHES THE BOROUGH OF AVALON, CAPE MAY COUNTY, NEW JERSEY View from 12 th Street to the south taken February 28, 2013, following completion
4/20/17. #30 - Coastlines - General Principles Coastlines - Overview
 Writing Assignment Due one week from today by 11:59 pm See main class web pages for detailed instructions Essays will be submitted in Illinois Compass (instructions later) Pick one: Earthquakes, tsunamis,
Essentials of Oceanography Eleventh Edition
 Chapter Chapter 1 10 Clickers Lecture Essentials of Oceanography Eleventh Edition The Coast: Beaches and Shoreline Processes Alan P. Trujillo Harold V. Thurman Chapter Overview Coastal regions have distinct
NCCOE EA Coastal Adaptation Guidelines. Section I Emerging Technology Novel Alternative Approaches to Coastal Erosion
 NCCOE EA Coastal Adaptation Guidelines Section I Emerging Technology Novel Alternative Approaches to Coastal Erosion Alessio Mariani, Doug Lord, Tony Webb James Carley, Matt Blacka, Brett Miller Ian Turner,
Performance of Upham Beach T-Groin Project and Its Impact to the Downdrift Beach
 Performance of Upham Beach T-Groin Project and Its Impact to the Downdrift Beach Progress Report for the Period of October 2008 to April 2009 Submitted by Ping Wang, Ph.D., and Tiffany M. Roberts Department
Technical Brief - Wave Uprush Analysis Island Harbour Club, Gananoque, Ontario
 Technical Brief - Wave Uprush Analysis RIGGS ENGINEERING LTD. 1240 Commissioners Road West Suite 205 London, Ontario N6K 1C7 October 31, 2014 Table of Contents Section Page Table of Contents... i List
CHAPTER 179. Performance of a Submerged Breakwater for Shore Protection
 CHAPTER 179 Abstract Performance of a Submerged Breakwater for Shore Protection Albert E. Browder',A. Member, ASCE; Robert G. Dean 2, Member, ASCE; and Renjie Chen 3 A summary is presented of the results
23- Year Sand Volume Changes at Site 132, 15th Street, Brigantine
 149 Figure75. Location map for the 9 NJBPN profile sites in Atlantic County, NJ ATLANTIC COUNTY SPRING 2008 to FALL 2009 150 The Atlantic County oceanfront shoreline consists of three barrier islands.