Measuring Unsafe Pedestrian Behavior Using Observational Data
|
|
|
- Cecilia Roberts
- 6 years ago
- Views:
Transcription
1 Measuring Unsafe Pedestrian Behavior Using Observational Data *Achilleas Kourtellis, Ph.D Pei-Sung Lin, Ph.D., P.E., PTOE Makarand Gawade Center for Urban Transportation Research University of South Florida 4202 East Fowler Avenue, CUT100 Tampa, FL Tel:(813) Fax:(813) Word Count: 4593 words + 5 figures + 4 tables = 6843 words November 14, 2012 * corresponding author
2 ABSTRACT Florida has a severe problem with pedestrian and bicyclist fatalities. Recent trends show that Florida s pedestrian fatality rate is almost double the national average. Traditional safety programs rely on crash data to develop safety campaigns or countermeasures to increase safety. Since crash data are not readily available and a long time has to pass before meaningful data is collected, a risk score was developed to measure the behavior of road users at selected sites in Hillsborough and Miami-Dade counties. Surveys were conducted in June-July 2012 in two of the highest pedestrian crash and fatality counties in Florida to collect data and establish baseline conditions. The surveys included opinion surveys of pedestrians and observations of pedestrians and bicyclists, and their interaction with drivers. The locations where the surveys were conducted were selected based on site characteristics including pedestrian treatments or features, crash history, and land use. The two surveys offered insight on the difference between what people know about the law or correct behavior, and what they actually do in reality. Results pinpoint the problems and aid in deciding the focus of safety campaigns and target audience. The risk score showed that the majority of sites exhibited unsafe behavior from pedestrians, bicyclists, and drivers. The risk score has the potential to aid in measuring the effectiveness of a safety campaign launched by FDOT focused on increasing the awareness on traffic laws. This way, appropriate countermeasures or funds can be selected for the higher ranking sites first.
3 Kourtellis et al. 1 INTRODUCTION Based on NHTSA Traffic Safety Facts, Florida had the highest pedestrian fatality rate, 2.51 pedestrian fatalities per 100,000 population, among all states in 2009 (1). The Florida pedestrian crash rate is double the national average. According to the Dangerous by Design report, a national study in 2011, Florida had an especially high percentage of pedestrian and bicyclist fatalities relative to its population. In addition, based on the same report, the following statements can be summarized: Florida has six percent of the population in the U.S., but 11 percent of all U.S. pedestrian fatalities occurred in Florida, 17.4 percent of all U.S. bicyclist fatalities occurred in Florida, and Florida has been in the top three most dangerous states for bicyclists and pedestrians every year since According to the report, Florida also has four metropolitan areas ranked in the top ten of the most dangerous cities for walking in the U.S. including: 1) Orlando-Kissimmee, 2) Tampa-St. Petersburg-Clearwater, 3) Jacksonville, and 4) Miami-Fort Lauderdale-Pompano Beach (2). It is very difficult to pinpoint the root cause for the Sunshine State s roadways being so dangerous for pedestrians and bicyclists. The debate centers on a behavior versus infrastructure argument. Although there are many factors to consider, common contributing issues may include the following: Population growth contributes to congested highways and traffic-related issues, particularly in urban centers such as the Tampa Bay and Miami areas. Florida s large immigrant population may be unfamiliar with traffic laws. Florida s warm and humid climate allows for year-round outdoor travel and tourism. A research team at the the University of South Florida has been coordinating with FDOT to conduct surveys and establish the level of law awareness of users, as well as the magnitude of the problem based on non-traditional data. The developed site risk score aims to assist program managers in evaluating campaigns, and establish countermeasures without having to wait on crash data which are rare events and one has to wait for a long period for meaningful data. The team hopes to change pedestrian law awareness in both user groups (pedestrians and drivers) so that a behavior is established where all users share the road with fewer incidences, injuries and fatalities. The target areas were Miami-Dade and Hillsborough counties. This paper investigates the level of knowledge of people or their perception regarding pedestrian laws, and what they actually do in reality. Ideally these two should match. The investigation continues on the potential relationship and comparison between these two data sets. The paper describes the method of collecting data on these, and through analysis understand better the reasons why pedestrian crash rates are at such high levels compared to the rest of the country. Section two presents a literature review on similar studies, section three describes the study methodology, section four presents the data collection effort and section five presents the analysis and results. Finally, a discussion on conclusions and future work concludes the paper. LITERATURE REVIEW A detailed review was performed to better understand the previous research conducted in the field of pedestrian safety focusing on studies similar to the current study. Martin et al. (3; 4) conducted a comprehensive review of pedestrian safety and summarized studies evaluating the effect of different engineering countermeasures on pedestrian safety. The demographic characteristics of pedestrian crashes reviewed showed that 60 percent of pedestrian crashes occurred at an intersec-
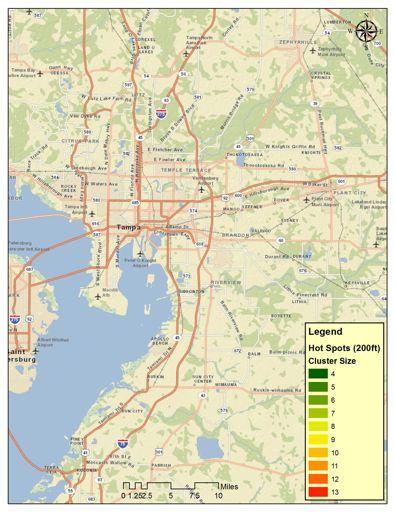
4 Kourtellis et al. 2 tion. Pedestrians alone or both pedestrians and vehicles were at fault for 59.1 percent of pedestrian related crashes. These statistics further emphasize that the behavior of pedestrians while crossing on or near intersections is at risk and warrants more insightful research. Different characteristics which influence these behavioral fallacies are studied to understand their relation (if any) to pedestrian crash risks. It has been proven in recent research that distracted pedestrians/drivers show higher unsafe crossing behavior (5). The distraction was attributed to the use of mobile phones while crossing the intersection. Epidemiological research has attributed gender as a risk factor for pedestrian injury with males being more likely to be in a pedestrian crash (6; 7). A simulation technique called Pretend Road Method was used to understand the roles of age in children s pedestrian safety (8). The study concluded that an older aged pedestrians were more aware while crossing. Several before-and-after studies have been conducted to understand the effect of engineering countermeasures (e.g. adding crosswalks, pedestrian signals, signs, stop signs, etc) on pedestrian safety. The measure of pedestrian safety is the risk factor which can be measured by crash rates. Crash rates have been used as risk measures in previous studies evaluating the effect of crosswalks at uncontrolled locations (9) and the pedestrian safety program for children (10). Crash rates, however, are an inefficient risk measure due to the very low frequency rate and pedestrian exposure. Hence, several studies have used surrogate measures to measure a pedestrian risk factor. Behavioral changes like speed of vehicles, yielding behavior of drivers, percentage of pedestrians crossing on crosswalk, numbers of violations at pedestrian red signal, and cautiousness shown by pedestrians before crossing are some of the surrogate measures used in different studies (11; 12; 13). There have been several techniques to collect data: observation by manual counting, video recordings and interviews (14). Interviews are generally done to understand the public s perceptions (15) or their travel experiences (16). STUDY METHODOLOGY The study was designed to collect data on two main aspects: 1)What road users (pedestrians and drivers) know regarding pedestrian traffic laws and 2)What they do in reality. As mentioned earlier, part of the problem is that crash data are not a timely measure because it takes time (years) for trends to be established and become known to administrators. A new method has to be employed, where data collected within a short time period can be analyzed to identify pedestrian pedestrian safety issues, as well as specific hot spot locations. First, the sites to perform surveys were selected. Then, mapping of the crashes for the last five available years ( ) was utilized to create hot spots of pedestrian crashes. Following the data collection, an analysis of the data resulted in the calculation of a pedestrian risk score for the sites surveyed. The methodology is described in more detail in the following subsections. For the purposes of this study, both pedestrians and bicyclists were included together in the data collection and analysis since they are both considered vulnerable road users. Site Selection The study involved collecting data of pedestrian crossing behavior and driver behavior towards crossing pedestrians in Hillsborough and Miami-Dade counties. The sites were selected by a three stage process:

.")
 of 100ft radius was drawn for each crash, this making its effective diameter 200ft. If two crashes were 200ft apart they created one cluster of size 2 and so on.")
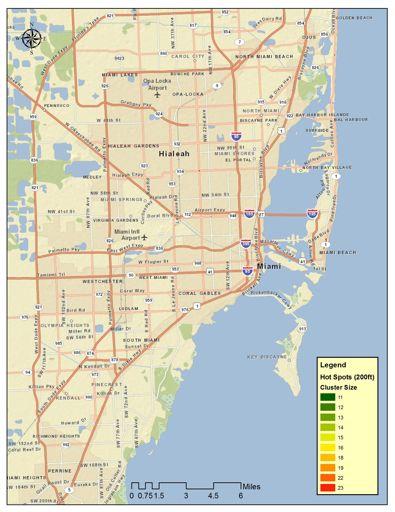
5 Kourtellis et al Pedestrian Crash Hot Spot: Pedestrian crash data for years were obtained from FDOT s Crash Analysis Reporting System (CARS) Database. This data provided the details of all the pedestrian crash locations, as well as other variables such as injury severity, number of pedestrians and drivers, type of crash, etc. These crash locations were geocoded in ArcGIS c and overlayed on a street map as one point for each crash on the exact coordinates the crash was reported. The primary reason for this mapping was to select the sites with historically large numbers of pedestrian crashes (trend for last 5 years of available data). Figure 1 shows the method used to create the hot spots which simply represent the locations with the highest concentration of crashes. The method is described in Figure 1. A circle (buffer) of 100ft radius was drawn for each crash, this making its effective diameter 200ft. If two crashes were 200ft apart they created one cluster of size 2 and so on. The clusters kept growing based on the number of neighboring crashes. The radius of the circle was changed in trials from 50ft to 250ft, resulting in distances of 100ft to 500ft between two neighboring crashes. What changed with this range was the cluster size, which is how many crashes are included in the highest clusters. The location of the highest cluster size remained primarily the same for every trial. Since the purpose of this exercise was to identify the locations or sites for the surveys with the highest crash frequency (hot spots), this method was deemed adequate. The clusters therefore had a different size for each of the two counties, depending on how many total crashes occurred in each county. Figures 2 and 3 represent the hot FIGURE 1 Method used to identify hot spots. spot maps for the two counties. The highest 10 cluster size locations are shown. Based on funding and resources, site selection criteria for Hillsborough and Miami-Dade counties were location hot spots of more than four and nine crash-buffers respectively because this allowed for a total of 20 sites for Hillsborough and 34 for Miami-Dade. Hot spots with smaller cluster size (less than four for Hillsborough and nine for Miami-Dade) were omitted from the data collection for this study because not all sites could be surveyed. 2. Intersection Characteristics: Annual Average Daily Traffic (AADT) obtained from FDOT online data, the number of lanes along the route, the presence of bus stops in the vicinity of the site and the presence of sidewalks and pedestrian features such as pedestrian signals, crosswalks, etc. The intersection characteristics helped identify the sites with the highest combination of all desirable features: high traffic volume and as many pedestrian features as possible. The land use surrounding the sites was also coded in general terms so that the expected pedestrian traffic was included in the selection. Land use was divided into residential, commercial and mixed use. 3. Random Selection: To make the study less biased, the final sites were randomly selected from the second stage list, using a random number operator. Eventually, 34 sites were selected in
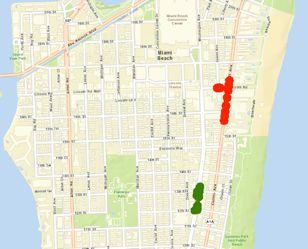
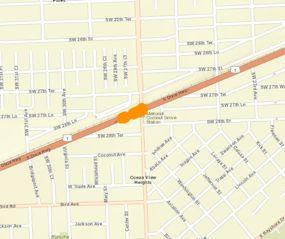

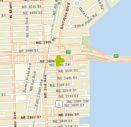
6 Kourtellis et al. 4 FIGURE 2 Examples of Miami-Dade County pedestrian crash hot spots.
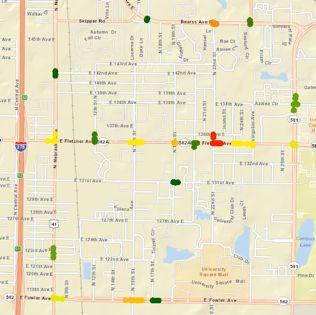
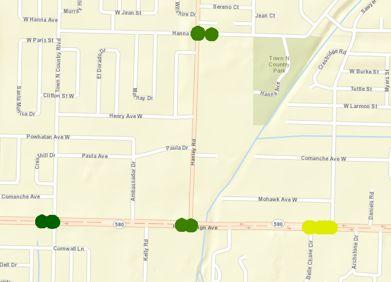

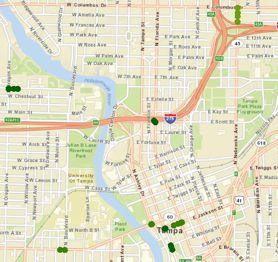
7 Kourtellis et al. 5 FIGURE 3 Examples of Hillsborough County pedestrian hot spots.
8 Kourtellis et al. 6 Miami-Dade and 20 sites were selected in Hillsborough counties. A visual check was performed by mapping the selected sites on street maps to observe if the sites were uniformly distributed as per the hot spot buffers throughout the county areas. DATA COLLECTION Data collection for this study involved two different surveys as explained in the methodology section: 1. Opinion Surveys 2. Observational Surveys Every site had two surveyors. One focused on the observational survey and the other surveyor performed the opinion survey. The surveys were performed for three hours at every site, and the time of day/day of week was designed to match the crash history. The surveys are described in detail in the following sections. Opinion Surveys The first survey was the public opinion survey which was designed to collect the understanding or knowledge of the users as it applies in pedestrian safety and pedestrian traffic laws. The survey also included demographics, crash experience, road-user experience and safety perception questions. It was found to be extremely difficult to collect full surveys as pedestrians either did not have time or did not want to take the survey. Several surveys were therefore incomplete. As an incentive, a tote bag, t-shirt, and reflectors were given at the site, and the opportunity to sign up for a bicycle drawing online after the survey completion was also given as an option. Major importance was given to the pedestrian law survey section, hence, surveyors were asked to give those questions first priority. Observational Surveys Observational surveys offer an insight into the passing pedestrians behavior and walking/crossing patterns. As explained in the literature review section, a list of surrogate measures were to be used in order to calculate the pedestrian risk score. These surrogates included: User (pedestrian or bicyclist) crossing on crosswalk on user signal green time User crossing on crosswalk on user signal red time User not crossing on the crosswalk in perpendicular direction to street User not crossing on the crosswalk in diagonal direction to street Driver yielding/not yielding for the waiting or crossing user (vehicular movement was noted and classified in three types: through movement, left turn, right turn) User did/did not use the sidewalks (if available) before and after crossing the intersection. User risk increases if proper precautions are not taken while crossing the streets. Hence, data for the following measures were also collected: Was the alertness of the user hindered while he was crossing the intersection? (the alertness of the user was considered to be hindered if he/she were crossing while using a cell phone or electronic device, or talking to another crossing user). Were the bicyclists wearing safety gear like a helmet and using bicycle lights? Were the pedestrians or bicyclists moving in the direction of vehicular traffic or in the direction against vehicular traffic?
9 Kourtellis et al. 7 Some demographic characteristics of the crossing users were collected as well. As the study required the observers to collect data of the actual behavior of the users, the demographic characteristics were not asked of the users as it would distract them. These characteristics were estimates and depended solely on discretion of the observer. The approximate age group, race, and gender of the users was collected. Surveyors also observed the behavior of drivers when they were in the potential conflict with the user. A traffic conflict is defined as An observable situation in which two or more road users approach each other in space and time to such an extent that there is risk of collision if their movements remain unchanged. Hence, it was observed whether or not the drivers yielded for a crossing/waiting user. The vehicle s movement on the intersection was observed as well. ANALYSIS AND RESULTS Three separate data sets were created; one for the user s (pedestrian or bicyclist) behavior, one for vehicle interaction with users, and one for the opinion survey questionnaire. Several analyses were conducted with a principal goal of estimating the current risk score of the different sites in the two counties. The following are some analyses conducted and presented in this paper: Aggregate analysis Risk score analysis Relationship analysis Part 1: Aggregate Analysis As mentioned earlier, the law awareness regarding pedestrians was a major subject in the surveys. The following questions were asked by the surveyors to collect data on the law awareness of users. Again here, users refers to both pedestrians and bicyclists. Table 1 summarizes the answers given by the respondents for the questions in the two counties. The following were some questions asked in the survey: Q1: Which user has the right of way in the following situations? Q1a: At signalized intersection with marked or unmarked crosswalk, user is on the crosswalk. Q1b: At midblock location with marked crosswalk, user is on crosswalk. Q1c: At midblock location with unmarked crosswalk, user is crossing. Q2: A vehicle can proceed when a user is crossing a crosswalk and clears their half of the road. Q3: Users can cross anywhere they want (not necessarily on a crosswalk or at intersection). Q4: When there are sidewalks, users are prohibited from walking on the roadway. Q5: What is Jaywalking? Q6: When you are walking along a road without sidewalks, which side should you be? Q7: When you are biking along a road without sidewalks, which side should you be? Q8: At a crosswalk with signals, you can start crossing when? As seen in Table 1, there are some variations in user law awareness levels in the two counties: Hillsborough county users have a better law awareness than Miami-Dade county users concerning right-of-way while crossing streets in different situations. Approximately, 61 percent of pedestrians and 58 percent of bicyclists are aware of the direction in which they should travel (walk against traffic or bike with traffic).
10 Kourtellis et al. 8 TABLE 1 Responses to Law Awareness Survey Questions Q1a Q1b Q1c Survey Answers Hillsborough Miami-Dade Hillsborough Miami-Dade Hillsborough Miami-Dade Vehicle 11.48% 22.97% 19.67% 24.52% 65.00% 56.25% User (ped/bicyclist) 88.52% 77.03% 80.33% 75.48% 35.00% 43.75% Q2 Q3 Q4 Survey Answers Hillsborough Miami-Dade Hillsborough Miami-Dade Hillsborough Miami-Dade Strongly agree 4.10% 13.27% 3.23% 3.88% 16.94% 36.00% Agree 42.62% 34.60% 12.90% 18.93% 58.06% 39.50% Disagree 38.52% 38.86% 54.84% 47.57% 20.16% 19.50% Strongly disagree 14.75% 13.27% 29.03% 29.61% 4.84% 5.00% Q5 Survey Answers Hillsborough Miami-Dade Walking for fun 0.88% 3.37% Crossing the road in a diagonal line 1.77% 6.18% Crossing the road at any place other than at a marked crosswalk 85.84% 71.91% Not crossing perpendicular with the road 4.42% 4.49% Crossing the road midblock between two adjacent signalized intersections 7.08% 14.04% Q6(Walk) Q7(Bike) Survey Answers Hillsborough Miami-Dade Hillsborough Miami-Dade Didn t answer 0.00% 7.31% 0.00% 7.76% Walk(Q6)/bike(Q7) with traffic 34.68% 29.22% 60.48% 55.71% Both directions 4.84% 0.91% 1.61% 0.91% Walk(Q6)/bike(Q7) against traffic 60.48% 62.56% 37.90% 35.62% Q8 Survey Answers Hillsborough Miami-Dade Steady red signal 2.52% 5.29% Flashing red signal 2.52% 6.73% Steady green signal 79.83% 74.04% Numeric countdown 5.88% 9.13% Any time 9.24% 4.81% * Shaded cells represent correct possible answers based on Florida law. Approximately 80 percent of users are aware of the correct time to cross at a signalized intersection. Higher percentages of Hillsborough county users have some understanding of jaywalking. (Based on Florida statutes: Jaywalking is crossing the street midblock and between two signalized intersections with crosswalks and signals. Also, pedestrians have to cross the road on right angles to the edge and not diagonally). Overall the majority of pedestrians/bicyclists that responded to the survey knew the pedestrian laws and how to be safe on the road. Table 2 illustrates a summary of all the variables collected in the observational survey for the user and vehicle data sets. The following are inferences based on the descriptive statistics presented in Table 2: Usage of sidewalk: It was observed that in both counties, most of the users used the side-
11 Kourtellis et al. 9 TABLE 2 Descriptive Statistics for Observations Attributes Hillsborough Miami-Dade Number of sites Number of users (pedestrians & bicyclists) Number of bicyclists 422 (26.79%) 612 (14.98%) Percent of non-alert users 15.97% 15.84% Percent of users who didn t walk on sidewalk 4.07% 4.20% Percent of bicyclist who didn t use helmet 96.78% 86.45% Percent of bicyclists riding against traffic 29.74% 22.47% Percent of users not crossing on crosswalk 27.79% 20.42% Percent of crosswalk users crossing on red 24.40% 34.59% Percent of vehicles not yielding to users 44.12% 44.75% Percent of users crossing diagonally 49.15% 45.24% walks whenever available. There was no significant difference in the usage of sidewalks by users or bicyclists. Alertness of user: Similar results were observed for both counties with the bicyclists being more alert while crossing than pedestrians. A total of percent and percent non-alert pedestrians were observed in Hillsborough and Miami-Dade, whereas 7.60 percent and percent non-alert bicyclists were observed in the two counties respectively. Helmet usage and bicycle lights usage by bicyclists: Helmet usage in Miami-Dade was higher than in Hillsborough, but the usage is still very low. Crossing behavior of users: There was a higher percentage of users crossing on the crosswalk in Miami-Dade County than in Hillsborough County, but ironically red signal violators were higher in Miami-Dade. Vehicles yielding behavior for users: Aggregate drivers yielding behavior in both counties did not show significant statistical difference. Demographics: Figure 4 shows the variation in gender distribution across users. Race: Caucasian, Hispanic and African American users were observed predominantly in both counties with a higher share of Hispanic users in Miami-Dade County. Asian users were not very frequent. Age: Age distribution was similar for pedestrians and bicyclists as well across the two counties. Figure 5 shows that the majority of users were from the young or middle-aged population (81.64% of all users). The categories were what the surveyors observed (not the actual age group) since they did not survey all pedestrians. The age group categories were: 1)Child (<18 yrs old), 2) Young (19-30 yrs old), 3) Middle (31-55 yrs old) and 4) Older (>55 yrs old) approximately. Part 2: Risk Score Analysis The risk score is an empirical score calculated to measure the unsafe behavior observed at each site based on the data collected. It is a weighted score of all the risk measures determined in the observational survey. A single risk score was calculated for every site. The risk score was calculated based on the users crossing behavior (user risk score) and vehicle-user interaction (driver


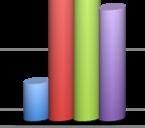

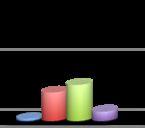
12 Kourtellis et al. 10 $!!"#,!"#!"#$"%&'(")*+),-"#-) +!"# *!"# )!"# (!"# '!"# &!"# %!"# B.>47.# =47.# $!"#!"# -./ # :;<# -./ # =34>3#.-"#)/01")1"#)2*,%&0) FIGURE 4 Gender demographics for the two counties. '!"# &$"# =7.2*#>?%@#<-+#42*A# B4506#>%CD'$#<-+#42*A# 8.**2)#>'$D$$#<-+#42*A# E2*)-#>F$$#<-+#42*A# &!"#!"#$"%&'(")*+),-"#-) %$"# %!"# $"#!"# ()*)+,-./0# # ()*)+,-./0#8./9.# :.;<;2.+,# # :.;<;2.+,#8./9.#.-"#)/01")20)3*,%&0) FIGURE 5 Age distribution for the two counties.
13 Kourtellis et al. 11 risk score). The following formula was used: User Risk Score = P i W i (1) Where, i represents the different surrogates, P is the proportion of the users and W is the weight of different surrogates used in the study. The different risk measures included in the calculation above were the following (weight, W in parenthesis): User crossing on crosswalk (0), User not crossing on crosswalk (-2), User crossing on user green signal (1), User crossing on user red signal (-1), Alert user (0), Non-alert user (-2), Bicyclist riding in direction of traffic (1), Bicyclist riding against direction of traffic (0), User approaching intersections with no sidewalks (-2). The baseline or control condition of a user doing everything safely (crossing on the crosswalk, being alert and using sidewalks or walking/riding on the correct side) had a weight of zero, so unsafe behavior was penalized with a negative value. The magnitude of the weight is arbitrary but empirical based on previous work performed by the authors (17). Engineering judgment and common sense were used to establish the weights. For example, if the users crossed on green, then the weight was positive one, but if they crossed on red, then it was negative one. If the users did not cross on the crosswalk then they were given a weight of negative two. The idea being that this behavior is more dangerous than crossing on the crosswalk even on red signal time. Similarly, the driver risk score was calculated with the same formula as above, but with the measure P being the number of vehicles not yielding to a crossing pedestrian. The weight for this behavior was a negative two. The two risk scores (user, driver) are shown in Table 3. In both counties, the average risk scores are negative. Hence, on average, sites are not safe, which corresponds with the fact that the surveyed sites had the highest crash frequency in the last 5 years. The t-values indicate that the difference in the risk score for the sites is statistically not significant at 95 percent confidence interval. We also observed that there are four sites in Miami- Dade county and three sites in Hillsborough county with positive user risk scores. These numbers are greater than the base value of zero, which indicate safer sites. These values are good indicators of how safe/unsafe the sites are and will be helpful to evaluate the improvement in safety after the awareness campaign. Part 3: Relationship Analysis The variables computed in this study were categorical. Hence, simple Pearson s correlation or regression models could not be used to understand the relationship between different variables. Chi- square or Fisher s exact test were instead used to check if there is any relationship between two variables. The investigation was to determine if there was a relationship between the variables as described: i
14 Kourtellis et al. 12 TABLE 3 User and Driver Risk Scores for Miami-Dade and Hillsborough Counties Miami-Dade User Driver Hillborough User Driver Sites Risk Score Risk Score Sites Risk Score Risk Score Mean Std dev t value Mean Std dev t value Hypothesis: H o = There is no relationship between the two variables H 1 = There is a relationship between the two variables The chi-square value was computed. If it exceeded the critical value, then the null hypothesis is rejected and it can be stated that there is a relationship between the two variables. To understand if there is any strength in the relationship between the categorical variables, contingency coefficient or Cramer s V measures were used. A value closer to one suggests a strong relationship between the variables.
15 Kourtellis et al. 13 Table 4 gives the test result values for crossing locations (on crosswalk/not on crosswalk) and other variables. Chi-square values and Cramer s V values (in parenthesis) can be seen for any two variables. TABLE 4 Relationship Analysis for Crossing Location Variable 2 County Variable 1 Gender Race Age Alertness Riding Use of Type of Direction Sidewalk User Hillsborough * 15.1* ** 0.11 Crossing (0.011) (0.19) (0.02) (0.09) (0.23) (0.23) (0.007) Miami-Dade Location 28.32* * 21.9* 9.13* ** 0.04 (0.078) (0.19) (0.07) (0.05) (0.08) (0.15) (0.03) * indicates that there is some relation between Variables 1 & 2 but Cramer s V value indicates that the relationship is weak. ** indicates that there is a reasonably good relationship between variable 1 and 2. Table 4 shows that the relationships vary across the two counties with Miami-Dade county showing more of a relationship between the crossing locations and the variables. Similar test runs were performed for different variables and layer variables. The highlighted results are listed below: For males, there is no relationship between being alert and crossing behavior. However, females showed a good relationship between the two behaviors. Both males and females showed a weak relationship between walking on the sidewalk and crossing on the crosswalk. Similarly, a weak relationship was observed between the two behaviors for pedestrians and bicyclists. There is a weak relationship between race and crossing behavior for both pedestrians and bicyclists. The relationship is stronger among pedestrians. No relationship was observed between gender and crossing behavior for both pedestrians and bicyclists. CONCLUSION AND FUTURE WORK The team calculated a risk score based on observational data which is a measure of unsafe behavior at selected sites. The scores showed that based on their characteristics and observed pedestrian/bicyclist and driver behavior, the selected sites were primarily unsafe for pedestrians. Based on the calculated risk score, 12 percent of sites in Miami-Dade County and 15 percent of sites in Hillsborough County exhibited marginally safer behavior. For both counties, the driver risk score was lower (negative value) than the pedestrian risk score. Therefore, drivers were riskier and more dangerous towards pedestrians. A comparison of the two surveys showed some interesting results: Based on the survey responses, the majority of pedestrians and bicyclists (82%) knew that a pedestrian or bicyclist has the right-of-way on a crosswalk and a smaller percentage (60%) knew that a vehicle has the right-of-way when a pedestrian is crossing midblock without a marked crosswalk. It was observed that about 44 percent of drivers did not yield to a crossing pedestrian when on a crosswalk. About 47 percent of pedestrians asked, did not know that a vehicle can actually proceed when its half of the road is cleared by a crossing pedestrian.
16 Kourtellis et al. 14 Regarding crossing location, 80 percent of users know that they cannot cross anywhere they want, but 24 percent were observed crossing somewhere other than a crosswalk. Approximately 75 percent of users said that when sidewalks are present, pedestrians are prohibited from using the road, and the observational data corroborates that only four percent of users were observed not using the sidewalks (sidewalks were presents at all sites). About 98 percent of users asked, knew some definition of jaywalking, but 47 percent were observed to cross the road diagonally, and obviously not on a crosswalk. (some start on the crosswalk but did not follow the crosswalk path, rather changed direction halfway). Fifty eight percent of bicyclists knew that they have to ride with traffic, but 52 percent were observed riding against traffic. A total of 84 percent of users knew when they are allowed to start crossing at a crosswalk with pedestrian signals, but about 30 percent were observed crossing on red pedestrian signal. These conclusions show that the method of using opinion surveys and observational surveys to establish the difference between what people know to be the law or the correct behavior, and what is their actual behavior, varies significantly. This method can help pinpoint the problematic areas and group of users with the largest benefit from a safety campaign. The risk score calculated can be used in many sites, and can aid in evaluation of the change in risk or safety of specific sites based on individual characteristics and pedestrian/driver behavior at those sites. Future work includes more analysis of the data and inclusion of a driver opinion survey to make the data set more complete. In certain areas, there is a clear distinction between the driver population and the pedestrian population, so separate surveys have to be used to collect more accurate results relevant to each population. Such an analysis will be a guide to government agencies and can steer educational campaigns or law enforcement efforts in improving pedestrian safety. In this study, an univariate analysis of the different variables was conducted. In the future, there is a scope of undertaking for a multivariate analysis like logit modeling, or cluster analysis, to understand the effects of pedestrian characteristics, other pedestrian behavior, and site characteristics on the final crossing behavior of pedestrians and interaction with drivers. REFERENCES [1] NHTSA, Fatality Analysis Reporting System, [2] Ernst, M. and L. Shoup, Dangerous by Design. Report, Surface Transportation Policy Partnership, [3] Campbell, B., C. V. Zegeer, H. H. Huang, and M. J. Cynecki, A Review of Pedestrian Safety Research in the United States and Abroad. Report FHWA-RD , Federal Highway Administration, [4] Martin, A., Factors Influencing Pedestrian Safety: A Literature Review, [5] Nasar, J., P. Hecht, and R. Wener, Mobile Telephones, Distracted Attention and Pedestrian Safety. Accident Prevention and Analysis, Vol. 40, No. 1, 2008, pp [6] Assailly, J., Characterization and Prevention of Child Pedestrian Accidents: An Overview, 1997.
17 Kourtellis et al. 15 [7] Morrongiello, B. and H. Rennie, Why do boys engage in more risk taking than girls? The role of attributions, beliefs, and risk appraisals, [8] Barton, B. K. and D. C. Schwebel, The Roles of Age, Gender, Inhibitory Control and Parental Supervision in Children s Pedestrian Safety, [9] Zegeer, C. V., J. R. Stewart, H. H. Huang, and P. A. Lagerwey, Safety Effects of Marked Vs. Unmarked Crosswalks at Uncontrolled Locations. Report FHWA-RD , Federal Highway Administration, [10] Fortenberry, J. C. and D. B. Brown, Problem Identification, Implementation and Evaluation of a Pedestrian Safety Program, [11] Hakkert, A., V. Gitelman, and E. Ben-Shabat, An Evaluation of Crosswalk Warning Systems: Effects on User and Vehicle Behavior, [12] Guo, H., W. Wang, W. Guo, X. Jiang, and H. Bubb, Reliability Analysis of User Safety Crossing in Urban Traffic Environment, [13] Hotz, G., S. Cohn, A. Castelblanco, S. Colston, M. Thomas, A. Weiss, J. Nelson, and R. Duncan, WalkSafe: a School-based Pedestrian Safety Intervention Program, [14] Crosswalk Safety Evaluation Using a Pedestrian Risk Index as a Traffic Conflict Measure, [15] Sisiopiku, V. and D. Akin, Pedestrian Behaviors At and Perceptions Towards Various Pedestrian Facilities: an Examination Based on Observation and Survey Data, [16] Hine, J., User Travel Experiences: Assessing the Impact of Traffic on Behavior and Perceptions of Safety Using an In-Depth Interview Technique, [17] Kourtellis, A., P.-S. Lin, M. Gawade, and H. Zhou, Evaluation of Pedestrian Safety Action Plan in Tampa Bay. ITE, 2010.
Do As I Say Not As I Do: Observed Compliance vs. Stated Understanding of Pedestrian Crossing Laws in Florida
 Do As I Say Not As I Do: Observed Compliance vs. Stated Understanding of Pedestrian Crossing Laws in Florida Achilleas Kourtellis, Ph.D. July 9, 2015 CUTR Webcast Series Center for Urban Transportation
Application of Demographic Analysis to Pedestrian Safety. Center for Urban Transportation Research University of South Florida
 Application of Demographic Analysis to Pedestrian Safety BDV25 TWO 977 30 Pei Sung Lin, Ph.D., P.E., PTOE, FITE Program Director Achilleas Kourtellis, Ph.D. Senior Research Associate CUTR, University of
Understanding Interactions between Drivers and Pedestrian Features at Signalized Intersections
 Understanding Interactions between Drivers and Pedestrian Features at Signalized Intersections SHRP2 Implementation Assistance Program (IAP) Round 4 Concept to Countermeasures Research to Deployment Using
PEDESTRIAN/BICYCLIST CRASH ANALYSIS 2015
 PEDESTRIAN/BICYCLIST CRASH ANALYSIS 2015 Central Arkansas Regional Transportation Study Table of Contents Executive Summary... 3 CARTS Pedestrian/Bicycle Crash Analysis... 3 Report Format... 3 Results...
Baseline Survey of New Zealanders' Attitudes and Behaviours towards Cycling in Urban Settings
 Baseline Survey of New Zealanders' Attitudes and Behaviours towards Cycling in Urban Settings Highlights 67% of urban New Zealanders, 18 years of age or more own or have access to a bicycle that is in
Effects of Traffic Signal Retiming on Safety. Peter J. Yauch, P.E., PTOE Program Manager, TSM&O Albeck Gerken, Inc.
 Effects of Traffic Signal Retiming on Safety Peter J. Yauch, P.E., PTOE Program Manager, TSM&O Albeck Gerken, Inc. Introduction It has long been recognized that traffic signal timing can have an impact
An Application of Signal Detection Theory for Understanding Driver Behavior at Highway-Rail Grade Crossings
 An Application of Signal Detection Theory for Understanding Driver Behavior at Highway-Rail Grade Crossings Michelle Yeh and Jordan Multer United States Department of Transportation Volpe National Transportation
Relationship of Road Lane Width to Safety for Urban and Suburban Arterials
 Relationship of Road Lane Width to Safety for Urban and Suburban Arterials Phd. Alma AFEZOLLI Polytechnic University of Tirana Construction and Infrastructure Department of Civil Engineering Faculty Tirana,
The 2002 Pedestrian Safety Awareness Campaign
 The 2002 Pedestrian Safety Awareness Campaign From the Metropolitan Washington Council of Governments ABOUT THIS REPORT This report describes the 2002 Street Smart Campaign of the Metropolitan Washington
FLETCHER AVENUE PEDESTRIAN AND BICYCLIST BEHAVIOR CHANGE FORMATIVE RESEARCH PROJECT
 FLETCHER AVENUE PEDESTRIAN AND BICYCLIST BEHAVIOR CHANGE FORMATIVE RESEARCH PROJECT EXTENT OF CHANGES IN PEDESTRIAN AND BICYCLIST ATTITUDES AND BEHAVIORS DIRECTLY AFTER A COMPLETE STREETS PROJECT IN FLORIDA
MEMORANDUM. Charlotte Fleetwood, Transportation Planner
 MEMORANDUM Date: Updated August 22, 2017 To: Organization: Charlotte Fleetwood, Transportation Planner Boston Transportation Department From: Jason DeGray, P.E., PTOE, Regional Director of Engineering
PEDESTRIAN COLLISIONS IN LOS ANGELES 1994 through 2000
 PEDESTRIAN COLLISIONS IN LOS ANGELES 1994 through 2000 City of Los Angeles Department of Transportation Gloria Jeff, General Manager March, 2006 This document printed with grant funds from the California
Every time a driver is distracted,
 Walking on the Wild Side: Distracted Pedestrians and Traffic Safety Brendan J. Russo, Emmanuel James, Christopher Y. Aguilar, Edward J. Smaglik Every time a driver is distracted, including by their cellphone,
PEDESTRIAN SAFETY IMPROVEMENT EVALUATION GUIDELINE FOR UNCONTROLLED CROSSINGS
 PEDESTRIAN SAFETY IMPROVEMENT EVALUATION GUIDELINE FOR UNCONTROLLED CROSSINGS Traffic Safety Engineering Division Updated: April 2018 EXECUTIVE SUMMARY NDOT Traffic Safety Engineering Division developed
Prediction of Pedestrian Crashes at Midblock Crossing Areas using Site and Behavioral Characteristics Preliminary Findings
 Prediction of Pedestrian Crashes at Midblock Crossing Areas using Site and Behavioral Characteristics Preliminary Findings Timothy J. Gates, Ph.D., P.E. June 22, 2016 Pedestrian-Involved Crashes Pedestrian-Involved
Bicycle and Pedestrian Level of Service Evaluation
 Bicycle and Pedestrian Level of Service Evaluation June 214 Florida Department of Transportation Bicycle and Pedestrian Evaluation Prepared by Sprinkle Consulting Cambridge Systematics For the Florida
METROPOLITAN TRANSPORTATION PLAN OUTREACH: INTERACTIVE MAP SUMMARY REPORT- 10/03/14
 METROPOLITAN TRANSPORTATION PLAN OUTREACH: INTERACTIVE MAP SUMMARY REPORT- 10/03/14 INTRODUCTION This document summarizes the results of the online interactive mapping exercise implemented by MIG for the
Reduction of Speed Limit at Approaches to Railway Level Crossings in WA. Main Roads WA. Presenter - Brian Kidd
 Australasian College of Road Safety Conference A Safe System: Making it Happen! Melbourne 1-2 September 2011 Reduction of Speed Limit at Approaches to Railway Level Crossings in WA Radalj T 1, Kidd B 1
How Policy Drives Mode Choice in Children s Transportation to School
 How Policy Drives Mode Choice in Children s Transportation to School Physical Activity through Active Transportation Ruth L. Steiner 2011 Technical Conference and Exhibit Lake Buena Vista, FL April 3-6,
FDOT Bicycle/Pedestrian Focused Initiative & Complete Streets
 Florida Department of TRANSPORTATION FDOT Bicycle/Pedestrian Focused Initiative & Complete Streets Billy L. Hattaway, PE District One Secretary Secretary s Pedestrian Safety Initiative Dangerous by Design
Southern California Walking/Biking Research And Creative Evaluation
 Southern California Walking/Biking Research And Creative Evaluation Quantitative Research Topline Report December 7, 2015 Background & Objectives The Southern California Association of Governments (SCAG)
IMPROVING PEDESTRIAN SAFETY AT UNCONTROLLED CROSSINGS. Guidelines for Marked Crosswalks
 IMPROVING PEDESTRIAN SAFETY AT UNCONTROLLED CROSSINGS Presented by Nazir Lalani P.E. Traffex Engineers Inc. N_lalani@hotmail.com Guidelines for Marked Crosswalks Source: FHWA, Safety Effects of Marked
MRI-2: Integrated Simulation and Safety
 MRI-2: Integrated Simulation and Safety Year 3 2 nd Quarterly Report Submitted by: Dr. Essam Radwan, P.E. (PI), Ahmed.Radwan@ucf.edu Dr. Hatem Abou-Senna, P.E., habousenna@ucf.edu Dr. Mohamed Abdel-Aty,
Relationship Between Child Pedestrian Accidents and City Planning in Zarqa, Jordan
 112 TRANSPORTATION RESEARCH RECORD 1281 Relationship Between Child Pedestrian Accidents and City Planning in Zarqa, Jordan ADU H. AL-BALBISSI, MOHAMED T. ABOUL-ELA, AND SABAH SAMMOUR The relationship between
FHWA Resources for Pedestrian and Bicycle Professionals
 FHWA Resources for Pedestrian and Bicycle Professionals Charlie Zegeer, UNC Highway Safety Research Center/PBIC Libby Thomas, UNC Highway Safety Research Center Dan Nabors, Vanasse Hangen Brustlin (VHB)
EVALUATION OF HAWK SIGNAL AT GEORGIA AVENUE AND HEMLOCK STREET, NW IN THE DISTRICT OF COLUMBIA FINAL REPORT. August 30, 2010
 EVALUATION OF HAWK SIGNAL AT GEORGIA AVENUE AND HEMLOCK STREET, NW IN THE DISTRICT OF COLUMBIA FINAL REPORT August 30, 2010 Submitted to: Mr. George Branyan Pedestrian Program Manager Policy, Planning
Pedestrian Safety Initiatives National Highway Traffic Safety Administration (NHTSA)
") Pedestrian Safety Initiatives National Highway Traffic Safety Administration (NHTSA) Report to the Transportation Research Board Pedestrian Safety Committee January 2010 Leah Walton Safety Countermeasures
Pedestrian Safety Initiatives National Highway Traffic Safety Administration (NHTSA) Report to the Transportation Research Board Pedestrian Safety Committee January 2010 Leah Walton Safety Countermeasures
2017 North Texas Regional Bicycle Opinion Survey
 2017 North Texas Regional Bicycle Opinion Survey Sustainable Development Program Kevin Kokes, AICP Public Meetings April, 2018 North Central Texas Council of Governments MPO for the Dallas-Fort Worth Region
A METHODOLOGY TO QUANTIFY PEDESTRIAN CRASH RATES AGAINST STATEWIDE AVERAGES FOR ROADWAYS AND INTERSECTIONS
 A METHODOLOGY TO QUANTIFY PEDESTRIAN CRASH RATES AGAINST STATEWIDE AVERAGES FOR ROADWAYS AND INTERSECTIONS Hatem Abou-Senna, PhD., P.E. Assistant Professor Center for Advanced Transportation Systems Simulations
CHAPTER 2 LITERATURE REVIEW
 CHAPTER 2 LITERATURE REVIEW 2.1 Introduction This chapter presents some background information of the available literature related to the development of accident rates, accident models and accident statistic
ADOT Statewide Bicycle and Pedestrian Program Summary of Phase IV Activities APPENDIX B PEDESTRIAN DEMAND INDEX
 ADOT Statewide Bicycle and Pedestrian Program Summary of Activities APPENDIX B PEDESTRIAN DEMAND INDEX May 24, 2009 Pedestrian Demand Index for State Highway Facilities Revised: May 29, 2007 Introduction
Driverless Vehicles Potential Influence on Bicyclist Facility Preferences
 Driverless Vehicles Potential Influence on Bicyclist Facility Preferences MICHAEL BLAU, MCRP, LCI O T E C O C T O B E R 2 6, 2 0 1 6 S E S S I O N # 8 2 - E V A L U AT I N G T H E P E R F O R M A N C E
PRELIMINARY DRAFT FIRST AMENDMENT TO VISION 2050: A REGIONAL LAND USE AND TRANSPORTATION PLAN FOR SOUTHEASTERN WISCONSIN
 PRELIMINARY DRAFT FIRST AMENDMENT TO VISION 2050: A REGIONAL LAND USE AND TRANSPORTATION PLAN FOR SOUTHEASTERN WISCONSIN ESTABLISHING TARGETS FOR FEDERAL PERFORMANCE MEASURES: HIGHWAY SAFETY SOUTHEASTERN
2012 TOWN OF CASTLE ROCK MOTOR VEHICLE ACCIDENT FACTS PREPARED BY THE PUBLIC WORKS DEPARTMENT
 ATTACHMENT A 2012 TOWN OF CASTLE ROCK MOTOR VEHICLE ACCIDENT FACTS PREPARED BY THE PUBLIC WORKS DEPARTMENT ACKNOWLEDGEMENTS This report was assembled from data provided by the Castle Rock Police Department
A Safe Routes to School Survey in Hillsborough County
 A Safe Routes to School Survey in Hillsborough County Prepared for Florida Department of Transportation, District 7 Project Manager: Peter Hsu, P.E. Prepared by Huaguo Zhou, Ph.D., P.E. Senior Research
POLICY AGENDA For Elder Pedestrian Safety
 POLICY AGENDA For Elder Pedestrian Safety Older adults and people with disabilities often have mobility, cognitive, and sensory limitations that affect their behavior as pedestrians and place them at risk
Determining bicycle infrastructure preferences A case study of Dublin
 *Manuscript Click here to view linked References 1 Determining bicycle infrastructure preferences A case study of Dublin Brian Caulfield 1, Elaine Brick 2, Orla Thérèse McCarthy 1 1 Department of Civil,
Focus on Enforcement. 7/21/2017 Presentation to SFMTA Policy & Governance Committee. Joe Lapka Corina Monzón
 Focus on Enforcement Insights from research and analysis in support of San Francisco s Vision Zero plan to eliminate traffic deaths Joe Lapka Corina Monzón 7/21/2017 Presentation to SFMTA Policy & Governance
DANGEROUS BY DESIGN MARYLAND. Solving the Epidemic of Preventable Pedestrian Deaths (And Making Great Neighborhoods)
") DANGEROUS BY DESIGN 2011 MARYLAND Solving the Epidemic of Preventable Pedestrian Deaths (And Making Great Neighborhoods) DANGEROUS BY DESIGN 2011 Maryland T4AMERICA.ORG Between 2000 and 2009, 1,057 people
DANGEROUS BY DESIGN 2011 MARYLAND Solving the Epidemic of Preventable Pedestrian Deaths (And Making Great Neighborhoods) DANGEROUS BY DESIGN 2011 Maryland T4AMERICA.ORG Between 2000 and 2009, 1,057 people
Double Pair Comparisons PART III AGE & GENDER. Age and Crash Risk. Subject & control groups Relative risk or rate. Relative Accident Involvement Ratio
 Double Pair Comparisons PART III AGE & GENDER Subject & control groups Relative risk or rate Ratio of subject to control Relative Accident Involvement Ratio Age and Crash Risk RAIR = % at-fault % not at-fault
Non-motorized Transportation Planning Resource Book Mayor s Task Force on Walking and Bicycling City of Lansing, Michigan Spring 2007 pg.
 Non-motorized Transportation Planning Resource Book pg. 105 of 158 Non-motorized Transportation Planning Resource Book pg. 106 of 158 Non-motorized Transportation Planning Resource Book pg. 107 of 158
Travel and Rider Characteristics for Metrobus
 Travel and Rider Characteristics for Metrobus 040829040.15 Travel and Rider Characteristics for Metrobus: 2012-2015 Overview The Miami Dade County Metropolitan Planning Organization (MPO) conducted a series
A Study of Effectiveness of Midblock Pedestrian Crossings: Analyzing a Selection of High-Visibility Warning Signs
 : Analyzing a Selection of High-Visibility Warning Signs Rebekka Apardian Bhuiyan Monwar Alam Associate Professor, Department of Geography & Planning, The University of Toledo, Abstract The purpose of
Title: Modeling Crossing Behavior of Drivers and Pedestrians at Uncontrolled Intersections and Mid-block Crossings
 Title: Modeling Crossing Behavior of Drivers and Pedestrians at Uncontrolled Intersections and Mid-block Crossings Objectives The goal of this study is to advance the state of the art in understanding
Analysis of Signalized Intersection Crashes Nasima Bhuiyan, EmelindaM. Parentela and Venkata S. Inapuri
 Analysis of Signalized Intersection Crashes Nasima Bhuiyan, EmelindaM. arentela and Venkata S. Inapuri Abstract The goals of providing high levels of mobility and intersection efficiency while simultaneously
How Much Do You Lose When Your Road Goes on a Diet?
 Huang, Stewart, Zegeer, and Tan Esse 1 How Much Do You Lose When Your Road Goes on a Diet? *Herman F. Huang, *J. Richard Stewart, *Charles V. Zegeer, and **Carol H. Tan Esse herman_huang@unc.edu jstewart@claire.hsrc.unc.edu
DOI /HORIZONS.B P23 UDC : (497.11) PEDESTRIAN CROSSING BEHAVIOUR AT UNSIGNALIZED CROSSINGS 1
 PEDESTRIAN CROSSING BEHAVIOUR AT UNSIGNALIZED CROSSINGS 1") DOI 10.20544/HORIZONS.B.03.1.16.P23 UDC 656.142.054:159.922(497.11) PEDESTRIAN CROSSING BEHAVIOUR AT UNSIGNALIZED CROSSINGS 1 JelenaMitrovićSimić 1, Valentina Basarić, VukBogdanović Department of Traffic
DOI 10.20544/HORIZONS.B.03.1.16.P23 UDC 656.142.054:159.922(497.11) PEDESTRIAN CROSSING BEHAVIOUR AT UNSIGNALIZED CROSSINGS 1 JelenaMitrovićSimić 1, Valentina Basarić, VukBogdanović Department of Traffic
Safety Emphasis Areas & Safety Project Development Florida Department of Transportation District Seven Tampa Bay
 Safety Emphasis Areas & Safety Project Development Florida Department of Transportation District Seven Tampa Bay Stephen L. Benson, AICP, CNU-A FDOT District Seven Safety Office Presentation Overview Safety
The Corporation of the City of Sarnia. School Crossing Guard Warrant Policy
 The Corporation of the City of Sarnia School Crossing Guard Warrant Policy Table of Contents Overview And Description... 2 Role of the School Crossing Guard... 2 Definition of a Designated School Crossing...
The Safety Impact of Right Turn on Red: Report to Congress
 The Safety Impact of Right Turn on Red: Report to Congress Number 86 February 1995 U.S. Department of Transportation National Highway Traffic Safety Administration 400 Seventh Street, S.W., Washington,
DOT HS September Crash Factors in Intersection-Related Crashes: An On-Scene Perspective
 DOT HS 811 366 September 2010 Crash Factors in Intersection-Related Crashes: An On-Scene Perspective DISCLAIMER This publication is distributed by the U.S. Department of Transportation, National Highway
FDOT Bicycle/Pedestrian Focused Initiative & Complete Streets
 Florida Department of TRANSPORTATION FDOT Bicycle/Pedestrian Focused Initiative & Complete Streets DeWayne Carver, AICP State Bicycle/Pedestrian Coordinator Secretary s Pedestrian Safety Initiative Dangerous
Factors Leading to Older Drivers Intersection Crashes
 Factors Leading to Older Drivers Intersection Crashes APHA Annual Meeting 2007 Washington, DC November 7, 2007 Keli A. Braitman Bevan B. Kirley Neil K. Chaudhary Projections of population and licensure
Traffic Parameter Methods for Surrogate Safety Comparative Study of Three Non-Intrusive Sensor Technologies
 Traffic Parameter Methods for Surrogate Safety Comparative Study of Three Non-Intrusive Sensor Technologies CARSP 2015 Collision Prediction and Prevention Approaches Joshua Stipancic 2/32 Acknowledgements
Chapter 5 DATA COLLECTION FOR TRANSPORTATION SAFETY STUDIES
 Chapter 5 DATA COLLECTION FOR TRANSPORTATION SAFETY STUDIES 5.1 PURPOSE (1) The purpose of the Traffic Safety Studies chapter is to provide guidance on the data collection requirements for conducting a
IMPROVED SAFETY SURFACE ACCESS AT LOW COST AIRPORTS: KUALA LUMPUR INTERNATIONAL AIRPORT, MALAYSIA CASE STUDY
 IMPROVED SAFETY SURFACE ACCESS AT LOW COST AIRPORTS: KUALA LUMPUR INTERNATIONAL AIRPORT, MALAYSIA CASE STUDY Rohafiz Sabar, Mustakim Melan, Nur Khairiel Anuar Universiti Utara Malaysia Transport and Logistics
COLLISION STATISTICS May Engineering Services Box 5008, th Avenue Red Deer, AB T4N 3T4
 COLLISION STATISTICS 2016 2016 Red Deer Annual Motor Vehicle Collision Report May 2017 Engineering Services Box 5008, 4914 48th Avenue Red Deer, AB T4N 3T4 engineering@reddeer.ca RCMP GRC Red Deer City
Analyses and statistics on the frequency and the incidence of traffic accidents within Dolj County
 UNIVERSITY OF PITESTI SCIENTIFIC BULLETIN Faculty of Mechanics and Technology AUTOMOTIVE series, year XXIV, no. 28 Analyses and statistics on the frequency and the incidence of traffic accidents within
Wildlife Ad Awareness & Attitudes Survey 2015
 Wildlife Ad Awareness & Attitudes Survey 2015 Contents Executive Summary 3 Key Findings: 2015 Survey 8 Comparison between 2014 and 2015 Findings 27 Methodology Appendix 41 2 Executive Summary and Key Observations
DYING WHILE WALKING INTERROGATING MEDIA COVERAGE OF PEDESTRIAN DEATHS IN THE UNITED STATES
 DYING WHILE WALKING INTERROGATING MEDIA COVERAGE OF PEDESTRIAN DEATHS IN THE UNITED STATES ANTHONY CAMPBELL, ASSISTANT PROFESSOR, TENNESSEE STATE UNIVERSITY CARA ROBINSON, ASSOCIATE PROFESSOR, TENNESSEE
CROSSING GUARD PLACEMENT CONSIDERATIONS AND GAP ASSESSMENT
 CROSSING GUARD PLACEMENT CONSIDERATIONS AND GAP ASSESSMENT Many factors contribute to the need for a Crossing Guard. General federal guidance, provided by the FHWA MUTCD, states that adult crossing guards
A Conceptual Approach for Using the UCF Driving Simulator as a Test Bed for High Risk Locations
 A Conceptual Approach for Using the UCF Driving Simulator as a Test Bed for High Risk Locations S. Chundi, M. Abdel-Aty, E. Radwan, H. Klee and E. Birriel Center for Advanced Transportation Simulation
Transportation Issues Poll for New York City
 2016-17 Transportation Issues Poll for New York City 82% support Vision Zero and reducing traffic deaths 72% on average, support more street space for children to play, protected bike lanes and other safety
SAFETY ANALYSIS OF DRIVEWAY CHARACTERISTICS IN SOUTH CAROLINA USING GIS. Wayne A. Sarasua Kweku Brown
 SAFETY ANALYSIS OF DRIVEWAY CHARACTERISTICS IN SOUTH CAROLINA USING GIS Wayne A. Sarasua Kweku Brown Overall Goal The overall goal of this project is to enhance SCDOT s current access management practices
Prioritizing Schools for Safe Routes to School Infrastructure Projects
 Prioritizing Schools for Safe Routes to School Infrastructure Projects Determining the most effective use of limited infrastructure funds is a challenging task. It is especially demanding for local transportation
IDENTIFYING FACTORS EXPLAINING PEDESTRIAN CRASH SEVERITY: A STUDY OF AUSTIN, TEXAS
 0 0 IDENTIFYING FACTORS EXPLAINING PEDESTRIAN CRASH SEVERITY: A STUDY OF AUSTIN, TEXAS Elizabeth A. Welch, Corresponding Author University of Texas at Austin 0 Inner Campus Drive Stop B00, Austin, TX -00
Designing for Pedestrian Safety. Alabama Department of Transportation Pre-Construction Conference May 2016
 Designing for Pedestrian Safety Alabama Department of Transportation Pre-Construction Conference May 2016 1 Designing for Pedestrians Marking Crosswalks at Signalized intersections High Visibility Markings
Safety Assessment of Installing Traffic Signals at High-Speed Expressway Intersections
 Safety Assessment of Installing Traffic Signals at High-Speed Expressway Intersections Todd Knox Center for Transportation Research and Education Iowa State University 2901 South Loop Drive, Suite 3100
HSIS. Association of Selected Intersection Factors With Red-Light-Running Crashes. State Databases Used SUMMARY REPORT
 HSIS HIGHWAY SAFETY INFORMATION SYSTEM The Highway Safety Information Systems (HSIS) is a multi-state safety data base that contains accident, roadway inventory, and traffic volume data for a select group
EVALUATION OF A GREEN BIKE LANE WEAVING AREA IN ST. PETERSBURG, FLORIDA. William W. Hunter Senior Research Scientist
 EVALUATION OF A GREEN BIKE LANE WEAVING AREA IN ST. PETERSBURG, FLORIDA William W. Hunter Senior Research Scientist Raghavan Srinivasan Senior Transportation Research Engineer Carol A. Martell Senior Applications
City of San Diego Vision Zero Draft Strategic Plan FY 2017
 City of San Diego Vision Zero Draft Strategic Plan FY 2017 Engineering Objective: To develop and implement a strategy that employs best planning, design and engineering practices. Background: Over the
At each type of conflict location, the risk is affected by certain parameters:
 TN001 April 2016 The separated cycleway options tool (SCOT) was developed to partially address some of the gaps identified in Stage 1 of the Cycling Network Guidance project relating to separated cycleways.
An Evaluation of High-Visibility Crosswalk Treatment - Clearwater, Florida
 An Evaluation of High-Visibility Crosswalk Treatment - Clearwater, Florida REPORT NO. FHWA-RD-00-105 August 2001 U.S. Department of Transportation Federal Highway Administration Research, Development,
Pedestrian & Bicycle Safety Innovations & Applications
 Pedestrian & Bicycle Safety Innovations & Applications County Engineers Association of Maryland Spring, 2017 Conference May 25, 2017 George Branyan Pedestrian Program Coordinator District Department of
Appendix E: Bike Crash Analysis ( )
") Appendix E: Bike Crash Analysis (2009-2012) Davis Bicycle Crashes Analysis 2009-2012 December 2013 Ride Walk Davis Active Transportation Program City of Davis December 2013 Prepared by: Jimmy Fong Active
Appendix E: Bike Crash Analysis (2009-2012) Davis Bicycle Crashes Analysis 2009-2012 December 2013 Ride Walk Davis Active Transportation Program City of Davis December 2013 Prepared by: Jimmy Fong Active
Analyzing Spatial Patterns, Statistics Based on FAST Act Safety Performance Measures
 Analyzing Spatial Patterns, Statistics Based on FAST Act Safety Performance Measures Abhishek Bhargava, PhD April 13, 2017 Agenda Objective Highway Safety Improvement Program (HSIP) & FAST Act Performance
City of Elizabeth City Neighborhood Traffic Calming Policy and Guidelines
 City of Elizabeth City Neighborhood Traffic Calming Policy and Guidelines I. Purpose: The City of Elizabeth City is committed to ensure the overall safety and livability of residential neighborhoods. One
BICYCLE INFRASTRUCTURE PREFERENCES A CASE STUDY OF DUBLIN
 Proceedings 31st August 1st ITRN2011 University College Cork Brick, McCarty and Caulfield: Bicycle infrastructure preferences A case study of Dublin BICYCLE INFRASTRUCTURE PREFERENCES A CASE STUDY OF DUBLIN
Evaluation of shared use of bicycles and pedestrians in Japan
 Urban Transport XIV 47 Evaluation of shared use of bicycles and pedestrians in Japan P. Zhe 1, H. Yamanaka 2 & K. Kakihara 1 1 Department of Civil and Environmental Engineering, Graduate School of Advanced
HSRC News Briefs. PBIC launches Designing for Pedestrian Safety Webinar series. Three new summary reports from HSIS
 PBIC launches Designing for Pedestrian Safety Webinar series This summer the Pedestrian and Bicycle Information Center (PBIC), a clearinghouse of the Federal Highway Administration (FHWA) housed within
TYPES OF CYCLING. Figure 1: Types of Cycling by Gender (Actual) Figure 2: Types of Cycling by Gender (%) 65% Chi-squared significance test results 65%
 Figure 2: Types of Cycling by Gender (%) 65% Chi-squared significance test results 65%") TYPES OF CYCLING 1,980 responses were received to this question (multiple answers were allowed), 727 female (41%) and 1,242 (71%) from male respondents. The most common responses for both genders were
TYPES OF CYCLING 1,980 responses were received to this question (multiple answers were allowed), 727 female (41%) and 1,242 (71%) from male respondents. The most common responses for both genders were
The DC Pedestrian Master Plan
 The DC Pedestrian Master Plan September 28, 2010 George Branyan Pedestrian Program Coordinator District Department of Transportation Presentation Agenda Scope of the Plan Methodology Recommendations Implementation
8. Collisions INTRODUCTION
 8. Collisions INTRODUCTION While traffic collisions can affect anyone, they have a disproportionate impact on bicyclists, who along with pedestrians are the most vulnerable users of the transportation
DOWNTOWN MIAMI PEDESTRIAN PRIORITY ZONE
 DOWNTOWN MIAMI PEDESTRIAN PRIORITY ZONE AUGUST 6, 2013 DOWNTOWN MIAMI BY THE NUMBERS more than 200,000 people live, work, and play here every day is home to more than 1,000 events each year hosts more
Access Management in the Vicinity of Intersections
 Access Management in the Vicinity of Intersections FHWA-SA-10-002 Technical Summary Photo: Ralph Bentley (used with permission) 0 Access Management is: The design, implementation and management of entry
Human factors of pedestrian walking and crossing behaviour
 Human factors of pedestrian walking and crossing behaviour Eleonora Papadimitriou 1, Sylvain Lassarre 2, George Yannis 1 1 Department of Transportation Planning and Engineering, National Technical University
DKS & WASHINGTON COUNTY Washington County Transportation Survey
 PREPARED FOR: DKS & WASHINGTON COUNTY Washington County Transportation Survey April 2013 PREPARED BY: DHM RESEARCH (503) 220-0575 239 NW 13 th Ave., #205, Portland, OR 97209 www.dhmresearch.com 1 INTRODUCTION
Evaluating the Influence of R3 Treatments on Fishing License Sales in Pennsylvania
 Evaluating the Influence of R3 Treatments on Fishing License Sales in Pennsylvania Prepared for the: Pennsylvania Fish and Boat Commission Produced by: PO Box 6435 Fernandina Beach, FL 32035 Tel (904)
4/27/2016. Introduction
 EVALUATING THE SAFETY EFFECTS OF INTERSECTION SAFETY DEVICES AND MOBILE PHOTO ENFORCEMENT AT THE CITY OF EDMONTON Karim El Basyouny PhD., Laura Contini M.Sc. & Ran Li, M.Sc. City of Edmonton Office of
SAFETY EVALUATION OF AN UNCONTROLLED
 SAFETY EVALUATION OF AN UNCONTROLLED INTERSECTION USING SURROGATE SAFETY MEASURES By S. Shekhar Babu Research scholar (Ext) IITB Asso Prof CME Pune Prof. P. Vedagiri Asst Prof Dept of civil Engg IIT Bombay
Effects of Automated Speed Enforcement in Montgomery County, Maryland, on Vehicle Speeds, Public Opinion, and Crashes
 Effects of Automated Speed Enforcement in Montgomery County, Maryland, on Vehicle Speeds, Public Opinion, and Crashes August 2015 Wen Hu Insurance Institute for Highway Safety Anne T. McCartt Insurance
CTDOT Pedestrian and Bicycle Safety Initiatives
 CTDOT Pedestrian and Bicycle Safety Initiatives 2017 Northeast Transportation Safety Conference Mark F. Carlino, P.E. Traffic Engineering Division Chief Bureau of Engineering and Construction Connecticut
Statewide Access Management Coordination GoToWebinar
 Statewide Access Management Coordination GoToWebinar Promoting innovative, efficient, and exceptional work since 1988 April 26, 2017 ( 2:30 EST, 1:30 CST) Answers to Common Questions Yes we will provide
The specific activities consisted of:
 Mount Olive Development Corporation (MODCO) Speak Up Broward Program for Empowering People Dates of program: May 2014 August 2014 Communities Served: 33311, 33313, and 33301 Zip Code Areas Target Audience:
PEDESTRIAN CROSSING STATISTICS
 PEDESTRIAN SAFETY UTILIZATION OF RRFB AND HYBRID BEACONS WILLIAM (BILL) MARSHALL PEDESTRIAN CROSSING STATISTICS STUDIES INDICATE CROSSWALK COMPLIANCE IS FROM 4% 30% HAWAII REPORTED 50 NON YIELDS TO PEDESTRIANS
Pedestrian Safety Guide for Transit Agencies
 Pedestrian Safety Guide for Transit Agencies FDOT/FTPA/CUTR Professional Development Workshop June 15, 2010 1 Purpose Presentation Overview Bus Stop Location and Design Process/Partnership 2 Purpose Every
Cabrillo College Transportation Study
 Cabrillo College Transportation Study Planning and Research Office Terrence Willett, Research Analyst, Principle Author Jing Luan, Director of Planning and Research Judy Cassada, Research Specialist Shirley
Bicycle Helmet Use Among Winnipeg Cyclists January 2012
 Bicycle Helmet Use Among Winnipeg Cyclists January 2012 By: IMPACT, the injury prevention program Winnipeg Regional Health Authority 2 nd Floor, 490 Hargrave Street Winnipeg, Manitoba, R3A 0X7 TEL: 204-940-8300
Title of the proposed project Development of a Toolbox for Evaluation and Identification of Urban Road Safety Improvement Measures
 Centre of Excellence (CoE) in Urban Transport Department of Civil Engineering, IIT Madras Title of the proposed project Development of a Toolbox for Evaluation and Identification of Urban Road Safety Improvement
EXECUTIVE SUMMARY March 2013
 EXECUTIVE SUMMARY March 2013 An Application of Safe System Approach to Intersections in the Capital Region Progress Report Introduction The Capital Region Intersection Partnership (CRISP) was founded in