Final Report Presented by:
|
|
|
- Rosamund Greene
- 6 years ago
- Views:
Transcription


1 STREET SMART BOONTON Final Report Presented by:
2 Acknowledgments TransOptions would like to thank the following for a successful Street Smart pedestrian safety campaign in Boonton: The Boonton Police Department The Town of Boonton Boonton Main Street The Boonton Holmes Library Boonton School District John Hill School Boonton High School Local media and news outlets North Jersey Transportation Planning Authority (NJTPA) New Jersey Division of Highway Traffic Safety (NJDHTS) A special thanks to the residents and businesses of Boonton, New Jersey for their participation in Street Smart Boonton Page 1
3 TABLE OF CONTENTS STREET SMART OVERVIEW... 3 TRANSOPTIONS STREET SMART PROGRAM... 3 BOONTON, MORRIS COUNTY, NEW JERSEY... 4 BOONTON STREET SMART CAMPAIGN STRUCTURE... 4 FUNDING... 5 CAMPAIGN SCHEDULE... 5 CAMPAIGN EVALUATION... 6 INTERSECTION OBSERVATIONS... 6 Intersection Overview... 6 Observation Setup... 7 Intersection Observation Results... 7 PRE- & POST-CAMPAIGN SURVEYS Behaviors Safety and Campaign Awareness Participant Profile SPEED SENTRY LOAN PROGRAM Compliance CAMPAIGN KICKOFF ENFORCEMENT COPS IN THE CROSSWALK DECOY PROGRAM INFRASTRUCTURE IMPROVEMENTS MEDIA COVERAGE COMMUNITY PROMOTION EDUCATION MATERIALS MATERIAL QUANTITIES RESULTS RECOMMENDATIONS CONCLUSION Page 2
4 Street Smart Boonton Executive Summary The Street Smart NJ pedestrian safety campaign was a focused effort in Boonton, New Jersey in October The campaign was a collaborative effort among TransOptions, the Boonton Police Department, the Town of Boonton, and local businesses and organizations. As an education and enforcement campaign, Street Smart Boonton included 162 hours of pedestrian safety law enforcement by the Boonton Police Department as well as multiple educational outreach events coordinated by TransOptions. The program was evaluated through pre- and post- campaign surveys as well as pre- and post- campaign intersection observations. The evaluations showed that the Street Smart campaign in Boonton resulted in an increased awareness in the public s understanding of New Jersey s pedestrian safety laws as well as an increased awareness of the campaign s presence in the community. Street Smart also successfully changed behaviors. Analysis of the pre- and post-campaign observations showed a 39 percent reduction in pedestrians crossing midblock (jaywalking) and an 11 percent reduction in pedestrians crossing against the traffic signal. Boonton s Street Smart campaign also resulted in a 56 percent increase in public awareness of the Boonton Police Department s enforcement efforts of pedestrian safety laws, a 50 percent increase in the community s awareness of pedestrian safety-related advertising messages, and a 63 percent increase in awareness of the Street Smart campaign s presence in Boonton during the month of October Street Smart Overview Street Smart NJ is a public education, awareness and behavioral change campaign developed by the North Jersey Transportation Planning Authority (NJTPA) and funded through the Highway Safety Improvement Program (HSIP) and Highway Traffic Safety (HTS) Federal Highway Safety Grant 2018 administered by the New Jersey Division of Highway Traffic Safety (NJDHTS). The campaign is a collaborative effort among public, private and non-profit organizations. The NJTPA, along with the Federal Highway Administration (FHWA), the New Jersey Department of Transportation (NJDOT), NJ Transit, NJDHTS, and the Transportation Management Associations (TMAs) worked with numerous community partners to develop and pilot the Street Smart NJ program. Street Smart NJ was developed in response to New Jersey s designation by FHWA as a pedestrian focus state and Newark as a focus city due to a high incidence of pedestrian injuries and fatalities. In 2015, New Jersey was ranked 15th in the nation in pedestrian fatalities, according to the Governor s Highway Safety Association. From 2011 through 2015, 765 pedestrians were killed on New Jersey s roads and more than 17,000 were injured, according to the National Highway Traffic Safety Administration. This translates into one death every 2.4 days and 11 injuries daily. Street Smart NJ has three main goals: Change pedestrian and motorist behaviors to reduce the incidence of pedestrian injuries and fatalities in New Jersey. Educate motorists and pedestrians both about their roles and responsibilities for safely sharing the road. Increase enforcement of pedestrian safety laws and roadway users awareness of that effort. Page 3


5 The Street Smart NJ program was piloted in five communities in New Jersey in 2013 and The pilot programs were conducted in Newark, Jersey City, Woodbridge, Hackettstown, and Long Beach Island. These five communities were selected in order to incorporate the state s diverse landscape of urban, suburban, rural, and shore regions. Since the pilot programs, Street Smart has grown significantly and has been active in more than 60 municipalities throughout the state of New Jersey. TransOptions Street Smart Program After the conclusion of the first five pilot programs, the NJTPA s goal was to continue bringing attention to the issue of pedestrian safety statewide through the Street Smart initiative. With the success of the pilot programs, the NJTPA invited the regional Transportation Management Associations (TMAs) to conduct Street Smart NJ campaigns within their designated service areas to expand the program s reach throughout the state. TRANSOPTIONS SERVICE AREA As the TMA for northwestern New Jersey, TransOptions delivers pedestrian safety programs along with other transportation resources to the counties of Morris, Sussex, Warren as well suburban areas of Union, Essex, and Passaic. TransOptions selected Boonton as one of three municipalities to conduct a Street Smart pedestrian safety program in the fiscal year from July 1, 2017 June 30, Boonton, Morris County, New Jersey Boonton is located in Morris County, covering approximately square miles with a population of 8,347, according to the 2010 U.S. Census. Boonton is home to a busy downtown with stores and restaurants, an active Lakeland bus route and a train station on NJ Transit s Montclair & Boonton line, both providing access to New York City and other towns in northern New Jersey. TransOptions used the Numetric, NJDHTS Crash Analysis Tool hosted through Rutgers University s Center for Advanced Infrastructure and Transportation to examine crash data in Boonton. The Numetric program uses police reports to compile crash data from all over the state of New Jersey. From January 2013 to December 2015, there were 16 pedestrian-related crashes involving 18 pedestrians in Boonton. All 16 crashes resulted in pedestrians being injured ranging from pain to an incapacitating injury and there was one pedestrian fatality. Crash Severity Fatal Incapacitating Injury Moderate Injury Pain Page 4
6 The following chart lists the crash characteristics that were most common in Boonton. Crash Characteristics Street Smart Boonton Characteristic Crash Count % of total crashes (out of 16) Driver making a left turn 8 50% Failed to Yield Right of Way to Vehicle/Pedestrian 6 38% Distracted Driving Involved 5 31% Older Driver Involved 3 19% Boonton Street Smart Campaign Structure The Boonton Street Smart campaign was a collaborative effort among TransOptions, the Boonton Police Department, officials from the Town of Boonton, Boonton Main Street (a nonprofit downtown development organization) and local businesses. TransOptions worked closely with Boonton s police department and town officials in planning the program and selecting target areas for education and enforcement operations in the community. The Street Smart campaign in Boonton was modeled closely after the pilot programs implemented by the NJTPA in Newark, Jersey City, Woodbridge, Hackettstown, and Long Beach Island and the previous campaigns coordinated by TransOptions in Newton, Washington (Warren County), Morristown, Dover, and Summit. FUNDING The Boonton Police Department secured funding for overtime enforcement through a Federal Highway Safety Grant awarded by the New Jersey Division of Highway Traffic Safety (NJDHTS). Boonton was awarded the funding for the 2018 fiscal year starting on October 1, From there, TransOptions provided a suggested timeline for education, enforcement, and evaluation activities and the Boonton Police Department developed a schedule and strategy for their officers. The NJDHTS funding allowed the police department to cover the cost of overtime hours for officers participating in the Street Smart enforcement initiatives as well as the purchase of campaign materials. CAMPAIGN SCHEDULE Boonton s Street Smart campaign lasted approximately eight weeks with education and enforcement activities concentrated during the month of October. TransOptions Speed Sentry Loan Program was also implemented during the month of October to collect speed data from drivers in an area of concern in the community. The campaign consisted of pre- and post- campaign components such as pre-/post- campaign surveys and intersection observations. These activities were done both before and after the campaign to gauge the impact the Street Smart program made on the community. Street Smart Boonton Campaign Timetable Pre-Campaign: (Surveys and Observations) September 18 th to October 1, 2017 Education & Enforcement: October 2017 Speed Sentry Loan: October 5, 2017 November 2, 2017 Post-Campaign: (Surveys and Observations) November 1, 2017 November 16, 2017 Page 5

7 Campaign Evaluation TransOptions used a variety of methods to evaluate the impact of the Street Smart campaign on public awareness and behavior. Pre- and post-campaign intersection observations conducted by TransOptions staff recorded actual driver and pedestrian behavior. A pre- and post-campaign survey captured awareness of campaign messages and driving and walking behavior, as reported by respondents. Meanwhile, The Speed Sentry Loan Program device recorded driver speeds during the campaign period. While not statistically significant, these quantitative measures provide an indication of the short-term impact of the Street Smart campaign. INTERSECTION OBSERVATIONS Intersection observations were performed immediately before and after the Street Smart campaign in Boonton in order to observe changes in walking and driving behavior. To control variables, intersection observations were kept consistent and performed on Thursdays from 8:30 a.m. to 11:10 a.m. The intersection observation sessions were intended to be from 8:30 a.m. to 11:30 a.m. but due to a camera malfunction in the pre-campaign observation, both observations session were two hours and ten minutes in order to achieve a consistent sample of time. Pre-Campaign Observation: Thursday, September 21, 2017, 8:30 a.m. to 11:10 a.m. Post-Campaign Observation: Thursday, November 2, 2017, 8:30 a.m. to 11:10 a.m. Intersection Overview The intersection of Main Street (CR-624) and Boonton Avenue (CR-511) was selected as the observation intersection site. Crash data from the Numetric Crash Analysis Tool shows that there were three crashes involving pedestrians at this intersection from 2013 to The Town of Boonton and the Boonton Police Department recommended this intersection because of its history of pedestrian-driver conflicts with several nearmisses. The intersection of Main Street and Boonton Avenue is located in the center of downtown and is surrounded by businesses which brings high pedestrian foot traffic to the intersection. A karate studio, a bar, parking lots, and several small businesses surround the intersection. The observation site is a signalized, three-leg T- intersection with crosswalks connecting all three corners. Both drivers and pedestrians have to obey traffic signals at this intersection. Page 6
, pedestrians using cellphone while using jaywalking Pink crosswalk, pedestrians using")
8 On Observation Setup Street Smart Boonton Camera # Camera #1 Camera #2 Camera #3 Camera #4 Pre- and Post- Campaign Observation Setup Observation Yellow crosswalk, jaywalking on Boonton Avenue, pedestrians using cellphone while using crosswalk or jaywalking Jaywalking ONLY on Main Street (westbound), pedestrians using cellphone while using jaywalking Pink crosswalk, pedestrians using cellphone while using crosswalk Purple crosswalk, jaywalking on Main Street (eastbound), pedestrians using cellphone while using crosswalk or jaywalking Intersection Observation Results The behaviors of pedestrians and drivers were tallied in person by TransOptions staff on the day of the observations and the video footage was later reviewed to get a more accurate count and reduce human error. During the pre-campaign observation on September 21, 2017, 71 pedestrians used the crosswalks at the intersection. On November 2, 2017, 40 pedestrians used the crosswalks at the intersection during the post-campaign observation. Three pedestrians used cellphones while crossing the street in the pre-campaign observation and four were observed using cellphones while crossing in the post-campaign observation. Due to the low sample size of pedestrian cellphone use, the data was omitted from analysis. There were also very few instances of drivers turning while a pedestrian was using the crosswalk. Therefore data for turning drivers was also omitted from analysis due to low sample size. Page 7
9 I-1 Pre-Campaign Not Compliant Post-Campaign Not Compliant % Reduction Pedestrians crossing mid-block % Mid-block crossing/jaywalking was only marked as a non-compliant behavior. Pedestrians that crossed outside of the crosswalk on Main Street and on Boonton Avenue were counted as not compliant as long as the action was captured by the cameras. A 39 percent reduction was observed in jaywalking behavior from pre-campaign to post-campaign. I-2 Compliant Pre-Campaign Not Compliant % Non- Compliant Compliant Post-Campaign Not Compliant % Non- Compliant % Reduction Pedestrians crossing against the traffic signal % % 11% After the intersection was re-observed in the post-campaign, there was an 11 percent reduction in drivers who did not stop for pedestrians using the crosswalk at the intersection of Main Street and Boonton Avenue. Page 8


10 Mid-block crossing / Jaywalking Street Smart Boonton Page 9


11 Distracted Pedestrians Page 10


12 Pedestrians crossing with the traffic signal Street Smart Boonton Non-Compliant Crossing Compliant Crossing Page 11


13 Drivers yielding to pedestrians when turning Non-Compliant Turning Compliant Turning Page 12

14 PRE- & POST-CAMPAIGN SURVEYS Street Smart Boonton Both before and after the Street Smart campaign in Boonton, people from the community were asked to complete a survey to measure the effectiveness of the campaign. The survey was available online only in both English and Spanish and used the same questions from NJTPA s Street Smart campaigns. TransOptions provided a supply of flyers promoting the online campaign survey to Boonton s Town Hall, the Boonton Holmes Library, and Boonton Main Street. The Town of Boonton, the Boonton Police Department, the Mayor of Boonton, and TransOptions also heavily utilized online resources to promote the pre-campaign and post-campaign surveys. Online messages were posted on websites, social media accounts, and through the police department s Nixle notification system, which delivers text messages and s to Boonton residents. For the post-campaign survey, participants from the precampaign survey were contacted directly with a request to take the survey a second time as part of an ongoing safety study in Boonton. Upon completing the questionnaire, the respondents had the option to enter into a raffle to win a $100 Visa gift card. A winner was selected from both the pre- and post-campaign survey groups. The survey was created using SurveyMonkey and consisted of 23 questions that asked respondents to report their walking and driving behaviors and what they observed others doing on the road. The survey included questions on the respondents knowledge of New Jersey s pedestrian safety laws and awareness of the Street Smart campaign in Boonton. Demographic information was also captured in the survey. The pre- and post-campaign responses were then compared to determine the effectiveness of the Street Smart program in Boonton. Behaviors The data displayed in this section shows the percentage of respondents that answered Yes to the questions regarding their own behaviors or behaviors they observe others doing when walking and driving in Boonton. Respondents had the option of answering Yes or No to the following questions. The data below compares the pre-campaign survey to the post-campaign survey. There were 310 people who completed the precampaign survey and 283 respondents participated in the post-campaign survey. No participants completed the survey in Spanish. *Percentages may not total 100% due to rounding *Some questions had respondents answering yes or no to multiple categories. Page 13
15 In the past week, have you seen OTHERS (please report the behaviors of other people, not yourself)... Pre-Campaign Post-Campaign 94% 91% 65% 70% 71% 71% 81% 79% 63% 61% 78% 77% 52% 50% 31% 33% People who crossed the street against the "walk" signal? People who crossed in the middle of a block (jaywalking)? People using a hand-held cellphone while walking or crossing the street? Drivers not stopping for pedestrians in the crosswalk? Drivers not stopping/yielding for pedestrians when making a left or right turn? Drivers speeding in areas with a lot of people walking? Drivers running red lights or stop signs? Drivers using a hand-held cellphone while driving? There were minimal differences from the pre-campaign survey to the post-campaign survey when respondents were asked to report their views on the behaviors of others. Respondents reported a 5 percent increase from the pre-campaign survey to the post-campaign survey in seeing others crossing against the walk signal when walking in Boonton. Respondents also indicated observing a 3 percent decrease in pedestrians jaywalking in town. Changes in the remaining six categories showed 1-2percent increases or decreases. The Street Smart campaign may have made survey respondents more aware of negative walking and driving behaviors in Boonton that they may not have noticed before the campaign came to the community. Page 14
16 Q-2: In the past week, have YOU (please report your own behaviors) Street Smart Boonton Pre-Campaign Post-Campaign 40% 33% 36% 29% 19% 15% 19% 15% 8% 8% 4% 3% 1% 1% 14% 10% Crossed the street against the "walk" signal? Crossed in the middle of a block (jaywalked)? Used a handheld phone while walking or crossing the street? Not stopped for pedestrians in the crosswalk when driving? Not stopped or yielded to a pedstrian when making a left or right turn? Driven at least Run a red light 10 MPH over or a stop sign? the speed limit? Used a handheld phone while driving? The survey showed decreases in self-reported negative behaviors from the pre-campaign survey to the post-campaign survey. Most notably, the post-campaign survey data shows a 7 percent decrease in respondents admitting to jaywalking and driving 10 mph over the speed limit. The post-campaign survey results also show 4 percent decreases in respondents who self-reported crossing against the walk signal, using a hand-held phone while walking or crossing the street, and using a hand-held phone while driving. Survey participants had a high awareness of others engaging in unsafe walking and driving behaviors but were less likely to report doing the behaviors themselves. For example, 77 percent of post-campaign survey respondents reported seeing other drivers using a handheld cellphone while driving but only 10 percent admitted to this behavior themselves. This result was consistent with the Street Smart pilot programs and other Street Smart campaigns conducted by TransOptions. Most often, the individual believes others are engaging in dangerous behavior when walking and driving and are not likely to report their own negative actions. Page 15
17 Q-3: At signalized intersections, when should you begin to cross the street? Pre-Campaign Post-Campaign 99% 99% 16% 15% 3% 4% When the word "Walk" or the walking person light is on? When the words "Don't Walk", or the red hand and/or countdown numbers are flashing? When the words "Don't Walk", or the red hand is on and not flashing? Respondents who completed the survey for Boonton already had a high understanding of correct crossing behaviors with 99 percent of respondents knowing to cross the street with the activated walk signal in both the pre- and post-campaign survey. However, some responded they were permitted to cross in a crosswalk when the Don t Walk or red hand is flashing and/or counting down. More education and enforcement is needed to correct this behavior and belief. *Some questions had respondents answering yes or no to multiple categories Safety and Campaign Awareness Q-4: In the past 30 days, have you read, seen or heard any advertising messages addressing the following Pre-Campaign Post-Campaign 76% 77% 55% 57% 55% 47% 47% 56% 35% 27% 25% 12% Speeding/aggressive driving? Drunk driving? Seat belts? Distracted driving? Pedestrian safety? Bicycle safety? Respondents were more aware of driving safety messages associated with the campaign such as speeding/aggressive driving and distracted driving. There was a 20 percent increase in the reported exposure to messages regarding both speeding/aggressive driving and in distracted driving messages. There was also a 50 percent increase in awareness of pedestrian safety advertising messages. Page 16
18 Q-5: In the past 30 days, have you read, seen or heard any advertising message or signage that mentions Street Smart and/or talks about pedestrian safety? Pre-Campaign 10% Yes No 90% Post-Campaign 27% Yes No 73% Results show a 63 percent increase in the respondents exposure to pedestrian safety messages and the Street Smart name. In the pre-campaign, 10 percent of respondents said that they were already aware of the Street Smart brand. This may indicate that the Street Smart message is becoming more widespread throughout the state of New Jersey and survey participants may have noticed the messaging in other towns. Page 17


19 Q-6: In the past 30 days, have you read or heard any messages similar to the following Use Crosswalks - 61% increase Pre-Campaign 8% Post-Campaign 69% Wait for the Walk - 54% increase Pre-Campaign 3% Post-Campaign 57% Stop for Pedestrians - 56% increase Pre-Campaign 10% Post-Campaign 66% Page 18


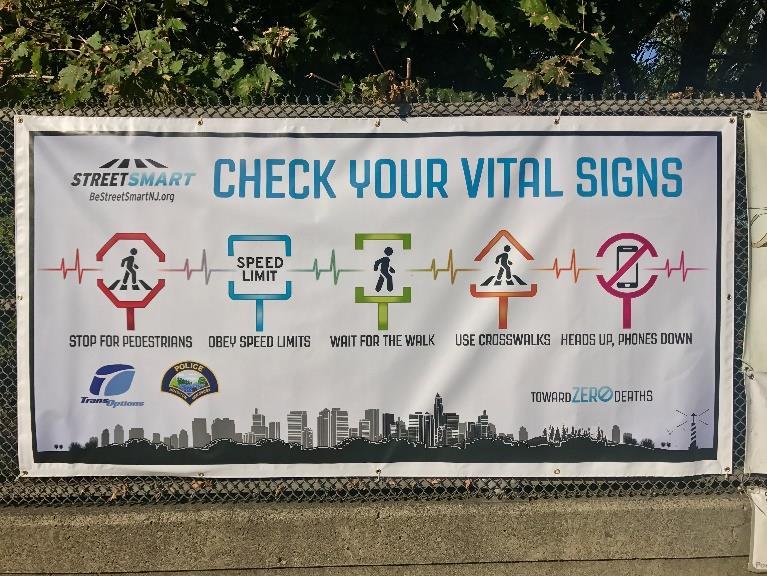
20 Obey Speed Limits - 45% increase Street Smart Boonton Pre-Campaign 6% Post-Campaign 51% Heads Up, Phone Down - 38% increase Pre-Campaign 11% Post-Campaign 49% Results showed an increase in recognition of all five vital sign messages with Use Crosswalks being the most recognized message. Each individual vital sign message was displayed on street signs throughout Boonton for the duration of the campaign. Page 19
21 Q-7: Where have you seen or heard these messages (check all that apply) Respondents were asked to report where they had seen the images from the previous question. 0% 10% 20% 30% 40% 50% 60% 70% 80% 90% I have not seen any of the images in Question 6 25% 79% Radio Television Print news source 5% 6% 5% 7% 2% 12% Online news source On posters or street signs you have seen while driving or walking Signs on buses On coasters Tent cards at restaurants Pamphlet/Tip Cards 3% 8% 3% 3% 0% 0% 0% 3% 0% 4% 16% 65% Banners 2% 11% Social media 4% 19% Pre-Campaign Post-Campaign The results from the post-campaign survey showed that 25 percent of respondents reported that they had not been exposed to any Street Smart messages when compared to the pre-campaign survey where 79 percent had not seen the images associated with the campaign, a 54 percent decrease from pre-campaign survey to the post-campaign survey. 16 percent of pre-campaign survey participants indicated that they had seen street signs and posters before the campaign. This increased by 49 percent in the post-campaign survey where a total of 65 percent of survey participants indicated that they had seen Street Smart messaging displayed on street signs and posters in the community. Social media also played an important role in raising awareness with a 15 percent increase in social media messages being viewed by participants. Page 20
22 Q-8: To the best of your knowledge, can you receive a ticket in New Jersey for Pre-Campaign Post-Campaign 92% 90% 94% 97% 99% 99% 89% 95% 67% 70% 21% 29% Crossing the street in the middle of the block (jaywalking)? Crossing the street against a pedestrian signal? Using a mobile device while crossing the street? Not stopping for pedestrians in a crosswalk? Using a mobile device while driving? Not yielding to pedestrians when turning? The survey showed increased knowledge of New Jersey s pedestrian safety laws. The post-survey showed a 3 percent improvement in the participants knowing they can receive a ticket for crossing against the pedestrian signal and a 3 percent improvement in receiving a ticket for not stopping for a pedestrian in the crosswalk. Post-campaign survey results also show a 6 percent increase in respondents knowing that they can be cited for not yielding to a pedestrian when turning. There was also an 8 percent increase in respondents believing it is illegal to use a hand-held phone while crossing the street. Although pedestrian cellphone use is not yet illegal in the state of New Jersey, the data in Boonton s post-campaign survey shows that people of the community recognize it is a dangerous behavior. This result has been consistent across communities that participated in a Street Smart campaign with TransOptions. Page 21
23 Q-9: Have you recently read, seen or heard about police efforts to enforce pedestrian safety laws? Pre-Campaign 28% Yes No 72% Post-Campaign 16% Yes No 84% Results show a 56 percent increase in the respondents awareness of the pedestrian safety enforcement efforts made by the Boonton Police Department. Page 22
24 4% Q-10: How strictly do you think police in your area enforce pedestrian safety laws, such as jaywalking or crossing against the signal? 9% Pre-Campaign 13% 26% 43% 39% Post-Campaign 31% 15% 13% 8% The community viewed the Boonton Police Department s enforcement of pedestrian safety laws relating to walking activities as more strict after the campaign. Results from the postcampaign survey show a 5 percent increase in respondents believing the police department was very strict and a 13 percent increase in respondents believing the police department was somewhat strict in enforcing pedestrianrelated laws such as jaywalking and crossing against the signal. There was also a 16 percent decrease from the precampaign survey to the post-campaign survey in respondents believing the police department was not at all strict in enforcing these laws. Very strictly Somewhat strictly Not very strictly Not at all Don t know/rather not say Q-11: How strictly do you think police in your area enforce driver-related pedestrian safety laws, such as speeding or stopping for pedestrians in crosswalks? 8% 17% Very strictly Pre-Campaign 38% 33% 33% 31% Somewhat strictly Not very strictly Post-Campaign 14% 11% 7% 7% Not at all Don t know/rather not say The community also viewed the Boonton Police Department s enforcement of pedestrian safety laws relating to driving activities as more strict after the campaign. Results from the postcampaign survey show a 9 percent increase in respondents believing the police department was very strict and a 5 percent increase in respondents believing the police department was somewhat strict in enforcing pedestrianrelated laws such as speeding and not stopping for pedestrians in the crosswalk. There was also a 7 percent decrease from the pre-campaign survey to the postcampaign survey in respondents believing the police department was not at all strict in enforcing these laws. Page 23
25 Respondents rated the following as a very serious problem in the community Q-12: Using a scale where 1 is very serious and 5 is not at all serious, how would you rate the following in terms of how serious a problem it is in your community? Distracted driving (e.g., texting or talking on the phone while driving) 55% Pedestrians disobeying traffic rules (crossing in the middle of a street or against the light) 28% Drivers not stopping for pedestrian in crosswalks 49% Speeding 43% Bicyclists not following traffic laws 30% The responses from the pre-campaign survey and the post-campaign survey were combined to create the graph above. The graph represents what the respondents viewed as a very serious problem in the community. After the conclusion of the Street Smart campaign in Boonton, respondents overall felt that distracted driving was the most serious problem in their community followed by drivers not stopping for pedestrians in the crosswalk. Page 24
26 Participant Profile Street Smart Boonton The participant profile data in the section below was compiled from the results from both the precampaign survey and the post-campaign survey. Q-13: What mode/modes of transportation do you use on a weekly basis (check all that apply)? Drive alone 99% NJTRANSIT Train PATH Subway Hudson Bergen Light Rail Newark Light Rail Bus 3% 1% 0% 0% 4% Walk 49% Ferry Bicycle Carpool Rather not say 0% 5% 9% 0% 99 percent of respondents indicated that they drive alone and 49 percent walk on a weekly basis. These results are typical to suburban areas of New Jersey, such as Boonton. Street Smart s messages aimed to address both driver and pedestrian populations to reduce crashes in Boonton. Q-14: Do you currently live in Boonton, NJ? Q-15: Do you work, go to school, or regularly frequent Boonton, NJ? TransOptions only surveyed respondents who either live in Boonton or regularly visit the town for work, school, or other reasons. The next questions asked if the respondents lived in Boonton followed by a third question asking if they work, go to school or regularly frequent Boonton. If no was selected as a response for both questions, the participant was disqualified. 83 percent of the respondents who participated in the pre- and post-campaign surveys identified themselves as residents of Boonton. The very first question of the pre- and post- intercept surveys asked respondents to report if they were older than 18 years of age. If the respondent answered no they were immediately disqualified. 83% 17% Page 25
27 Q-16: Participant Gender Rather not say, 2% Male, 32% Female, 67% Q-17: Participant Age % % % % % 65 or over 10% Rather not say 1% Page 26


28 SPEED SENTRY LOAN PROGRAM TransOptions utilized the existing Speed Sentry Loan Program to encouraged drives to reduce their speed when traveling towards Boonton s downtown area where there is a steady flow of pedestrian activity. With this program, TransOptions loans the speed sentry device to municipalities within its service area. The radar sign digitally displays the speed of oncoming vehicles as they approach the sign. Data is collected on a webbased cloud server developed by All Traffic Solutions, which is monitored and accessed at the office of TransOptions. Street Smart Boonton TRANSOPTIONS SPEED SENTRY The speed sentry device was displayed in Boonton in October during the campaign s education and enforcement activities. The Town of Boonton and the Boonton Police Department recommended the location for the speed sentry due to their familiarity with areas of concern in town. The area was chosen because of its close proximity to downtown Boonton and the tendency for drivers to gain speed as they head downhill and enter the downtown area where high pedestrian foot traffic exists. The speed sentry device was mounted on a 25 MPH speed limit sign on Main Street / County Route 624 between Liberty Street and Highland Avenue. The sign recorded the speeds of drivers heading west and downhill towards Boonton s downtown. The area immediately surrounding the sign had a few businesses and was adjacent to the Canal Side Park. Boonton s downtown area begins approximately 650 feet downhill from the speed sentry s placement with several stores, offices, restaurants that bring high pedestrian activity to the area. The goal of placing the speed sentry sign in this area was to calm speeds as drivers head into a busy downtown area. Compliance The speed sentry categorized each vehicle that passed the sign as compliant, low risk, medium risk, and high risk : Violators that exceeded the speed limit by less than 5 mph are considered low risk Violators exceeding speed limits by more than 5 mph but under 10 mph are medium risk Violators exceeding speed limits by more than 10 mph are high risk Page 27
29 S-1: Comparing all data collected by the Speed Sentry sign in Boonton from 10/5/17 11/2/17 Date Range Total Days in Range Total # of Drivers Compliant Driver Speed < 25 MPH Low Risk Driver Speed > 25 MPH; Driver Speed < 30 MPH Medium Risk Driver Speed > 30 MPH; Driver Speed < 35 MPH High Risk Driver Speed > 35 MPH 10/5/17-10/7/17 2 9,893 Drivers 34.5% 45.7% 17.3% 2.5% 10/8/17-10/14/17: (Full Week I) 7 10/15/17-10/21/17: ( Full Week II) 7 10/22/17-10/28/17: (Full Week III) 7 21,400 Drivers 29.6% 44.9% 21.1% 4.4% 20,815 Drivers 44.7% 37.2% 14.9% 3.2% 25,029 Drivers 31.9% 45.8% 19.2% 3.1% 10/29/17-11/2/ ,843 Drivers 37.9% 41.1% 17.7% 3.3% TOTAL TOTAL # OF AVERAGE % AVERAGE % AVERAGE % AVERAGE % DAYS DRIVERS COMPLIANT LOW RISK MEDIUM RISK HIGH RISK TOTALS 90, % 42.9% 18.3% 3.3% Drivers During the speed evaluation, a total of 90,980 vehicles were detected by the speed sentry sign. Large differences in the total number of drivers passing the sign can be observed in the two incomplete weeks at both the beginning and end of the campaign (10/5/17-10/7/17 and 10/29/17-11/2/17). Due to the difference in sample sizes from the two incomplete weeks, TransOptions decided to compare the three Full Weeks for an accurate analysis of speed data in Boonton. Full Week I, II, and III each consist of seven days (Sunday to Saturday) and had similar sample sizes of drivers. Date Range S-2: Comparing Compliant, Low Risk, Medium Risk, and High Risk Full Weeks Only *(Full week is defined by a complete 7 day week, Sunday to Saturday) Total Days in Range 10/8/17-10/14/17: (Full Week I) 7 10/15/17-10/21/17: ( Full Week II) 7 10/22/17-10/28/17: (Full Week III) 7 TOTALS TOTAL DAYS 21 (3 full weeks) Total # of Drivers Compliant Driver Speed < 25 MPH Low Risk Driver Speed > 25 MPH; Driver Speed < 30 MPH Medium Risk Driver Speed > 30 MPH; Driver Speed < 35 MPH High Risk Driver Speed > 35 MPH 21,400 Drivers 29.6% 44.9% 21.1% 4.4% 20,815 Drivers 44.7% 37.2% 14.9% 3.2% 25,029 Drivers 31.9% 45.8% 19.2% 3.1% TOTAL # AVERAGE % AVERAGE % AVERAGE % AVERAGE % OF COMPLIANT LOW RISK MEDIUM RISK HIGH RISK DRIVERS 67,244 Drivers 35.4% 42.6% 18.4% 3.6% Positive changes in speed resulted when comparing the number of drivers who traveled by the speed sentry sign posted in Boonton only during the three full weeks. By comparing the three full weeks only, we are able to compare similar sample sizes. A notable reduction in vehicle speed was recorded by the speed sentry device from Full Week I to Full Week II. Compliant speeds increased by 15.1 percent, low Page 28


30 risk speeds decreased by 7.7 percent, Medium Risk Speeds by 6.2percent over a two-week time span. This suggests that drivers recognized the speed sentry sign, causing them to slow their speeds as they travel through the area. Speeds returned to Full Week I levels in Full Week III, suggesting that drivers became accustomed to the sign. Campaign Kickoff Boonton s Street Smart campaign was formally launched at a press conference at Boonton s Town Hall on Tuesday, October 3, The speakers at the press conference included TransOptions President John F. Ciaffone, Captain Stephen Jones of the Boonton Police Department, Boonton Mayor Matthew DiLauri, Police Commissioner and Alderman Bobby Tullock, Morris County Freeholder Kathryn DiFillippo and NJTPA Senior Planner of Safety William Yarzab. Each speaker highlighted the importance of pedestrian safety for not only Boonton, but for the entire State of New Jersey. The event was attended by representatives from Boonton and covered by News 12 and WMBC-TV. The Daily Record also featured an article about the press conference and pedestrian safety in Boonton. Campaign materials, such as posters and tip cards, were made available to the community and business members who attended the press conference to assist in promoting the campaign. Page 29


31 Enforcement The Boonton Police Department dedicated 162 enforcement hours to the Street Smart campaign. Overtime enforcement hours were funded through the HTS Federal Highway Safety Grant 2018 from the New Jersey Division of Highway Traffic Safety. Officers conducted roving patrols and the Cops in the Crosswalk Decoy program throughout the town during the October campaign. Enforcement of pedestrian safety laws was increased throughout Boonton with additional emphasis along Main Street s business district. These areas were selected by the Boonton Police Department due to the high volume of pedestrian traffic in the area. During the first week of October s enforcement period, the police department s activity focused on educating pedestrians and drivers by issuing warnings instead of citations. After the one-week educational period, officers issued summonses for violations against the state s pedestrian safety laws. A total of 176 warnings and 76 summonses were issued during Boonton s Street Smart campaign including: Warnings Tickets Cellphone Violation Failed to Yield to Pedestrian Jaywalking 16 0 Speeding 3 1 Disregard of traffic signal/red light 7 2 The Boonton Police Department stated that they consider pedestrian safety a top priority and are proud to have received funding for pedestrian education and enforcement. They plan to continue working to secure funding to bolster their efforts in keeping roadways safe for pedestrians and motorists alike. Page 30


32 COPS IN THE CROSSWALK DECOY PROGRAM The Boonton Police Department had prior training and experience in the Cops in the Crosswalk Decoy Program. With this program, officers dress in plain clothes and cross the street in a crosswalk. If an approaching driver does not stop for the decoy officer in the crosswalk, a waiting officer in a marked police car follows the driver, pulls them over, and gives them a ticket for failing to stop for the pedestrian in the crosswalk. Boonton Police Department selected the intersection of Main Street and Church Street to conduct the decoy program. The Boonton Police Department held two press events to cover the decoy program in town and was covered by the Daily Record, News 12 and NBC 4 New York. This helped gain further recognition of the Street Smart campaign and Boonton s enforcement efforts and concern for pedestrian safety throughout the region. Street Smart Boonton Page 31


33 Infrastructure Improvements Infrastructure improvements were made to the intersection of Main Street and Boonton Avenue (the observation intersection) during the campaign including restriping, paving, and the addition of a new crosswalk. New crosswalk planned to be added to the intersection of Main Street and Plane Street Page 32


34 Media Coverage Boonton s Street Smart program received coverage in print, web, television and social media platforms from the following sources: USA Today WMBC TV The Daily Record NorthJersey.com NBC New York The Citizen of Morris County Street Smart Boonton Page 33


35 Community Promotion Promotion from recognizable resources in the community is important to spreading the Street Smart message. The Town of Boonton, the Boonton Police Department, Boonton Main Street, and TransOptions provided campaign announcements and updates on websites, newsletters, social media and Nixle. Towns participating in the Street Smart campaign are encouraged to use their current communication outlets to inform the public and raise awareness about the campaign. Street Smart messages were featured on the following online sources: The Town of Boonton s website The Town of Boonton s Facebook Page The Boonton Police Department s Facebook Page The Boonton Police Department s Nixle notification system The Mayor s Quarterly Newsletter The Mayor s Facebook Page Boonton Main Street s social media Boonton Main Street s Downtowner Newsletter TransOptions was also invited by Town of Boonton and Main Street Boonton to promote the Street Smart campaign at Boonton s First Friday event in October. This town event that takes place regularly on the first Friday of every month and features local businesses and activities for the community. TransOptions distributed campaign materials and provided pedestrian safety information to attendees of the event. Page 34


36 TransOptions used SnapChat to promote the Street Smart campaign in Boonton. A geofilter with the campaign s Heads Up, Phone s Down message was created and active from October 3 to October 11 in the area highlighted in blue on the map, which targeted Boonton s downtown area. 7.1 percent of SnapChat users used the Street Smart geofilter when it was available to them as an option. SnapChat uses swipes, uses, and views as metrics to measure a geofilter s success. Metrics: Street Smart Boonton SnapChat Filter 761 Swipes 51 Uses 382 Views How many times the geofilter was seen in snaps being created How many times the geofilter was sent to a friend or added to a Story How many times the geofilter was seen in a snap sent by a friend or in a Story Page 35


37 Education TransOptions specializes in safety education and outreach programs. As part of the Street Smart campaign, TransOptions brings its safety programs to communities actively involved in the campaign. The following education and outreach activities took place in Boonton during the month of October. Street Smart materials and safe walking and driving information was provided to two senior groups in Boonton TransOptions conducted their Ready to Walk and Roll program for the 1 st grade students at John Hill School in Boonton. Students participated in a classroom-based interactive program where they learn how to identify safe ways to get around a model town. TransOptions Traffic Safety Town program was brought to John Hill School in Boonton to educate fourth grade students on how to safely navigate the road as pedestrians, drivers, and bicyclists on a street scape laid out in the school gymnasium. Students were presented with Street Smart messaging and signage as part of the activity and TransOptions instructors explained that the campaign was a community effort by the town and the police department. TransOptions conducted Bike Driver s Ed to 6 th grade students at John Hill School. Students participate in this program in the gymnasium and the lesson focused on how to get around town safely on a bicycle, the importance of wearing a helmet, and the meanings of traffic signs. TransOptions presented the Street Smart program and the importance of pedestrians safety to 10 th grade students enrolled in driver s education. The presentation focused on how new drivers can be ready to drive safely around pedestrians and information on the active Street Smart campaign in Boonton. Information on Boonton s pedestrian crash data was presented as well as videos to demonstrate safe driving behaviors. Page 36


38 Materials Street Smart materials were purchased by the Boonton Police Department s grant through a Federal Highway Safety Grant administered by the New Jersey Division of Highway Traffic Safety. Campaign materials included tip cards, posters, banners, table tents, street signs, coasters and coffee sleeves. TransOptions and the Boonton Police Department s logos were added to most of the campaign materials. Using a variety of campaign materials was vital to increasing recognition and awareness of the campaign. The Town of Boonton displayed the Street Smart signs and banners throughout the town and TransOptions distributed tip cards, table tents, posters, coasters, and coffee sleeves to the local business along Main Street. Street Smart Boonton MATERIAL QUANTITIES TransOptions assisted the Boonton Police Department in designing and ordering materials for the Street Smart campaign. The following quantities were ordered for each item: 5,000 English tip cards 150 Spanish tip cards 50 street signs 125 posters 100 table tents signs 3 banners Page 37


39 Street Smart Boonton Tip Cards Page 38


40 Messages on campaign posters, street signs and banners Street Smart Boonton Messages on table tents Page 39


41 Page 40
42 Results Street Smart Boonton 1. GOAL: Change pedestrian and motorist behaviors to reduce the incidence of pedestrian injuries and fatalities in New Jersey. Intersection observations showed that there was a 39 percent reduction in mid-block crossing/jaywalking. (I-1) Intersection observations showed an 11 percent decrease in pedestrians crossing against the traffic signal at the intersection of Main Street and Boonton Avenue. (I-2) According to the results displayed in graph Q-2, survey respondents indicated that they observed decreases in negative behaviors when reporting on their own walking and driving behaviors. Decreases were reported in self-reported crossing against the walk signal, crossing mid-block, using a cellphone while crossing the street, speeding 10MPH over the speed limit, and using a cellphone will driving. Data collection from the speed sentry sign showed that drivers traveling at compliant speeds increased by 5.8 percent when comparing the three full weeks the sign was posted in Boonton, which accounts for the largest change over the four speed categories of compliant, low risk, medium risk, and high risk. The 5.8 percent increase in compliant speeds of drivers accounts for about 3,900 drivers that traveled on Main Street in the direction of Boonton s downtown area. (S-2) 2. GOAL: Educate motorists and pedestrians both about their roles and responsibilities for safely sharing the road. Several pedestrian and driving safety education programs and outreach activities directed at a range of age groups from 1 st graders to seniors occurred in Boonton during the Street Smart campaign. Boonton police officers used their enforcement interactions from the decoy program to educate people driving on safe travel behaviors with pedestrians. More participants were aware of advertising messages that directly relate to Street Smart s safety messages. There was a 50 percent increase in awareness of pedestrian safety messages, a 20 percent increase in awareness of speeding/aggressive driving, and a 20 percent increase in awareness of distracted driving advertisements. (Q-4) 63 percent more survey respondents had read, seen or heard advertising messages or signage that mentioned Street Smart and/or talked about pedestrian safety. (Q-5) There was an increase in recognition of all five vital sign messages. (Q-6) o Use Crosswalks: 61 percent increase o Wait for the Walk: 54 percent increase o Stop for Pedestrians: 56 percent increase o Obey Speed Limits: 45 percent increase o Heads Up, Phones Down: 39 percent increase 54 percent more respondents reported being exposed to the Street Smart messages on posters and signs. (Q-7) In the post-campaign survey, 3 percent more respondents knew they could receive a ticket for crossing the street against the traffic signal and 3 percent more respondents knew they could receive a ticket for not stopping for a pedestrian in the crosswalk, 6 percent more respondents knew they could receive a ticket for using a mobile phone while driving, and 6 percent more respondents knew they could receive a ticket for not yielding to a pedestrian when turning while driving. There was also an 8 percent increase in respondents believing they could receive a ticket for using a cellphone while crossing the street. (Q-8) Page 41
43 3. GOAL: Increase enforcement of pedestrian safety laws and roadway users awareness of that effort. Boonton Police dedicated 162 enforcement hours to the Street Smart campaign. A total of 176 warnings and 76 summonses were issued during Boonton s Street Smart campaign including: 56 percent of survey respondents were aware of increased enforcement efforts made by the Boonton Police Department. (Q-9) Results from the pre/post-campaign survey shows that 16 percent fewer respondents believed that the police were not very strict at all in their enforcement of pedestrian safety laws such as jaywalking and crossing against the traffic signal. The results also show a 5 percent increase in respondents believing the Boonton Police Department was very strict and a 13 percent increase in respondents believing the Boonton Police Department was somewhat strict in their enforcement of pedestrian safety laws. (Q-10). Results from the pre/post-campaign survey shows that 7 percent fewer respondents believed that the police were not very strict at all in their enforcement of pedestrian safety laws relating to drivers who speed and do not stop for pedestrians in the crosswalk. The results also show a 9 percent increase in respondents believing the Boonton Police Department was very strict and a 5 percent increase in respondents believing the Boonton Police Department was somewhat strict in their enforcement of drivers. (Q-11). Recommendations 55 percent of respondents felt distracted driving was the most serious problem in the community. Education initiatives and enforcement campaigns from the Boonton Police Department should focus on these safety issues. 49 percent of survey respondents felt that drivers not stopping for pedestrians in crosswalks was the second most serious issue in the community. The Boonton Police Department conducted several successful Cops in the Crosswalk Decoy Program sessions during the Street Smart campaign in Boonton. It is recommended that the Boonton Police Department regularly uses the decoy program to continue promoting positive driving behaviors in the community. Regular inspection and updates of crosswalks throughout the community is recommended. Conclusion Street Smart Boonton was a successful collaborative effort among TransOptions, the NJTPA, the Boonton Police Department, and representatives of the Town of Boonton. A reduction in the prevalence of noncompliant behaviors by both drivers and pedestrians was observed in the intersection observations and in the surveys. The campaign also resulted in a significant increase in awareness of the Street Smart message, enforcement efforts, and an emphasis on pedestrian safety throughout the community. The Boonton police department was also successful in receiving coverage from regional news outlets of their decoy program activities which increased the campaigns reach throughout the state. It is recommended that the Boonton Police Department and the Town of Boonton maintain their concern for pedestrian safety and enforce laws for both drivers and pedestrians. TransOptions education and outreach programs will continue to be available to the businesses, organizations, and schools of Boonton. Page 42
 267-7600 F: (973) 267-6209 www.transoptions.")
44 2 Ridgedale Avenue, Suite 200 Cedar Knolls, NJ P: (973) F: (973) Page 43
Street Smart Morristown
 Street Smart Morristown Year II Followup Executive Summary After the success of the 2016 Street Smart pedestrian safety campaign in Morristown, NJ, TransOptions, the Town of Morristown and the Morristown
TransOptions would like to thank the following for a successful Street Smart pedestrian safety campaign in Newton: Newton Police Department
 NEWTON Acknowledgments Street Smart Newton TransOptions would like to thank the following for a successful Street Smart pedestrian safety campaign in Newton: Newton Police Department The Town of Newton
Final Report Presented by:
 STREET SMART MORRISTOWN Final Report Presented by: Acknowledgments TransOptions would like to thank the following for a successful Street Smart pedestrian safety campaign in Morristown: The Town of Morristown
Evaluation of the Town of Clinton Street Smart Campaign
 Evaluation of the Town of Clinton Street Smart Campaign August 2016 Acknowledgements Special thanks to the following for their assistance: Town of Clinton Mayor and Council Chief Brett Matheis Town of
Evaluation of the Flemington Street Smart Campaign
 Evaluation of the Flemington Street Smart Campaign June 2016 Acknowledgements Special thanks to the following for their assistance: Chief George Becker Lt. Jerry Rotella Flemington Police Department Brooke
Evaluation of the Flemington Street Smart Campaign. April 2017 FINAL
 Evaluation of the Flemington Street Smart Campaign April 2017 FINAL Acknowledgements Special thanks to the following for their assistance: Police Chief Jerry Rotella Flemington Police Department Flemington
Crosswalk event overview (Saint Paul) How to organize a crosswalk event. 1. Choose a date, time and location
 How to organize a crosswalk event. 1. Choose a date, time and location") Crosswalk event overview (Saint Paul) A crosswalk event occurs when an individual or group of individuals promote pedestrian safety by demonstrating the proper use of a crosswalk. During the event, a group
Crosswalk event overview (Saint Paul) A crosswalk event occurs when an individual or group of individuals promote pedestrian safety by demonstrating the proper use of a crosswalk. During the event, a group
The 2002 Pedestrian Safety Awareness Campaign
 The 2002 Pedestrian Safety Awareness Campaign From the Metropolitan Washington Council of Governments ABOUT THIS REPORT This report describes the 2002 Street Smart Campaign of the Metropolitan Washington
About the Studio. Edward J. Bloustein School of Planning and Public Policy - Rutgers University
 About the Studio Edward J. Bloustein School of Planning and Public Policy - Rutgers University Purpose of studio: Help City of Bayonne apply for Safe Routes to School (SRTS) funding by producing a School
NYC Pedestrian Safety Study & Action Plan. NYTMC Brown Bag Lunch Presentation December 15, 2010
 NYC Pedestrian Safety Study & Action Plan NYTMC Brown Bag Lunch Presentation December 15, 2010 1 Introduction DOT Safety Goal Strategic Plan: Reduce Fatalities by 50% by 2030 From 274 (2007) to 137 (2030)
Speed Limits Study and Proposal. Public Input Session: 8/14/13
 Speed Limits Study and Proposal Public Input Session: 8/14/13 Why is Decatur a unique place for this project? First Community Transportation Plan in the nation with a Health Impact Assessment. Strong sense
NYC Pedestrian Safety Study & Action Plan. Research, Implementation & Safety Division of Traffic Operations
 NYC Pedestrian Safety Study & Action Plan Research, Implementation & Safety Division of Traffic Operations 1 Introduction DOT Safety GOAL Strategic Plan: Reduce Fatalities by 50% by 2030 From 274 (2007)
Watch for Me Pedestrian and Bicycle Safety Program: From North Carolina to Connecticut
 Watch for Me Pedestrian and Bicycle Safety Program: From North Carolina to Connecticut Watch for Me NC Watch for Me NC The Watch for Me NC program empowers communities to address pedestrian and bicycle
Toward Zero Deaths. Regional SHSP Road Show Meeting. Virginia Strategic Highway Safety Plan. presented by
 Toward Zero Deaths Regional SHSP Road Show Meeting presented by Virginia Strategic Highway Safety Plan December 1, 2016 1 Welcome & Introductions Purpose of the Meeting Objectives & Key Outcomes Agenda»
Chapter 2. Bellingham Bicycle Master Plan Chapter 2: Policies and Actions
 Chapter 2 Bellingham Bicycle Master Plan Chapter 2: Policies and Actions Chapter 2: Policies and Actions The Bicycle Master Plan provides a road map for making bicycling in Bellingham a viable transportation
Occ c u c pa p n a t pro r t O ec e t c i t O i n
 Occupant Protection Occupant Protection Introduction Buckling up or being buckled in is the most effective protection during a car crash. The simple truth is that the great majority of people ejected from
CHAPTER 3: Vision Statement and Goals
 Davidson Walks & Rolls: Active Transportation Master Plan CHAPTER 3 Contents: Overview Vision Statement Measurable Goals Public Outreach CHAPTER 3: Vision Statement and Goals Overview The vision statement
FLETCHER AVENUE PEDESTRIAN AND BICYCLIST BEHAVIOR CHANGE FORMATIVE RESEARCH PROJECT
 FLETCHER AVENUE PEDESTRIAN AND BICYCLIST BEHAVIOR CHANGE FORMATIVE RESEARCH PROJECT EXTENT OF CHANGES IN PEDESTRIAN AND BICYCLIST ATTITUDES AND BEHAVIORS DIRECTLY AFTER A COMPLETE STREETS PROJECT IN FLORIDA
Strategies. How to Develop a Pedestrian Safety Action Plan Enforcement 6-1
 How to Develop a Pedestrian Safety Action Plan Enforcement Strategies 6-1 Learning Objectives At the end of this module, you should be able to: Describe WHAT and HOW to integrate enforcement strategies
Do As I Say Not As I Do: Observed Compliance vs. Stated Understanding of Pedestrian Crossing Laws in Florida
 Do As I Say Not As I Do: Observed Compliance vs. Stated Understanding of Pedestrian Crossing Laws in Florida Achilleas Kourtellis, Ph.D. July 9, 2015 CUTR Webcast Series Center for Urban Transportation
Pedestrian Safety Campaign
 Pedestrian Safety Campaign 2017-18 Traffic Safety Plan PART OF THE DRIVE FOCUS LIVE TRAFFIC SAFETY PLAN Table of Contents Background. 1 Pedestrian Collision Stats.... 2-3 Goals.. 4 Objectives.. 5 Implementation
RSTF Measurements and Status
 RSTF Measurements and Status Items in green text are on or ahead of target. Items in red text need attention. Objective & Measures Status November, 2011 Winter, 3/8/12 Build, Maintain, & Leverage Partnerships
Chicago Pedestrian and Bicycle Safety Initiative Final Report
 1 Chicago Pedestrian and Bicycle Safety Initiative Final Report Chicago Department of Transportation www.chicagocompletestreets.org 312.744.8147 Executive Summary Since 2001, the Chicago Department of
City of San Diego Vision Zero Draft Strategic Plan FY 2017
 City of San Diego Vision Zero Draft Strategic Plan FY 2017 Engineering Objective: To develop and implement a strategy that employs best planning, design and engineering practices. Background: Over the
OLDER PEDESTRIANS AT RISK
 OLDER PEDESTRIANS AT RISK A TEN-YEAR SURVEY AND A LOOK AHEAD August 0 The population of older adults is growing in the U.S. and in the tri-state region. According to AARP, one in three Americans is now
The City of Newark Pedestrian and Bicycle Safety
 The City of Newark Pedestrian and Bicycle Safety Action Plan process involved significant community outreach efforts, including four Stakeholder/Steering Committee meetings and three Public Information
Safe Routes to School Travel Plan 2011 Reading-Fleming Intermediate School (RFIS)
") Safe Routes to School Travel Plan 0 Reading-Fleming Intermediate School (RFIS) Reading Fleming Intermediate School 50 Court Street Flemington, NJ 088 Grades: 5-6 Introduction Reading-Fleming Intermediate
Safe Routes to School Travel Plan 0 Reading-Fleming Intermediate School (RFIS) Reading Fleming Intermediate School 50 Court Street Flemington, NJ 088 Grades: 5-6 Introduction Reading-Fleming Intermediate
Transportation Issues Poll for New York City
 2016-17 Transportation Issues Poll for New York City 82% support Vision Zero and reducing traffic deaths 72% on average, support more street space for children to play, protected bike lanes and other safety
concurrence by the RPC. The PMC will convene four times during the course of the study. The consultant will address PMC comments in preparation of
 SCOPE OF SERVICES Safe Streets for Everyone A Transportation Safety Campaign for Orleans Parish, Louisiana State Project No. H.012461 RPC Project No. SafeStNO Background: Orleans Parish is consistently
Pedestrian Safety Initiatives National Highway Traffic Safety Administration (NHTSA)
") Pedestrian Safety Initiatives National Highway Traffic Safety Administration (NHTSA) Report to the Transportation Research Board Pedestrian Safety Committee January 2010 Leah Walton Safety Countermeasures
Pedestrian Safety Initiatives National Highway Traffic Safety Administration (NHTSA) Report to the Transportation Research Board Pedestrian Safety Committee January 2010 Leah Walton Safety Countermeasures
Implementing the Three Es of School Zone Traffic Calming
 Implementing the Three Es of School Zone Traffic Calming Use this evaluation tool as a guide to analyze the specific safety needs of your school. SCHOOL PROFILE School Name: School District: Address: Phone
Charles Brown, MPA. Complete Streets The Intersection of Health and Planning October 26, :30AM 12:30PM
 Charles Brown, MPA COMPLETE STREETS IN NEW JERSEY: A WINNING STRATEGY Complete Streets The Intersection of Health and Planning October 26, 2016 8:30AM 12:30PM Purpose Share Strategies from New Jersey s
Beaverton Police Department Traffic Safety Team
 Traffic Safety Team November 1, 2010 Executive Summary The Beaverton Police Department takes pride in the distinction as being one of the safest cities in the northwest. Being a safe city is more than
Vulnerable Road Users Safety: What Cities Can Do To Make Things Better?
 Vulnerable Road Users Safety: What Cities Can Do To Make Things Better? Transportation Research Board Webinar September 27, 2016 Robert Hull, Cambridge Systematics, Inc. The Issue Today NHTSA 2015 estimates:
Pedestrian Safety Action Plan Bicycle Safety Action Plan
 Pedestrian Safety Action Plan Bicycle Safety Action Plan January 24, 2017 VISION: Safe travel for all MISSION STATEMENT: Partner with the community to plan and fund transportation projects and programs
MARKET/JFK VISION ZERO PILOT PROJECT FEBRUARY 2019 EVALUATION REPORT
 MARKET/JFK VISION ZERO PILOT PROJECT FEBRUARY 2019 EVALUATION REPORT WHY IS THIS PROJECT IMPORTANT? Market Street and JFK Boulevard in Center City are key east-west corridors in the core business district.
INFORMATION TOOL KIT
 CANADA ROAD SAFETY WEEK 2017 INFORMATION TOOL KIT Thank you for being involved in Canada Road Safety Week. With your participation, we can spread the word about this special week and why it is an important
Creating a Successful Pedestrian Safety Campaign. St. Paul, MN
 Creating a Successful Pedestrian Safety Campaign St. Paul, MN - 2015-2017 The Problem The Problem A pedestrian or bicyclist is struck by a vehicle every other day in St. Paul (.84 per day) This doesn t
BIKE PLAN CONTENTS GATEWAY
 CONTENTS Acknowledgments...vii Great Rivers Greenway District Board of Directors... vii Great Rivers Greenway District Staff... vii Project Consultants... vii Committees... viii Citizens Advisory Committee
Why Zone In on Speed Reduction?
 Learn it. Do it. Live it! SPEED REDUCTION IN THE ZONE Why Zone In on Speed Reduction? Speeding is a serious issue that plays a major role in the risk of serious injury and pedestrian fatality in a crash.
Pedestrian-Bicycle Emphasis Area Breakout Session. Highway Safety Summit April 26, 2016
 5/20/2016 Pedestrian-Bicycle Emphasis Area Breakout Session Highway Safety Summit April 26, 2016 Fatality and Serious Injury Averages (2008-2013) by Emphasis Area Where We ve Been: February 2014 Highway
Bringing together community and health. Physical Activity and Nutrition Unit Office of Statewide Health Improvement Initiatives
 Bringing together community and health. Physical Activity and Nutrition Unit Office of Statewide Health Improvement Initiatives Physical Activity and Nutrition Unit Office of Statewide Health Improvement
Street Smart - Regional Pedestrian Safety Campaign. Hopkins Grand Rounds July 16, 2014
 Street Smart - Regional Pedestrian Safety Campaign Hopkins Grand Rounds July 16, 2014 Baltimore Metropolitan Council (BMC) Who We Are The organization of the Baltimore region s elected executives, representing
Film Guide for Educators. Designing for Safety
 Film Guide for Educators Designing for Safety Designing For Safety Key Concepts Speeding While Driving Speeding is the number one cause of injuries and deaths from driving. The main reasons are because
FHWA Resources for Pedestrian and Bicycle Professionals
 FHWA Resources for Pedestrian and Bicycle Professionals Charlie Zegeer, UNC Highway Safety Research Center/PBIC Libby Thomas, UNC Highway Safety Research Center Dan Nabors, Vanasse Hangen Brustlin (VHB)
METROPOLITAN TRANSPORTATION PLAN OUTREACH: INTERACTIVE MAP SUMMARY REPORT- 10/03/14
 METROPOLITAN TRANSPORTATION PLAN OUTREACH: INTERACTIVE MAP SUMMARY REPORT- 10/03/14 INTRODUCTION This document summarizes the results of the online interactive mapping exercise implemented by MIG for the
2011 Countywide Attitudinal and Awareness Survey Results
 2011 Countywide Attitudinal and Awareness Survey Results Purpose of Study Establish baseline for measuring future performance Identify perceptions about transportation system, issues, priorities Assess
DRAFT MOVING FORWARD RHODE ISLAND BICYCLE MOBILITY PLAN 2018 PREPARED FOR PREPARED BY IN ASSOCIATION WITH
 RHODE ISLAND MOVING FORWARD BICYCLE MOBILITY PLAN 2018 PREPARED FOR PREPARED BY IN ASSOCIATION WITH T AF CHAPTER 1 D R INTRODUCTION CHAPTER 3 ARTICULATES VISION Bicycling is safe, fun and practical in
Traffic Safety Plan Traffic Safety Plan 2015
 Traffic Safety Plan 2015 Purpose Airdrie s last Traffic Safety Plan was created in 2011. The 2015 Traffic Safety Plan is a revised model of the traffic operations for the City of Airdrie. The purpose of
Every time a driver is distracted,
 Walking on the Wild Side: Distracted Pedestrians and Traffic Safety Brendan J. Russo, Emmanuel James, Christopher Y. Aguilar, Edward J. Smaglik Every time a driver is distracted, including by their cellphone,
City of Stamford, Vision Zero Planning Study-Education
 City of Stamford, Vision Zero Planning Study-Education Review of National Best Practices Frank Petise (City of Stamford) Sandeep Aysola (Yale School of Forestry & Environmental Studies/ CDM Smith Inc.)
MEMORANDUM. Charlotte Fleetwood, Transportation Planner
 MEMORANDUM Date: Updated August 22, 2017 To: Organization: Charlotte Fleetwood, Transportation Planner Boston Transportation Department From: Jason DeGray, P.E., PTOE, Regional Director of Engineering
New Jersey Crossing Guard Training and Resources Program 2016
 New Jersey Crossing Guard Training and Resources Program 2016 BACKGROUND Trainings 2013 (pilot) Essex, Middlesex, and Burlington 75 officers 2014 Mercer, Monmouth, Bergen, Atlantic, and Union 179 participants
UPDATES, SUCCESSES, AND WHAT S AHEAD ON THE ROAD TO ZERO
 Vol. 1, Issue 1 I Spring 2018 www.planhillsborough.org/vision-zero S A F E S T R E E T S N O W H I L L S B O R O U G H UPDATES, SUCCESSES, AND WHAT S AHEAD ON THE ROAD TO ZERO TRACKING PROGRESS This is
POLICY AGENDA For Elder Pedestrian Safety
 POLICY AGENDA For Elder Pedestrian Safety Older adults and people with disabilities often have mobility, cognitive, and sensory limitations that affect their behavior as pedestrians and place them at risk
City of Ann Arbor Pedestrian Safety & Access Task Force
 City of Ann Arbor Pedestrian Safety & Access Task Force Community Wide Meeting #2 Wednesday, March 25 th 6:30 to 8:30 PM Multi-purpose Room, Downtown Library The Greenway Collaborative, Inc. www.greenwaycollab.com
City of Sherwood Photo Red Light Program 2015 Legislative Report. 3/1/2015 City of Sherwood Police Captain Mark Daniel
 City of Sherwood Photo Red Light Program 2015 Legislative Report 3/1/2015 City of Sherwood Police Captain Mark Daniel Table of Contents I. Introduction & Background II. III. Public Information Campaign
How-to-Develop a Pedestrian Safety Action Plan. Education Strategies
 How-to-Develop a Pedestrian Safety Action Plan Education Strategies Learning Objectives Gain understanding of pedestrian education needs (what) and strategies (who, when, and how) Learn ways to integrate
Effective Pedestrian & Bicycle Safety Enforcement
 Effective Pedestrian & Bicycle Safety Enforcement October 20, 2011 George Branyan Pedestrian Program Coordinator District Department of Transportation Increasingly multi-modal region Change in Daily Trip
Safe Routes to School in New Jersey
 Safe Routes to School in New Jersey The need for Safe Routes to School 1. Fewer kids today walk and bike to school 2. Unintended consequences have resulted 3. SRTS programs can be part of the solution
Washington County, Oregon
 Washington County, Oregon Photo add here 1 Washington County, Oregon Total population: 536,370 City population: 320,000 Based on 2010 Census Rural population: 26,000 Urban Unincorporated Population: 190,000
Alberta. Traffic Collision Statistics. Office of Traffic Safety Transportation Services Division May 2017
 Traffic Collision Statistics Office of Traffic Safety Transportation Services Division May 217 This page was intentionally left blank. 2 Table of Contents Traffic Collisions... 4 Traffic Collision Rates...
Mayor s Pedestrian Advisory Council. Wednesday, February 15
 Mayor s Pedestrian Advisory Council Wednesday, February 15 Annual Pedestrian Fatalities 2005-2016 Year-End Pedestrian Fatalities, 2016 (CPD): 44 Year-End Pedestrian Fatalities, 2015 (CPD): 46 Year-End
CTDOT Pedestrian and Bicycle Safety Initiatives
 CTDOT Pedestrian and Bicycle Safety Initiatives 2017 Northeast Transportation Safety Conference Mark F. Carlino, P.E. Traffic Engineering Division Chief Bureau of Engineering and Construction Connecticut
Double the amount of bicycle ridership while at the same time reducing the number of bicycle crashes by one-third.
 CHAPTER 6 Recommended Policies and Action Items To achieve the goals stated in Chapter 1 and guide implementation of the Bicycle Plan, policies and action items have been identified. They are presented
We believe the following comments and suggestions can help the department meet those goals.
 The Honorable Secretary Anthony Foxx The Secretary of Transportation United States Department of Transportation 1200 New Jersey Avenue, SE Washington, DC 20590 August 30, 2013 Dear Secretary Foxx, Thank
MONTCLAIR TOWNSHIP PEDESTRIAN SAFETY COMMITTEE
 + MONTCLAIR TOWNSHIP PEDESTRIAN SAFETY COMMITTEE + PEDESTRIAN SAFETY COMMITTEE CURRENT MISSION: The Committee was formed in 2013 to call attention to and eliminate unsafe conditions on Montclair streets
Automated Traffic Enforcement Technology Guidelines
 Automated Traffic Enforcement Technology Guidelines Province of Alberta (September 2014) Revised Automated Traffic Enforcement Technology Guidelines Province of Alberta A. PREAMBLE Automated traffic enforcement
CAPITAL COEXIST TRAFFIC SAFETY AMBASSADOR PROGRAM GUIDEBOOK
 CAPITAL COEXIST TRAFFIC SAFETY AMBASSADOR PROGRAM GUIDEBOOK Contents How to Use This Guide 3 Walking School Bus 4 Safe Routes to School 5 Slow Down / Stop for Pedestrians Campaign 6 Group Bike Ride 7 Helmet
Walk Friendly Communities Education and Encouragement Programs
 Walk Friendly Communities Programs Dan Gelinne Walk Friendly Communities Workshop Grandview, MO June 2015 Module Overview Topics Background and purpose What is the role of education and encouragement programs?
Unit Six: Driving Faster with More Risk URBAN, SUBURBAN, AND RURAL DRIVING
 Unit Six: Driving Faster with More Risk URBAN, SUBURBAN, AND RURAL DRIVING What Is The Impact Of Distraction? Objectives For Unit Six Students will be able to describe the skills necessary to What safely
TOOLKIT STOP ON RED. National. Week August 6-12, 2017 RED-LIGHT RUNNING FACT. #StopOnRed2017 to spread the message!
 National STOP ON RED Week August 6-12, 2017 RED-LIGHT RUNNING FACT In 2015, 771 people were killed due to red-light running and an estimated 137,000 were injured. Source: IIHS TOOLKIT Learn more about
MEMORANDUM. City Constituents. Leilani Schwarcz, Vision Zero Surveillance Epidemiologist, SFDPH
 MEMORANDUM TO: FROM: CC: City Constituents Leilani Schwarcz, Vision Zero Surveillance Epidemiologist, SFDPH Megan Wier, Co-Chair, San Francisco Vision Zero Task Force, SFDPH Commander Ann Mannix, Traffic
INTRODUCTION. Specifically, the objectives are to:
 INTRODUCTION The River to Sea Transportation Planning Organization (TPO) conducts the Tell the TPO Transportation Trends Survey to better understand the transportation preferences and priorities for the
Older Pedestrians at Risk And How States Can Make it Safer and Easier for Older Residents to Walk
 Older Pedestrians at Risk And How States Can Make it Safer and Easier for Older Residents to Walk Tri-State Transportation Campaign August 2012 Introduction Key Findings 435 older pedestrians have been
Red-Light Safety Camera Program Analysis
 Puyallup, Washington NOVEMBER 14, 2013 SUBMITTED BY AMERICAN TRAFFIC SOLUTIONS, INC. Contents 1. Summary... 2 1.1 Program Overview... 2 1.1.1 WHEN IS RED-LIGHT RUNNING HAPPENING?... 2 1.1.2 WHO IS RUNNING
EMPHASIS AREA 1: PEDESTRIANS
 EMPHASIS AREA 1: PEDESTRIANS A pedestrian is seriously injured or killed every 3 days on Toronto s roads. Pedestrian collisions involve any person that is not riding in a vehicle or on a bicycle. 26% OF
Final Report 2012 Chicago Department of Transportation 30 N. LaSalle St., Ste 500 Chicago IL Gabe Klein, Commissioner
 Final Report 2012 Chicago Department of Transportation 30 N. LaSalle St., Ste 500 Chicago IL 60602 Gabe Klein, Commissioner 1 Funders Partner Organizations Monetary Contributions In-Kind Donations 2 Executive
C/CAG. Sunnybrae Elementary School Walking and Bicycling Audit. San Mateo-Foster City School District JUNE 2013
 Sunnybrae Elementary School Walking and Bicycling Audit JUNE 2013 San Mateo-Foster City School District C/CAG City/County Association of Governments of San Mateo County SUNNYBRAE ELEMENTARY SCHOOL WALKING
Vision Zero San Jose. Moving toward zero traffic deaths and providing safe streets for all
 Vision Zero San Jose Moving toward zero traffic deaths and providing safe streets for all SPUR San Jose April 4, 2017 Source: Vision Zero Network Vision Zero Core Principles 1. Traffic deaths are preventable
Southern California Walking/Biking Research And Creative Evaluation
 Southern California Walking/Biking Research And Creative Evaluation Quantitative Research Topline Report December 7, 2015 Background & Objectives The Southern California Association of Governments (SCAG)
Randolph Township Walkable Community Workshop Pedestrian Safety and Accessibility at the Intersection of Center Grove Road and Route 10
 2012 Randolph Township Walkable Community Workshop Pedestrian Safety and Accessibility at the Intersection of Center Grove Road and Route 10 This publication has been prepared as part of the North Jersey
Most Dangerous Roads for Walking And How States Can Make them Safer. Route 110, Long Island, New York Image by Dougtone
 Most Dangerous Roads for Walking And How States Can Make them Safer Route 110, Long Island, New York Image by Dougtone Tri-State Transportation Campaign February 2013 Introduction Key Findings More than
MEET IN THE STREET MOVING TO ZERO
 WE MEET IN THE STREET MOVING TO ZERO Tips for sharing the street Traffic deaths are preventable. We need your help getting the message out. 2 A NEW PLAN A NEW PLAN Philadelphia is proud to adopt Vision
Tampa Bay. Pedestrian Safety Skills
 Tampa Bay Pedestrian Safety Skills Today s Presentation After this session, attendees should be able to: Describe the grassroots WalkWise Pedestrian Safety Campaign Understand why pedestrian fatalities
Canadian Association of Chiefs of Police Association canadienne des chefs de police
 WHAT S IN THE KIT? Media Advisory Template To be used to invite the media to an event during Operation Impact. We suggest you reproduce this on your own police agency letterhead. News Release Template
Access Management in the Vicinity of Intersections
 Access Management in the Vicinity of Intersections FHWA-SA-10-002 Technical Summary Photo: Ralph Bentley (used with permission) 0 Access Management is: The design, implementation and management of entry
Application of Demographic Analysis to Pedestrian Safety. Center for Urban Transportation Research University of South Florida
 Application of Demographic Analysis to Pedestrian Safety BDV25 TWO 977 30 Pei Sung Lin, Ph.D., P.E., PTOE, FITE Program Director Achilleas Kourtellis, Ph.D. Senior Research Associate CUTR, University of
Mayor s Bicycle Advisory Council. Wednesday, December 13 th, 2017
 Mayor s Bicycle Advisory Council Wednesday, December 13 th, 2017 Bicyclist Fatalities, Year to Date (January 1 November 30, 2017) - MBAC Briefing Bicyclist Fatality Statistics Year to date total, 2017
Figure 1. Indiana fatal collisions by young driver involvement,
 INDIANA TRAFFIC SAFETY FACTS YOUNG DRIVERS 2016 MAY 2017 ISSUE 17-C06 IN 2016: In 2016, 13.4 percent of all drivers involved in Indiana collisions were young drivers. Young drivers were involved in 105
Document Safer Roads Ottawa Program Workplan
 Document 2 2012 Safer Roads Ottawa Workplan The 2012 Safer Roads Ottawa (SROP) implementation plan includes: The production of a video to help launch the new SROP; The delivery of an annual year-long campaign-based
FEASIBILITY REPORT ON RED LIGHT CAMERAS PLACED AT CENTRAL AVENUE AND H STREET.
 Lompoc City Council Agenda Item DATE OF CITY COUNCIL MEETING: March 18, 2008 TO: FROM: SUBJECT: GARY KEEFE, City Administrator TIMOTHY L. DABNEY, Chief of Police t_dabney@ci.lompoc.ca.us FEASIBILITY REPORT
Vision Zero Richmond Action Plan
 Vision Zero Richmond Action Plan COVER Acknowledgements This Vision Zero Action Plan was prepared by the Safe and Healthy Streets Commission and with numerous partners committed to safety in Richmond,
AAMPO Regional Transportation Attitude Survey
 AAMPO Regional Transportation Attitude Survey Traditionally Underserved Populations helping organizations make better decisions since 1982 2018 Submitted to the AAMPO By: ETC Institute 725 W. Frontier
Comprehensive Measures to Reduce Traffic Accident Fatalities
 Comprehensive Measures to Reduce Traffic Accident Fatalities Outcomes: 4,621 people died as a result of traffic accidents in 2015. It represents 4% decrease compared to 2014. Year 2012 2013 2014 2015 Traffic
Transportation and Health Tool
 Working together to evolve the Transportation and Health Tool APHA Webinar March 22, 2016 Ann Steedly, PE Overview THT Development Context Development of Indicators Strategies, Interventions & Policies
Project Goal and Description. Why Broadway? Broadway SFMTA.COM/BROADWAY. The goal of the Broadway Safety Improvement
 PROJECT OVERVIEW Project Goal and Description The goal of the Broadway Safety Improvement d St Van Ness Ave Project is to improve safety and comfort for all who Franklin St Hyde St Octavia St Gough St
Speed Reduction in School Zones
 Transportation Kentucky Transportation Center Research Report University of Kentucky Year 1976 Speed Reduction in School Zones Charles V. Zegeer James H. Havens Robert C. Deen Kentucky Department of Transportation
Pedestrian Safety HANDBOOK
 City & County of San Francisco Department of Public Health Community Health Programs International Institute of San Francisco Immigration & Citizenship Program Find out more about our injury data, community-based
Bikeway action plan. Bicycle Friendly Community Workshop March 5, 2007 Rochester, MN
 Bikeway action plan Summary The was held on March 5, 2007 at the Rochester Mayo Civic Center. The workshop was hosted by Rochester-Olmsted County Planning Department in collaboration with the League of