TransOptions would like to thank the following for a successful Street Smart pedestrian safety campaign in Newton: Newton Police Department
|
|
|
- Ruby Williams
- 6 years ago
- Views:
Transcription


1 NEWTON
2 Acknowledgments Street Smart Newton TransOptions would like to thank the following for a successful Street Smart pedestrian safety campaign in Newton: Newton Police Department The Town of Newton Sussex County Sussex County Freeholder Board Newton Public Schools Greater Newton Chamber of Commerce North Jersey Transportation Planning Authority (NJTPA) New Jersey Division of Highway Traffic Safety (NJDHTS) New Jersey Department of Transportation (NJDOT) The businesses and people of Newton for their participation in the program Page 1
3 Table of Contents Acknowledgments... 1 Street Smart Overview... 3 TransOptions Street Smart Program... 4 Newton, Sussex County, New Jersey... 4 Newton Street Smart Campaign Structure... 5 Funding... 6 Campaign Structure... 6 Campaign Evaluation... 6 Speed Sentry Loan Program... 6 Pre & Post Intercept Surveys Intersection Observations Campaign Kickoff Enforcement Infrastructure Education and Outreach Materials Local Outreach Contributions Street Signs Community Events Media Coverage Results Recommendations Conclusion Page 2
4 Street Smart Newton Street Smart Overview Street Smart NJ is a public education, awareness and behavioral change campaign developed by the North Jersey Transportation Planning Authority (NJTPA) and funded through the Highway Safety Improvement Program (HSIP) and State Pedestrian Safety Education and Enforcement Fund administered by the New Jersey Division of Highway Traffic Safety (NJDHTS). The campaign is a collaborative effort between public, private and non-profit organizations. The NJTPA, along with the Federal Highway Administration (FHWA), the New Jersey Department of Transportation (NJDOT), NJTRANSIT, NJDHTS, and the Transportation Management Associations (TMAs) worked with numerous community partners to develop and pilot the Street Smart NJ campaign. Street Smart NJ was developed in response to New Jersey s designation by FHWA as a pedestrian focus state and Newark as a focus city due to a high incidence of pedestrian injuries and fatalities. New Jersey s pedestrian fatality rate (24.3% in 2013) is nearly double the national average (14%). From , 697 pedestrians were killed and more than 22,000 injured on the state s roadways. On an annual basis, nearly 6,000 pedestrians are injured and 139 killed in motor vehicle crashes statewide. The campaign has three main goals: Change pedestrian and motorist behaviors to reduce the incidence of pedestrian injuries and fatalities in New Jersey. Educate motorists and pedestrians both about their roles and responsibilities for safely sharing the road. Increase enforcement of pedestrian safety laws and roadway users awareness of that effort. The Street Smart NJ program was piloted in five communities in New Jersey in 2013 and The pilot programs were conducted in Newark, Jersey City, Woodbridge, Hackettstown, and Long Beach Island. These five communities were selected in order to incorporate the state s diverse landscape of urban, suburban, rural, and shore regions. Page 3


5 TransOptions Street Smart Program After the conclusion of the first five pilot programs, the NJTPA s goal was to continue bringing attention to the issue of pedestrian safety statewide through the Street Smart initiative. With the success of the pilot programs, the NJTPA invited the regional Transportation Management Associations (TMAs) to conduct the Street Smart NJ campaign within their designated service areas to expand the program s reach throughout the state. As the TMA for northwestern New Jersey, TransOptions delivers pedestrian safety programs along with other transportation resources to the counties of Morris, Sussex, Warren as well suburban areas of Union, Essex, and Passaic. TransOptions selected Newton as one of three municipalities to conduct the Street Smart pedestrian safety program. Newton, Sussex County, New Jersey The Town of Newton is located in Sussex County, approximately 15 miles east of the Delaware River and Pennsylvania border. Newton covers approximately square miles and has a population of 7,997, according to the 2010 U.S. Census. Newton serves as the Sussex County Seat and is home to county services, Newton Medical Center, Sussex County Community College, Thorlabs, and several shops and restaurants. TransOptions used the Plan4Safety crash analysis tool from Rutgers University s Center for Advanced Infrastructure and Transportation to examine crash data in Newton. The Plan4Safety tool uses police reports to compile crash data from all over the state of New Jersey. From January 2011-August 2015, Newton had 26 pedestrian-related crashes, including one crash that resulted in a pedestrian fatality. Pedestrian Pre-Crash Action - Newton, NJ Crossing at marked Crosswalk (At Intersection) 8 Other Pedestrian Action 5 Crossing / Jaywalking 4 Walking To/From School 2 Crossing at unmarked Crosswalk (At Intersection) 1 Coming From Behind Parked Vehicle 1 Pedestrian Off Road 1 Standing/Lying/Kneeling Against Traffic 1 NULL 3 TOTAL 26 *Null = Crashes with unmarked pre-crash actions Page 4


6 Before the launch of the Street Smart campaign, Newton s downtown business district underwent changes to traffic patterns as Spring Street was converted from a two-way to a one-way street. Spring Street has several local attractions including shops, restaurants, and the Newton Fire Museum. Spring Street leads to the Newton Green where two major roadways, U.S.-206 and NJ-94, merge. During the one-way project, 22 parking spots were added along Spring Street and crosswalks were repainted. The Street Smart campaign in Newton was launched shortly after the completion of the Spring Street one-way project. Street Smart assisted in addressing the concerns for pedestrian safety as a result of the new traffic patterns. Street Smart Newton The Newton Street Smart campaign was a collaborative effort between TransOptions, officials from the Town of Newton, the Newton Police Department, Sussex County, Newton Public Schools, and local businesses. Newton Street Smart Campaign Structure The Street Smart campaign in Newton was modeled closely after the pilot programs implemented by the NJTPA in Newark, Jersey City, Woodbridge, Hackettstown, and Long Beach Island. An initial meeting was held in February 2015 at the Newton Municipal Building to introduce the Street Smart program and was attended by Newton s chief of police, lieutenant, and representatives from both the town and the county. TransOptions worked closely with the police department and town officials to go over the planning of the program, target areas for education and enforcement, and funding for overtime enforcement. Page 5
7 Funding TransOptions worked with the Newton Police Department and Newton s Deputy Town Manager to secure funding for overtime enforcement through the Pedestrian Safety Education and Enforcement fund from the New Jersey Division of Highway Traffic Safety (NJDHTS). The Town of Newton was awarded the funding for the 2016 fiscal year starting on July 1, From there, TransOptions provided a suggested timeline for police education and enforcement activities and the Newton Police Department developed a schedule for their officers. The NJDHTS funding allowed the police department to cover the cost of overtime hours for officers participating in the Street Smart enforcement initiatives as well as the purchase of campaign materials. Campaign Structure According to the NJTPA s How to Implement the Street Smart NJ Pedestrian Safety Campaign in Your Community guidebook, a successful Street Smart campaign should consist of two weeks of enforcement activity, followed by two weeks to a month of no activity, followed by a second two weeks of enforcement activity. Street Smart Newton Campaign Timetable Speed Sentry Loan: June 1 June 30, 2015 Pre-Campaign: (Surveys and Observations) August 28 September 6, 2015 Enforcement Phase I: September 8 September 22, 2015 Enforcement Phase II: October 18 October 31, 2015 Post-Campaign: (Surveys and Observations) October 30 November 9, 2015 Speed Sentry Loan: November 12 December 12, 2015 Campaign Evaluation Speed Sentry Loan Program TransOptions utilized the existing Speed Sentry Loan Program to measure the effectiveness of the Street Smart campaign in Newton. With this program, TransOptions loans the speed sentry device to municipalities within their service area. The radar sign digitally displays the speed of oncoming vehicles as they approach the sign. Data is collected on a web-based cloud server developed by All Traffic Solutions which is monitored and accessed at the office of TransOptions. Once data collection is complete for the specified timeframe, TransOptions produces a report with recommendations for low or no-cost improvements. The speed sentry device was displayed for 30 days both before and after the Newton Street Smart campaign. The device traced speed data in Newton approximately 700 feet from the observation intersection (see pg. 25). The location of the speed sentry device was determined by both TransOptions and the Newton Police Department. Page 6
 between Trinity Street and Hamilton Street.")


8 The speed sentry device was placed on a 25 MPH speed limit sign on the northbound lane of U.S. 206 (Water Street) between Trinity Street and Hamilton Street. Businesses, a restaurant, and a gas station are located in close proximity to the sign s location as well as houses and apartment buildings. Street Smart Newton The sign s digital display remained off for the first week of the loan for both the pre-campaign and the postcampaign evaluation periods. Although the sign showed no display of an approaching driver s speed, the device was still collecting data. The sign began actively displaying data the remaining three weeks of the loan. The speed sentry device considered a vehicle traveling 5 MPH above the posted speed limit of 30 MPH as noncompliant. Page 7
9 Compliance Pre-Campaign 11% Compliant Non-compliant 89% During the pre-campaign evaluation, a total of 197,827 vehicles passed by the speed sentry sign. 89% of the drivers that passed by the sign during the pre-campaign were considered traveling at compliant or low-risk speeds. 11% of drivers were considered to be traveling at medium to high-risk speeds. Post-Campaign 11% Compliant Non-compliant 89% During the post-campaign evaluation, a total of 204,301 vehicles passed by the speed sentry sign. Again, 89% of the drivers that passed by the sign during the pre-campaign were considered traveling at compliant or low-risk speeds. 11% of drivers were considered to be traveling at medium to high-risk speeds. Drivers passing through this area already had a high rate of compliant speeds and no change was observed as a result of the speed sentry device. Page 8
10 Sign Effectiveness Speed summery data was collected by the device during the pre-campaign phase. This report averages speed by hour of the day for the 30 day period. Pre-Campaign According to the report, the speed sentry slowed 37% of drivers passing the sign during the precampaign. Post-Campaign In the post-campaign, the speed sentry slowed 38% of motorists passing the sign accounting for a 1% increase from pre-campaign to post-campaign. Data from the speed sentry device showed that the high rates of compliant and low-risk speeds of drivers were maintained from pre-campaign to post-campaign. Page 9


11 Pre & Post Intercept Surveys Both before and after the Street Smart campaign in Newton, people were asked to complete an intercept survey to measure the effectiveness of the campaign. The survey was available in both English and Spanish and used the same questions from the NJTPA s pilot programs. In the weeks immediately before and after the Street Smart campaign, TransOptions staff walked through downtown Newton and gave survey cards to people they met. The survey was also distributed online through the Newton Police Department s Facebook Page and other electronic communications. Thorlabs also made the survey available to employees. Upon completing the survey, the respondents had a choice to enter into a raffle to win a $100 Visa Gift Card provided by TransOptions. A winner was selected from both the pre- and post- survey groups. The survey was created using SurveyMonkey and consisted of 20 questions that asked respondents to report on their walking and driving behavior and what they observe others doing on the road. The survey also included questions on the respondents knowledge of New Jersey s pedestrian safety laws and awareness of the Street Smart campaign in Newton. The pre- and post- campaign responses were then compared to determine the effectiveness of the Street Smart program in Newton. Page 10
12 Respondent Profile: Respondent profile data is compiled from both the pre-intercept survey and the post-intercept survey. 1% Gender 26% MALE FEMALE RATHER NOT SAY 73% Age Rather not say 4% 65 and over 10% % % 22% % Less than 18 years old 2% Page 11
13 Race Don't Know/ Rather not say 0% Hispanic 5% Caucasian 92% Asian 1% African American 2% Weekly Transportation Modes Rather not say Carpool Bicycle Ferry Walk Bus Newark Light Rail Hudson Bergen Light Rail PATH Subway NJ Transit Train Drive Alone 0% 6% 3% 2% 1% 0% 0% 1% 1% 25% 62% Page 12
14 Behaviors Respondents were asked to answer Yes or No to the following questions. The data displayed in this section shows the percentage of respondents that answered Yes to the questions regarding their own behaviors and behaviors they observed by others walking and driving in Newton. 48 respondents completed the pre-campaign survey and 77 respondents completed the postcampaign survey. TransOptions used identical methods to collect data in both the pre- and postcampaign surveys. In the past week, have you seen... Pre-Campaign Post-Campaign 79% 74% 85% 81% 77% 66% 65% 71% 64% 55% 54% 38% Pedestrians who crossed against the signal Pedestrians who crossed in the middle of the a (jaywalking) Drivers not stopping for pedestrians in crosswalks Drives not stopping/yielding for pedestrians when turning Drivers speed in areas with heavy pedestrian traffic Drivers running a red light or stop sign The respondents reported that they observed a decrease in unsafe walking and driving in all categories of this question after the post-campaign survey. Participants reported a significant 16% decrease in the amount of drivers observed running a red light or stop sign. Overall, an increase in observed positive behaviors was found in the post-campaign responses. Page 13
15 In the past week, have you YOURSELF... Pre-Campaign Post-Campaign 35% 27% 21% 21% 13% 8% 6% 6% 6% 2% 2% 4% Crossed the street against the signal Crossed in the middle of the block (jaywalking) Not stopped for pedestrians in the crosswalks when driving Not stopped/yielded to a pedestrian when turning Driven at least 10 MPH over the speed limit Run a red light or a stop sign Mixed results were found when the respondents were asked to self-report on their own walking and driving behaviors from the pre- to post-surveys. A 5% decrease was found in respondents that report that they crossed against the traffic signal and an 8% decrease was reported in drivers traveling 10MPH over the speed limit. Survey participants had a high awareness of others engaging in unsafe walking and driving behaviors but were less likely to report doing the behaviors themselves. This result was also consistent in the pilot programs. At a signalized intersection, when should you begin to cross the street? Pre-Campaign Post-Campaign 96% 99% 10% 12% 2% 6% When the word "Walk" or the walking person light is on When the words "Don t Walk" or the red hand and/or countdown number is flashing When the words "Don t Walk" or the red hand is on and not flashing Page 14
16 Increases in respondents knowledge of when to safely cross the street improved in all categories of this question. Although, responses from the pre-survey show that there was already a high understanding of correct crossing behaviors before the Street Smart campaign in Newton. Safety and Campaign Awareness In the past 30 days, have you read, seen or heard any advertising messages addressing the following Pre-Campaign Post-Campaign 69% 65% 73% 55% 55% 40% 46% 43% 27% 23% 21% 4% Speeding/aggressive driving Drunk driving Seat belts Distracted driving Pedestrian safety Bicycle safety Respondents were more aware of driving safety (speeding/aggressive driving) and pedestrian safety advertising after the Street Smart campaign in Newton. There was a 13% increase in reported exposure to advertising about speeding/aggressive driving and a significant 50% increase in awareness of pedestrian safety advertising. Bicycle safety awareness also increased by 17% after the Street Smart campaign. Page 15
17 In the past 30 days, have you read, seen or heard any advertising message or signage that mentions "Street Smart" and/or talks about pedestrian safety? Pre-Campaign Yes No 8% 92% Post-Campaign Yes No 32% 68% Results showed a 60% increase in respondents exposure to pedestrian safety messages and the Street Smart name. Page 16
18 In the past 30 days, have you read, seen or heard any advertising message or signage that says "Check your vital signs"? Pre- Campaign Yes No 4% 96% Post-Campaign Yes No 38% 62% Results showed that there was a 58% increase in respondents exposure to Street Smart s Check your vital signs slogan. Page 17

19 In the past 30 days, have you read or seen any advertising messages of signage like the following Pre-Campaign Yes No 8% 92% Post-Campaign Yes No 27% 73% Results showed that there was a 65% increase in respondents viewing the Street Smart campaign images and messages from campaign materials. Page 18
20 In the past 30 days, have you seen or interacted with anyone who told you about pedestrian safety or gave you information on New Jersey s pedestrian safety laws and/or safe walking tips? Pre-Campaign Yes No 12% 88% Post-Campaign Yes No 19% 81% Results showed that there was a 7% increase in respondents who were exposed to someone who provided them with safety tips and information on New Jersey s pedestrian safety laws. Page 19
21 To the best of your knowledge, can you receive a ticket in New Jersey for Pre-Campaign Post-Campaign 96% 94% 98% 100% 95% 97% 94% 94% 69% 73% 35% 13% Crossing in the Crossing the middle of the street against a block (jaywalking) pedestrian signal Using a mobile device while crossing the street? Not stopping for a pedestrian in a crosswalk Using a mobile device while driving Not yielding to pedestrians while turning Results from the pre-survey showed that respondents already had a high rate of understanding of New Jersey s pedestrian and driving safety laws. Only slight increases or decreases occurred in the data from the pre- to post- campaign surveys. The most significant finding occurred in 22% more respondents believing that they could receive a ticket for using a mobile phone when crossing the street. This shows that respondents are aware of the dangers of being distracted by a cellphone while crossing the street, however, it is not a yet considered a violated in New Jersey. Page 20
22 Have you recently read, seen, or heard about police efforts to enforce pedestrian safety laws? Pre-Campaign 63% 37% Yes No Post-Campaign 30% Yes No 70% Results showed a significant 33% increase in respondents awareness of the pedestrian safety enforcement efforts made by the Newton Police Department. Page 21
23 How strictly do you think police in your area enforce pedestrian safety laws such as jaywalking or crossing against the signal? Pre-Campaign Post-Campaign 44% 29% 31% 21% 21% 14% 14% 10% 12% 4% Very strictly Somewhat Strictly Not very strictly Not at all Don't know/rather not say Before the Street Smart campaign in Newton, 4% of respondents felt the local police department was very strict in enforcing pedestrian safety laws. After the campaign, 14% felt that the police department was very strict in enforcing pedestrian safety laws accounting for a 10% increase. An 8% increase was also found in respondents who felt the local police department as somewhat strict in enforcing pedestrian safety with that view rising from 21% before the campaign to 29% after the campaign. The most significant difference was found in respondents who felt the police department was not very strict or not (strict) at all. 13% less respondents in the post-campaign reported that they felt the department was not very strict and a 7% decrease was also found in respondents who felt that the police department was not (strict) at all. These numbers dropped in the postcampaign survey as there was an increase in respondents who felt that enforcement was instead very strict or somewhat strict. Page 22
24 How strictly do you think police in your area enforce driverrelated pedestrian safety laws, such as speeding or stopping for pedestrians in crosswalks? Street Smart Newton Pre-Campaign Post-Campaign 48% 48% 22% 23% 17% 10% 10% 8% 8% 5% Very strictly Somewhat strictly Not very strictly Not at all Don't know/rather not say Before the Street Smart campaign in Newton, 10% of respondents felt that the local police department was very strict in their enforcement of driver-related pedestrian safety laws. After the campaign, the post-survey results showed that 12% more respondents reported that they felt the police department was very strict in their enforcement of speeding or drivers not stopping for pedestrians in the crosswalk. There was no change in the 48% of respondents that reported the police department was somewhat strict in the enforcement of driver-related safety laws from pre- to post-campaign survey results. Fewer respondents reported that the police department was either not very strict or not (strict) at all in the post-campaign survey. Page 23


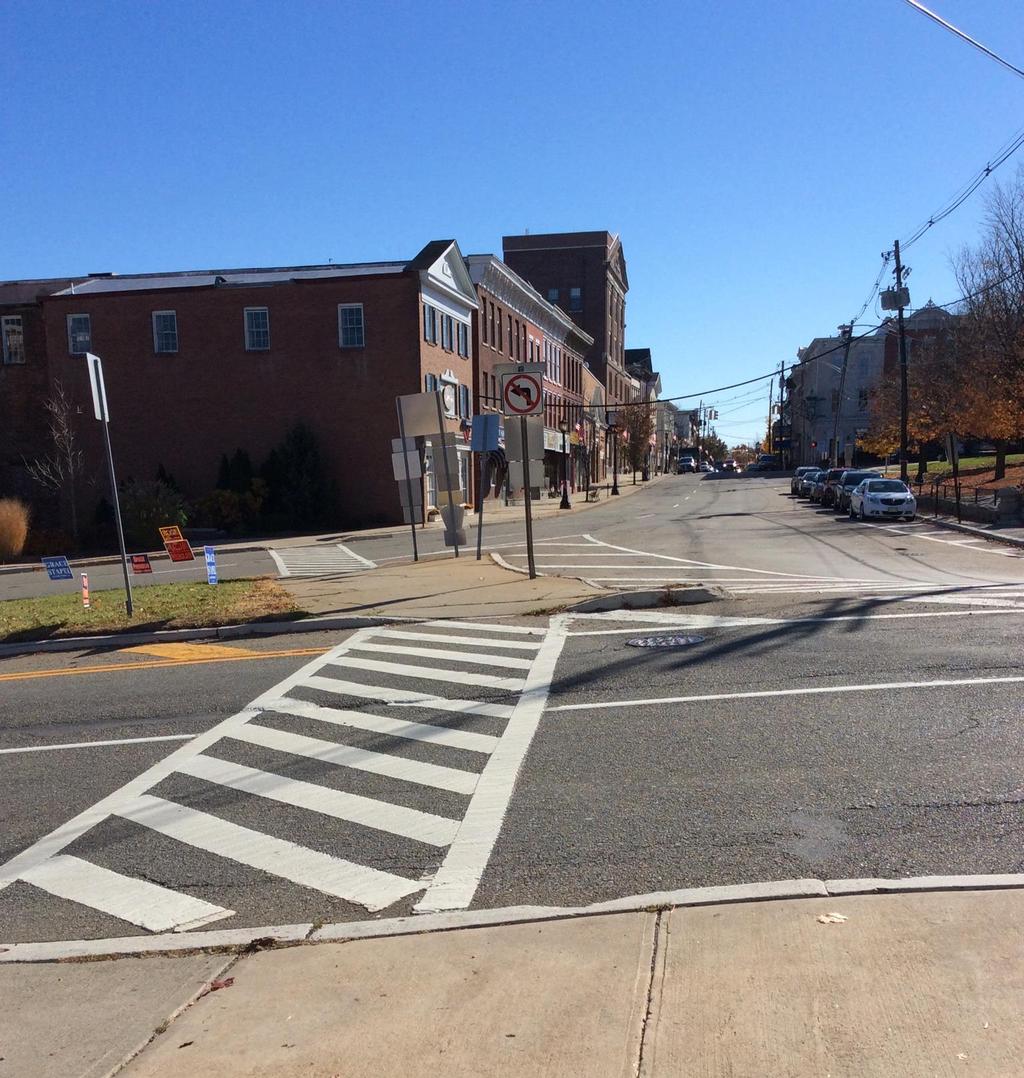
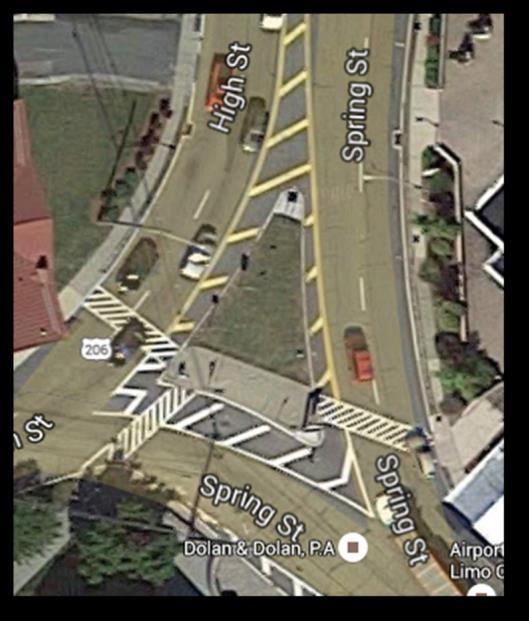
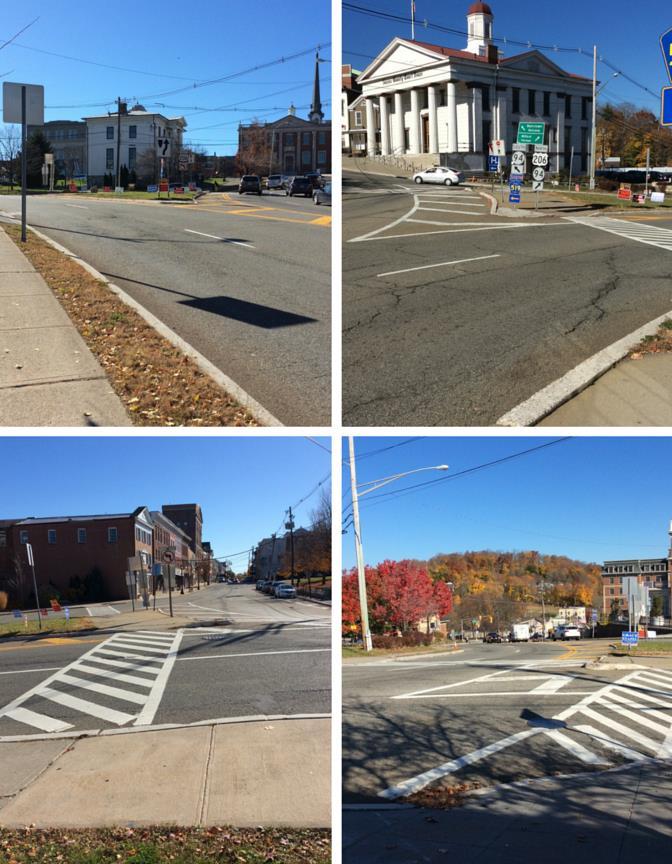
25 Intersection Observations Intersection observations were performed by TransOptions immediately before and after the Street Smart campaign in Newton in order to observe changes in walking and driving behavior. To control variables, intersection observations were kept consistent and performed six hours on Tuesdays from 7:00 AM to 1:00 PM. Pre-Campaign Observation: Wednesday, September 2, 2015, 7:00 AM 1:00 PM Post-Campaign Observation: Wednesday, November 4, 2015, 7:00 AM 1:00 PM Intersection Overview The intersection of U.S. 206, NJ 94, Spring Street/Water Street/High Street was selected as the observation site. The Newton Police Department recommended the intersection due to high pedestrian foot traffic circling the green with significant vehicular traffic and pedestrian/driver complaints. A fatal crash involving a pedestrian also occurred near the intersection in December The observation intersection is non-signalized with a pedestrian island located in the middle. The sidewalks along the outside of the intersection connect into the pedestrian island by three crosswalks. The pedestrian island is surrounded by two two-lane roadways (U.S.-206/NJ- 94/Spring Street and U.S.-206/NJ-94/High Street) and a onelane road (NJ-94/Spring Street). The merge of a state and federal highway at this intersection brings high vehicle volume as well as significant pedestrian foot traffic. Several walkable attractions are located in the immediate area surrounding the intersection such as the Newton Green park area, Hayek s Market, the Sussex County Administrative Center, the Sussex County Surrogate Court, Sussex County s Children s Advocacy Center, as well as shops, restaurants, organizations and offices. Fatal pedestrian crash: December 2014 Page 24
26 Page 25
27 Page 26


28 TransOptions set up cameras at each crosswalk of the intersection to observe and film walking and driving behavior. A tally of the number of pedestrians using the crosswalks was taken. Two proxies were selected to be observed and counted as compliant or non-compliant behaviors: Mid-block crossing Drivers failing to stop for pedestrians in or at the crosswalk Camera 1: Camera 2: Camera 3: Crosswalk, midblock crossing on Spring Street Crosswalk, midblock crossing on U.S.-206 North / NJ-94 North Crosswalk, midblock crossing on U.S.-206 South / NJ-94 South Page 27
29 The behaviors were tallied in person by TransOptions staff on the day of the observations and the video footage was later reviewed to get a true count and reduce human error. During the pre-campaign observation on Wednesday, September 2, 2015, 265 pedestrians used the crosswalks at the intersection. On November 4, 2015, 322 pedestrians used the crosswalks during the post-campaign observation. Pre-Campaign Not Compliant Post-Campaign Not Compliant % of Reduction Pedestrians crossing mid-block % Mid-block crossing/jaywalking was only marked as a non-compliant behavior. Pedestrians that crossed outside of the crosswalk further up the street from the intersection were counted as not compliant as long as the action was captured by the cameras. Pre-Campaign Post-Campaign Compliant Not Compliant % Non- Compliant Compliant Not Compliant % Non- Compliant Cars failing to stop for pedestrians in or at the crosswalk % % The most significant finding was in the amount of jaywalking observed from pre-to post-observation. Mid-block crossing/jaywalking showed a 34% decrease after being observed in the post-observation. There was also a significant decrease in the amount of drivers that failed to stop for pedestrians that were in or at the crosswalk. After the intersection was re-observed in the post-campaign, 21% fewer drivers were non-compliant when a pedestrian was in or at the crosswalk compared to the preobservation. Page 28

30 Mid-block crossing / Jaywalking Street Smart Newton Non-Compliant Crossing Non-Compliant Crossing Page 29

31 Drivers stopping for pedestrian in or at the crosswalk Compliant Page 30


32 Non-Compliant Street Smart Newton During the observations, it was noted that there was a high rate of driver/pedestrian conflict similar to the image above. In this situation, Driver #1 is the first to arrive at the crosswalk. While Driver #1 is compliantly stopped at the crosswalk for the pedestrian, Driver #2 may not acknowledge that Driver #1 is stopped at the crosswalk. Driver #2 will continue through the crosswalk while the pedestrian has already entered the roadway. This dangerous situation was observed several times in both the pre- and post-observations. Page 31

33 Campaign Kickoff Newton s Street Smart campaign was formally launched at a press conference on the Newton Green in the center of town. The Newton Green serves as a small park with benches and a gazebo. The green can be accessed by one of the crosswalks at the observation intersection and is surrounded by shops, offices, and county buildings. The speakers at the press conference included Daniel Callas of TransOptions, Chief Michael Richards of the Newton Police Department, Mayor Daniel Flynn, and Sussex County Freeholder Richard Vohden. Each speaker highlighted the importance of pedestrian safety for not only Newton, but for Sussex County and the State of New Jersey. Representatives from Newton, Sussex County, and NJTPA attended the kickoff event. The event was covered by the New Jersey Herald and TAPinto Newton. Immediately following the press conference, TransOptions staff walked through downtown Newton to deliver Street Smart materials to stores and businesses around the Green and on Spring Street. Page 32

34 Enforcement The Newton Police Department dedicated 187 hours of enforcement to the Street Smart Campaign. Overtime enforcement hours were funded through the Pedestrian Safety Education and Enforcement fund from the New Jersey Division of Highway Traffic Safety. Street Smart Newton Officers used roving patrols and the Cops in the Crosswalk pedestrian decoy program to distribute tickets and warnings. The Cops in the Crosswalk pedestrian decoy program has been used in New Jersey since Officers monitor a crossing and act as a decoy pedestrian in the crosswalk. If a driver does not stop for the pedestrian decoy in the crosswalk, the officer calls ahead to a waiting officer who then stops the non-compliant driver and issues a warning or a ticket. The Newton Police Department dedicated 183 of their hours to the decoy program. Officers in Newton used the decoy program 16 times throughout the campaign as an educational opportunity to engage with violators on correct behavior and provided Street Smart tip cards. Enforcement of pedestrian safety laws was increased throughout the town of Newton. Areas of enforcement included the observation intersection of U.S.-206/NJ-94/Spring Street/Water Street/High Street. Other focus intersections included Halstead Street and Main Street, Main Street and Park Place, and areas along Main Street, High Street and Spring Street. These areas were selected as a focus due to high volume of pedestrian traffic and the presence of crosswalks. During the first phase (September 8 September 22) of enforcement, the police department s activity focused on educating pedestrians and drivers by issuing warnings instead of citations. In the second phase of enforcement (October 18 October 31) the police focused on issuing citations to noncompliant drivers and pedestrians. A total of 144 citations and 205 warnings were issued during Newton s Street Smart campaign: 212 citations and warnings were issued for drivers who failed to stop for pedestrians in the crosswalk 6 citations and warnings were issued for pedestrians crossing against the traffic signal and crossing midblock 43 citations and warnings were issued for other violations such as speeding and cellphone use while driving Page 33


35 Infrastructure Engineering improvements to existing pedestrian safety infrastructure were completed during the Street Smart campaign. As part of the Spring Street One-Way Project, new brick crosswalks were constructed along Spring Street and 22 additional parking spots were created with the goal of drawing more traffic to the downtown shops and restaurants. Observation Intersection crosswalk improvements: Crosswalk #1: Before Crosswalk #1: After Page 34


36 Crosswalk #2: Before Crosswalk #2: After Page 35


37 Crosswalk #3: Before Crosswalk #3: After Page 36


38 New crosswalks on Spring Street after converting to one-way: Street Smart Newton Resurfacing on Trinity Street: Two new sets of traffic lights were also added along Trinity Street at the intersection of Moran Street and at the intersection of Union Street. Page 37


39 Education and Outreach TransOptions employed several efforts to spread the Street Smart message throughout the community in Newton by partnering with several local organizations, businesses, and schools. Materials Street Smart materials were purchased by the Newton Police Department through the Pedestrian Safety Education and Enforcement fund from the New Jersey Division of Highway Traffic Safety. Campaign materials included tip cards, posters, banners, and street signs. TransOptions and the Newton Police Department s logos were added to the campaign materials. The materials were produced in both English and Spanish. Street Smart Newton Tip Cards Page 38


40 Street Smart Newton Poster Street Smart Newton Banner Page 39


41 Local Outreach Contributions Many local businesses were eager to support the Street Smart message, display signage and distribute tip cards to their patrons, customers, and employees: Tip cards and posters were placed or distributed at the following locations: Shops, restaurants, and organizations along Spring Street and around the Newton Green Newton Municipal Building Newton Police Department Newton Theater Greater Newton Chamber of Commerce Newton Board of Education Office Thorlabs Hayek s Market Sussex County Library Dennis Branch Liberty Towers Sussex County Community College Center for Prevention & Counseling Sussex County Children's Advocacy Center - Ginnie s House Sussex County Administrative Building Newton Medical Center ShopRite of Newton Page 40


42 Street Smart banners were placed at the following locations: Street Smart Newton Newton Municipal Building / Police Department Spring Street Newton Public Schools o Merriam Avenue School o Halsted Middle School o Newton High School Sussex County Children's Advocacy Center - Ginnie s House (located on the Newton Green) Thorlabs Page 41
43 Street Signs Newton also received 50 street signs that were placed on light poles and sign posts throughout the downtown area and on side streets. The street signs aided in the public s recall and recognition of the campaign in Newton, the Street Smart brand, and the Check your vital signs slogan. The street signs remained in place in Newton after the campaign concluded. Page 42


44 Community Events TransOptions specializes in transportation safety education programs and community outreach. During Street Smart, TransOptions focused its safety education programs in Newton with several community events. Street Smart Newton TransOptions presented the Street Smart program at the Greater Newton Chamber of Commerce s regular Business After Hours meeting and dinner. Posters and tip cards were displayed on the table for business representatives prior to the start of the event Liberty Towers / The Newton Housing Authority hosted a special Street Smart pedestrian education program for seniors Merriam Avenue School in Newton hosted TransOptions Traffic Safety Town Program for fourth grade students TransOptions coordinated a We Will Walk poster contest for fourth grade students at Merriam Avenue School. Students were asked to draw why safe walking is important to them. Page 43


45 Thorlabs hosted two Street Smart information tables for employees during lunch hours ShopRite of Newton hosted a Street Smart information table for customers Page 44


46 The Sussex County Library Dennis Branch hosted a Street Smart information table Street Smart Newton Newton Medical Center hosted a Street Smart information table for employees and hospital visitors Sussex County Community College hosted a Street Smart information table for students Page 45

47 TransOptions joined the Newton Police Department for a special pedestrian safety edition of their Coffee with a Cop program. With this program, the police department regularly invites community members to come together in an informal, neutral space to discuss community issues, build relationships, and drink coffee. Page 46

48 Media Coverage Street Smart Newton Newton s Street Smart program received coverage in print, web, radio, television and social media platforms. The New Jersey Herald published two articles announcing the Street Smart campaign and crosswalk enforcement efforts Page 47
49 The New Jersey Herald also published an opinion article about Newton s request to improve safety for pedestrians throughout Newton and the merge of U.S.-206 and NJ-94 (observation intersection). TAPinto Newton announced the Newton Street Smart program after covering the press conference kickoff event Page 48


50 WSUS featured Street Smart Newton in the bright highlight segment and announced the press conference and launch of the campaign. WMBCTV conducted an interview with TransOptions President John F. Ciaffone. Page 49


51 Newton Public Schools posted an image of the check your vital signs message on their homepage Several Street Smart and pedestrian safety messages were posted on social media Page 50


52 A page was dedicated to Newton s Street Smart campaign on TransOptions website. Page 51
53 Results 1.) Change pedestrian and motorist behaviors to reduce the incidence of pedestrian injuries and fatalities in New Jersey. Data collection from the speed sentry device showed that the high rates of compliant and lowrisk speeds of drivers were maintained from pre-campaign to post-campaign. There was a 1% increase in vehicles that were slowed by the sign. Intersection observations showed a 34% decrease in mid-block crossing/jaywalking. Respondents to the post-intercept survey also reported a 4% decrease in others crossing midblock. However, respondents self-reported no change in their mid-block crossing/jaywalking with 21% admitting to this behavior in both the pre-survey and the post-survey. Intersection observations also showed a 21% decrease in cars failing to stop for pedestrians that were in or at the crosswalk. This behavior also showed an 11% decrease in the post-intercept survey participants observation of others performing this behavior, although self-reported behavior remained at 6%. Intercept survey respondents reported observing decreases in all categories including pedestrians who crossed against the signal (5%), pedestrians who crossed in the middle of the block (jaywalking (4%)), drivers not stopping for pedestrians in crosswalks (11%), drivers not stopping/yielding for pedestrians when turning (10%), drivers speeding in areas with heavy pedestrian traffic (7%), drivers running a red light or stop sign (16%). Mixed results were found when survey participants were asked to self-report their behaviors when walking and driving. Although, an 8% decrease was reported in respondents who reported driving 10MPH over the speed limit. 2.) Educate motorists and pedestrians both about their roles and responsibilities for safely sharing the road. 60% more respondents reported being exposed to the Street Smart name or increased mentions of pedestrian safety in the community 58% more respondents were aware of the campaign s check your vital signs slogan 65% more respondents had viewed Street Smart advertising messages from campaign materials 7% more respondents reported interacting with someone who provided them with safety tips and information on New Jersey s pedestrian safety laws. 22% more respondents believed they could receive a citation for using a cellphone while crossing the street. Although this is not against the law in New Jersey, showing increased awareness of this dangerous behavior is a positive result of the campaign. 3.) Increase enforcement of pedestrian safety laws and roadway users awareness of that effort. 50% more survey respondents had been exposed to advertising or messaging that addressed pedestrian safety; 13% more respondents reported being exposed to advertising or messaging that addressed speeding/aggressive driving. 33% more respondents were aware of increased enforcement efforts made by the Newton Police Department More respondents answered that they felt the Newton Police Department was either very strict or somewhat strict in their enforcement of pedestrian and driving safety laws in the postintercept survey Results from Street Smart Newton showed a significant reduction in unsafe walking and driving from the intersection observations. The intercept survey also showed a decrease in respondents who observe others engaging in unsafe walking and driving behaviors. Results also showed an increased awareness Page 52

.")
54 of pedestrian safety messages, the presence of the Street Smart campaign in the community, and awareness of the police department s focused activity regarding pedestrian safety in Newton. Recommendations Pedestrian safety should continue to be a focus in Newton. The following is recommended for further examination by officials in Newton, town engineers, and the Newton Police Department. Limited visibility is problematic for vehicles continuing on U.S.-206 North at the observation intersection. Motorists travel at high speeds from U.S. 206 North and may not see a pedestrian crossing or waiting to cross at the marked corner (X). Some pedestrians were observed taking a step out into the crosswalk in order to get a proper view of oncoming traffic. These driver and pedestrian behaviors were observed several times during observation sessions. Increased signage or shifting the crosswalk closer to the Green may improve visibility for pedestrians and drivers. Redesigning the pedestrian infrastructure at this intersection should be examined by town, county, and state engineers in the future. Due to the current limited visibility and high speeds of drivers in this area, installing a pedestrian activated beacon symbol would assist in ensuring safe crossing for pedestrians, although costs may be prohibitive. This was mentioned in the New Jersey Herald opinion article by Mayor Flynn (see pg. 48). Attention should be given to the mid-block crossing surrounding the Newton Green with focus at areas with on-street parking Page 53

55 Midblock crossing should also be monitored between the Sussex County Administrative Building and Hayek s Market (located midblock between the observation intersection and Trinity Street). The Newton Police Department should continue education and enforcement of pedestrian safety laws in the community. The priority should be given to educating offenders over issuing tickets. Special attention should be given to drivers failing to stop for pedestrians in the crosswalks surrounding the observation intersection. Increased presence of the Newton police department should continue at the observation intersection and roadway surrounding the Green. Speed of drivers continuing on U.S.206 North as they approach the observation intersection should be monitored Page 54
56 Conclusion Street Smart Newton Street Smart Newton was a successful collaborative effort between TransOptions, law enforcement, the Town of Newton, and Sussex County. A reduction in the prevalence of non-compliant behavior by both drivers and pedestrians was observed in the intersection observations and in the surveys. The campaign also resulted in a significant increase in awareness of the Street Smart message and emphasis on pedestrian safety throughout the community. TransOptions education and outreach programs will continue to be available to the businesses, organizations, and schools of Newton. Page 55
57 Page 56
 267-7600 F: (973) 267-6209 www.transoptions.")
58 2 Ridgedale Avenue, Suite 200 Cedar Knolls, NJ P: (973) F: (973) Page 57
Final Report Presented by:
 STREET SMART BOONTON Final Report Presented by: Acknowledgments TransOptions would like to thank the following for a successful Street Smart pedestrian safety campaign in Boonton: The Boonton Police Department
Final Report Presented by:
 STREET SMART MORRISTOWN Final Report Presented by: Acknowledgments TransOptions would like to thank the following for a successful Street Smart pedestrian safety campaign in Morristown: The Town of Morristown
Street Smart Morristown
 Street Smart Morristown Year II Followup Executive Summary After the success of the 2016 Street Smart pedestrian safety campaign in Morristown, NJ, TransOptions, the Town of Morristown and the Morristown
Evaluation of the Town of Clinton Street Smart Campaign
 Evaluation of the Town of Clinton Street Smart Campaign August 2016 Acknowledgements Special thanks to the following for their assistance: Town of Clinton Mayor and Council Chief Brett Matheis Town of
Evaluation of the Flemington Street Smart Campaign
 Evaluation of the Flemington Street Smart Campaign June 2016 Acknowledgements Special thanks to the following for their assistance: Chief George Becker Lt. Jerry Rotella Flemington Police Department Brooke
Evaluation of the Flemington Street Smart Campaign. April 2017 FINAL
 Evaluation of the Flemington Street Smart Campaign April 2017 FINAL Acknowledgements Special thanks to the following for their assistance: Police Chief Jerry Rotella Flemington Police Department Flemington
Crosswalk event overview (Saint Paul) How to organize a crosswalk event. 1. Choose a date, time and location
 How to organize a crosswalk event. 1. Choose a date, time and location") Crosswalk event overview (Saint Paul) A crosswalk event occurs when an individual or group of individuals promote pedestrian safety by demonstrating the proper use of a crosswalk. During the event, a group
Crosswalk event overview (Saint Paul) A crosswalk event occurs when an individual or group of individuals promote pedestrian safety by demonstrating the proper use of a crosswalk. During the event, a group
The 2002 Pedestrian Safety Awareness Campaign
 The 2002 Pedestrian Safety Awareness Campaign From the Metropolitan Washington Council of Governments ABOUT THIS REPORT This report describes the 2002 Street Smart Campaign of the Metropolitan Washington
FLETCHER AVENUE PEDESTRIAN AND BICYCLIST BEHAVIOR CHANGE FORMATIVE RESEARCH PROJECT
 FLETCHER AVENUE PEDESTRIAN AND BICYCLIST BEHAVIOR CHANGE FORMATIVE RESEARCH PROJECT EXTENT OF CHANGES IN PEDESTRIAN AND BICYCLIST ATTITUDES AND BEHAVIORS DIRECTLY AFTER A COMPLETE STREETS PROJECT IN FLORIDA
About the Studio. Edward J. Bloustein School of Planning and Public Policy - Rutgers University
 About the Studio Edward J. Bloustein School of Planning and Public Policy - Rutgers University Purpose of studio: Help City of Bayonne apply for Safe Routes to School (SRTS) funding by producing a School
NYC Pedestrian Safety Study & Action Plan. NYTMC Brown Bag Lunch Presentation December 15, 2010
 NYC Pedestrian Safety Study & Action Plan NYTMC Brown Bag Lunch Presentation December 15, 2010 1 Introduction DOT Safety Goal Strategic Plan: Reduce Fatalities by 50% by 2030 From 274 (2007) to 137 (2030)
EMPHASIS AREA 1: PEDESTRIANS
 EMPHASIS AREA 1: PEDESTRIANS A pedestrian is seriously injured or killed every 3 days on Toronto s roads. Pedestrian collisions involve any person that is not riding in a vehicle or on a bicycle. 26% OF
Do As I Say Not As I Do: Observed Compliance vs. Stated Understanding of Pedestrian Crossing Laws in Florida
 Do As I Say Not As I Do: Observed Compliance vs. Stated Understanding of Pedestrian Crossing Laws in Florida Achilleas Kourtellis, Ph.D. July 9, 2015 CUTR Webcast Series Center for Urban Transportation
Speed Limits Study and Proposal. Public Input Session: 8/14/13
 Speed Limits Study and Proposal Public Input Session: 8/14/13 Why is Decatur a unique place for this project? First Community Transportation Plan in the nation with a Health Impact Assessment. Strong sense
NYC Pedestrian Safety Study & Action Plan. Research, Implementation & Safety Division of Traffic Operations
 NYC Pedestrian Safety Study & Action Plan Research, Implementation & Safety Division of Traffic Operations 1 Introduction DOT Safety GOAL Strategic Plan: Reduce Fatalities by 50% by 2030 From 274 (2007)
Toward Zero Deaths. Regional SHSP Road Show Meeting. Virginia Strategic Highway Safety Plan. presented by
 Toward Zero Deaths Regional SHSP Road Show Meeting presented by Virginia Strategic Highway Safety Plan December 1, 2016 1 Welcome & Introductions Purpose of the Meeting Objectives & Key Outcomes Agenda»
C/CAG. Sunnybrae Elementary School Walking and Bicycling Audit. San Mateo-Foster City School District JUNE 2013
 Sunnybrae Elementary School Walking and Bicycling Audit JUNE 2013 San Mateo-Foster City School District C/CAG City/County Association of Governments of San Mateo County SUNNYBRAE ELEMENTARY SCHOOL WALKING
Safe Routes to School Travel Plan 2011 Reading-Fleming Intermediate School (RFIS)
") Safe Routes to School Travel Plan 0 Reading-Fleming Intermediate School (RFIS) Reading Fleming Intermediate School 50 Court Street Flemington, NJ 088 Grades: 5-6 Introduction Reading-Fleming Intermediate
Safe Routes to School Travel Plan 0 Reading-Fleming Intermediate School (RFIS) Reading Fleming Intermediate School 50 Court Street Flemington, NJ 088 Grades: 5-6 Introduction Reading-Fleming Intermediate
MARKET/JFK VISION ZERO PILOT PROJECT FEBRUARY 2019 EVALUATION REPORT
 MARKET/JFK VISION ZERO PILOT PROJECT FEBRUARY 2019 EVALUATION REPORT WHY IS THIS PROJECT IMPORTANT? Market Street and JFK Boulevard in Center City are key east-west corridors in the core business district.
Data Analysis February to March Identified safety needs from reported collisions and existing travel patterns.
 Welcome! Thank you for participating in today s Valencia Bikeway Improvements workshop. Data Analysis February to March Identified safety needs from reported collisions and existing travel patterns. Initial
City of Ann Arbor Pedestrian Safety & Access Task Force
 City of Ann Arbor Pedestrian Safety & Access Task Force Community Wide Meeting #2 Wednesday, March 25 th 6:30 to 8:30 PM Multi-purpose Room, Downtown Library The Greenway Collaborative, Inc. www.greenwaycollab.com
City of San Diego Vision Zero Draft Strategic Plan FY 2017
 City of San Diego Vision Zero Draft Strategic Plan FY 2017 Engineering Objective: To develop and implement a strategy that employs best planning, design and engineering practices. Background: Over the
CHAPTER 3: Vision Statement and Goals
 Davidson Walks & Rolls: Active Transportation Master Plan CHAPTER 3 Contents: Overview Vision Statement Measurable Goals Public Outreach CHAPTER 3: Vision Statement and Goals Overview The vision statement
Chapter 2. Bellingham Bicycle Master Plan Chapter 2: Policies and Actions
 Chapter 2 Bellingham Bicycle Master Plan Chapter 2: Policies and Actions Chapter 2: Policies and Actions The Bicycle Master Plan provides a road map for making bicycling in Bellingham a viable transportation
OLDER PEDESTRIANS AT RISK
 OLDER PEDESTRIANS AT RISK A TEN-YEAR SURVEY AND A LOOK AHEAD August 0 The population of older adults is growing in the U.S. and in the tri-state region. According to AARP, one in three Americans is now
Implementing the Three Es of School Zone Traffic Calming
 Implementing the Three Es of School Zone Traffic Calming Use this evaluation tool as a guide to analyze the specific safety needs of your school. SCHOOL PROFILE School Name: School District: Address: Phone
Document Safer Roads Ottawa Program Workplan
 Document 2 2012 Safer Roads Ottawa Workplan The 2012 Safer Roads Ottawa (SROP) implementation plan includes: The production of a video to help launch the new SROP; The delivery of an annual year-long campaign-based
City of Stamford, Vision Zero Planning Study-Education
 City of Stamford, Vision Zero Planning Study-Education Review of National Best Practices Frank Petise (City of Stamford) Sandeep Aysola (Yale School of Forestry & Environmental Studies/ CDM Smith Inc.)
EXECUTIVE SUMMARY: TRANSIT-ORIENTED DEVELOPMENT IN SMITHS FALLS, ONTARIO; A COMPARISON BETWEEN TWO SITES
 EECUTIVE SUMMARY: TRANSIT-ORIENTED DEVELOPMENT IN SMITHS FALLS, ONTARIO; A COMPARISON BETWEEN TWO SITES Topic and Purpose In 2007, the Mayor of Ottawa s Task Force on Transportation suggested adding a
Strategies. How to Develop a Pedestrian Safety Action Plan Enforcement 6-1
 How to Develop a Pedestrian Safety Action Plan Enforcement Strategies 6-1 Learning Objectives At the end of this module, you should be able to: Describe WHAT and HOW to integrate enforcement strategies
Film Guide for Educators. Designing for Safety
 Film Guide for Educators Designing for Safety Designing For Safety Key Concepts Speeding While Driving Speeding is the number one cause of injuries and deaths from driving. The main reasons are because
RSTF Measurements and Status
 RSTF Measurements and Status Items in green text are on or ahead of target. Items in red text need attention. Objective & Measures Status November, 2011 Winter, 3/8/12 Build, Maintain, & Leverage Partnerships
SPEED MANAGEMENT FOR VISION ZERO
 SPEED MANAGEMENT FOR VISION ZERO LUANN HAMILTON, DEPUTY COMMISSIONER FOR PROJECT DEVELOPMENT CHICAGO DEPARTMENT OF TRANSPORTATION NACTO DESIGNING CITIES 2017 Vision Zero Action Plan Speed management and
REGIONAL HOUSEHOLD TRAVEL SURVEY:
 Defining the Vision. Shaping the Future. REGIONAL HOUSEHOLD TRAVEL SURVEY: Profile Why we travel How we travel Who we are and how often we travel When we travel Where we travel How far and how long we travel
Why Zone In on Speed Reduction?
 Learn it. Do it. Live it! SPEED REDUCTION IN THE ZONE Why Zone In on Speed Reduction? Speeding is a serious issue that plays a major role in the risk of serious injury and pedestrian fatality in a crash.
POLICY AGENDA For Elder Pedestrian Safety
 POLICY AGENDA For Elder Pedestrian Safety Older adults and people with disabilities often have mobility, cognitive, and sensory limitations that affect their behavior as pedestrians and place them at risk
Broad Street Bicycle Boulevard Design Guidelines
 Broad Street Bicycle Boulevard Design Guidelines Building from the strategies introduced in the 2013 Bicycle Transportation Plan and community input received thus far, City Transportation Staff have identified
Designing for Pedestrian Safety in Washington, DC
 Designing for Pedestrian Safety in Washington, DC February 25, 2014 George Branyan Pedestrian Program Coordinator District Department of Transportation DC Journey to work mode split: 2012 Means of Transportation
New Jersey Department of Transportation. Safety Impact Teams. May 22, 2007 Patricia Ott, P. E. Director, Traffic Engineering & Safety
 New Jersey Department of Transportation Safety Impact Teams May 22, 2007 Patricia Ott, P. E. Director, Traffic Engineering & Safety Safe Corridor Legislation Approved July 2003 Double Fines for Motor Vehicle
Pedestrian & Bicycle Safety Innovations & Applications
 Pedestrian & Bicycle Safety Innovations & Applications County Engineers Association of Maryland Spring, 2017 Conference May 25, 2017 George Branyan Pedestrian Program Coordinator District Department of
Data Analysis February to March Identified safety needs from reported collisions and existing travel patterns.
 Welcome! Thank you for participating in today s Valencia Bikeway Improvements workshop. Data Analysis February to March Identified safety needs from reported collisions and existing travel patterns. Initial
Transportation Issues Poll for New York City
 2016-17 Transportation Issues Poll for New York City 82% support Vision Zero and reducing traffic deaths 72% on average, support more street space for children to play, protected bike lanes and other safety
Watch for Me Pedestrian and Bicycle Safety Program: From North Carolina to Connecticut
 Watch for Me Pedestrian and Bicycle Safety Program: From North Carolina to Connecticut Watch for Me NC Watch for Me NC The Watch for Me NC program empowers communities to address pedestrian and bicycle
Chicago Pedestrian and Bicycle Safety Initiative Final Report
 1 Chicago Pedestrian and Bicycle Safety Initiative Final Report Chicago Department of Transportation www.chicagocompletestreets.org 312.744.8147 Executive Summary Since 2001, the Chicago Department of
MEET IN THE STREET MOVING TO ZERO
 WE MEET IN THE STREET MOVING TO ZERO Tips for sharing the street Traffic deaths are preventable. We need your help getting the message out. 2 A NEW PLAN A NEW PLAN Philadelphia is proud to adopt Vision
Randolph Township Walkable Community Workshop Pedestrian Safety and Accessibility at the Intersection of Center Grove Road and Route 10
 2012 Randolph Township Walkable Community Workshop Pedestrian Safety and Accessibility at the Intersection of Center Grove Road and Route 10 This publication has been prepared as part of the North Jersey
FHWA Resources for Pedestrian and Bicycle Professionals
 FHWA Resources for Pedestrian and Bicycle Professionals Charlie Zegeer, UNC Highway Safety Research Center/PBIC Libby Thomas, UNC Highway Safety Research Center Dan Nabors, Vanasse Hangen Brustlin (VHB)
Safe Routes to School in New Jersey
 Safe Routes to School in New Jersey The need for Safe Routes to School 1. Fewer kids today walk and bike to school 2. Unintended consequences have resulted 3. SRTS programs can be part of the solution
Hillsborough Pedestrian Safety Action Plan 2015 Update. Hillsborough MPO BPAC May 2015
 Hillsborough Pedestrian Safety Action Plan 2015 Update Hillsborough MPO BPAC May 2015 Presentation Overview Pedestrian Safety Action Plan (PSAP) Review Pedestrian Crash Trends Stakeholder Activities Engineering
Effective Pedestrian & Bicycle Safety Enforcement
 Effective Pedestrian & Bicycle Safety Enforcement October 20, 2011 George Branyan Pedestrian Program Coordinator District Department of Transportation Increasingly multi-modal region Change in Daily Trip
MONTCLAIR TOWNSHIP PEDESTRIAN SAFETY COMMITTEE
 + MONTCLAIR TOWNSHIP PEDESTRIAN SAFETY COMMITTEE + PEDESTRIAN SAFETY COMMITTEE CURRENT MISSION: The Committee was formed in 2013 to call attention to and eliminate unsafe conditions on Montclair streets
Chapter #4 Traffic Control Devices and Laws
 Chapter #4 Traffic Control Devices and Laws Chapter #4 Overview Unit 4 will introduce the student to traffic control devices, including signs, signals and pavement markings, as well as traffic laws specific
METROPOLITAN TRANSPORTATION PLAN OUTREACH: INTERACTIVE MAP SUMMARY REPORT- 10/03/14
 METROPOLITAN TRANSPORTATION PLAN OUTREACH: INTERACTIVE MAP SUMMARY REPORT- 10/03/14 INTRODUCTION This document summarizes the results of the online interactive mapping exercise implemented by MIG for the
Pedestrian Safety Initiatives National Highway Traffic Safety Administration (NHTSA)
") Pedestrian Safety Initiatives National Highway Traffic Safety Administration (NHTSA) Report to the Transportation Research Board Pedestrian Safety Committee January 2010 Leah Walton Safety Countermeasures
Pedestrian Safety Initiatives National Highway Traffic Safety Administration (NHTSA) Report to the Transportation Research Board Pedestrian Safety Committee January 2010 Leah Walton Safety Countermeasures
Strategies for Making Multimodal Environments Safer. Kim Kolody Silverman, CH2M
 Strategies for Making Multimodal Environments Safer Kim Kolody Silverman, CH2M Kim.kolody@ch2m.com 800 Fatalities in Illinois: Rural versus Urban Fatalities 700 600 500 400 300 200 100 0 2004 2005 2006
Vulnerable Road Users Safety: What Cities Can Do To Make Things Better?
 Vulnerable Road Users Safety: What Cities Can Do To Make Things Better? Transportation Research Board Webinar September 27, 2016 Robert Hull, Cambridge Systematics, Inc. The Issue Today NHTSA 2015 estimates:
Vision Zero San Jose. Moving toward zero traffic deaths and providing safe streets for all
 Vision Zero San Jose Moving toward zero traffic deaths and providing safe streets for all SPUR San Jose April 4, 2017 Source: Vision Zero Network Vision Zero Core Principles 1. Traffic deaths are preventable
DRAFT MOVING FORWARD RHODE ISLAND BICYCLE MOBILITY PLAN 2018 PREPARED FOR PREPARED BY IN ASSOCIATION WITH
 RHODE ISLAND MOVING FORWARD BICYCLE MOBILITY PLAN 2018 PREPARED FOR PREPARED BY IN ASSOCIATION WITH T AF CHAPTER 1 D R INTRODUCTION CHAPTER 3 ARTICULATES VISION Bicycling is safe, fun and practical in
Moving Ahead. (Community Engagement) Chapter Three
 Chapter Three") 3 Community Chapter Three Moving Ahead (Community Engagement) engagement provided an exciting opportunity to engage Redwood City residents, workers, and business owners people who walk, bike, take transit,
3 Community Chapter Three Moving Ahead (Community Engagement) engagement provided an exciting opportunity to engage Redwood City residents, workers, and business owners people who walk, bike, take transit,
Creating a Successful Pedestrian Safety Campaign. St. Paul, MN
 Creating a Successful Pedestrian Safety Campaign St. Paul, MN - 2015-2017 The Problem The Problem A pedestrian or bicyclist is struck by a vehicle every other day in St. Paul (.84 per day) This doesn t
CTDOT Pedestrian and Bicycle Safety Initiatives
 CTDOT Pedestrian and Bicycle Safety Initiatives 2017 Northeast Transportation Safety Conference Mark F. Carlino, P.E. Traffic Engineering Division Chief Bureau of Engineering and Construction Connecticut
Pedestrian Safety Campaign
 Pedestrian Safety Campaign 2017-18 Traffic Safety Plan PART OF THE DRIVE FOCUS LIVE TRAFFIC SAFETY PLAN Table of Contents Background. 1 Pedestrian Collision Stats.... 2-3 Goals.. 4 Objectives.. 5 Implementation
2013 Candidate Questionnaire
 2013 Candidate Questionnaire OVERVIEW For New York City to compete in the global economy and provide the safety and quality of life New Yorkers deserve, our leaders must embrace a 21st Century vision for
REPORT ON RED-LIGHT MONITORING SYSTEMS
 REPORT ON RED-LIGHT TRAFFIC CONTROL SIGNAL MONITORING SYSTEMS Prepared by the New Jersey Department of Transportation November 2011 Executive Summary Public Law 2007, Chapter 348 (P.L. 2007, c.348), signed
MEMORANDUM. City Constituents. Leilani Schwarcz, Vision Zero Surveillance Epidemiologist, SFDPH
 MEMORANDUM TO: FROM: CC: City Constituents Leilani Schwarcz, Vision Zero Surveillance Epidemiologist, SFDPH Megan Wier, Co-Chair, San Francisco Vision Zero Task Force, SFDPH Commander Ann Mannix, Traffic
Work Zone Safety in Oregon
 Work Zone Safety in Oregon Nature of the Problem National studies show Driver Inattention is the biggest contributor to work zone crashes. Driving too fast for conditions or Speed is another significant
Road Safety Audit Course Participant Guidebook. August 22 & 23, Cleveland Avenue Columbus, Ohio
 Road Safety Audit Course Participant Guidebook August 22 & 23, 2017 Cleveland Avenue Columbus, Ohio 1 2 Table of Contents Executive Summary... 5 Cleveland Avenue City of Columbus... 6 Road Location Details...
Engagement Summary: Round 1
 Engagement Summary: Round 1 June 21, 2018 REPORT FOR: City of Courtenay 830 Cliff Avenue Courtenay, BC V9N 2J7 PREPARED BY: Urban Systems Ltd. 550 1090 Home Street Vancouver, BC V6B 2W9 ALONG WITH: Kathleen
SR/CR A1A PEDESTRIAN SAFETY & MOBILITY STUDY RIVER TO SEA TRANSPORTATION PLANNING ORGANIZATION
 SR/CR A1A PEDESTRIAN SAFETY & MOBILITY STUDY RIVER TO SEA TRANSPORTATION PLANNING ORGANIZATION 2016 Florida Section ITE Annual Summer Meeting June 24, 2016 Today s Presenters Lois Bollenback Executive
CAPITAL COEXIST TRAFFIC SAFETY AMBASSADOR PROGRAM GUIDEBOOK
 CAPITAL COEXIST TRAFFIC SAFETY AMBASSADOR PROGRAM GUIDEBOOK Contents How to Use This Guide 3 Walking School Bus 4 Safe Routes to School 5 Slow Down / Stop for Pedestrians Campaign 6 Group Bike Ride 7 Helmet
BIA INDIAN HIGHWAY SAFETY PROGRAM FY2016 LAW ENFORCEMENT GRANT. SECTION A: General Information. This section must be completed for all applicants.
 SECTION A: General Information. This section must be completed for all applicants. Name of Tribe: Click here to enter text. Address : Click here to enter text. City: Click here to enter text. State: Click
Southern California Walking/Biking Research And Creative Evaluation
 Southern California Walking/Biking Research And Creative Evaluation Quantitative Research Topline Report December 7, 2015 Background & Objectives The Southern California Association of Governments (SCAG)
2011 Countywide Attitudinal and Awareness Survey Results
 2011 Countywide Attitudinal and Awareness Survey Results Purpose of Study Establish baseline for measuring future performance Identify perceptions about transportation system, issues, priorities Assess
Street Smart - Regional Pedestrian Safety Campaign. Hopkins Grand Rounds July 16, 2014
 Street Smart - Regional Pedestrian Safety Campaign Hopkins Grand Rounds July 16, 2014 Baltimore Metropolitan Council (BMC) Who We Are The organization of the Baltimore region s elected executives, representing
New Jersey Crossing Guard Training and Resources Program 2016
 New Jersey Crossing Guard Training and Resources Program 2016 BACKGROUND Trainings 2013 (pilot) Essex, Middlesex, and Burlington 75 officers 2014 Mercer, Monmouth, Bergen, Atlantic, and Union 179 participants
2017 Watch for Me NC Pedestrian and Bicycle Safety Program: Information for Prospective Applicants
 2017 Watch for Me NC Pedestrian and Bicycle Safety Program: Information for Prospective Applicants Ed Johnson, NCDOT Division of Bicycle and Pedestrian Transportation Laura Sandt, UNC Highway Safety Research
San Francisco Pedestrian Safety Capital Improvement Program: A Step Towards Vision Zero
 San Francisco Safety Capital Improvement Program: A Step Towards Vision Zero March 5, 2014 The First Steps In April 2013, Mayor Lee issued the Strategy which directed City departments to implement solutions
CARE AND VIGILANCE SAVE LIVES!
 CARE AND VIGILANCE SAVE LIVES! PEDESTRIAN, Be Safety Conscious! Each day, approximately ten pedestrians are involved in traffic accidents throughout Québec. If you use the province s road network on foot,
INTRODUCTION. Specifically, the objectives are to:
 INTRODUCTION The River to Sea Transportation Planning Organization (TPO) conducts the Tell the TPO Transportation Trends Survey to better understand the transportation preferences and priorities for the
concurrence by the RPC. The PMC will convene four times during the course of the study. The consultant will address PMC comments in preparation of
 SCOPE OF SERVICES Safe Streets for Everyone A Transportation Safety Campaign for Orleans Parish, Louisiana State Project No. H.012461 RPC Project No. SafeStNO Background: Orleans Parish is consistently
Beaverton Police Department Traffic Safety Team
 Traffic Safety Team November 1, 2010 Executive Summary The Beaverton Police Department takes pride in the distinction as being one of the safest cities in the northwest. Being a safe city is more than
IMPROVING PEDESTRIAN SAFETY AT UNCONTROLLED CROSSINGS. Guidelines for Marked Crosswalks
 IMPROVING PEDESTRIAN SAFETY AT UNCONTROLLED CROSSINGS Presented by Nazir Lalani P.E. Traffex Engineers Inc. N_lalani@hotmail.com Guidelines for Marked Crosswalks Source: FHWA, Safety Effects of Marked
Nanaimo Transportation Master Plan. Phase 1 Consultation Summary
 Nanaimo Transportation Master Plan Phase 1 Consultation Summary Transportation Advisory Committee Meeting Wednesday December 12, 2012 Agenda Study Update Phase 1 Consultation Process Phase 1 Consultation
Tampa Bay. Pedestrian Safety Skills
 Tampa Bay Pedestrian Safety Skills Today s Presentation After this session, attendees should be able to: Describe the grassroots WalkWise Pedestrian Safety Campaign Understand why pedestrian fatalities
BIA INDIAN HIGHWAY SAFETY PROGRAM FY2016 LAW ENFORCEMENT OVERTIME GRANT
 SECTION A: General Information. This section must be completed for all applicants. Name of Tribe: Click here to enter text. Address : Click here to enter text. City: Click here to enter text. State: Click
Eastern PA Trail Summit October 1, 2018
 Eastern PA Trail Summit October 1, 2018 WHO WE ARE + WHY + WE RE * HERE * * * * * * Session Goals: Discuss how to coordinate planning and design in small, urbanized towns Consider how to develop alternative
Most Dangerous Roads for Walking And How States Can Make them Safer. Route 110, Long Island, New York Image by Dougtone
 Most Dangerous Roads for Walking And How States Can Make them Safer Route 110, Long Island, New York Image by Dougtone Tri-State Transportation Campaign February 2013 Introduction Key Findings More than
PEDESTRIAN ACTION PLAN
 ATTACHMENT 2 CITY OF SANTA MONICA PEDESTRIAN ACTION PLAN CITY OF SANTA MONICA PEDESTRIAN ACTION PLAN This page intentionally left blank EXECUTIVE SUMMARY CHAPTER 1 EXECUTIVE SUMMARY Setting the Stage
Agenda. Overview PRINCE GEORGE S PLAZA METRO AREA PEDESTRIAN PLAN
 PRINCE GEORGE S PLAZA METRO AREA PEDESTRIAN PLAN May 28, 2008 Agenda Welcome and introductions Project overview and issue identification Planning context and strengths Design challenges and initial recommendations
Montclair s Complete Streets Experience
 Presented by: Hon. Jerry Fried, Mayor Montclair Township About Montclair Six square miles Six commuter rail stations Four local bus routes (NJ Transit) Two private commuter bus routes Five business districts
Overview of Pinellas County Pedestrian Safety Programs and Initiatives
 Overview of Pinellas County Pedestrian Safety Programs and Initiatives FHWA Pedestrian Safety Peer Exchange Miami, FL August 2, 2012 Peter Hsu, P.E. District Safety & Special Projects Engineer Florida
BIKE PLAN CONTENTS GATEWAY
 CONTENTS Acknowledgments...vii Great Rivers Greenway District Board of Directors... vii Great Rivers Greenway District Staff... vii Project Consultants... vii Committees... viii Citizens Advisory Committee
Alberta. Traffic Collision Statistics. Office of Traffic Safety Transportation Services Division May 2017
 Traffic Collision Statistics Office of Traffic Safety Transportation Services Division May 217 This page was intentionally left blank. 2 Table of Contents Traffic Collisions... 4 Traffic Collision Rates...
Potential Bicycle Facility on Bayou Street Mobile, Alabama
 Potential Bicycle Facility on Bayou Street Mobile, Alabama By Richard A. Hall, P.E. Prepared For Mobile Downtown Alliance Hall Planning & Engineering, Inc. March 28, 2018 Introduction Review of the February
MEMORANDUM. Charlotte Fleetwood, Transportation Planner
 MEMORANDUM Date: Updated August 22, 2017 To: Organization: Charlotte Fleetwood, Transportation Planner Boston Transportation Department From: Jason DeGray, P.E., PTOE, Regional Director of Engineering
Preliminary Review of the T-REX Southeast Corridor Highway and Light Rail Transit Project
 Preliminary Review of the T-REX Southeast Corridor Highway and Light Rail Transit Project DRCOG Congestion Mitigation Program White Paper 07-1 (February 16, 2007) On time and under budget! Festivities
Wellington Exempted Village School District SAFE ROUTES TO SCHOOL TRAVEL PLAN January 2014
 Wellington Exempted Village School District SAFE ROUTES TO SCHOOL TRAVEL PLAN January 2014 OHIO SAFE ROUTES TO SCHOOL WELLINGTON EXEMPTED VILLAGE SCHOOL DISTRICT TRAVEL PLAN SECTION 1: WELLINGTON EXEMPTED
New Jersey Department of Transportation. Complete Streets Summit Shukri Abuhuzeima NJDOT-Local Aid
 New Jersey Department of Transportation Complete Streets Summit 10-24-2017 Shukri Abuhuzeima NJDOT-Local Aid Grant Resources State Funded Programs Funding Levels Funding appropriated for FY 2017 State
Older Pedestrians at Risk And How States Can Make it Safer and Easier for Older Residents to Walk
 Older Pedestrians at Risk And How States Can Make it Safer and Easier for Older Residents to Walk Tri-State Transportation Campaign August 2012 Introduction Key Findings 435 older pedestrians have been
BETHEL ROAD AND SEDGWICK ROAD CORRIDOR STUDY
 DRAFT PLAN City Council Meeting August 14, 2017 STUDY AREA Sedgwick Corridor State Route 160, principal arterial with Class 3 access management designation, commuter and freight route, connection to SR