Driver/Pedestrian Behavior at Marked and Unmarked Crosswalks in the Tahoe Basin
|
|
|
- Ira Cummings
- 5 years ago
- Views:
Transcription
1 CALIFORNIA PATH PROGRAM INSTITUTE OF TRANSPORTATION STUDIES UNIVERSITY OF CALIFORNIA, BERKELEY Driver/Pedestrian Behavior at Marked and Unmarked Crosswalks in the Tahoe Basin Meghan Fehlig Mitman, Douglas Cooper, Brooke DuBose, Swati Pande California PATH Research Report UCB-ITS-PRR This work was performed as part of the California PATH Program of the University of California, in cooperation with the State of California Business, Transportation, and Housing Agency, Department of Transportation, and the United States Department of Transportation, Federal Highway Administration. The contents of this report reflect the views of the authors who are responsible for the facts and the accuracy of the data presented herein. The contents do not necessarily reflect the official views or policies of the State of California. This report does not constitute a standard, specification, or regulation. Final Report for Task Order 6219 April 2010 ISSN CALIFORNIA PARTNERS FOR ADVANCED TRANSIT AND HIGHWAYS
2

3 Final Report Driver/Pedestrian Behavior at Marked and Unmarked Crosswalks in the Tahoe Basin Submitted by: April 2010 SF
4 Final Report Driver/Pedestrian Behavior at Marked and Unmarked Crosswalks at Uncontrolled Crossings in the Tahoe Basin 1
5 Final Report Driver/Pedestrian Behavior at Marked and Unmarked Crosswalks at Uncontrolled Crossings in the Tahoe Basin Meghan Fehlig Mitman, AICP* Senior Transportation Engineer/Planner Fehr & Peers Transportation Consultants 332 Pine St., 4th Floor San Francisco, CA Phone: Fax: Douglas Cooper University of California, Berkeley Traffic Safety Center 2614 Dwight Way 7374 Berkeley, CA Phone: Fax: Brooke DuBose Transportation Engineer/Planner Fehr & Peers Transportation Consultants Swati Pande UC Berkeley Traffic Safety Center 1
6 Final Report Driver/Pedestrian Behavior at Marked and Unmarked Crosswalks at Uncontrolled Crossings in the Tahoe Basin 1
7 Final Report Driver/Pedestrian Behavior at Marked and Unmarked Crosswalks at Uncontrolled Crossings in the Tahoe Basin TABLE OF CONTENTS EXECUTIVE SUMMARY...4 INTRODUCTION...5 BACKGROUND...5 Safety Research on Uncontrolled Crosswalks...5 Behavioral Research on Uncontrolled Crosswalks...6 Pedestrian Research in Rural Areas...6 This Study s Contribution...7 METHODS...7 Field Observation Sites...8 DATA COLLECTION...21 DATA ANALYSIS...21 RESULTS...22 Comparison 1: Fox Street (MARKED) versus Deer Street (Unmarked)...22 Comparison 2: Bear Street (MARKED) versus Deer Street (Unmarked)...24 Comparison 3: Onyx Street (MARKED) versus Carnelian Woods (Unmarked)...26 Comparison 4: Granlibakken Street versus Pine Street (Unmarked)...28 Comparison 5: Sequoia Crossing (MARKED) versus Sugar Pine Crossing (Unmarked)...30 Summary of Statistically Significant Results Across All Study Locations...32 Discussion and Interpretation of Findings...33 ACKNOWLEDGEMENTS...35 REFERENCES...36 APPENDICES: APPENDIX A DATA COLLECTION PROTOCOL AND FORM...37 APPENDIX B SAS OUTPUT
8 Final Report Driver/Pedestrian Behavior at Marked and Unmarked Crosswalks at Uncontrolled Crossings in the Tahoe Basin 1
9 Final Report Driver/Pedestrian Behavior at Marked and Unmarked Crosswalks at Uncontrolled Crossings in the Tahoe Basin EXECUTIVE SUMMARY For more than thirty years, pedestrian safety studies have considered pedestrian-vehicle collision history and pedestrian and driver behavior at marked and unmarked crosswalks at uncontrolled crossings. From , the UC Berkeley Traffic Safety Center, in a study funded by the California Department of Transportation (Caltrans), focused on developing a better understanding of driver and pedestrian behavior and safety in both marked and unmarked crosswalks in an effort to recommend more informed crosswalk policies. As a part of these efforts, a 2007 paper, The Marked Crosswalk Dilemma: Uncovering Some Missing Links in a 35-Year Debate was designed to fill key gaps in the literature by analyzing pedestrian and driver behavior and knowledge of right-of-way laws regarding marked and unmarked crosswalks throughout the Bay Area. The UC Berkeley study, as with most previous studies, focused on urban or suburban areas where the driver characteristics do not change significantly from day to day. Following this study was the recognition that similar research was needed in rural and recreational locations. As such, this paper summarizes results from field observations of driver and pedestrian behavior at marked and unmarked crosswalks at uncontrolled crossings during the summer in the Tahoe Basin of California. This study concludes that the behavior trends identified in the urban/suburban Bay Area study are largely similar in a rural/recreational context. The multiple threat scenario, however, is detected less frequently for the observed multi-lane roads. 4
10 Final Report Driver/Pedestrian Behavior at Marked and Unmarked Crosswalks at Uncontrolled Crossings in the Tahoe Basin INTRODUCTION In 2007 over 74,000 pedestrians were injured or killed in the United States (1). While the majority of pedestrian crashes occur in urban areas, the National Highway Traffic Safety Administration (NHTSA) reports that in 2007, 27% of all pedestrian fatalities occurred in rural areas. For more than thirty years, pedestrian safety studies have considered pedestrian-vehicle collision history and pedestrian and driver behavior at marked and unmarked crosswalks at uncontrolled crossings. However, most of the studies have focused on urban or suburban areas where the driver characteristics do not change significantly from day to day. The focus area for this study, California s Tahoe Basin, is recreational and semi-rural in nature and driver and pedestrian characteristics change due to the many tourists that frequent the area. As much of the California State Highway System traverses rural and/or recreation areas, the findings from this pedestrian safety study may be beneficial for Caltrans, as well as other state transportation agencies. District 03 Caltrans receives citizen requests for marked crosswalks within the Tahoe Basin on a regular basis. The results of this study could inform district decisions on the installation of marked crosswalks/ enhancements (based on pedestrian and driver behavior), and help the public understand why a location is suitable or not for a marked crosswalk/ enhancements. BACKGROUND Previous research focusing on uncontrolled crosswalks can generally be grouped in two key areas: (1) safety research regarding collision trends, and (2) behavioral research analyzing driver and pedestrian behavior within crosswalks. SAFETY RESEARCH ON UNCONTROLLED CROSSWALKS Significant research on the safety impacts of marked and unmarked crosswalks provides an important background for this study. Herms prominent 1972 study in San Diego found that marked crosswalks were the sites of twice as many crashes as unmarked crosswalks, controlling for pedestrian volume (2). Several other studies found similar results (Gibby, 1994), but their methodologies, as with the Hermes study, have been criticized (Campbell, 1997) (3, 4). A landmark study conducted by Zegeer, et al. in 2001 for the Federal Highway Administration (FHWA) analyzed five years of pedestrian collisions at 1,000 marked crosswalks and 1,000 matched unmarked comparison sites in 30 U.S. cities (5). The study concluded that no meaningful differences in crash risk exist between marked and unmarked crosswalks on two-lane roads or low-volume multi-lane roads. However, the researchers found that on multi-lane roads with traffic volumes greater than about 12,000 vehicles per day, marked crosswalks without other substantial roadway treatments were associated with higher pedestrian crash rate than having an unmarked crosswalk. The study concluded that, particularly on high-speed, high volume and multi-lane roads, painted white lines are not enough to improve pedestrian safety (5). A recent research effort jointly sponsored by the Transit Cooperative Research Program (TCRP) and the National Cooperative Highway Research Program (NCHRP) and conducted by the Texas Transportation Institute (TTI) focused on determining the effectiveness of many of the pedestrian safety engineering countermeasures for uncontrolled crossings recommended in the 2001 FHWA study. As a result of this study, specific engineering guidelines for selecting effective pedestrian crossing treatments for uncontrolled intersections and midblock locations are now available based on key input variables such as: 5
11 Final Report Driver/Pedestrian Behavior at Marked and Unmarked Crosswalks at Uncontrolled Crossings in the Tahoe Basin pedestrian volume, street crossing width, and traffic volume. The study also suggested modifications to the pedestrian traffic signal warrant in the Manual on Uniform Traffic Control Devices for Streets and Highways (MUTCD) (6). BEHAVIORAL RESEARCH ON UNCONTROLLED CROSSWALKS One of the central debates regarding pedestrian behavior in crosswalks is whether pedestrians are less cautious in marked crosswalks than in unmarked crosswalks or non-crosswalk locations. Herms 1972 analysis hypothesized that this lack of caution may lead to the higher rate of crashes observed in marked crosswalks compared to unmarked crosswalks (2). However, Knoblauch, et al. (2001) measured the effects of crosswalk markings on driver and pedestrian behavior at uncontrolled intersections on two- and three-lane roads (7). Knoblauch (2001) and Nitzburg (2001) found no difference in pedestrian assertiveness in marked and unmarked crosswalks, while pedestrian searching behavior (looking left and right for oncoming traffic) actually improved at crossings after they were marked (7, 8). Others (for example, Hauck, 1997) have also found that pedestrian behavior improves in well-marked crosswalks compared to unmarked or poorly marked crosswalks (9). There have been fewer studies of driver behavior, but it is generally agreed that drivers often fail to yield to pedestrians at both marked and unmarked crosswalks. The effects on driver behavior of marking a crosswalk have remained unclear. In a before-after study, Knoblauch (2001) found that marking a crosswalk had no effect on driver yielding. However, he found a slight reduction in speed by drivers approaching a pedestrian in a marked crosswalk compared to a crossing that is unmarked (7). Nitzburg (2001) found strong differences between day and nighttime driver behavior, with drivers yielding less frequently to pedestrians at night. Nitzburg s study also found differences in both driver and pedestrian behavior when the pedestrian was in the second half of the crosswalk compared to the first half. Drivers yielded to pedestrians more frequently in the second half and fewer pedestrians stayed within the marked crosswalk (in the magnet study ) in the second half of the crosswalk (8). To bolster this area of research, Mitman, Ragland, and Zegeer (2008) published a paper on driver and pedestrian behavior and knowledge of right-of-way laws regarding marked and unmarked crosswalks. The study also focused on driver and pedestrian behavior in multiple threat scenarios. Findings from this study revealed that (1) pedestrians are more cautious crossing at unmarked crosswalks as compared to marked crosswalks; (2) drivers are more likely to yield to pedestrians at marked crosswalks rather than at unmarked crosswalks; and (3) multiple threat scenarios arise most frequently at marked crosswalks (10). PEDESTRIAN RESEARCH IN RURAL AREAS In the studies cited above, all data was collected from urban and/or suburban locations within the U.S. Current pedestrian research in rural areas is limited, largely based on analysis of collision data to determine contributing factors. In 2000, Ivan et al. analyzed roadway and area type features from motor-vehicle-pedestrian collision data in rural Maine to determine which variables were of the greatest significance to pedestrian crashes. Variables considered included crosswalk marking, signals, central barrels/cones, speed, and number of lanes. Ivan compared the number of model-predicted crashes at study locations to actual crash numbers. Overall the study found the safest crossing type is the unsignalized, unmarked, low-speed crossing (11). In 2004, Hall, et al. published an FHWA study of pedestrian collision data in rural areas. Major characteristics of rural pedestrian fatalities and overall crashes were identified, as were possible countermeasures. The goal of the research was to identify the characteristics of rural pedestrian fatalities in ten states with above-average rates of rural pedestrian fatalities. The most prominent characteristics of 6
12 Final Report Driver/Pedestrian Behavior at Marked and Unmarked Crosswalks at Uncontrolled Crossings in the Tahoe Basin rural pedestrian fatalities in these states were clear weather, hours of darkness, weekends, nonintersection locations, and level, straight roads (12). However, Hall did not consider crosswalk type or other intersection geometry in this research. Hall also examined all rural pedestrian collisions in New Mexico for a three-year period. Safety recommendations included improved visibility and a selected application of pedestrian amenities such as walkways, crosswalks, and warning signs. THIS STUDY S CONTRIBUTION This paper summarizes results from field observations of driver and pedestrian behavior at marked and unmarked crosswalks on two, three, and four-lane rural roads in a recreational setting and interprets these results in light of the previously reported findings by Mitman, et al. for the San Francisco Bay Area. METHODS Building on the prior behavioral research by Knoblauch (2001) and recent methodologies used in UC Berkeley Traffic Safety Center research, this study focused on roads with two, three, and four-lane crosssections. Utilizing a matched pair approach, driver and pedestrian behavior within marked and unmarked crosswalks at intersections with similar characteristics were compared. Nine sites were selected for the purposes of the study. The locations were chosen with the following guidelines: One matched pair of marked/unmarked crossings on a two-lane rural highway. One matched pair of marked/unmarked crossings on a three-lane rural highway. One matched pair of marked/unmarked crossings on a four-lane rural highway for this pair two marked crosswalk locations were studied: one on the edge of a town where drivers may not expect pedestrians, and another in the center of town where drivers are accustomed to pedestrian activity and may behave differently. One matched pair of marked/unmarked crossings at a mid-block location on a two-lane rural highway. These locations provided data about pedestrian and driver behavior in remote, recreational settings. A Class I multi-use path crosses the roadway in both areas, which also provided an opportunity to study bicyclist behavior at marked and unmarked crossings. Previous studies have noted that driver yielding is related to vehicle speeds. All matched pair observation locations had similar speed limits in an effort to reduce potential yielding behavior discrepancies based on speed. Table 1 presents these sites by major road type. All nine sites are located in the North Lake Tahoe Basin, California. At each of the observation locations, the following study questions were addressed: Whether pedestrians use more, less, or the same amount of caution when crossing at a marked crosswalk (as compared to an unmarked crosswalk) by recording the pedestrian s looking behavior and level of assertiveness when using a marked versus unmarked crosswalk. Whether the age or gender of the pedestrian are correlated with his or her behavior by recording the gender and approximate age of the pedestrian observed. 7
13 Final Report Driver/Pedestrian Behavior at Marked and Unmarked Crosswalks at Uncontrolled Crossings in the Tahoe Basin Whether drivers yield more often to pedestrians in marked crosswalks than unmarked crosswalks by recording whether or not the driver yielded when encountering a pedestrian in the crosswalk. One of the mid-block study locations was a multi-use trail crossing used by both bicyclists and pedestrians. Data was collected for both user groups at this location. FIELD OBSERVATION SITES All observation sites were located along North Lake Boulevard/SR 28 and West Lake Boulevard/SR 89, a rural highway that circles the northwest shore of Lake Tahoe. Figure 1 shows a map of the study area. Figures 2 through 10 present diagrams of each study location. TABLE 1: FIELD OBSERVATION SITES Location Number of Lanes Marked/ Unmarked Crosswalk Speed Limit Estimated Pedestrian Volume (hour) Fox Street and SR 28, Kings Beach 4 Marked Bear Street and SR 28, Kings Beach 4 Marked Deer Street and SR 28, Kings Beach 4 Unmarked Onyx Street and SR 28, Tahoe Vista 3 Marked 45 2 Carnelian Woods and SR 28, Tahoe Vista 3 Unmarked 45 6 Granlibakken Road and SR 89, Tahoe City 2 Marked 35 2 Sequoia Crossing and SR 89, Tahoe City 2 midblock Marked SR 89 at Pine Street, PLA 89 PM 0.00, Tahoma Sugar Pine State Park Crossing and SR 89 (post mile 26.3, El Dorado County) 2 Unmarked midblock Unmarked

14 Final Report Driver/Pedestrian Behavior at Marked and Unmarked Crosswalks at Uncontrolled Crossings in the Tahoe Basin FIGURE 1 MAP 9
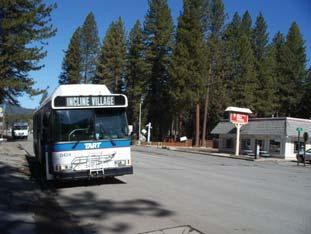
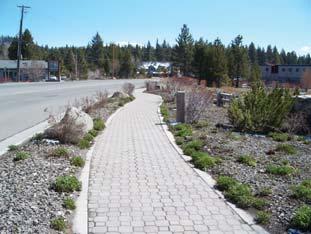
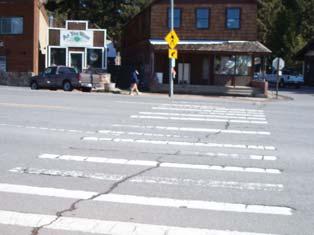
15 Final Report Driver/Pedestrian Behavior at Marked and Unmarked Crosswalks at Uncontrolled Crossings in the Tahoe Basin 1. Fox Street and SR 28, Kings Beach This intersection features the first marked crosswalk in Kings Beach, California that drivers encounter when approaching from the Nevada side of Lake Tahoe. This three-legged, side-street stop controlled intersection has a marked crosswalk on the east side of SR 28. In this location SR 28 has four lanes and a speed limit of 30 MPH. Area destinations include several shops, restaurants, and a movie theater. Signage and an (informal) pedestrian flag program have been installed at this crosswalk due to ongoing yielding issues. Pedestrian volumes were expected to be higher here than at most other study locations. 2. Bear Street and SR 28, Kings Beach This intersection is centrally located in downtown Kings Beach, approximately a quarter mile west of the Fox Street/SR 28 intersection. This location provides direct access to the Kings Beach State Park, parking lot and weekly farmers market. This site has similar attributes to the Fox Street/SR 28 intersection (four travel lanes, marked crosswalk, side-street stop controlled, speed limit of 30 MPH), and was chosen to compare and contrast driver and pedestrian behavior at a peripheral/unexpected location to a more centralized/expected crossing location. A marked ladder crosswalk is located on the west side of SR 28. Motorists failing to yield to pedestrians has been an issue at this intersection. Signage and an (informal) pedestrian flag program have been installed at this crosswalk. Bear Street/SR 28 was estimated to have the highest pedestrian volumes of all the study locations. 3. Deer Street and SR 28, Kings Beach The third location in Kings Beach is located approximately 700 feet west of the Bear Street/SR 28 site, at the western edge of town. SR 28 has four travel lanes at this location. The intersection is side-street stop controlled and does not have a marked crosswalk. This area was expected to have lower pedestrian volumes than the other Kings Beach locations. Area destinations include motels, shops, and restaurants. 4. Onyx Street and SR 28, Tahoe Vista This location has a four-legged intersection and is sidestreet stop controlled. SR 28 has three lanes (two travel lanes and a center turn lane), and sidewalks on the north and south sides. A ladder crosswalk is striped on the east side of SR 28, connecting to a walking path that accesses the Lake Tahoe shoreline. Area destinations include public lake access, Placer County Health and Human Services, and a mini-golf course. The posted speed limit is 45 MPH. 5. Carnelian Woods Avenue and SR 28, Tahoe Vista This site was chosen as the matched pair to the Onyx Street/SR 28 location, which is 400 feet to the east. Carnelian Woods Avenue/SR 28 is a three-legged intersection and side-street stop controlled. Area destinations include a marina and mini-golf course. The posted speed limit is 45 MPH. 6. Granlibakken Road and SR 89, Tahoe City Granlibakken Road/SR 89 is on the south side of Tahoe City, a popular tourist town on Lake Tahoe. SR 89 is a two-lane road in this area. The intersection has three legs and is side-street stop controlled. A class I multi-use trail runs parallel to SR 89 and crosses the road at this intersection. A marked crosswalk has been striped across Granlibakken Road. Area destinations include shops and residential neighborhoods, although this location is outside the downtown area of Tahoe City and has low pedestrian volumes. The posted speed limit on SR 89 is 35 MPH. 10
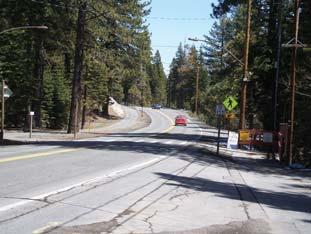
16 Final Report Driver/Pedestrian Behavior at Marked and Unmarked Crosswalks at Uncontrolled Crossings in the Tahoe Basin 7. Sequoia Crossing and SR 89, Tahoe City This mid-block location is a Class I multi-use trail crossing on SR 89, and is only accessed by pedestrians and bicyclists using the trail. Caltrans has significantly enhanced the crossing with an advanced flashing beacon, yield to pedestrians signage, camera-actuated flashing LED crosswalk signage, and ladder crosswalk striping. SR 89 is a two-lane road in this area, and sight distances to the crossing are limited. The posted speed limit in this area is 35 MPH. 8. SR 89 at Pine Street, Tahoma SR 89 is a typical two-lane rural road in this location. The fourway intersection with Pine Street is side-street stop controlled with an unmarked crosswalk. Area destinations include lake access, local shops and restaurants and residential neighborhoods. The posted speed limit in this area is 35 MPH. 9. Sugar Pine State Park Crossing and SR 89 This site was chosen as the second mid-block crossing, and is located at the main entrance to Sugar Pine Point State Park on SR 89 in Tahoma, California. The three-way intersection is side-street stop controlled, and the speed limit on SR 89 is 40 MPH. A Class I multi-use path runs parallel to SR 89 and crosses the road in this location. Pedestrians are recreational users of the state park and cross SR 89 to access the Lake Tahoe waterfront to the east. 11

17 Final Report Driver/Pedestrian Behavior at Marked and Unmarked Crosswalks at Uncontrolled Crossings in the Tahoe Basin Insert Figure 2 Fox Street 12

18 Final Report Driver/Pedestrian Behavior at Marked and Unmarked Crosswalks at Uncontrolled Crossings in the Tahoe Basin Insert Figure 3 Bear Street 13

19 Final Report Driver/Pedestrian Behavior at Marked and Unmarked Crosswalks at Uncontrolled Crossings in the Tahoe Basin Insert Figure 4 Deer Street 14

20 Final Report Driver/Pedestrian Behavior at Marked and Unmarked Crosswalks at Uncontrolled Crossings in the Tahoe Basin Insert Figure 5 Onyx Street 15

21 Final Report Driver/Pedestrian Behavior at Marked and Unmarked Crosswalks at Uncontrolled Crossings in the Tahoe Basin Insert Figure 6 Carnelian Woods 16

22 Final Report Driver/Pedestrian Behavior at Marked and Unmarked Crosswalks at Uncontrolled Crossings in the Tahoe Basin Insert Figure 7 Granlibakken Road 17

23 Final Report Driver/Pedestrian Behavior at Marked and Unmarked Crosswalks at Uncontrolled Crossings in the Tahoe Basin Insert Figure 8 Sequoia Crossing 18

24 Final Report Driver/Pedestrian Behavior at Marked and Unmarked Crosswalks at Uncontrolled Crossings in the Tahoe Basin Insert Figure 9 Pine Street 19

25 Final Report Driver/Pedestrian Behavior at Marked and Unmarked Crosswalks at Uncontrolled Crossings in the Tahoe Basin Insert Figure 10 Sugar Pine State Park 20
26 Final Report Driver/Pedestrian Behavior at Marked and Unmarked Crosswalks at Uncontrolled Crossings in the Tahoe Basin DATA COLLECTION Data collection occurred during daylight hours on non-rainy days in June As the Lake Tahoe area is a popular tourist destination, data was collected during the weekday and on weekends to record pedestrian behavior from both local residents and tourists that may have varying degrees of familiarity with local traffic patterns. As pedestrian volumes varied depending on the study location, certain locations were observed more frequently to capture a significant number of pedestrian crossing occurrences. Based on prior UC Berkeley Traffic Safety Center studies, clipboard-based (manual) data collection was selected as the best method for the purposes of this study. Observers included planning and engineering consultants from Fehr & Peers, as well as paid graduate students from the University of Nevada Reno who completed a full-day training tailored to this project. The graduate students entered their data into the database, with each students performing cross-check quality control for all data entry. The data collection protocol and form are included in Appendix A. DATA ANALYSIS The statistical analysis package SAS was utilized to compare driver and pedestrian behavior observations in marked versus unmarked crosswalks at each of the six observation locations with five comparison tests (matched pairs). These comparisons were typically accomplished via a Chi-Squared test, a non-parametric test of statistical significance appropriate for bivariate tables. However, in some instances comparison cells had expected values of less than five. In these cases, the Fisher s Exact Test was used instead of the Chi-Squared test. The Fisher s Exact Test is used for categorical data with small, sparse, or unbalanced data. It assumes a hypogeometric distribution. In addition to the observation variables included on the data collection form, the following derived variables were analyzed for each observation location: Gap acceptance (lanes): This variable measures the number of times that no vehicle was present in a lane encountered during a pedestrian s crossing. The maximum number of gaps is equal to the number of lanes across which the crosswalk extends. The total number of gaps for pedestrians in marked versus unmarked crosswalks was compared in the statistical analysis for each site. Immediate yields (drivers): This variable is the sum of the number of times the first driver encountered by a pedestrian in each lane yielded (as opposed to not yielding and trapping the pedestrian on the curb or within the street). The number of immediate yields for pedestrians in marked versus unmarked crosswalks was compared in the statistical analysis for each site. Multiple threat opportunity: This variable measures for each pedestrian the number of times in which a driver yielded in one lane (the first encountered in the crossing direction) while a driver in the adjacent lane of the same direction of travel (the next encountered) did not yield. The incidence of multiple threat opportunities was applicable only for the crosswalks across the multilane intersections. Two pairs of multiple threat opportunities were considered, the first set of same direction lanes encountered in a crossing and the second set. The incidence of multiple threat opportunities for pedestrian crossings in marked versus unmarked crosswalks was compared in the statistical analysis for each site. Multiple threat scenarios were specifically addressed in this analysis because the 2001 FHWA study noted, The greatest difference in 21
27 Final Report Driver/Pedestrian Behavior at Marked and Unmarked Crosswalks at Uncontrolled Crossings in the Tahoe Basin pedestrian crash types between marked and unmarked crosswalks involved multiple-threat crashes (1). Multiple-threat crashes occur on multi-lane roads when the pedestrian and/or driver s line of sight is blocked by a driver yielding to the pedestrian in an adjacent lane. RESULTS This section presents the statistical analysis results for behavior observations across the marked versus unmarked crosswalk comparisons. Reported p-values are for the statistical test of each variable (age, sex, etc.) in marked versus unmarked crosswalks. COMPARISON 1: FOX STREET (MARKED) VERSUS DEER STREET (UNMARKED) Descriptive Statistics: TABLE 2 Pedestrian and Driver Behavior by Crosswalk Type, Fox versus Deer Descriptive Statistics Fox (Marked) n (column %) Deer (Unmarked) n (column %) Total N (column %) Pedestrians p-value Age Fisher's Exact Test (p<0.001) Child 5 (1.81) 4 (1.40) 9 (1.60) Teen 37 (13.41) 28 (9.79) 65 (11.57) Young adult 100 (36.23) 136 (47.55) 236 (41.99) Older adult 120 (43.58) 116 (40.56) 236 (41.99) Elderly 14 (5.07) 1 (0.35) 15 (2.67) Not recorded 0 (0.00) 1 (0.35) 1 (0.18) Sex Fisher's Exact Test (p<0.0001) Male 154 (56.80) 199 (69.82) 353 (62.92) Female 122 (44.20) 86 (30.18) 208 (37.08) Not recorded 0 (0.00) 1 (0.35) 1 (0.18) 22
28 Final Report Driver/Pedestrian Behavior at Marked and Unmarked Crosswalks at Uncontrolled Crossings in the Tahoe Basin Analysis Results: TABLE 1 Pedestrian and Driver Behavior by Crosswalk Type, Fox versus Deer Analysis Results Fox (Marked) n (column %) Deer (Unmarked) n (column %) Total N (column %) p-value Pedestrian Assertiveness Waited on curb 53 (19.2) 79 (27.62) 132 (23.49) Waited on street 130 (47.1) 127 (44.41) 257 (45.73) Did not wait 91 (32.97) 78 (27.27) 169 (30.07) Forced driver to yield 2 (0.72) 1 (0.35) 3 (0.53) Not recorded 0 (0.00) 1 (0.35) 1 (0.18) Pedestrian Looking Didn't look 1 (0.36) 1 (0.35) 2 (0.36) Looked one way 18 (6.52) 3 (1.05) 21 (3.74) Looked both ways 243 (88.04) 207 (72.38) 450 (80.07) Looked more than 2 times 14 (5.07) 74 (25.87) 88 (15.66) Not recorded 0 (0.00) 1 (0.35) 1 (0.18) Pedestrian Pace Slow 1 (0.36) 0 (0) 1 (0.18) Normal 220 (79.71) 96 (33.57) 316 (56.23) Fast 23 (8.33) 36 (12.59) 59 (10.5) Ran 13 (4.71) 125 (43.71) 138 (24.56) Not recorded 19 (6.88) 29 (10.14) 48 (8.54) Fisher's Exact Test (p=0.0757) Fisher's Exact Test (p<0.001) Fisher's Exact Test (p<0.0001) Driver Behavior / Traffic Marked Unmarked Total p-value Total Vehicle Exposure Lane Gaps Chi square (p<0.0001) 0 23 (8.33) 1 (0.35) 24 (8.68) 1 52 (18.84) 2 (0.69) 54 (19.53) 2 64 (23.19) 16 (5.56) 80 (28.75) 3 61 (22.1) 49 (17.01) 110 (39.11) 4 76 (27.54) 220 (76.39) 296 (103.93) Immediate Yields Chi square (p<0.001) 0 83 (30.07) 229 (79.51) 312 (55.32) 1 68 (24.64) 42 (14.58) 110 (19.5) 2 70 (25.36) 15 (5.21) 85 (15.07) 3 37 (13.41) 1 (0.35) 38 (6.74) 4 18 (6.52) 1 (0.35) 19 (3.37) Multiple Threat Scenarios Chi square (p=0.14) (97.1) 284 (98.61) 552 (97.87) 1 8 (2.9) 4 (1.39) 12 (2.13) 23
29 Final Report Driver/Pedestrian Behavior at Marked and Unmarked Crosswalks at Uncontrolled Crossings in the Tahoe Basin Summary of Statistically Significant Findings, Fox versus Deer: Pedestrians in the unmarked crosswalk were more likely than pedestrians in the marked crosswalk to be young adults. Pedestrians in the unmarked crosswalk were more likely than pedestrians in the marked crosswalk to be male. Pedestrians in the unmarked crosswalk were more likely than pedestrians in the marked crosswalk to run when crossing. Pedestrians in the unmarked crosswalk were more likely than pedestrians in the marked crosswalk to look two or more times. Pedestrians in the unmarked crosswalk were more likely than pedestrians in the marked crosswalk to wait for larger gaps in traffic before crossing. Pedestrians in the unmarked crosswalk were less likely than pedestrians in the marked crosswalk to have drivers immediately yield the right-of-way to them. COMPARISON 2: BEAR STREET (MARKED) VERSUS DEER STREET (UNMARKED) Descriptive Statistics: TABLE 4 Pedestrian and Driver Behavior by Crosswalk Type, Bear versus Deer Bear (Marked) n (column %) Deer (Unmarked) n (column %) Total N (column %) p-value Pedestrians Age Fisher's Exact Test (p<0.001) Child 4 (1.44) 4 (1.44) 8 (1.42) Teen 12 (4.32) 28 (9.79) 40 (7.09) Young adult 146 (52.52) 136 (47.55) 282 (50.00) Older adult 99 (35.61) 116 (40.56) 215 (38.12) Elderly 17 (6.12) 1 (0.35) 18 (3.19) Not recorded 0 (0.00) 1 (0.35) 1 (0.18) Sex Fisher's Exact Test (p<0.001) Male 127 (45.68) 199 (69.58) 326 (57.80) Female 151 (54.32) 86 (30.07) 237 (42.02) Not recorded 0 (0.00) 1 (0.35) 1 (0.18) 24
30 Final Report Driver/Pedestrian Behavior at Marked and Unmarked Crosswalks at Uncontrolled Crossings in the Tahoe Basin Analysis Results: TABLE 5 Pedestrian and Driver Behavior by Crosswalk Type, Bear versus Deer Bear (Marked) n (column %) Deer (Unmarked) N (column %) Total N (column %) p-value Pedestrian Assertiveness Waited on curb 61 (21.94) 79 (27.62) 140 (24.82) Waited on street 144 (51.8) 127 (44.41) 271 (48.05) Did not wait 72 (25.9) 78 (27.27) 150 (26.6) Forced driver to yield 1 (0.36) 1 (0.35) 2 (0.35) Not recorded 0 (0.00) 1 (0.35) 1 (0.18) Pedestrian Looking Didn't look 1 (0.36) 1 (0.35) 2 (0.35) Looked one way 51 (18.35) 3 (1.05) 54 (9.57) Looked both ways 218 (78.42) 207 (72.38) 425 (75.35) Looked more than 2 times 5 (1.8) 74 (25.87) 79 (14.01) Not recorded 3 (1.08) 1 (0.35) 4 (0.71) Pedestrian Pace Slow 5 (1.8) 0 (0) 5 (1.8) Normal 230 (82.73) 96 (33.57) 326 (116.3) Fast 11 (3.96) 36 (12.59) 47 (16.55) Ran 18 (6.47) 124 (43.36) 142 (49.83) Not recorded 14 (5.04) 29 (10.14) 43 (15.18) Fisher's Exact Test (p=0.2632) Fisher's Exact Test (p<0.0001) Fisher's Exact Test (p<0.001) Driver Behavior / Traffic Total Vehicle Exposure Lane Gaps 0 32 (11.51) 1 (0.35) 33 (5.83) 1 63 (22.66) 2 (0.69) 65 (11.48) 2 85 (30.58) 16 (5.56) 101 (17.84) 3 61 (21.94) 49 (17.01) 110 (38.95) 4 37 (13.31) 220 (76.39) 257 (19.43) Immediate Yields 0 38 (13.67) 229 (79.51) 267 (47.17) 1 68 (24.46) 42 (14.58) 110 (19.43) 2 94 (33.81) 15 (5.21) 109 (19.26) 3 51 (18.35) 1 (0.35) 52 (9.19) 4 27 (9.71) 1 (0.35) 28 (4.95) Multiple Threat Scenarios (95.32) 284 (98.61) 549 (97.86) 1 8 (2.90) 4 (1.39) 12 (2.14) Chi square (p<0.0001) Chi square (p<0.0001) Chi square (p=0.214) 25
31 Final Report Driver/Pedestrian Behavior at Marked and Unmarked Crosswalks at Uncontrolled Crossings in the Tahoe Basin Summary of Statistically Significant Findings, Bear versus Deer: Pedestrians in the unmarked crosswalk were more likely than pedestrians in the marked crosswalk to be teens. Pedestrians in the unmarked crosswalk were more likely than pedestrians in the marked crosswalk to be male. Pedestrians in the unmarked crosswalk were more likely than pedestrians in the marked crosswalk to run when crossing. Pedestrians in the unmarked crosswalk were more likely to be assertive than pedestrians in the marked crosswalk Pedestrians in the unmarked crosswalk were more likely than pedestrians in the marked crosswalk to look two or more times. Pedestrians in the unmarked crosswalk were more likely than pedestrians in the marked crosswalk to wait for larger gaps in traffic before crossing. Pedestrians in the unmarked crosswalk were less likely than pedestrians in the unmarked crosswalk to have drivers immediately yield the right-of-way to them. COMPARISON 3: ONYX STREET (MARKED) VERSUS CARNELIAN WOODS (UNMARKED) Descriptive Statistics: TABLE 6 Pedestrian and Driver Behavior by Crosswalk Type, Onyx versus Carnelian Woods Onyx (Marked) n (column %) Carnelian Woods (Unmarked) N (column %) Total N (column %) Pedestrians p-value Age Fisher's Exact Test (p=0.1214) Child 3 (1.21) 2 (0.86) 5 (1.04) Teen 20 (8.06) 8 (3.45) 28 (5.83) Young adult 98 (39.52) 84 (36.21) 182 (37.92) Older adult 122 (49.19) 135 (58.19) 257 (53.54) Elderly 5 (2.02) 3 (1.29) 8 (1.67) Sex Fisher's Exact Test (p=0.1214) Male 146 (58.57) 158 (68.1) 304 (63.33) Female 102 (41.13) 74 (31.90) 176 (36.67) 26
32 Final Report Driver/Pedestrian Behavior at Marked and Unmarked Crosswalks at Uncontrolled Crossings in the Tahoe Basin Analysis Results: TABLE 7 Pedestrian and Driver Behavior by Crosswalk Type, Onyx versus Carnelian Woods Onyx (Marked) n (column %) Carnelian Woods (Unmarked) n (column %) Total N (column %) p-value Pedestrian Behavior Assertiveness Waited on curb 69 (27.82) 28 (12.07) 97 (20.21) Waited on street 114 (45.97) 117 (50.43) 231 (48.13) Did not wait 65 (26.21) 86 (37.07) 151 (31.46) Forced driver to yield 0 (0) 1 (0.43) 1 (0.21) Looking Pace Didn't look 3 (1.21) 0 (0) 3 (0.63) Looked one way 226 (91.13) 203 (87.5) 429 (89.38) Looked both ways 18 (7.26) 25 (10.78) 43 (8.96) Looked more than 2 times 1 (0.4) 4 (1.72) 5 (1.04) Slow 6 (2.42) 2 (0.86) 8 (1.67) Normal 169 (68.15) 110 (47.41) 279 (58.13) Fast 22 (8.87) 43 (18.53) 65 (13.54) Ran 26 (10.48) 52 (22.41) 78 (16.25) Not Recorded 25 (10.08) 25 (10.78) 50 (10.42) Fisher's Exact Test (p<0.0001) Fisher's Exact Test (p=0.079) Chi Square (p=0.0359) Driver Behavior / Traffic Total Vehicle Exposure Lane Gaps 0 47 (18.95) 5 (2.16) 52 (10.83) 1 80 (32.26) 37 (15.95) 117 (24.38) (48.79) 190 (81.9) 311 (64.79) Immediate Yields (60.89) 213 (91.81) 364 (75.83) 1 87 (35.08) 19 (8.19) 106 (22.08) 2 10 (4.03) 0 (0) 10 (2.08) Chi square (p<0.001) Chi square (p<0.001) Summary of Statistically Significant Findings, Onyx versus Carnelian Woods: Pedestrians in the unmarked crosswalk were more likely than pedestrians in the marked crosswalk to run when crossing. Pedestrians in the unmarked crosswalk were more likely to be assertive than pedestrians in the marked crosswalk 27
33 Final Report Driver/Pedestrian Behavior at Marked and Unmarked Crosswalks at Uncontrolled Crossings in the Tahoe Basin Pedestrians in the unmarked crosswalk were more likely than pedestrians in the marked crosswalk to wait for larger gaps in traffic before crossing. Pedestrians in the unmarked crosswalk were less likely than pedestrians in the unmarked crosswalk to have drivers immediately yield the right-of-way to them. COMPARISON 4: GRANLIBAKKEN STREET VERSUS PINE STREET (UNMARKED) Descriptive Statistics: TABLE 8 Pedestrian and Driver Behavior by Crosswalk Type, Granlibakken versus Pine Granlibakken (Marked) n (column %) Pine (Unmarked) n (column %) Total N (column %) p-value Pedestrians Age Fisher's Exact Test (p<0.001) Child 2 (0.88) 5 (2.82) 7 (1.73) Teen 9 (3.96) 11 (6.21) 20 (4.95) Young adult 61 (26.87) 79 (44.63) 140 (34.65) Older adult 142 (62.56) 76 (42.94) 218 (53.96) Elderly 12 (5.29) 6 (3.39) 18 (4.46) Not recorded 1 (0.44) 0 (0.00) 1 (0.25) Sex Fisher's Exact Test (p<0.001) Male 97 (42.73) 105 (59.32) 202 (50) Female 129 (56.83) 72 (40.68) 201 (50) Analysis Results: TABLE 9 Pedestrian and Driver Behavior by Crosswalk Type, Granlibakken versus Pine Granlibakken (Marked) n (column %) Pine (Unmarked) n (column %) Total N (column %) p-value Pedestrian Assertiveness Waited on curb 173 (76.21) 57 (32.2) 230 (56.93) Waited on street 13 (6.17) 53 (29.94) 67 (16.58) Did not wait 39 (17.18) 67 (37.85) 106 (26.24) Forced driver to yield 1 (0.44) 0 (0.00) 1 (0.25) Fisher's Exact Test (p<0.001) Pedestrian Looking Didn't look 2 (0.88) 0 (0.00) 2 (0.50) Looked one way 12 (5.29) 1 (1.00) 13 (3.00) Fisher's Exact Test (p<0.001) 28
34 Final Report Driver/Pedestrian Behavior at Marked and Unmarked Crosswalks at Uncontrolled Crossings in the Tahoe Basin Looked both ways 138 (60.79) 102 (57.63) 240 (59.41) Looked more than 2 times Pedestrian Pace 75 (33.04) 74 (41.81) 149 (36.88) Slow 2 (0.88) 0 (0.00) 2 (0.00) Normal 108 (48.00) 107 (60.45) 215 (53.22) Fast 45 (19.82) 11 (6.21) 56 (14.00) Ran 33 (14.54) 26 (14.69) 59 (14.60) Not recorded 39 (17.18) 33 (18.64) 72 (17.82) Fisher's Exact Test (p<0.001) Driver Behavior / Traffic Total Vehicle Exposure Lane Gaps 0 70 (30.84) 1 (0.56) 71 (17.57) 1 93 (40.97) 13 (7.34) 106 (26.24) 2 64 (28.19) 163 (92.09) 227 (56.19) Immediate Yields 0 80 (35.24) 167 (94.35) 247 (61.14) (44.49) 9 (5.08) 110 (27.23) 2 46 (20.26) 1 (0.56) 47 (11.63) Chi square (p<0.001) Chi square (p<0.001) Summary of Statistically Significant Findings, Granlibakken versus Pine: Pedestrians in the unmarked crosswalk were more likely than pedestrians in the marked crosswalk to be young adults. Pedestrians in the unmarked crosswalk were more likely than pedestrians in the marked crosswalk to be male. Pedestrians in the marked crosswalk were more likely than pedestrians in the unmarked crosswalk to run when crossing. (It should be noted that a high number of pedestrians did not have an observed pace in this data set.) Pedestrians in the unmarked crosswalk were more likely to be assertive than pedestrians in the marked crosswalk Pedestrians in the unmarked crosswalk were more likely than pedestrians in the marked crosswalk to look two or more times. Pedestrians in the unmarked crosswalk were more likely than pedestrians in the marked crosswalk to wait for larger gaps in traffic before crossing. Pedestrians in the unmarked crosswalk were less likely than pedestrians in the unmarked crosswalk to have drivers immediately yield the right-of-way to them. 29
35 Final Report Driver/Pedestrian Behavior at Marked and Unmarked Crosswalks at Uncontrolled Crossings in the Tahoe Basin COMPARISON 5: SEQUOIA CROSSING (MARKED) VERSUS SUGAR PINE CROSSING (UNMARKED) Descriptive Statistics: TABLE 10 Pedestrian and Driver Behavior by Crosswalk Type, Sequoia versus Sugar Pine Sequoia (Marked) N (column %) Sugar Pine (Unmarked) n (column %) Total N (column %) Pedestrians p-value Age Fisher's Exact Test (p<.0001) Child 12 (3.47) 3 (1.16) 15 (2.48) Teen 23 (6.65) 17 (6.56) 40 (6.61) Young adult 170 (49.13) 21 (8.11) 191 (31.57) Older adult 137 (39.60) 215 (83.01) 352 (58.18) Elderly 3 (0.87) 3 (1.16) 6 (0.99) Not recorded 1 (0.29) 0 (0.00) 1 (0.17) Sex Fisher's Exact Test (p=0.0494) Male 186 (53.76) 161 (62.16) 347 (57.36) Female 159 (45.95) 98 (37.84) 257 (42.48) Analysis Results: TABLE 11 Pedestrian and Driver Behavior by Crosswalk Type, Sequoia versus Sugar Pine Sequoia (Marked) N (column %) Sugar Pine (Unmarked) N (column %) Total N (column %) p-value Pedestrian Assertiveness Waited on curb 2 (0.58) 1 (0.39) 3 (0.5) Waited on street 7 (2.02) 0 (0.00) 7 (1.16) Did not wait 297 (85.84) 192 (74.13) 489 (80.83) Forced driver to yield 33 (9.54) 66 (25.48) 99 (16.36) Not recorded 7 (2.02) 0 (0.00) 7 (1.16) Pedestrian Looking Didn't look 2 (0.58) 1 (0.39) 3 (0.5) Looked one way 7 (2.02) 0 (0) 7 (1.16) Looked both ways 297 (85.84) 192 (74.13) 489 (80.83) Looked more than 2 times 33 (9.54) 66 (25.48) 99 (16.36) Not recorded 7 (2.02) 0 (0.00) 7 (1.16) Pedestrian Pace Slow 1 (0.29) 10 (3.86) 11 (1.82) Normal 26 (7.51) 13 (5.02) 39 (6.45) Fisher's Exact Test (p<0.001) Fisher's Exact Test (p<0.001) Fisher's Exact Test (p<0.001) 30
36 Final Report Driver/Pedestrian Behavior at Marked and Unmarked Crosswalks at Uncontrolled Crossings in the Tahoe Basin Fast 189 (54.62) 75 (28.96) 264 (43.64) Ran 128 (36.99) 48 (18.53) 176 (29.09) Not recorded 0 (0.00) 113 (43.63) 113 (18.68) Driver Behavior / Traffic Total Vehicle Exposure Lane Gaps (30.35) 13 (5.02) 118 (19.50) (38.15) 36 (13.90) 168 (27.77) (31.50) 210 (81.08) 319 (52.73) Immediate Yields (41.33) 219 (84.56) 362 (59.83) (39.60) 32 (12.36) 169 (27.93) 2 66 (19.08) 8 (3.09) 74 (12.23) Chi square (p<0.001) Chi square (p<0.001) Bicyclist Behavior Rode Bicycle through Crosswalk Walked Bicycle through Crosswalk 190 (62.91) 157 (83.96) 347 (70.96) 112 (37.09) 30 (16.04) 142 (29.04) Chi square (p<0.0001) Summary of Statistically Significant Findings, Sequoia versus Sugar Pine: Pedestrians in the unmarked crosswalk were more likely than pedestrians in the marked crosswalk to be older adults. (Note this is more likely associated with land use differences.) Pedestrians in the unmarked crosswalk were more likely than pedestrians in the marked crosswalk to be male. Pedestrians in the unmarked crosswalk were more likely to be assertive than pedestrians in the marked crosswalk Pedestrians in the unmarked crosswalk were more likely than pedestrians in the marked crosswalk to look two or more times. Pedestrians in the marked crosswalk were more likely than pedestrians in the unmarked crosswalk to run when crossing. (It should be noted that a high number of pedestrians did not have an observed pace in this data set.) Pedestrians in the unmarked crosswalk were more likely than pedestrians in the marked crosswalk to wait for larger gaps in traffic before crossing. Pedestrians in the marked crosswalk were more likely than pedestrians in the unmarked crosswalk to have drivers immediately yield the right-of-way to them. Bicyclists in the marked crosswalk are more likely than bicyclists in the unmarked crosswalk to walk their bicycle when crossing the street. 31
37 Final Report Driver/Pedestrian Behavior at Marked and Unmarked Crosswalks at Uncontrolled Crossings in the Tahoe Basin SUMMARY OF STATISTICALLY SIGNIFICANT RESULTS ACROSS ALL STUDY LOCATIONS Several overall trends are evident from the study s comparison of pedestrian and driver behavior at nine uncontrolled crosswalks. These trends are summarized in Table 12 and discussed in detail below. Age Age was a statistically significant variable for the Fox/Deer, Bear/Deer, Pine/Granlibakken, and Sequoia/Sugar Pine pairs. In all but the Sequoia/Sugar Pine case, pedestrians in the unmarked crosswalk were more likely than pedestrians in the marked crosswalk to be teens or young adults, while pedestrians in the marked crosswalk were more likely than pedestrians in the unmarked crosswalk to be children or elderly. The pattern was different at Sequoia/Sugar Pine, but the different land uses at these sites (the Sugar Pine crossing connects a campground to the Lake while the Sequoia crossing is away from major destinations) may partially account for the difference in age groups using marked versus unmarked crosswalks. Gender Gender was a statistically significant variable for all but the Onyx/Carnelian comparison. For the four comparisons where it was statistically significant, pedestrians in the unmarked crosswalk were more likely than pedestrians in the marked crosswalk to be male. Assertiveness Pedestrian assertiveness was a statistically significant variable for the Onyx/Carnelian, Pine/Granlibakken, and Sequoia/Sugar Pine comparison sites. For these comparisons, pedestrians in the unmarked crosswalk were more likely than pedestrians in the marked crosswalk to be assertive, waiting in the street instead of on the curb before crossing. Looking Behavior Pedestrian looking behavior was a statistically significant variable for all but the Onyx/Carnelian comparison. For the four comparisons where it was statistically significant, pedestrians in the unmarked crosswalk were more likely than pedestrians in the marked crosswalk to look more than twice before crossing. Pace Pedestrian pace (walking speed) was a statistically significant variable for all five comparisons. At the three locations where a clear pattern is discernable (Fox/Deer, Bear/Deer, and Onyx/Carnelian), pedestrians in the unmarked crosswalk were more likely than pedestrians in the marked crosswalk to run when crossing. Gap Acceptance Gap acceptance was a statistically significant variable for all five comparisons. For all comparisons, pedestrians in the unmarked crosswalk were more likely than pedestrians in the marked crosswalk to wait for larger gaps in traffic before crossing. 32
38 Final Report Driver/Pedestrian Behavior at Marked and Unmarked Crosswalks at Uncontrolled Crossings in the Tahoe Basin Driver Yielding Driver yielding behavior (immediate yielding) was a statistically significant variable for all five comparisons. In all cases, pedestrians in the unmarked crosswalk were less likely than pedestrians in the marked crosswalk to have drivers immediately yield the right-of-way to them. Multiple Threat The incidence of multiple threat opportunities was a not a statistically significant variable for either of the two four-lane comparisons. For both comparisons, pedestrians in the marked crosswalks were involved in a potential multiple threat scenario more often than pedestrians in the unmarked crosswalk. However, this is not a statistically significant finding. The low traffic volumes on SR28 and SR89 may be associated with the lack of statistical significance. TABLE 12 Summary of Analysis Results Unmarked Crosswalks Compared to Marked Crosswalks Comparison Fox/ Deer Bear/Deer Onyx/ Carnelian Woods Granlibakken / Pine Sequoia/ Sugar Pine Lanes (midblock) Speed Limit 30 MPH 30 MPH 45 MPH 35 MPH Estimated Hourly Pedestrian Volume Number of Pedestrian Observations Age 35 MPH/ 40 MPH 50/25 100/25 5/10 5/20 55/5 276/ / / / /259 More Young Adults More Teens More Young Adults (excluded) Gender More Males More Males More Males More Males Assertiveness More Assertive More Assertive More Assertive Factors Looking More Looking More Looking More Looking More Looking Pace Faster Pace Faster Pace Faster Pace Gap More Gaps More Gaps More Gaps More Gaps More Gaps Yield Less Yielding Less Yielding Less Yielding Less Yielding Less Yielding Multiple Threat DISCUSSION AND INTERPRETATION OF FINDINGS These study results generally apply to two- and three-lane roads as well as four-lane roads. They also apply to the midblock crossings. However, the differences in marked versus unmarked crosswalks do illustrate that a faster crossing pace is more associated with the multi-lane unmarked crossings versus the marked comparisons, whereas assertiveness is greater for the two and three-lane unmarked crossings versus the marked comparisons. 33
39 Final Report Driver/Pedestrian Behavior at Marked and Unmarked Crosswalks at Uncontrolled Crossings in the Tahoe Basin As with the previous crosswalk study in the San Francisco Bay Area, differences in pedestrian behavior in this study suggest pedestrians exhibit an enhanced level of caution (looking more than two ways, waiting for gaps in traffic, and hurrying across the street) when crossing in unmarked crosswalks compared to crossing in marked crosswalks. This finding is particularly robust in terms of looking behavior and gap acceptance, although it is also evident for pace and assertiveness. Also similar to the San Francisco study, results from this study suggest that drivers yield more frequently to pedestrians in marked crosswalks compared to unmarked crosswalks. This finding is likely at least partially explained by previous studies that illustrate differences in the knowledge of the right-of-way law with respect to marked and unmarked crosswalks. Table 13 presents a comparison of the San Francisco study results with the Lake Tahoe study results for the key variables: TABLE 13 Comparison of Analysis Results San Francisco versus Lake Tahoe Study Age Gender Comparison Variable Assertiveness Looking Pace Gap Yield Multiple Threat San Francisco Unmarked versus Marked Crosswalks 1 of 6 comparisons significant: more teens (multi-lane only) 3 of 6 comparisons significant: more males 1 of 6 comparisons significant: more assertive (multi-lane only) 2 of 6 comparisons significant: more looking 4 of 6 comparisons significant: faster pace 5 of 6 comparisons significant: more gaps 6 of 6 comparisons significant: less yielding 3 of 5 comparisons significant: less multiple threat Lake Tahoe Unmarked versus Marked Crosswalks 3 of 5 comparisons significant: more teens/young adults 4 of 5 comparisons significant: more males 3 of 5 comparisons significant: more assertive (two and three-lane only) 4 of 5 comparisons significant: more looking 5 of 5 comparisons significant: 3 are faster pace (multi-lane only) and 2 are not definitive 5 of 5 comparisons significant: more gaps 5 of 5 comparisons significant: less yielding 0 of 2 comparisons significant The primary difference in the two studies is with respect to the multiple threat variable. The incidence of multiple threat opportunities was a statistically significant variable at three of the five multi-lane observation sites for the San Francisco study, including three of the four sites with four or more lanes, and both sites with median refuges. The variable was not statistically significant for the Lake Tahoe study. The most likely explanation for this is the low traffic volumes at the four-lane crosswalks. Observations and discussions with Caltrans staff indicate volumes are likely not sufficient to warrant a four-lane facility. A road diet has previously been proposed for this section in Kings Beach for this reason. With low traffic volumes, the pedestrian observation sample size may have been insufficient to detect any potential significant difference in this variable at marked versus unmarked locations. The data does illustrate a trend in greater multiple threat incidences at marked crosswalks. The primary finding for this study is that the statistically significant trends demonstrated between marked and unmarked crosswalks in the San Francisco urban/suburban study hold for the rural/recreational context at Lake Tahoe. For this reason, the recommendations for engineering, education, and enforcement presented in the San Francisco study are likely applicable for this context as well and thus for Caltrans in general. 34
40 Final Report Driver/Pedestrian Behavior at Marked and Unmarked Crosswalks at Uncontrolled Crossings in the Tahoe Basin ACKNOWLEDGEMENTS The primary authors of this study are Meghan Mitman and Brooke DuBose of Fehr & Peers. The authors acknowledge the significant contributions of Doug Cooper (UC Berkeley Traffic Safety Center) and Damion Farley (Caltrans) for the study design, the UNR students led by Lynwood "LJ" Johnson for the data collection efforts, and Swati Pande (UC Berkeley Traffic Safety Center) for the statistical data analysis. 35
41 Final Report Driver/Pedestrian Behavior at Marked and Unmarked Crosswalks at Uncontrolled Crossings in the Tahoe Basin REFERENCES (1) National Highway Traffic Safety Administration, National Center for Statistics and Analysis. Traffic Safety Facts: 2007 Data. U.S. Department of Transportation, SF/2007/ pdf. Accessed March 9, 2009 (2) Herms, Bruce, Pedestrian Crosswalk Study: Accidents in Painted and Unpainted Crosswalks, City of San Diego, 1972 (3) Gibby, A. Reed, Evaluation of Marked and Unmarked Crosswalks at Intersections in California, California State University, Chico, 1994 (4) Campbell, B.J., Marked Crosswalks and Safety, University of North Carolina Highway Safety Research Center, 1997 (5) Zegeer, C.V., J.R. Stewart, H.H. Huang and RA. Lagerwey. "Safety Effects of Marked vs. Unmarked Crosswalks at Uncontrolled Locations: Executive Summary and Recommended Guidelines." Report No. FHWA-RD Washington, DC, USA: Federal Highway Administration, March Accessed March 9, (6) Fitzpatrick, Kay, et al... Improving Pedestrian Safety at Uncontrolled Crossings. TCRP Report 112/NCHRP Report Accessed March 9, 2009 (7) Knoblauch, R.L., Nitzburg, M., & Seifert, R.L. Pedestrian Crosswalk Case Studies: Richmond, Virginia; Buffalo, New York; Stillwater, Minnesota, Center for Applied Research, for Federal Highway Administration, 2001 (8) Nitzburg, Marsha and Richard L. Knoblauch, An Evaluation of High-Visibility Crosswalk Treatment Clearwater, Florida, FHWA-RD , 2001 (9) Hauck, J. Well-Marked Crosswalks are a Pedestrian's Best Friend, Rural and Urban Roads, Vol. 17, No. 3, March 1979, cited in Campbell, B.J., Marked Crosswalks and Safety, University of North Carolina Highway Safety Research Center, 1997 (10) Mitman, M., D. Ragland, and C. Zegeer. The Marked Crosswalk Dilemma: Uncovering Some Missing Links in a 35-Year Debate. Transportation Research Record, (11) Ivan, J.H., Garder, P. and Zajac, S.S. Finding Strategies to Improve Pedestrian Safety in Rural Areas. Connecticut Transportation Institute. October, Accessed on March 9, (12) Hall, J.W., Brogan, J.D. and Kondreddi, M. Pedestrian Safety on Rural Highways. University of New Mexico, FHWA-SA , September, Accessed March 9,
42 Final Report Driver/Pedestrian Behavior at Marked and Unmarked Crosswalks at Uncontrolled Crossings in the Tahoe Basin APPENDIX A DATA COLLECTION PROTOCOL AND FORM 37
43 Final Report Driver/Pedestrian Behavior at Marked and Unmarked Crosswalks at Uncontrolled Crossings in the Tahoe Basin LAKE TAHOE CROSSWALK STUDY DATA COLLECTION PROTOCOL Observations Observers should make every effort to be inconspicuous to drivers and pedestrians in the intersection. Observers may sit in a chair or car if observations are not obstructed. Refer to the attached maps and diagrams for driving directions and suggested parking locations. Definitions and Key Points Place an X in any field that was missed for each entry (row). Ped crossing direction: this indicates the direction of the crossing from one curb to the opposite. Refer to the respective intersection diagram for direction references. Ped level assert: this is the position/action of the ped immediately before she begins crossing the street (0=wait on curb/ outside crosswalk; 1=wait on street/ inside crosswalk; 2=no wait (includes slowing pace but not stopping); 3=force driver to yield) Ped look behavior: this is the behavior of the ped before she enters the first lane of vehicle traffic as she is crossing Driver Behavior o o o o o o Lane 1 is the first lane the ped enters when crossing. Lane C refers to a center turning lane. Note N/A for any lane number not relevant at a given location. Place a Y if the first driver the pedestrian encounters yields (this is an immediate yield ) in each lane. Yielding is defined as a driver slowing or stopping to allow a pedestrian to cross in front of the vehicle. If there is not an immediate yield (meaning the pedestrian must wait until the 2 nd, 3 rd, etc. vehicle has passed before she can cross): Record Wn if the pedestrian waits for n vehicles and then proceeds with a gap in traffic after the nth car passes in that lane. Note that W3 would indicate the ped waited for three vehicles to pass (none yielding) and then had a gap in that lane. Record Yn if the nth vehicle yields. Note that Y3 would indicate two vehicles did not yield but the third vehicle yielded. If no vehicle is present in the lane, or if a vehicle present in the lane is far enough back from the crosswalk that yielding is not necessary, record a 0 for no vehicle. 38
44 Final Report Driver/Pedestrian Behavior at Marked and Unmarked Crosswalks at Uncontrolled Crossings in the Tahoe Basin o o In the first lane the pedestrian will enter when crossing, place a U if the driver in that lane is unable to yield because the vehicle is too close to the crosswalk when the ped arrives, and thus the stopping distance required by the vehicle prevents the vehicle from yielding. 1 A U may accompanied by a Wn or Yn (i.e., UW2) to indicate the actions of subsequent vehicles (if any). A U by itself implies the first vehicle was unable to yield and a gap in traffic followed. Driver Speeding: Note the lane number of any drivers who appear to be speeding. This will be recorded in the database as percentage of drivers speeding for this observation event. Ped age: Determine approximate age range with the following designations: o C: child (ages: less than 13) o T: teen (ages: 13 to 18) o YA: younger adult (ages: 19-35) o OA: older adult (ages: 36-64) o E: elderly (ages 65+) 2 Ped Pace: Ran is defined as ran at all during the crossing. 3 Bicycle: note if someone rode or walked their bicycle across crosswalk ( rode, walked, or N/A ) Group: A group is defined as 2 or more people crossing together. They may or may not have arrived at the intersection together. Observe and record only the actions and interactions of the group leader (usually the first pedestrian in a group; randomly choose one pedestrian to observe if crossing side-by-side). Note the group size in the group size column. Both Directions: note if pedestrians crossed in both directions simultaneously Evasive: Note whether or not the pedestrian made any evasive maneuvers (such as stopping/turning around in the middle of crossing to allow a vehicle to pass or running to complete crossing before an approaching vehicle gets too close). Baby: note if the ped was pushing a stroller or carrying a baby 1 Where possible, a flag or other marker should be placed in advance of the crosswalk to note required stopping distance based on the roadway speed and geometry. If this marker is present, record U when the vehicle is beyond the marker when a pedestrian arrives at the crosswalk. 2 We may remove this variable (subjective) if needed 3 We may remove this variable (subjective) if needed 39
45 Final Report Driver/Pedestrian Behavior at Marked and Unmarked Crosswalks at Uncontrolled Crossings in the Tahoe Basin Assistive Device: enter cane, wheelchair, or other assistive device Notes: include any additional notes to describe the event (including use of a flag) Logistics Materials required: observation form, clip board, pen/pencil, protocol, intersection diagram Observation periods should be at least 2 hours. Choose the location and time period you will observe and post this on the Google Crosswalk Schedule at least 24 hours in advance ( Begin a new sheet with each new observation period (make sure to complete the date and time fields at the top). Enter number of peds observed and cumulative number of peds at the intersection into the Google Schedule after completing an observation period. We will conclude observations when 150 ped entries have been recorded for each marked crosswalk (we will do these first). For the unmarked crosswalks, we will conclude when at least 60 pedestrians have been observed (but ideally also 150). At the end of each observation period, type the observations into the master database. Have another observer perform a quality control check of your entries versus your field notes. Scan your observation form as a PDF and to Doug Cooper. the master database to Doug at the completion of the observations. Any questions, contact: Meghan Mitman at m.mitman@fehrandpeers.com or Doug Cooper at dcooper@berkeley.edu or

46 Final Report Driver/Pedestrian Behavior at Marked and Unmarked Crosswalks at Uncontrolled Crossings in the Tahoe Basin 41
PEDESTRIAN SAFETY IMPROVEMENT EVALUATION GUIDELINE FOR UNCONTROLLED CROSSINGS
 PEDESTRIAN SAFETY IMPROVEMENT EVALUATION GUIDELINE FOR UNCONTROLLED CROSSINGS Traffic Safety Engineering Division Updated: April 2018 EXECUTIVE SUMMARY NDOT Traffic Safety Engineering Division developed
IMPROVING PEDESTRIAN SAFETY AT UNCONTROLLED CROSSINGS. Guidelines for Marked Crosswalks
 IMPROVING PEDESTRIAN SAFETY AT UNCONTROLLED CROSSINGS Presented by Nazir Lalani P.E. Traffex Engineers Inc. N_lalani@hotmail.com Guidelines for Marked Crosswalks Source: FHWA, Safety Effects of Marked
MEMORANDUM. Date: 9/13/2016. Citywide Crosswalk Policy
 MEMORANDUM Date: 9/13/2016 Re: Citywide Crosswalk Policy Foreword Through the s Circulation Element and Complete Streets Policy, it is the City s goal to promote walking trips and provide safe facilities
Improving Pedestrian Safety at Unsignalized Crossings. Shawn Turner, P.E. Texas A&M Transportation Institute
 Improving Pedestrian Safety at Unsignalized Crossings Shawn Turner, P.E. Texas A&M Transportation Institute Overview of Presentation What are the issues/problems? Framework for crossing treatments Marked
Safety Benefits of Raised Medians and Pedestrian Refuge Areas. FHWA Safety Program.
 Safety Benefits of Raised Medians and Pedestrian Refuge Areas FHWA Safety Program http://safety.fhwa.dot.gov There s a signal up the block, but looking left there s a gap in traffi c. Looking right there
City of Albert Lea Policy and Procedure Manual 4.10 ALBERT LEA CROSSWALK POLICY
 4.10 ALBERT LEA CROSSWALK POLICY PURPOSE: Pedestrian crosswalks are an integral part of our transportation infrastructure. To be effective and promote safety, marked crosswalks must be installed after
Appendix A: Crosswalk Policy
 Appendix A: Crosswalk Policy Appendix A: Crosswalk Policy Introduction This citywide Crosswalk Policy is aimed at improving pedestrian safety and enhancing pedestrian mobility by providing a framework
Designing for Pedestrian Safety
 Designing for Pedestrian Safety Treatments at Unsignalized Pedestrian Crossings Presented by: Charlie Zegeer PBIC Director August 17, 2010 Crossing Crashes Part 1: General Principles 3 2 Why do people
UNCONTROLLED PEDESTRIAN CROSSING GUIDELINES
 City and County of Denver UNCONTROLLED PEDESTRIAN CROSSING GUIDELINES Prepared for: Prepared by: Adopted September 2016 This page is intentionally left blank. Contents for Denver Uncontrolled Pedestrian
Appendix A. Knoxville TPO Greenway Signage Guidelines. Appendix A: Knoxville TPO Greenway Signage Guidelines Knox to Oak Ridge Greenway Master Plan
 Appendix A Knoxville TPO Greenway Signage Guidelines 75 Overview: Adequate signing and marking are essential on shared-use paths, especially to alert bicyclists to potential conflicts and to convey regulatory
MEMORANDUM. Charlotte Fleetwood, Transportation Planner
 MEMORANDUM Date: Updated August 22, 2017 To: Organization: Charlotte Fleetwood, Transportation Planner Boston Transportation Department From: Jason DeGray, P.E., PTOE, Regional Director of Engineering
Designing for Pedestrian Safety in Washington, DC
 Designing for Pedestrian Safety in Washington, DC February 25, 2014 George Branyan Pedestrian Program Coordinator District Department of Transportation DC Journey to work mode split: 2012 Means of Transportation
Addendum to SDDCTEA Pamphlet 55 17: Better Military Traffic Engineering Revision 1 Effective: 24 Aug Crosswalk Guidelines
 Addendum to SDDCTEA Pamphlet 55 17: Better Military Traffic Engineering Revision 1 Effective: 24 Aug 2017 Crosswalk Guidelines Warrants for Uncontrolled Crosswalk Locations Crosswalks at Midblock Locations
FEDERAL HIGHWAY ADMINISTRATION APPLICATION
 FEDERAL HIGHWAY ADMINISTRATION APPLICATION REQUEST FOR PERMISSION TO EXPERIMENT WITH A BICYCLE BOX INTERSECTION TREATMENT Submitted by: City of Columbus Department of Public Service Date: June 26, 2009
GLOSSARY CROSSWALK. CROSSING TYPES
 CROSSWALK The part of a roadway at an intersection included within the connections of the lateral lines of the sidewalks on opposite sides of the street measured from the curbs, or in the absence of curbs
NJDOT Complete Streets Checklist
 Background The New Jersey Department of Transportation s Complete Streets Policy promotes a comprehensive, integrated, connected multi-modal network by providing connections to bicycling and walking trip
Bicycle Boulevards and Neighborhood Greenways
 Bicycle Boulevards and Neighborhood Greenways Traffic Safety is Improving for Everyone 90 80 70 60 50 40 30 20 10 0 PORTLAND: TOTAL TRAFFIC FATALITIES 1986-2008 1986 1987 1988 1989 1990 1991 1992 1993
APPENDIX A: Complete Streets Checklist DRAFT NOVEMBER 2016
 APPENDIX A: Complete Streets Checklist DRAFT NOVEMBER 2016 Complete Streets Checklist MetroPlan Orlando s Complete Streets Checklist is an internal planning tool for staff to further implementation of
Agenda. Overview PRINCE GEORGE S PLAZA METRO AREA PEDESTRIAN PLAN
 PRINCE GEORGE S PLAZA METRO AREA PEDESTRIAN PLAN May 28, 2008 Agenda Welcome and introductions Project overview and issue identification Planning context and strengths Design challenges and initial recommendations
Development of Arlington County s Marked Crosswalk Guidelines. Jon Lawler, P.E. Design Engineer Arlington County, VA
 Development of Arlington County s Marked Crosswalk Guidelines Jon Lawler, P.E. Design Engineer Arlington County, VA April 13, 2015 Transportation System Users Residents Estimated 215,000 in 2014 Lowest
The DC Pedestrian Master Plan
 The DC Pedestrian Master Plan September 28, 2010 George Branyan Pedestrian Program Coordinator District Department of Transportation Presentation Agenda Scope of the Plan Methodology Recommendations Implementation
Safety and Guidelines for Marked and Unmarked Pedestrian Crosswalks at Unsignalized Intersections in Nevada
 NDOT Research Report Report No. 284-10-803 Safety and Guidelines for Marked and Unmarked Pedestrian Crosswalks at Unsignalized Intersections in Nevada September 2012 Nevada Department of Transportation
Caltrans Sloat Boulevard Pedestrian Safety Project Response to Community Questions, Comments & Concerns
 Caltrans Sloat Boulevard Pedestrian Safety Project Response to Community Questions, Comments & Concerns Revised: May 10, 2016 The California Department of Transportation (Caltrans) is planning various
Unit Six: Driving Faster with More Risk URBAN, SUBURBAN, AND RURAL DRIVING
 Unit Six: Driving Faster with More Risk URBAN, SUBURBAN, AND RURAL DRIVING What Is The Impact Of Distraction? Objectives For Unit Six Students will be able to describe the skills necessary to What safely
SCHOOL CROSSING PROTECTION CRITERIA
 CITY OF MADISON TRAFFIC ENGINEERING SCHOOL CROSSING PROTECTION CRITERIA January 2016 Adopted as Policy on August 31, 1976, by Common Council by Amended Resolution #29,540 Amended on September 14, 1976,
TODAY S WEBINAR AGENDA
 TODAY S WEBINAR AGENDA 3:00 pm: Introduction 3:05 pm: Presentation 3:45 pm: Questions 4:00 pm: Webinar Ends For technical assistance during the webinar: 1-800-263-6317 Choose these prompts: 1, 1, 1 CONTINUING
Broadway Street Pedestrian Safety Study Cass Street to 700 Feet North of Randall Avenue
 Broadway Street Pedestrian Safety Study Cass Street to 700 Feet North of Randall Avenue Prepared for: City of De Pere, Wisconsin Prepared by: June, 2017 Broadway Street Pedestrian Safety Study Cass Street
A Study of Effectiveness of Midblock Pedestrian Crossings: Analyzing a Selection of High-Visibility Warning Signs
 : Analyzing a Selection of High-Visibility Warning Signs Rebekka Apardian Bhuiyan Monwar Alam Associate Professor, Department of Geography & Planning, The University of Toledo, Abstract The purpose of
A MOTORIST AND PEDESTRIAN BEHAVIORAL ANALYSIS RELATING TO PEDESTRIAN SAFETY IMPROVEMENTS
 Final Report Research Project T1803, Task 16 Pedestrian Safety A MOTORIST AND PEDESTRIAN BEHAVIORAL ANALYSIS RELATING TO PEDESTRIAN SAFETY IMPROVEMENTS by Jennifer Nee Research Engineer Mark E. Hallenbeck
Pedestrian Crash Types
 North Carolina Pedestrian Crash Types 2006-2010 Prepared for The North Carolina Department of Transportation Division of Bicycle and Pedestrian Transportation Prepared by The University of North Carolina
California Manual on Uniform Traffic Control Devices
 California Manual on Uniform Traffic Control Devices FHWA s MUTCD 2009 Edition as amended for use in California 2012 Edition State of California Business, Transportation and Housing Agency Department of
Pedestrian & Bicycle Safety Innovations & Applications
 Pedestrian & Bicycle Safety Innovations & Applications County Engineers Association of Maryland Spring, 2017 Conference May 25, 2017 George Branyan Pedestrian Program Coordinator District Department of
Acknowledgements. Mr. David Nicol 3/23/2012. Daniel Camacho, P.E. Highway Engineer Federal Highway Administration Puerto Rico Division
 Daniel Camacho, P.E. Highway Engineer Federal Highway Administration Puerto Rico Division Acknowledgements Mr. David Nicol Director, FHWA Office of Safety FHWA Office of Safety http://safety.fhwa.dot.gov/provencountermeasures/
Pedestrian Hybrid Beacon Guide Recommendations and Case Study. FHWA Safety Program.
 Pedestrian Hybrid Beacon Guide ecommendations and Case Study FHWA Safety Program http://safety.fhwa.dot.gov A pedestrian hybrid beacon (PHB) is a traffic control device similar to a European pedestrian
CITY OF SARATOGA SPRINGS PEDESTRIAN CROSSING TOOLBOX
 CITY OF SARATOGA SPRINGS PEDESTRIAN CROSSING TOOLBOX This toolbox is to be used to guide pedestrian crossing improvements within the City of Saratoga Springs. Details for each crossing type are provided.
PEDESTRIAN COLLISIONS IN LOS ANGELES 1994 through 2000
 PEDESTRIAN COLLISIONS IN LOS ANGELES 1994 through 2000 City of Los Angeles Department of Transportation Gloria Jeff, General Manager March, 2006 This document printed with grant funds from the California
An Analysis of Reducing Pedestrian-Walking-Speed Impacts on Intersection Traffic MOEs
 An Analysis of Reducing Pedestrian-Walking-Speed Impacts on Intersection Traffic MOEs A Thesis Proposal By XIAOHAN LI Submitted to the Office of Graduate Studies of Texas A&M University In partial fulfillment
Guidance for Installation of Pedestrian Crosswalks on Michigan State Trunkline Highways
 Guidance for Installation of Pedestrian Crosswalks on Michigan State Trunkline Highways Michigan Department of Transportation July 7, 2014 Engineering Manual Preamble This manual provides guidance to administrative,
Town of Mooresville, North Carolina Neighborhood Traffic Calming and Control Device Policy
 Town of Mooresville, North Carolina Neighborhood Traffic Calming and Control Device Policy Adopted January 6, 2014 Town of Mooresville Development Services Department TOWN OF MOORESVILLE NEIGHBORHOOD TRAFFIC
Traffic Safety Barriers to Walking and Bicycling Analysis of CA Add-On Responses to the 2009 NHTS
 Traffic Safety Barriers to Walking and Bicycling Analysis of CA Add-On Responses to the 2009 NHTS NHTS Users Conference June 2011 Robert Schneider, Swati Pande, & John Bigham, University of California
An Evaluation of High-Visibility Crosswalk Treatment - Clearwater, Florida
 An Evaluation of High-Visibility Crosswalk Treatment - Clearwater, Florida REPORT NO. FHWA-RD-00-105 August 2001 U.S. Department of Transportation Federal Highway Administration Research, Development,
Broad Street Bicycle Boulevard Design Guidelines
 Broad Street Bicycle Boulevard Design Guidelines Building from the strategies introduced in the 2013 Bicycle Transportation Plan and community input received thus far, City Transportation Staff have identified
Access Location, Spacing, Turn Lanes, and Medians
 Design Manual Chapter 5 - Roadway Design 5L - Access Management 5L-3 Access Location, Spacing, Turn Lanes, and Medians This section addresses access location, spacing, turn lane and median needs, including
Pedestrian Safety at Interchanges
 Countermeasure Strategies for Pedestrian Safety Pedestrian Safety at Interchanges Meghan Mitman Fehr and Peers December 10, 2015 Today s Presentation Introduction and housekeeping Audio issues? Dial into
Military Road Safety Improvements
 Military Road Safety Improvements 26 th Road North to 31 st Street North SUMMARY OF DATA REVIEW AND PRELIMINARY RECOMMENDATIONS Prepared for: Department of Environmental Services Traffic Engineering and
Chapter 5 DATA COLLECTION FOR TRANSPORTATION SAFETY STUDIES
 Chapter 5 DATA COLLECTION FOR TRANSPORTATION SAFETY STUDIES 5.1 PURPOSE (1) The purpose of the Traffic Safety Studies chapter is to provide guidance on the data collection requirements for conducting a
DEFINITIONS Activity Area - Advance Warning Area Advance Warning Sign Spacing Advisory Speed Approach Sight Distance Attended Work Space
 DEFINITIONS Activity Area - that part of a TTC zone activity area where the work actually takes place. It consists of the work space, traffic space and one or more buffer spaces. Advance Warning Area -
CHAPTER 5 LITERATURE REVIEW
 CHAPTER 5 LITERATURE REVIEW This task includes identification of suitable pedestrian safety countermeasures for research at high pedestrian crash sites in high risk zones. Pedestrian Safety Countermeasures
PEDESTRIAN ACCOMMODATIONS DPS 201 AT ROUNDABOUTS
 PEDESTRIAN ACCOMMODATIONS DPS 201 AT ROUNDABOUTS WHY THEY WORK FOR PEDESTRIANS IF DESIGNED CORRECTLY Separated sidewalks direct peds to crosswalks Splitter island Slow speed exit Truck apron Crosswalk
POTENTIAL PEDESTRIAN SAFETY IMPROVEMENT EVALUATION GUIDELINE
 POTENTIAL PEDESTRIAN SAFETY IMPROVEMENT EVALUATION GUIDELINE Traffic Safety Engineering Division Updated: August 2016 EXECUTIVE SUMMARY During the February 2015 Transportation Board meeting, Governor Brian
City of Vallejo Traffic Calming Toolbox
 City of Vallejo Traffic Calming Toolbox June 1, 2013 Final Table of Contents Introduction... 1 Non-Physical Devices... 3 High-Visibility Crosswalk... 3 In Pavement Lighted Crosswalk... 4 Rapid Flashing
SCHOOL CROSSING PROTECTION CRITERIA
 CITY OF MADISON TRAFFIC ENGINEERING SCHOOL CROSSING PROTECTION CRITERIA AUGUST 1990 Adopted as Policy on August 31, 1976, by Common Council by Amended Resolution #29,540 Amended on September 14, 1976,
At each type of conflict location, the risk is affected by certain parameters:
 TN001 April 2016 The separated cycleway options tool (SCOT) was developed to partially address some of the gaps identified in Stage 1 of the Cycling Network Guidance project relating to separated cycleways.
DEPARTMENT OF ENVIRONMENTAL SERVICES. North Harrison Street (Lee Highway to Little Falls Road) Comparative Analysis. Prepared for:
 Comparative Analysis. Prepared for:") DEPARTMENT OF ENVIRONMENTAL SERVICES North Harrison Street (Lee Highway to Little Falls Road) Comparative Analysis Prepared for: Arlington County Department of Environmental Services 2100 Clarendon Boulevard,
DEPARTMENT OF ENVIRONMENTAL SERVICES North Harrison Street (Lee Highway to Little Falls Road) Comparative Analysis Prepared for: Arlington County Department of Environmental Services 2100 Clarendon Boulevard,
Chapter 5: Crossing the Street
 Chapter 5: Crossing the Street Whether walking or bicycling, a student s journey to school will more than likely require crossing one or more streets. Per the Safe Routes to School Guide, maintained by
Bicyclist Signing Guidelines
 Bicyclist Signing Guidelines April, 2009 1 Introduction This paper describes the Montana Department of Transportation s (MDT) current practices related to bicyclist safety and signing issues and presents
Access Management in the Vicinity of Intersections
 Access Management in the Vicinity of Intersections FHWA-SA-10-002 Technical Summary Photo: Ralph Bentley (used with permission) 0 Access Management is: The design, implementation and management of entry
Off-road Trails. Guidance
 Off-road Trails Off-road trails are shared use paths located on an independent alignment that provide two-way travel for people walking, bicycling, and other non-motorized users. Trails specifically along
REDUCING COLLISIONS AT HIGH CRASH LOCATIONS
 REDUCING COLLISIONS AT HIGH CRASH LOCATIONS Presented by Nazir Lalani P.E. Traffex Engineers Inc. N_lalani@hotmail.com ACCIDENTS AND SAFETY Why is safety important? Safety components Who is responsible?
DISTRIBUTION: Electronic Recipients List TRANSMITTAL LETTER NO. (17-01) MINNESOTA DEPARTMENT OF TRANSPORTATION. MANUAL: Road Design English Manual
 MINNESOTA DEPARTMENT OF TRANSPORTATION. MANUAL: Road Design English Manual") DISTRIBUTION: Electronic Recipients List MINNESOTA DEPARTMENT OF TRANSPORTATION DEVELOPED BY: Design Standards Unit ISSUED BY: Office of Project Management and Technical Support TRANSMITTAL LETTER NO.
DISTRIBUTION: Electronic Recipients List MINNESOTA DEPARTMENT OF TRANSPORTATION DEVELOPED BY: Design Standards Unit ISSUED BY: Office of Project Management and Technical Support TRANSMITTAL LETTER NO.
Project Goal and Description. Why Broadway? Broadway SFMTA.COM/BROADWAY. The goal of the Broadway Safety Improvement
 PROJECT OVERVIEW Project Goal and Description The goal of the Broadway Safety Improvement d St Van Ness Ave Project is to improve safety and comfort for all who Franklin St Hyde St Octavia St Gough St
Active Transportation Facility Glossary
 Active Transportation Facility Glossary This document defines different active transportation facilities and suggests appropriate corridor types. Click on a facility type to jump to its definition. Bike
INTERSECTION CRASH COUNTERMEASURES
 INTERSECTION CRASH COUNTERMEASURES ALL SEVERE INTERSECTION (include gap CRASHES High Friction Surface Treatment - Intersection Markings - advanced acceptance and intersection approaches to intersections
A Traffic Operations Method for Assessing Automobile and Bicycle Shared Roadways
 A Traffic Operations Method for Assessing Automobile and Bicycle Shared Roadways A Thesis Proposal By James A. Robertson Submitted to the Office of Graduate Studies Texas A&M University in partial fulfillment
CITY OF OAKLAND. 27th Street Bikeway Feasibility and Design. Final Report (v3) March 23, Kimley-Horn and Associates, Inc.
 March 23, Kimley-Horn and Associates, Inc.") CITY OF OAKLAND 27th Street Bikeway Feasibility and Design Final Report (v3) March 23, 2007 PREPARED BY: Kimley-Horn and Associates, Inc. Table of Contents 1. Introduction 3 2. 27 th Street/Bay Place Corridor
CITY OF OAKLAND 27th Street Bikeway Feasibility and Design Final Report (v3) March 23, 2007 PREPARED BY: Kimley-Horn and Associates, Inc. Table of Contents 1. Introduction 3 2. 27 th Street/Bay Place Corridor
TABLE OF CONTENTS. Executive Summary
 Executive Summary Background... ES-1 Pedestrian Network... ES-2 Bikeway Network... ES-2 Collision History... ES-2 Public Input... ES-4 Conclusions and Recommendations... ES-4 1. Introduction and Setting
MEMORANDUM. City Constituents. Leilani Schwarcz, Vision Zero Surveillance Epidemiologist, SFDPH
 MEMORANDUM TO: FROM: CC: City Constituents Leilani Schwarcz, Vision Zero Surveillance Epidemiologist, SFDPH Megan Wier, Co-Chair, San Francisco Vision Zero Task Force, SFDPH Commander Ann Mannix, Traffic
EVALUATION OF A GREEN BIKE LANE WEAVING AREA IN ST. PETERSBURG, FLORIDA. William W. Hunter Senior Research Scientist
 EVALUATION OF A GREEN BIKE LANE WEAVING AREA IN ST. PETERSBURG, FLORIDA William W. Hunter Senior Research Scientist Raghavan Srinivasan Senior Transportation Research Engineer Carol A. Martell Senior Applications
Closing Plenary Session
 TRAFFIC SAFETY CONFERENCE Closing Plenary Session June 9, 2017 Las Colinas, TX Order of Report Out June 9, 2017 Las Colinas, TX Distracted Driving Prioritized Countermeasures Countermeasure 4a Systemically
In response to your request for information on mid-block pedestrian crossing policies and guidelines, the following information is enclosed:
 August 18, 2016 City of Brentwood, Tennessee Mr. Kirk Bednar City Manager 5211 Maryland Way P. O. Box 788 Brentwood, Tennessee 37024 VIA ELECTRONIC MAIL Dear Mr. Bednar: In response to your request for
HAWK Signal. Pedestrian Safety. Illinois Traffic Engineering & Safety Conference Thursday, October 21, 2010
 HAWK Signal Pedestrian Safety Illinois Traffic Engineering & Safety Conference Thursday, October 21, 2010 Background Information High-intensity Activated crosswalk Developed by the City of Tuscon, AZ First
Designing for Pedestrian Safety. Alabama Department of Transportation Pre-Construction Conference May 2016
 Designing for Pedestrian Safety Alabama Department of Transportation Pre-Construction Conference May 2016 1 Designing for Pedestrians Marking Crosswalks at Signalized intersections High Visibility Markings
Guidelines for Pedestrian Treatments at Uncontrolled Locations January 18, 2018
 Est. Dec. 2014 Guidelines for Pedestrian Treatments at Uncontrolled Locations January 18, 2018 Presented by: Kyle Armstrong, Illinois DOT Yan Qi, Southern Illinois University Webinar Logistics Duration
FHWA Resources for Pedestrian and Bicycle Professionals
 FHWA Resources for Pedestrian and Bicycle Professionals Charlie Zegeer, UNC Highway Safety Research Center/PBIC Libby Thomas, UNC Highway Safety Research Center Dan Nabors, Vanasse Hangen Brustlin (VHB)
Alberta. Traffic Collision Statistics. Office of Traffic Safety Transportation Services Division May 2017
 Traffic Collision Statistics Office of Traffic Safety Transportation Services Division May 217 This page was intentionally left blank. 2 Table of Contents Traffic Collisions... 4 Traffic Collision Rates...
Document 2 - City of Ottawa Pedestrian Crossover (PXO) Program
 Program") 40 Document 2 - City of Ottawa Pedestrian Crossover (PXO) Program OVERVIEW The City of Ottawa Pedestrian Crossover (PXO) Program provides the basis for PXO implementation in Ottawa. The program s processes
40 Document 2 - City of Ottawa Pedestrian Crossover (PXO) Program OVERVIEW The City of Ottawa Pedestrian Crossover (PXO) Program provides the basis for PXO implementation in Ottawa. The program s processes
Bicycle - Motor Vehicle Collisions on Controlled Access Highways in Arizona
 Bicycle - Motor Vehicle Collisions on Controlled Access Highways in Arizona Analysis from January 1, 1991 to June 30, 2002 Richard C. Moeur, PE Traffic Design Manager, Northern Region Michelle N. Bina
Truck Climbing Lane Traffic Justification Report
 ROUTE 7 (HARRY BYRD HIGHWAY) WESTBOUND FROM WEST MARKET STREET TO ROUTE 9 (CHARLES TOWN PIKE) Truck Climbing Lane Traffic Justification Report Project No. 6007-053-133, P 101 Ι UPC No. 58599 Prepared by:
PRINCE GEORGE S PLAZA METRO AREA PEDESTRIAN PLAN
 PRINCE GEORGE S PLAZA METRO AREA PEDESTRIAN PLAN May 28, 2008 Agenda Welcome and introductions Project overview and issue identification Planning context and strengths Design challenges and initial recommendations
Pedestrians safety. ROAD SAFETY SEMINAR PIARC/AGEPAR/GRSP Lome, Togo October 2006 Lise Fournier, Canada-Qu
 Pedestrians safety ROAD SAFETY SEMINAR Lome, Togo October 2006 Lise Fournier, Canada-Qu Québec Contents WHO s data Risk factors Pedestrian needs Pedestrian facilities Conclusion Source: WHO WHO reports
Pedestrian Crossing Facilitation Guideline Development
 Pedestrian Crossing Facilitation Guideline Development TZD Conference Melissa Barnes October, 2017 Why? Minnesota Go: Minnesota s multimodal transportations system maximizes the health of people, the environment,
Pedestrian Safety at Crosswalks Examining Driver Yielding Behavior at Crosswalks with GM1 and OF Systems
 Pedestrian Safety at Crosswalks Examining Driver Yielding Behavior at Crosswalks with GM1 and OF Systems Jaime Lacoste, B.Sc., University of Manitoba Alexandra Campbell, B.Sc., University of Manitoba Sarah
REGIONAL BICYCLE AND PEDESTRIAN DESIGN GUIDELINES
 REGIONAL BICYCLE AND PEDESTRIAN DESIGN GUIDELINES November 16, 2011 Deb Humphreys North Central Texas Council of Governments Bicycle and Pedestrian Advisory Committee Snapshot of the Guide 1. Introduction
TRAFFIC IMPACT ANALYSIS
 TRAFFIC IMPACT ANALYSIS FOR THE CHAMPAIGN UNIT#4 SCHOOL DISTRICT PROPOSED HIGH SCHOOL (SPALDING PARK SITE) IN THE CITY OF CHAMPAIGN Final Report Champaign Urbana Urbanized Area Transportation Study 6/24/2014
MRI-2: Integrated Simulation and Safety
 MRI-2: Integrated Simulation and Safety Year 3 2 nd Quarterly Report Submitted by: Dr. Essam Radwan, P.E. (PI), Ahmed.Radwan@ucf.edu Dr. Hatem Abou-Senna, P.E., habousenna@ucf.edu Dr. Mohamed Abdel-Aty,
FDOT Bicycle/Pedestrian Focused Initiative & Complete Streets
 Florida Department of TRANSPORTATION FDOT Bicycle/Pedestrian Focused Initiative & Complete Streets DeWayne Carver, AICP State Bicycle/Pedestrian Coordinator Secretary s Pedestrian Safety Initiative Dangerous
RESOLUTION NO ?? A RESOLUTION OF THE CITY OF NEPTUNE BEACH ADOPTING A COMPLETE STREETS POLICY
 RESOLUTION NO. 2018-?? A RESOLUTION OF THE CITY OF NEPTUNE BEACH ADOPTING A COMPLETE STREETS POLICY WHEREAS, safe, convenient, and accessible transportation for all users is a priority of the City of Neptune
Controlled. Semi-Controlled PAGE 01 CHAPTER 12 INTERSECTIONS
 PAGE 01 CHAPTER 12 INTERSECTIONS You will cross many intersections while driving. Intersections are especially dangerous because vehicles are crossing each other s driving path. Many crashes happen at
Appendix T CCMP TRAIL TRAFFIC & TRANSPORTATION DESIGN STANDARD
 Appendix T CCMP 3.3.4 TRAIL TRAFFIC & TRANSPORTATION DESIGN STANDARD 3.3.4 Trail Traffic and Transportation Design Multi-use trails have certain design standards, which vary depending on the agency that
G AT E WAY PLAN. Community BRIEFING KIT GATEWAY BIKE
 G AT E WAY PLAN GATEWAY BIKE Community BRIEFING KIT PLAN August 2016 TABLE OF CONTENTS INTRODUCTION... 1 THE BENEFITS OF A BIKEABLE COMMUNITY... 2 ECONOMY...2 SAFETY...3 HEALTH...3 HOUSEHOLD SPENDING...3
Dear Mr. Tweed: Sincerely, Min Zhou, P.E. Vice President
 December 17, 2012 Mr. Steve Tweed City of Long Beach, Department of Public Works Traffic & Transportation Bureau, 10 th Floor City Hall 333 West Ocean Boulevard Long Beach, CA 90802 Subject: Broadway and
Pedestrian injuries in San Francisco: distribution, causes, and solutions
 Pedestrian injuries in San Francisco: distribution, causes, and solutions Presentation to the San Francisco Health Commission RAJIV BHATIA, MD, MPH DIRECTOR OF OCCUPATIONAL AND ENVIRONMENTAL HEALTH, SAN
Today s presentation
 Today s presentation Introduction and housekeeping PBIC Trainings http://www.walkinginfo.org/training Next PBIC Webinar Community Approaches to Pedestrian Safety Education Gillian Hotz and David Parisi
Alternative Treatments for At-Grade Pedestrian Crossings
 Alternative Treatments for At-Grade Pedestrian Crossings IN RESPONSE TO A GROWING NEED FOR BETTER INFORMATION ON PEDESTRIAN CROSSING TREATMENTS TO BE COMPILED INTO A SINGLE COMPREHENSIVE DOCUMENT, THE
Creating Complete Streets to Accommodate All Users
 Creating Complete Streets to Accommodate All Users Peter Lagerwey, Toole Design Group plagerwey@tooledesign.com Brian Dougherty, Seattle DOT brian.dougherty@seattle.gov International Conference on Urban
POTENTIAL COUNTERMEASURES FOR IMPROVED PEDESTRIAN SAFETY A Report for the Sherman Oaks Neighborhood Council Public Safety Committee
 POTENTIAL COUNTERMEASURES FOR IMPROVED PEDESTRIAN SAFETY A Report for the Sherman Oaks Neighborhood Council Public Safety Committee by Jay Beeber Safer Streets L.A. www.saferstreetsla.org jay@saferstreetsla.org
Hidden Oaks Elementary School
 Hidden Oaks Elementary School SCHOOL ROUTE PLAN For HIDDEN OAKS ELEMENTARY SCHOOL LOCATION 13 ORANGE COUNTY Prepared for: ORANGE COUNTY SCHOOL ASSESSMENT PROGRAM ORANGE COUNTY PUBLIC WORKS Traffic Engineering
C. Best Practice Pedestrian Treatment Toolbox
 C. Best Practice Pedestrian Toolbox The Best Practice Pedestrian Toolbox presents the recommended tools in striping, signalization, signage, geometry and other categories for improving both uncontrolled
Pine Hills Road Pedestrian/Bicycle Safety Study Board of County Commissioners Work Session
 Pine Hills Road Pedestrian/Bicycle Safety Study Board of County Commissioners Work Session February 20, 2018 Meeting Agenda Study Overview Existing Conditions Access Management Potential Gateway Features
Pedestrian Safety at Roundabouts
 Countermeasure Strategies for Pedestrian Safety Pedestrian Safety at Roundabouts Hillary Isebrands Federal Highway Administration January 6, 2016 Today s Presentation Introduction and housekeeping Audio