Road Safety in Summary Report. French Road Safety Observatory. 26 June2017 Road Safety Results 2016
|
|
|
- Griffin Fields
- 5 years ago
- Views:
Transcription
1 Annual number of road traffic fatalities in France mainland Target Fatalities Road Safety in 2016 Summary Report Fatalities in proportion to billion kilometres travelled, French Road Safety Observatory Sources : ONISR, SOeS 1
2 General data 2016 France mainland Road fatalities are stable between 2015 and 2016 with a difference of 16 fatalities Results for the year 2016 Injury accidents Killed incl Injured people within 30 days hospitalised 24h 2016 final results 25/04/ final results Difference 2016 / Variation 2016 / % 0.5% 2.6% 2.2% Daily mortality in Motorway 6 Rural road Urbanroad Monday Tuesday Wednesday Thursday Friday Saturday Sunday 2
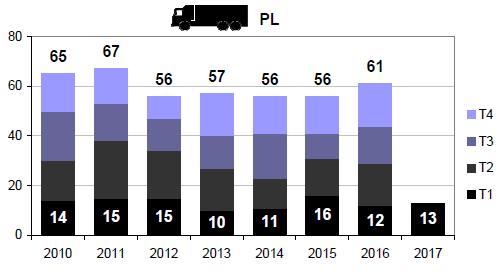
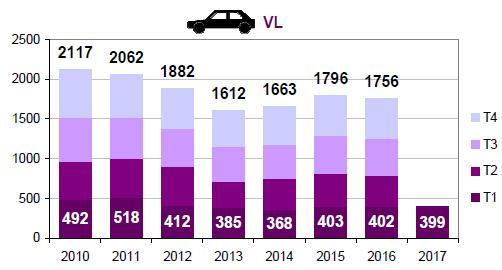
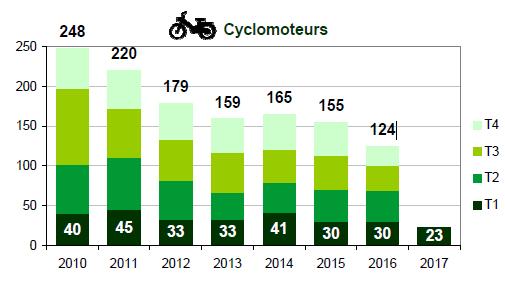
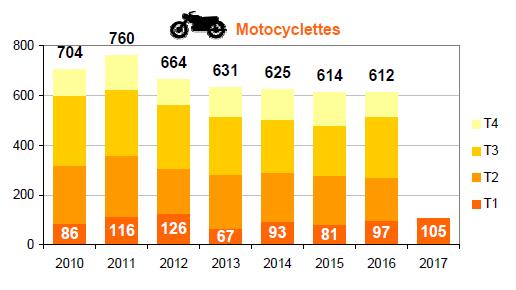
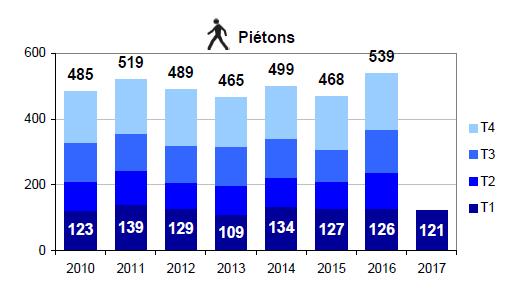
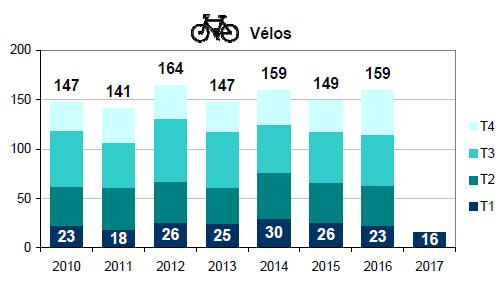
3 General data 2016 Road users Variation Variation Variation Total Pedestrians Pedal cylists Moped users Motorcyclists Car users Utility vehicles HGV users Public transport Other users % 4% 6% 18% 53% 4% 2% 0% 2% 100% % 4% 4% 18% 52% 3% 2% 1% 2% 100% % 5% 3% 18% 51% 4% 2% 0% 2% 100% 19% 9% -22% 0% -2% 8% -2% -72% 8% 0% 20% 10% -24% -3% 9% -2% -4% 71% -67% 2% 15% 10% -51% -13% -17% -11% -15% 200% -14% -13% Variation fewercar userskilled : -2% killed than in additional pedestrians killed : +19% killed than in 2015, +15% killed than in additional users of utility vehicles killed : +8% killed than in 2015, 34 fewer moped riders and 1 fewer motorcyclists killed compared with additionalcyclistskilled : +9% killed than in 2015, +10% killed than in % -41% -74% -35% -67% 63% -56% -40% -2% -57% 3
 X single vehicle 23 44 232 810 47 39 33 1228 COLLISION BETWEEN Pedestrians 2 0 2 0 0 0 0 4 Pedal cyclists 1 2 0 0 0 0 0 0 2 Moped")

4 General data 2016 Collisions France mainland 2016 Fatalities Pedes-trians Pedal cylists Moped users Motorcyclists Car users Utility vehicles HGV+PT Other users Total Responsiblein 10% 29% 59% 57% 59% 49% 29% of cases (including accidents involvinga single vehicle) X single vehicle COLLISION BETWEEN Pedestrians Pedal cyclists Moped users Motorcyclist Car users Utility vehicles HGV+PT Other users Multicollision Total Share of fatalities 16% 5% 3% 18% 51% 4% 2% 2% 100% Overall, 100 fewerfatalitiesin accidents involvinga single vehicle, exceptfor motorcyclists(+12 fatalities compared with 2015). Pedestrian fatalities are killed mostly by car users(+56), utility vehicles(+12), and HGV/Public transports (+15). 4
5 Comparing France with Europe Per age group Distribution of fatalities according to age group (per million inhabitants) France Europe <15 years old years old years old years old >65 years old Europe 2015 : 52 fatalities per million inhabitants. France 2016 : 53 fatalities per million inhabitants. Europe France 22 fewer fatalities in the age group Fatalities 2016 Difference of fatalities Evolution of fatalities Evolution of hospitalised victims years old % 0% years old % 2% years old % 1% years old % 1% years old % 4% years old % 9% 75 years old and over % 2% 55 additional fatalities in the 65+ age group 5
6 Comparing France with Europe Pedestrians safety Pedestrian fatalities per age group in France in 2016 >65 y/o 52% <15 y/o 5% 2% y/o 8% 19% 14% 91 additionalpedestrian fatalities in 2016 compared with 2015, including: +12 childenaged youngpeople aged seniors aged seniors aged75 yearsold and over People age65 + are over-represented in France among pedestrian fatalities Pedestrian fatalities per age group in Europe >65 y/o 43% <15 y/o 4% 2% 22% y/o 6% 23% 6
7 Comparing France with Europe Cyclists safety Cyclist fatalities per age group in France in 2016 >65 ans 41% <15 y/o 6% 2% y/o 28% 50% of pedestrian and cyclist fatalities under 65 years old are killed in urban areas: 65% of those fatalities between 65 and 74 are killed in urban areas 83% of those fatalities aged 75 and over are killed in urban areas. 7% 15% The share of cyclistsaged65 and over among fatalities is equivalent with that observed in Europe, but is over-represented compared with the proportion of this aged group among the population. Cyclist fatalities per age group in Europe >65 ans 42% <15 y/o 4% 2% 21% 25% y/o 5% 7
8 Comparing France with Europe Motorcyclists safety Motorcyclist fatalities per age France 2016 >65 y/o 4% 23% <15 y/o 0,2% 2% 55% y/o 16% Motorcyclist Motorcyclist fatalities fatalities per per age age Europe Europe >65 y/o >65 y/o 4% 4% 17% 17% 2% 2% y/o y/o 18% 18% Motorcyclist fatalities per age France % >65 y/o 3% <15 y/o 0,2% 57% 2% y/o 17% In France : 59% 59% - the share of years old among fatalities increases since 2015 : 16% in 2014, 21% in 2015 and 23% in the share of years old among fatalities lost ground in 2014 : 20% in 2010, about 16% since
9 Comparing France with Europe Motorists safety Motorist fatalities per age group Motorist fatalities per age group in France in 2016 in France in 2016 <15 y/o <15 y/o 3% 3% 2% 2% >65 >65 y/o y/o 25% 25% y/o y/o 22% 22% The share of seniors aged65 and over among fatalities increased from 19% in 2010 to 25%in They now represent 19% of the population. There are, between 2015 and 2016 : 14% y/o 34% -11 fatalities aged years old +9 fatalities aged 75 and over Motorist fatalities per age group in France in 2015 <15 y/o 4% 2% >65 y/o 25% 12% 34% y/o 23% Motorist fatalities per age group in France in 2010 <15 y/o 3% 4% 15% >65 y/o 19% 34% y/o 25% The shareof the agegroup among fatalities is now 22%, compared with 25% in They represent 8% of the population. 9
10 83% of presumed authors of fatal accidents are men Men are over-represented among drivers fatalities, but also among injuredpersons. Victims as passengers are relatively equally divided between men and women. Proportion of men BAAC 2016 pedal cyclist moped rider motorcyclist car user Fatalities 83% 88% 97% 77% Pedestrian fatalitiesare higheramongmen, however pedestrian injured persons are divided between men and women. 81% 90% 95% 64% Drivers Hospitalized % 85% 93% 58% 50 Proportion of men BAAC 2016 pedestrian 0 Slightly injured Fatalities in proportion to population 0-4 y/o 5-9 y/o y/o Fatalities - 60% 37% 52% Fatalities 64% Passengers Hospitalized 50% 57% 40% 49% Men y/o y/o y/o y/o y/o y/o y/o y/o Hospitalized 54% Women y/o y/o y/o y/o y/o y/o y/o Slightly injured 65% 56% 38% 47% Slightly injured 52% 10
11 Road fatalities: whereand when? h 1-2h +75 fatalities on urban roads between 7-10h and 16-19h 63% of fatalities are killed on rural roads(2188 fatalities, -16% since 2010), 8% on motorways (270 fatalities, +5.5% since 2010) and 29% on urban roads (1019 fatalities, -10% since 2010). 2-3h 3-4h Fatalities according to time and road network h 5-6h 6-7h 7-8h 8-9h 9-10h Motorways Rural roads Urban roads 10-11h 11-12h 12-13h 13-14h 14-15h 15-16h En agglo Evolution of pedestrian fatalities between 2015 and 2016: 69% ofpedestrian fatalities are killed IN urbanareas as well as 48% of cyclist fatalities(both increasing in urban areas) 61% of motorcyclistfatalities are killed OUTSIDE urbanareas (rising trend) 16-17h 17-18h 18-19h 19-20h Stable but remain high (48 fatalities) on motorways +16 fatalities on rural roads 77% of motorist fatalities is OUTSIDE urban areas (stable) 20-21h 21-22h 22-23h 23-24h 11

 represent 43% of seriously injuredpersons, 22% of fatalities, for less than 2% of the motorised traffic.")
12 3 477 fatalities Challenges Accordingto the agegroup, for 1 femalekilledthereare: <15 y/o y/o 70%of the seriouslyinjured are vulnerablesroad users: motorcyclists, moped users, cyclists and pedestrians. >65 y/o 76% of fatalities are men The agegroup represent 1/3 of seriously injured persons 29 % of fatalities Powered 2 wheelers (motorcyclists and moped users) represent 43% of seriously injuredpersons, 22% of fatalities, for less than 2% of the motorised traffic. 1 fatalitiesout of 5 issoin an accident involvinga novice driver. 14 %of personskilled are soin an accident involving one HGV. 12
13 Road safety results 2016 in overseas areas Annual num ber of road traffic fatalities in France overseas areas Target Fatalities persons were killed in the 5 overseas areas (DOM) : % increase compared with % decrease compared with Road fatalities increased compared with 2015 in overseas communities(com) : - 26 fatalities in Polynésie Française, 24% less than in fatalities in Nouvelle Calédonie, 16% less than in
14 Road safety results 2016 in overseas areas Key factors Between 40 and 50 fatalities per year : - Nouvelle Calédonie : speed -alcohol, personaland utility cars, youngpeople, seat belt not fastened, no license - Guadeloupe :alcohol, powered 2 wheelers + failure to wear a helmet, youngpeople Between 20 and 35 fatalities per year : - La Réunion : alcohol, P2W, at night - Martinique : alcohol, P2W + failureto wear a helmet, young people - Guyane : alcohol, P2W + failureto wear a helmet, young people - Polynésie Française : alcohol, P2W Overall, population is younger than in France mainland. Powered 2 wheelers are very often moped riders. 14
15 Presumed authors of fatal accidents Causes noted by police forces As multi-causes Speed : 31 % of cases Priority not given : 13 % of cases Dangerous overtaking : 4 % of cases Contraflow driving :2 % of cases Change lane : 2 % of cases No safe distance with previous vehicle : 1 % of cases Inattention :8 % of cases Phone :1 % of cases Alcohol : 19 % of cases Illegal drugs :9 % of cases Sickness : 4 % of cases Sleepiness : 3 % of cases Obstacles on lane : 2% of cases Vehicles factors : 1% of cases Other causes : 11 % of cases Unknown causes : 9 % of cases Source : presumed authors of fatal accidents file
16 Presumed authors of fatal accidents Causes per age group 50% 45% 40% 40% 45% Speed 43% 35% 30% 25% 20% 15% 10% 5% 0% 33% 24% Alcohol 26% 23% 22% 13% Drugs 17% 16% 13% 14% 15% 11% 13% 9% 8% 9% 9% 7% 7% 6% 6% 4% 0% 0% 0-14 ans ans ans ans ans ans 65 ans et + 30% 23% Priority 14% 10% 3% Alcohol Speed Drugs Priority Phone-Inattention Source : fichier des auteurs présumés des accidents mortels
17 Measured mean speeds in 2016 Personal car mean speeds by DAYLIGHT according to the type of network speed limit = 130 kph Between 2012 and 2016, average driving speed have been increasing by : 5 to 6 kph on motorways 3 to 4 km/h on dual carriageways Speed are globally stable since 2009 on roads with a 90 kph speed limit. In urban areas, a slight decrease observed in 2016 is still to be confirmed in the medium term. in kph speed limit = 110 kph speed limit = 90 kph speed limit = 50 kph 118 kph 103 kph 82 kph 47 kph NB: VMA means Maximum Allowed Speed Source : speed observatory ONISR-Cerema 17

18 Road user behaviour in fatal crashes 29 % are killed in killed an accident in an with accident at least with1 at driver least 1 alcohol driver impaired alcohol impaired Not wearing their seat belts: 20 % of car users killed 27% of utility van users killed 25% of HGV users killed 9 % are killed in an accident with sleepiness or sickness involved ZZZZZZZZ 22 % are killed in an accident with 1 driver impaired with illegal drugs Not wearingan helmet: 10 % of moped users killed 4% of motorcyclists killed Source : fichier national des accidents corporels de la circulation BAAC
19 Involved drivers and pedestrians Alcohol impaired 29% of fatalities are killed in an accident with at least 1 driver/pedestrian alcohol impaired (blood-alcohol level >0.5g/l) 18% of drivers or pedestrians involved in a fatal accident have a blood-alcohol level above 0.5g/l In 2016 share of alcohol impaired drivers/pedestrians among drivers/pedestrians involved in fatakl accidents - per age group piéton vélo cyclo moto VL y/o y/o y/o y/o Injuries accidents : Nb of alcohol impaired car users, by time of day and day of the week <10% 10-20% 20-30% 30-40% 40-50% 50-60% >60% 17% average for all age groups, all categories of users Blood-alcohol level above the legal limit in fatal accidents: -1 in 3 mopeddrivers - 1 in 5 motorcyclists - 1 in 5 car users - 1 in 3 pedestrians h 2 h 3 h 4 h 5 h 6 h 7 h 8 h 9 h 10 h 11 h 12 h 13 h 14 h 15 h 16 h 17 h 18 h 19 h 20 h 21 h 22 h 23 h 24h Sunday Saturday Friday Thursday Wednesday Tuesday Monday Source : fichier national des accidents corporels de la circulation BAAC

20 A new road safetydashboard a new perspective Monthly Quarterly ONISR Website : search for "ONISR" via any Internet search engine 20
Road Safety in 2016 Provisional Results
 Annual number of road traffic fatalities in France mainland 4500 4000 3500 3000 2500 Target 2010-2020 Fatalities 2000 1500 2010 2011 2012 2013 2014 2016 2017 2018 2019 2020 Road Safety in 2016 Provisional
French Road Safety Observatory - ONISR
 Road Safety in 2017 Estimated as of January 25, 2018 Summary of road traffic fatalities in France (mainland and overseas areas): Nearly 3 700 people are estimated to have died on French roads (mainland
French Road Safety Observatory ONISR
 Road Safety in 2016 estimated as of January 23, 2017 Development of road traffic fatalities in France mainland : 3 469 persons are estimated to have died on the French mainland roads in 2016, representing
Road Safety Annual Report 2016 OECD/ITF Chapter 26. Morocco
 Road Safety Annual Report 2016 OECD/ITF 2016 Chapter 26 Morocco This chapter presents 2014 road safety data for Morocco along with provisional data from 2015. It looks at trends in traffic and road safety
Road Safety Annual Report 2016 OECD/ITF Chapter 31. Norway
 Road Safety Annual Report 2016 OECD/ITF 2016 Chapter 31 Norway This chapter presents 2014 road safety data for Norway along with provisional data from 2015. It looks at trends in traffic and road safety
ROAD SAFETY ANNUAL REPORT 2018 ISRAEL
 ROAD SAFETY ANNUAL REPORT 2018 ISRAEL ISRAEL Israel recorded 321 road fatalities in 2017, representing a 3.9% decrease when compared to 2016. The mortality rate is 3.6 deaths per 100 000 population. Since
2015 Victorian Road Trauma. Analysis of Fatalities and Serious Injuries. Updated 5 May Page 1 of 28. Commercial in Confidence
 2015 Victorian Road Trauma Analysis of Fatalities and Serious Injuries Updated 5 May 2016 Page 1 of 28 Commercial in Confidence VICROADS_n3445896_2015_Victorian_Trauma_Report_- _updated_may_2016.docx 2015
Lincolnshire JSNA: Road Traffic Accidents
 Road Traffic Accidents What do we know? Summary A higher proportion of road traffic collisions in Lincolnshire result in death compared to other areas. This may be due to the types of road in the County
A review of 2015 fatal collision statistics as of 31 December 2015
 A review of fatal collision statistics as of 31 December This report summarises the main trends in road fatalities that have emerged in. This has been prepared by the Road Safety Authority following analysis
People killed and injured per million hours spent travelling, Motorcyclist Cyclist Driver Car / van passenger
 Cyclists CRASH FACTSHEET 27 CRASH STATISTICS FOR THE YEAR ENDED 31 DEC 26 Prepared by Strategy and Sustainability, Ministry of Transport Cyclists have a number of risk factors that do not affect car drivers.
Deaths/injuries in motor vehicle crashes per million hours spent travelling, July 2007 June 2011 (All ages) Mode of travel
 Mode of travel") Cyclists CRASH STATISTICS FOR THE YEAR ENDED 31 DECEMBER 211 Prepared by the Ministry of Transport CRASH FACTSHEET 212 Cyclists have a number of risk factors that do not affect car drivers. The main risk
Cyclists CRASH STATISTICS FOR THE YEAR ENDED 31 DECEMBER 211 Prepared by the Ministry of Transport CRASH FACTSHEET 212 Cyclists have a number of risk factors that do not affect car drivers. The main risk
CASUALTY REVIEW
 SOMERSET HEADINGROAD SAFETY PARTNERSHIP CASUALTY REVIEW 26-28 IMPROVING ROAD SAFETY WORKING TOGETHER TO REDUCE CASUALTIES HEADING HEADING CONTENTS 3 1. EXECUTIVE SUMMARY........................................
Alberta. Traffic Collision Statistics. Office of Traffic Safety Transportation Services Division May 2017
 Traffic Collision Statistics Office of Traffic Safety Transportation Services Division May 217 This page was intentionally left blank. 2 Table of Contents Traffic Collisions... 4 Traffic Collision Rates...
Cambridgeshire and Peterborough Road Safety Partnership Handbook
 and Peterborough Road Safety Partnership Handbook ANNUAL STATISTICS SUMMARY 2015 3941 CCC_Road Safety HBook.indd 1 19/08/2016 14:59 Contents Introduction 2 Key points 3 Summary table 4 Overall trends 4
Police Recorded Injury Road Traffic Collisions and Casualties Northern Ireland. Detailed Trends Report 2015
 Police Service of Northern Ireland Police Recorded Injury Road Traffic Collisions and Casualties Northern Ireland Detailed Trends Report 2015 Annual Bulletin Published 30 th June 2016 Contact: Traffic
the Ministry of Transport is attributed as the source of the material
 Cyclists 2015 Disclaimer All reasonable endeavours are made to ensure the accuracy of the information in this report. However, the information is provided without warranties of any kind including accuracy,
2014 QUICK FACTS ILLINOIS CRASH INFORMATION. Illinois Emergency Medical Services for Children February 2016 Edition
 2014 QUICK FACTS ILLINOIS CRASH INFORMATION February 2016 Edition Illinois Emergency Medical Services for Children www.luhs.org/emsc Illinois Emergency Medical Services for Children TABLE OF CONTENTS
2012 QUICK FACTS ILLINOIS CRASH INFORMATION. Illinois Emergency Medical Services for Children September 2014 Edition
 2012 QUICK FACTS ILLINOIS CRASH INFORMATION September 2014 Edition Illinois Emergency Medical Services for Children www.luhs.org/emsc Illinois Emergency Medical Services for Children TABLE OF CONTENTS
Review of Fatal Collisions
 Review of Fatal Collisions January to July 1 st 16 Review of 16 fatal collision statistics as of 1st July 16 Overview This report summarises the main trends in road fatalities that have emerged up to the
SOMERSET ROAD SAFETY PARTNERSHIP CASUALTY REVIEW Working together to reduce casualties
 CASUALTY REVIEW 27-29 Working together to reduce casualties 3 CONTENTS 1 EXECUTIVE SUMMARY 2 2 INTRODUCTION: CASUALTY REDUCTION TARGETS 3 3 COLLISION AND CASUALTY TRENDS 4 4 KILLED AND SERIOUSLY INJURED
Road Safety Partnership
 Cambridgeshire and Peterborough Road Safety Partnership Cambridgeshire and Peterborough Road Safety Partnership Introduction Road accidents can have a devastating impact not only for the people directly
Road Safety Vademecum
 Road Safety Vademecum Road safety trends, statistics and challenges in the EU 2010-2013 March, 2014 European Commission DG for Mobility and Transport Unit C.4 Road Safety Contents Summary of findings...
The experience of Spain in reducing road deaths in urban areas
 The experience of Spain in reducing road deaths in urban areas PIN Talk in Cyprus How to improve urban road safety Cyprus, 19 March 2015 Álvaro Gómez Méndez Deputy Directorate General for Statistics Analysis
MTCF. Michigan Traffic Crash Facts FACT SHEETS
 FACT SHEETS This page left intentionally blank GENERAL FACTS The driver, the roadway, and the motor vehicle contribute in some measure to every crash. A preponderance of evidence, however, points to driver
Motor Vehicle Related Fatalities 10-year Statistics for British Columbia Research and Data Unit Policy and Strategic Initiatives Branch
 Motor Vehicle Related Fatalities 1-year Statistics for British Columbia 27-216 Research and Data Unit Website: www.gov.bc.ca/roadsafetybc Twitter: http://twitter.com/ Contents Contents... 2 Introduction
Truck accidents. Rikke Rysgaard Danish Road Traffic Accident Investigation Board
 Truck accidents Rikke Rysgaard Danish Road Traffic Accident Investigation Board 1 Danish AIB Created in 2001 The purpose of AIB is to: Compile knowledge Raise awareness Make recommendations Encourage preventive
MTCF. Michigan Traffic Crash Facts FACT SHEETS
 FACT SHEETS This page left intentionally blank GENERAL FACTS The driver, the roadway, and the motor vehicle contribute in some measure to every crash. A preponderance of evidence, however, points to driver
Police Recorded Injury Road Traffic Collisions and Casualties Northern Ireland
 Police Service of Northern Ireland Police Recorded Injury Road Traffic Collisions and Casualties Northern Ireland Monthly Report Covering the reporting period 1 st January 2018 31 st August 2018 Published
Napier City road trauma for Napier City. Road casualties Estimated social cost of crashes* Major road safety issues.
 ISSN 1176-841X July 25 Land Transport New Zealand has prepared this road safety issues report. It is based on reported crash data and trends for the 2 24 period. The intent of the report is to highlight
Danish investigations on accidents with heavy vehicles and cyclists
 Danish investigations on accidents with heavy vehicles and cyclists Anne Eriksson, Danish Road Directorate Volvo Workshop Gothenburg November 8 th 2017 Right turn accidents between heavy vehicles and bicycles
Cambridgeshire and Peterborough Road Safety Partnership Handbook
 and Peterborough Road Safety Partnership Handbook ANNUAL STATISTICS SUMMARY- 2016 Contents Introductions 1 Key points 2 Summary table 3 Overall trends 3 Casualties by prevailing speed limit 4 Casualties
BENCHMARKING ROAD SAFETY IN LATIN AMERICAN COUNTRIES
 BENCHMARKING ROAD SAFETY IN LATIN AMERICAN COUNTRIES Sandra Vieira Gomes, Veronique Feypell, Fred Wegman Joint ITF/FIA/OISEVI Project on Road Safety Benchmarking in Latin America 6 th IRTAD Conference:
Road Safety Country Overview November Norway
 Road Safety Country Overview November 2012 Norway Basic data Structure and Culture Table 1: Basic data of Norway in relation to the. (Sources: [1] OECD/ITF, 2011; [2] Eurostat; [3] DG-TREN, 2005; [4] CIA;
road safety issues 2002 road trauma for Tauranga District July 2003 Regional crash causes Estimated social cost of crashes*
 road safety issues July 23 22 road trauma for Tauranga District The Land Transport Safety Authority (LTSA) has prepared this road safety issues report. It is based on reported crash data and trends for
Road safety Strategy and road safety Targets for Bulgaria
 Road safety Strategy Road safety Strategy and road safety Targets for Bulgaria Alan Ross Road crash fatality reduction targets Country Base-year for target Year in which target is to be realised Target
Published 24th June 2016 Published 31 st August Police Service of Northern Ireland Police Service of Northern Ireland
 Police Service of Northern Ireland Police Service of Northern Ireland Police Recorded Injury Road Traffic Police Recorded Injury Road Traffic Collisions and Casualties Collisions and Casualties Northern
CASUALTY REVIEW
 SOMERSET HEADINGROAD SAFETY PARTNERSHIP CASUALTY REVIEW 22-27 IMPROVING ROAD SAFETY WORKING TOGETHER TO REDUCE CASUALTIES HEADING HEADING CONTENTS 3 1. EXECUTIVE SUMMARY........................................
Current and future challenges of the European Road Safety Observatory
 Current and future challenges of the European Road Safety Observatory Konstandinos Diamandouros 3, Robert Bauer 2, Katerina Folla 1, Alexandra Laiou 1, Klaus Machata 2, Christian Brandstaetter 2, George
A preliminary analysis of in-depth accident data for powered two-wheelers and bicycles in Europe
 International Research Council on Biomechanics of Injury IRCOBI 2018 Athens, Greece, 12 September 2018 A preliminary analysis of in-depth accident data for powered two-wheelers and bicycles in Europe Ziakopoulos
Background. The scale of the problem. The scale of the problem. Road Safety in London, the statistics. 280 Fatalities from road crashes in 2002
 Impacts: 8th Intercontinental Conference - Geneva Thursday, 13 November 23 European Road Safety Programme Implementation by Cities AN OVERVIEW OF THE LONDON PICTURE Lukman Agboola Senior Road Safety Engineer
Targeting collisions resulting in killed or serious injury (KSI) victims
 victims") Targeting collisions resulting in killed or serious injury (KSI) victims Superintendent Steve Lyne Dorset Police @SuptSteveLyne Why important? 1.25m deaths a year globally (WHO, 2015) ¾ deaths are male
Targeting collisions resulting in killed or serious injury (KSI) victims Superintendent Steve Lyne Dorset Police @SuptSteveLyne Why important? 1.25m deaths a year globally (WHO, 2015) ¾ deaths are male
Road Safety in Sweden and the Effect of Speed on Safety
 Road Safety in and the Effect of Speed on Safety Göran Nilsson Dr. Eng. Swedish Road and Transport Research Institute-VTI Abstract has one of the best traffic safety situation in the developed countries.
Country fact sheet South Korea
 ESRA results Country fact sheet South Korea The ESRA project is a joint initiative of research institutes in 25 countries aiming at collecting comparable national data on road users opinions, attitudes
Work-related road deaths in France
 Work-related road deaths in France Manuelle SALATHE 1 WRR injuries - definitions Work-related casualties : casualties in road crashes occurring during professional missions and commuting. "Commuting" covers
Safe System approach A beckoning perspective for children
 Plenary Session 1 Safe System approach A beckoning perspective for children Fred Wegman Emeritus Professor, Traffic Safety at Delft University of Technology, the Netherlands Traditional approach: for example
Reported Road Casualties Great Britain: 2008 Annual Report
 Reported Road Casualties Great Britain: 28 Annual Report DEPARTMENT FOR TRANSPORT SCOTTISH GOVERNMENT WELSH ASSEMBLY GOVERNMENT Reported Road Casualties Great Britain: 28 Annual Report Published September
2003 road trauma for. Wairoa District. Road casualties Estimated social cost of crashes* Major road safety issues WAIROA DISTRICT JULY 2004
 WAIROA DISTRICT JULY 24 T he Land Transport Safety Authority (LTSA) has prepared this road safety issues report. It is based on reported crash data and trends for the 1999 23 period. The intent of the
COLLISION STATISTICS May Engineering Services Box 5008, th Avenue Red Deer, AB T4N 3T4
 COLLISION STATISTICS 2016 2016 Red Deer Annual Motor Vehicle Collision Report May 2017 Engineering Services Box 5008, 4914 48th Avenue Red Deer, AB T4N 3T4 engineering@reddeer.ca RCMP GRC Red Deer City
Safety and Active Transport. Dr. Maureen Carew, Medical Officer of Health Renfrew County and District Health Unit May 30, 2014
 Safety and Active Transport Dr. Maureen Carew, Medical Officer of Health Renfrew County and District Health Unit May 30, 2014 Active Transport Vision Increase levels of walking and cycling Reduce vehicle
Alberta. Traffic Collision Statistics
 Alberta Traffic Collision Statistics 2002 Alberta Traffic Collision Statistics 2002 For further information contact: Alberta Transportation Driver Safety, Research and Traffic Safety Initiative 1st Floor,
Road Safety Report 2003 to 2007
 RRMasterton District Road Safety Report to 7 Performance Information Land Transport New Zealand - Wakefield Street PO Box 7 9 WELLINGTON Ph. () 9 89 Fax. () 9 899 Web: www.landtransport.govt.nz April 8
Cyclist Safety in Australia
 Cyclist Safety in Australia From BITRE Trauma Statistical Summary, August 218 http://www.bitre.gov.au/publications/ongoing/road_deaths_australia_annual_summaries.aspx Trends in cyclist trauma numbers These
Social marketing can it be used to reduce road traffic collisions among young male Irish drivers?
 Social marketing can it be used to reduce road traffic collisions among young male Irish drivers? Brian Harman & Maurice Murphy, Department of Management and Marketing, Cork Institute of Technology. Globally
Transportation and Public Works Annual Motor Vehicle Collision Report
 Transportation and Public Works 22 Annual Motor Vehicle Collision Report Table of Contents Table of Contents.. 2 Introduction.. 3 22 Collision Summary. 4 Demographics 5 Collisions by Severity.. 5 Personal
Country fact sheet Germany
 Country fact sheet Germany ESRA 2015 results The ESRA project is a joint initiative of research institutes in 17 European countries aiming at collecting comparable national data on road users opinions,
Introduction. 2
 Introduction In 2010, the United Nations General Assembly adopted Resolution 64/255 proclaiming 2011 2020 to be a Decade of Action for Road Safety. 1 In order to establish a baseline for the road safety
4. WIDER SOCIAL DETERMINANTS OF HEALTH
 4. WIDER SOCIAL DETERMINANTS OF HEALTH 4.6 Road Safety Road safety affects all road users; pedestrians, cyclists and vehicle drivers and passengers. This section describes the impact of road safety and
For further information contact: Alberta Infrastructure and Transportation Office of Traffic Safety Main Floor, Twin Atria Building Avenue
 Alberta Traffic Collision Statistics 2006 Alberta Traffic Collision Statistics 2006 For further information contact: Alberta Infrastructure and Transportation Office of Traffic Safety Main Floor, Twin
The European Road Safety Observatory ERSO
 The European Road Safety Observatory ERSO Petros Evgenikos Civil - Transportation Engineer, M.Sc. Research Associate, PhD Candidate Website: www.nrso.ntua.gr/pevgenik e-mail: pevgenik@central.ntua.gr Together
OUR HIGH SCHOOL PROGRAM
 OUR HIGH SCHOOL PROGRAM Mission Statement Accident Awareness Inc. is committed to educating the public to the dreadful realities of fatal motor vehicle collisions, how quickly they can occur and the grim
CEDR N5 Improvements in the field of Road Safety New trends in member states Road Safety strategies
 CEDR N5 Improvements in the field of Road Safety New trends in member states Road Safety strategies CEDR Strategic Plan 2013-2017 TD3 Network Management Thorshavn, Faroe Islands, March 30th 2016 Auður
the Ministry of Transport is attributed as the source of the material
 Pedestrians 216 Disclaimer All reasonable endeavours are made to ensure the accuracy of the information in this report. However, the information is provided without warranties of any kind including accuracy,
North Carolina. Bicycle Crash Facts Prepared for
 North Carolina Bicycle Crash Facts 2006-2010 Prepared for The North Carolina Department of Transportation Division of Bicycle and Pedestrian Transportation Prepared by The University of North Carolina
IMPROVEMENT OF THE ROAD TRAFFIC SAFETY WITH THE VIEW TO NATIONAL STRATEGY. Ministry of Transport and Communications
 IMPROVEMENT OF THE ROAD TRAFFIC SAFETY 2009-2014 WITH THE VIEW TO NATIONAL STRATEGY Presenter: Marjan Kopevski, Civ.Eng. Ministry of Transport and Communications IMPROVEMENT OF THE ROAD TRAFFIC SAFETY
BAAC (Analysis report of road traffic accident involving physical injury) User Guide
 User Guide") OBSERVATORY (ONISR) FRENCH ROAD SAFETY BAAC (Analysis report of road traffic accident involving physical injury) User Guide BA Extract AL INTERMINISTERIEL DE May 2014 Foreword This present version cancels
OBSERVATORY (ONISR) FRENCH ROAD SAFETY BAAC (Analysis report of road traffic accident involving physical injury) User Guide BA Extract AL INTERMINISTERIEL DE May 2014 Foreword This present version cancels
New Strategic Road Safety Plan Risk assessment as alternative for (lack of) accident data?
 accident data?") New Strategic Road Safety Plan 2016-2021 Risk assessment as alternative for (lack of) accident data? Eric de Kievit senior advisor Traffic & Transport Research e.de.kievit@amsterdam.nl 18 November 2016
New Strategic Road Safety Plan 2016-2021 Risk assessment as alternative for (lack of) accident data? Eric de Kievit senior advisor Traffic & Transport Research e.de.kievit@amsterdam.nl 18 November 2016
ROAD SAFETY IN RUSSIA
 ROAD SAFETY IN RUSSIA United Nations Road Safety Collaboration First Deputy Minister of Internal Affairs of the Russian Federation A.V. Gorovoy New York, 12 April 2018 Russia supports the global road safety
THE EPIDEMIOLOGY OF TRAUMATIC BRAIN INJURIES IN NEW YORK STATE
 THE EPIDEMIOLOGY OF TRAUMATIC BRAIN INJURIES IN NEW YORK STATE Michael Bauer, Sarah Sperry, Kainan Sun, Susan Hardman New York State Department of Health, Bureau of Injury Prevention What is Traumatic
2 nd Road Safety PIN Conference 23 June 2008 Countdown to only two more years to act!
 2 nd Road Safety PIN Conference 23 June 2008 Countdown to 2010 - only two more years to act! EU ambition EU target to cut by 50% yearly road deaths between 2001 and 2010 Countries have similar national
Projections of road casualties in Great Britain to 2030
 5 Projections of road casualties in Great Britain to 2030 C G B (Kit) Mitchell and R E Allsop Published March 2014 Contents Section 1 Introduction 4 Section 2 Trends in road casualty rates 6 Section 3
road safety issues 2001 road toll for Gisborne district July 2002 Road user casualties Estimated social cost of crashes*
 GISBORNE DISTRICT road safety issues July 22 The Land Transport Safety Authority (LTSA) has prepared this Road Safety Issues Report. It is based on reported crash data and trends for the 1997 21 period.
European facts and Global Status Report on Road Safety 2013
 European facts and Global Status Report on Road Safety 2013 Francesco Mitis WHO Regional Office for Europe Rome, 20 December 2013 mit@euro.who.int Monitoring a Decade UN GA resolution 54/255 in 2010 called
EGYPT: a national decade of action for road safety
 EGYPT: a national decade of action for road safety 2011 2020 Egypt EGYPT Population: 75 497 913 Income group: Middle Gross national income per capita: $1 580 INSTITUTIONAL FRAMEWORK Lead agency Funded
A study of road accident deaths in Andhra Pradesh
 A study of road accident deaths in Andhra Pradesh D. Raja Reddy Introduction: A recent ghastly private bus accident in October of 2013 on a national highway in Andhra Pradesh leading to the death of 45
Alberta. Traffic Collision Statistics
 Alberta Traffic Collision Statistics 2015 Alberta Traffic Collision Statistics 2015 For further information contact: Alberta Transportation Office of Traffic Safety Main Floor, Twin Atria Building 4999
German Road Safety Council 2018
 German Road Safety Council 2018 Improving road safety for cyclists Resolution of 6 November 2018 on the basis of the recommendation of the Executive Committee Traffic Engineering with collaboration by
iam.org.uk IAM Motorcycling Facts
 iam.org.uk IAM Motorcycling Facts Foreword Motorcycling can be the riskiest way to travel. For every kilometre travelled, a motorcyclist is fifty times more likely to become a casualty than a car driver.
Road Safety in Urban areas: Challenges and Strategies. Hubert Trève (CERTU) Washington September
 Washington September") Road Safety in Urban areas: Challenges and Strategies Hubert Trève (CERTU) Washington September 2006 1 Road safety in France 2005 87 026 accidents with injuries 5 543 deaths within 30 days 111 683 injured
Road Safety in Urban areas: Challenges and Strategies Hubert Trève (CERTU) Washington September 2006 1 Road safety in France 2005 87 026 accidents with injuries 5 543 deaths within 30 days 111 683 injured
Lane Area Transportation Safety and Security Plan Vulnerable Users Focus Group
 Lane Area Transportation Safety and Security Plan Vulnerable Users Focus Group Agenda 1. Planning Process Review 2. What are Emphasis Areas? 3. Your Role Today 4. Data Review 5. Small group discussion
ROAD SAFETY ANNUAL REPORT 2018 THE NETHERLANDS
 ROAD SAFETY ANNUAL REPORT 2018 THE NETHERLANDS THE NETHERLANDS The Netherlands recorded 613 road fatalities in 2017, representing a 2.5% decrease when compared to 2016. The mortality rate was 3.6 deaths
Northland Region road trauma for Northland Region. Road casualties Estimated social cost of crashes* Major road safety issues
 ISSN 1176-841X July 26 Land Transport has prepared this road safety issues report. It is based on reported crash data and trends for the 21 25 period. The intent of the report is to highlight key road
Delivering Accident Prevention at local level in the new public health system
 1 Safety issue accidents don t have to happen Delivering Accident Prevention at local level in the new public health system Part 2: Accident prevention in practice Raise awareness Fact Sheet Road casualties
M. DAVID WILDE Coordinateur National du département investigation et analyse des accidents Trafikverket PALAIS DES CONGRÈS NAMUR 15/06/2012
 M. DAVID WILDE Coordinateur National du département investigation et analyse des accidents Trafikverket PALAIS DES CONGRÈS NAMUR 15/06/2012 1 400 1 200 1 000 800 600 400 200 0 2 2012-06-20 Number of killed
Western Bay of Plenty/ Tauranga Area
 ISSN 1176-841X July 5 Land Transport New Zealand has prepared this report. It is based on reported crash data and trends for the 4 period. The intent of the report is to highlight the key and provide partners
i Experience and what can Finland learn ETSC Road Safety PIN Talk in Estonia Veli-Pekka Kallberg VTT Technical Research Centre of Finland
 What can Estonia learn from the Finnish i Experience and what can Finland learn from Estonia ETSC Road Safety PIN Talk in Estonia 21.5.2010 y Veli-Pekka Kallberg VTT Technical Research Centre of Finland
Forewarned is Forearmed Highways Agency approach to quantifying network safety risk
 Forewarned is Forearmed Highways Agency approach to quantifying network safety risk The Highways Agency Safety Risk Model 17 th May 2012 Elizabeth Mathie, Safety Risk Modelling Manager The Highways Agency
Road Safety Country Overview November Poland
 Road Safety Country Overview November 2012 Poland Basic data Structure and Culture Poland has a high population density but a low number of vehicles per person. Table 1: Basic data of Poland in relation
The themes are covered in the following order: Theme 1: Accidents and victims. Theme 2: Mobility and risk exposure. Theme 3: Driving ability
 Belgian KEY INDICATORS ROAD SAFETY 215 foreword Every day, on average, two people lose their lives in accidents on Belgian roads. To this figure may be added 1 people severely injured and more than 1
Pedestrian Safety in Cities
 Pedestrian Safety in Cities Priorities for India Geetam Tiwari MoUD Chair Professor, Coordinator, TRIPP Indian Institute of Technology Delhi, India URBAN MOBILITY INDIA 2013 IIT Delhi 2013 RTI in Urban
Road Casualties in Norfolk 2014
 Road Casualties in Norfolk 2014 Prepared by:- Road Casualty Reduction Partnership Board Norfolk County Council County Hall Martineau Lane Norwich Norfolk NR1 2SG Author of Report:- (Title) (Name) Analyst
Road casualties and their injuries
 Research report N 2018-T-01-SEN Road casualties and their injuries Thematic File Road Safety N 15 Road casualties and their injuries Thematic File Road Safety N 15 Research report N 2018-T-01-SEN D/2018/0779/3
For further information contact: Alberta Transportation Office of Traffic Safety Main Floor, Twin Atria Building Avenue Edmonton, Alberta T6B
 Alberta Traffic Collision Statistics 2009 Alberta Traffic Collision Statistics 2009 For further information contact: Alberta Transportation Office of Traffic Safety Main Floor, Twin Atria Building 4999
Safe roads for an ageing population
 Prof. Francesca La Torre, PhD, PE Full Professor of Roads, Railways and Airport Engineering University of Florence Civil and Environmental Engineering Department francesca.latorre@unifi.it Let s start
Traffic Safety Basic Facts 2008
 In 2006 1, more than 4.700 seniors died in road traffic accidents in 14 European countries. Fatalities of elderly people in road traffic accidents reduced by over 3 between 1997 and 2006. Traffic Safety
Towards Zero: Using Evidence and Aspiration to Reduce Road Trauma in Western Australia
 Towards Zero: Using Evidence and Aspiration to Reduce Road Trauma in Western Australia Iain Cameron Executive Director Office of Road Safety Western Australia, Australia iain.cameron@mainroads.wa.gov.au
The Vision Zero Swedish parliament (1997)
") TMALL 0141 Presentation v 1.0 2018-03-19 How close to zero car fatalities can we get? Prepared by: Matteo Rizzi Presented by: Anders Lie Gordon Moore in 1965 said; "Change will never be this slow again"
TMALL 0141 Presentation v 1.0 2018-03-19 How close to zero car fatalities can we get? Prepared by: Matteo Rizzi Presented by: Anders Lie Gordon Moore in 1965 said; "Change will never be this slow again"
Road design and Safety philosophy, 1 st Draft
 Head Office SWEDEN www.vv.se Textphone: +46 243-750 90 Roger Johansson International Secretariat roger.johansson@vv.se Direct: +46 243 75880 Mobile: +46 70 6327373 Date: 2006-08-17 Reference: Road design
Analysis and Countermeasure Research on the Death Rate of the Vulnerable Road Users in Traffic Accidents. Ying MEI
 2nd Annual International Conference on Social Science and Contemporary Humanity Development (SSCHD 2016) Analysis and Countermeasure Research on the Death Rate of the Vulnerable Road Users in Traffic Accidents
Annual Crash Report
 21-212 Annual Crash Report Valdosta-Lowndes County Metropolitan Planning Organization July 213 Table of Contents Introduction... 3 Highway Safety Plan... 4 High Crash Locations... 12 Conclusions... 14
Sydney, AUSTRALIA Beijing, CHINA Hyderabad, INDIA London, UK. Affiliated with the University of Sydney
 Sydney, AUSTRALIA Beijing, CHINA Hyderabad, INDIA London, UK Affiliated with the University of Sydney Road Traffic Injuries in Asia Professor Rebecca Ivers 2 Major causes of death 3 Million people 2 1.8