Los Angeles County. Metropolitan Transportation Authority. FY 2002 On-Board Bus Weekend Survey Report. Report to the Los Angeles County
|
|
|
- Clarissa Jacobs
- 5 years ago
- Views:
Transcription
1 Los Angeles County Metropolitan Transportation Authority FY 2002 On-Board Bus Weekend Survey Report Report to the Los Angeles County Metropolitan Transportation Authority One Gateway Plaza Los Angeles, California by Rea & Parker Research P.O. Box San Diego, CA October, 2002
2 Table of Contents EXECUTIVE SUMMARY...iv INTRODUCTION...1 FRAMEWORK FOR THE BUS ON-BOARD SURVEY ANALYSIS...1 DEMOGRAPHIC PROFILE...3 TRAVEL CHARACTERISTICS OF ONE-WAY TRIP...8 NUMBER OF BUSES/TRAINS USED...8 MODE OF ACCESS/EGRESS...9 ORIGINS AND DESTINATIONS...9 PRODUCTION/ATTRACTION...18 TRAVEL TIME...22 FREQUENCY OF USE...22 METHOD OF PAYMENT...22 SATISFACTION WITH METRO BUS SERVICE FEATURES...28 APPENDIX A: METHODOLOGY...36 APPENDIX B: PLANNING SUBREGIONS...52 APPENDIX C: ON BOARD SURVEY INSTRUMENT...98 i
3 List of Tables Table 1: Demographic Profile of MTA Bus Riders by Sector Weekend...4 Table 2: Demographic Characteristics by Ethnic Group by Sector Weekend...5 Table 3: Demographic Profile - Saturday/Sunday...7 Table 4: Number of Buses/Trains Used on One-Way Trip (Weekend)...8 Table 5: Mode of Travel to First Bus/Train by Sector Weekend...10 Table 6: Mode of Travel to Destination After Getting Off Last Bus/Train by Sector Weekend...10 Table 7: Place Coming From Before Getting On First Bus/Train by Sector Weekend...11 Table 8: Destination After Getting Off Last Bus/Train by Sector Weekend...12 Table 9: Major Trip Purposes (Production/Attraction) by Service Sector - Weekend...19 Table 10: Median Time Spent on Various Components of the One-Way Trip (in minutes) by Service Sector - Weekend...26 Table 11: Method of Fare Payment by Service Sector - Weekend...26 Table 12: Strength of Relationships Between Overall Satisfaction and Satisfaction With Individual Service Features MTA Weekend Bus Riders...30 Table 13: Satisfaction With Various Service Features* by Service Sector Weekend...31 Appendix A Table A-1: MTA Weekend Sample...39 Appendix B San Fernando Valley Subregion...56 South Bay Cities Subregion...62 Arroyo Verdugo Subregion...68 Gateway Subregion...74 Los Angeles Central Subregion...80 San Gabriel Valley Subregion...86 Westside Cities Subregion...92 ii
4 List of Figures Map 1: Destinations of Weekend Bus Trips Originating in South Bay...13 Map 2: Destinations of Weekend Bus Trips Originating in Gateway...14 Map 3: Destinations of Weekend Bus Trips Originating in San Fernando Valley...15 Map 4: Destinations of Weekend Bus Trips Originating in San Gabriel Valley...16 Map 5: Destinations of Weekend Bus Trips Originating in West Central...17 Figure 1 Trip Purpose (Production/Attraction) MTA Bus Weekend...20 Figure 2: Major Trip Purposes (Production/Attraction) by Riding Frequency MTA- Weekend...21 Figure 3: Median Time Spent on Various Components of One-Way Trip MTA Bus- Weekend...23 Figure 4: Frequency of Riding Metro Buses MTA System- Weekend...24 Figure 5: Method of Payment: First Bus/Train of One Way Trip MTA Bus- Weekend...25 Figure 6: Mean Satisfaction Ratings for Various Features of MTA Bus Service- Weekend...29 Figure 7: Service Feature Desired to Be Improved- MTA Weekend Bus Riders...35 iii
5 EXECUTIVE SUMMARY This report summarizes the results of the FY 2002 Bus On-Board (Weekend) Survey. The survey was conducted on weekends from June through December Two companion reports, one on a concurrent weekday survey and one on a subsequent telephone follow-up to the weekday survey, are also available. There are also three reports on rail riders that are analogous to the three bus rider reports. Demographic Profile Weekend Metro Bus riders are 55% female and 45% male, with little difference by MTA service sector. Median annual household income for weekend bus riders is $10,000 per year, again with little difference by service sector. Latinos are the largest ethnic group among weekend riders (59%). African-Americans are 24% of the ridership, and Whites and Asians are 8% and 7%, respectively. Latino bus riders are particularly prominent in the San Gabriel Valley (69%), Gateway (66%), and West Central (64%) sectors. African-Americans comprise 38% of South Bay sector ridership. White riders are most numerous in the San Fernando Valley (19%). The average age of weekend riders is Whites are older than the other groups (49.8). Travel Characteristics A large majority of weekend Metro Bus riders (73%) use more than one bus or train in the course of their one-way trip. Riders access their first bus or train almost entirely by walking (95%). A similar percentage (94%) walk to their final destination. Most riders (83%) use MTA buses 5 or more days per week. The home-to-work trip (and its reverse work-to-home) constitute 46% of all weekend trips. Fewer trips are work related (e.g. home-work, work-shopping, school-work, among others) on Sunday (47%) than on Saturday (53%). Most weekend Metro Bus riders use passes to pay their boarding fare (55%); approximately 1/3 (34%) use regular monthly passes. Pass use is highest in the South Bay sector (60%) and lowest in San Fernando Valley and Gateway (50% each). Travel Patterns West Central sector riders remain within the West Central sector on 65% of all bus trips that originate there. This is in contrast to the San Gabriel Valley (42%), which is the only sector where a majority of riders travels outside of their sector. The major destination for riders outside of their own sector (for all sectors except West Central) is West Central. Travel to West Central is equal to or exceeds travel to all of the remaining sectors combined for all other sectors, except Gateway. iv
6 By Subregion (modified COG jurisdictions), this same pattern is even more pronounced: Intra-Subregional travel either makes up a majority or a plurality of trips in five of the seven Subregions. The Central Los Angeles Central area is either the most common destination or the second most common destination for all Subregions. Travel to Central Los Angeles Central is more common than all travel to the remaining Subregions combined. (This is not the case for the San Fernando Valley, which also differs by having a high proportion of intra-subregional bus travel.) This central city orientation of inter-subregional travel contradicts a popular notion of suburban disintegration from the urban core. Instead, the region is interwoven by transit to and through its central core. Riders indicate that their median one-way trip consumes 60 minutes, including 25 minutes on board buses and trains, 10 minutes getting to the transit vehicle, 10 minutes getting from the transit vehicle, and 15 minutes waiting for buses and trains. The largest total travel time on weekends is among San Gabriel Valley sector riders (70 minutes). Satisfaction With Bus Service Features Metro Bus weekend riders are generally satisfied with the overall service of the Metro Bus system (2.4 on a 5-point scale, with 1.0 representing very satisfied). More than onehalf (55%) of all riders on weekends rate overall service as either very good or good. Convenience of Route is rated most highly (2.1); safety is next in order of satisfaction (2.2). On the lower satisfaction end are time spent waiting and buses being on time (2.8 each). Those service features for which satisfaction levels are most strongly correlated with overall satisfaction are buses being on time (r=.64) and buses do not pass by (r=.62). v
7 INTRODUCTION The Los Angeles County Metropolitan Transportation Authority (MTA) operates 185 bus routes in Los Angles County spanning a 1,400 square mile area from the northern portions of the San Fernando Valley to the San Pedro harbor area and from the Pacific Ocean to the San Gabriel Valley. Its 8,000 employees plan, design, coordinate, build, and operate one of the largest transit systems in the nation, with a fleet of approximately 2,000 buses. On an average weekday almost 1.25 million passengers board MTA buses, with over 700,000 boardings on weekend days, placing MTA in the top 3 bus systems in the nation along with New York City Transit and Chicago Transit Authority. There are almost 20,000 bus stops in the system. MTA also provides direct subsidies to 12 fixed-route municipal bus operators and 1 transportation zone in Los Angeles County. It also administers the Local Return component of local transportation taxes that several recipient communities use to provide small-scale fixed-route bus service. Framework for the Bus On-Board Survey Analysis MTA authorized a representative survey of bus riders on board MTA buses. The goal of this survey was to provide accurate and representative baseline data on MTA bus riders' demographics, travel patterns, and levels of satisfaction regarding their bus service. Of fundamental interest were issues pertaining to the following, among others: Origin and destination trip characteristics Mode of access and egress to and from the bus Seating and space availability on-board the buses Driver courtesy Security issues on-board and at bus stops Travel time issues Overall satisfaction with the bus system Greatest needs for improvement Fare media usage Additional demographic data 1
8 This report concentrates on weekend MTA bus riders. It examines weekend data by MTA Service Sector (San Fernando Valley, San Gabriel Valley, West Central, South Bay, and Gateway). Separate reports have been prepared for weekday riders and geo-coded origin/destination data. Further analysis of MTA weekend bus data was performed for 7 MTA Planning Subregions. Findings for these Planning Subregions are reported in Appendix B. Appendix A is a complete explanation of the methodology employed in the course of this study. 2
9 DEMOGRAPHIC PROFILE Table 1 is a demographic profile of the weekend FY 2002 Metro Bus riders. Forty-five percent (45%) are male and 55% are female. There is not much variation in gender by service sector, with the ridership dominantly female in the West Central sector (58%), and least prevalent in the San Gabriel Valley (52%). The annual median household income for all riders is $10,000, with minimal difference by sector the San Fernando Valley having the highest median income ($11,000) and Gateway riders having the lowest ($9,000). Among all weekend Metro Bus riders, 59% are Latino, 24% are African-American, 8% are White, and 7% are Asian/Pacific Islander. The table shows dramatic differences in the ethnic makeup of the service sectors. The San Fernando Valley has by far the most White riders (19%) on weekends. The San Gabriel Valley (69%) and, to a lesser extent, Gateway (66%) and West Central (64%) have the greatest Latino rider proportions. South Bay (38%) and Gateway (25%) are highest in African-American ridership. Asian riders are more numerous in the San Gabriel Valley (11%) and West Central (10%). Table 1 further reports that the mean age of weekend Metro Bus riders is 41.3 years. Riders in the San Fernando Valley have the lowest mean age (39.4 years), while West Central riders have the highest (43.1 years). Table 2 shows that the median income among weekend Metro Bus riders is $15,000 for Whites. The median income for White riders in the San Fernando Valley is considerably higher ($21,000) and it is lower in the South Bay ($12,000) and Gateway sectors ($13,000). The lowest median income is found among Latino riders ($9,000), with consistency across the five sectors. Table 2 also reports that the mean age of White weekend riders is 49.8 years, and for Latino riders it is 39.2 years. Whites in the Gateway sector and Asians in South Bay have the highest mean age (52.2 years), while African-Americans in the San Fernando Valley have the lowest mean age (34.0 years). 3
10 Table 1: Demographic Profile of MTA Bus Riders by Sector Weekend MTA System San Fernando Valley San Gabriel Valley West Central South Bay Gateway Gender Male Female 45% 55 43% 57 48% 52 42% 58 44% 56 46% 54 Median Household Income $10,000 $11,000 $10,000 $10,000 $10,000 $ 9,000 Mean Age (Years) Ethnicity Hispanic/Latino White/Caucasian African-American/Black Asian/Pacific Islander Other (American-Indian/ Multi-Racial) 59% % % % % %
11 Table 2: Demographic Characteristics by Ethnic Group by Sector Weekend Median Income Hispanic/Latino African-American/Black White/Caucasian Asian/Pacific Islander Percentage of Riders in Households Earning Less Than $7,500 Annually Hispanic/Latino African-American/Black White/Caucasian Asian/Pacific Islander Percentage of Riders in Households Earning $50,000 and Over Annually Hispanic/Latino African-American/Black White/Caucasian Asian/Pacific Islander MTA System $ 9,000 11,000 15,000 12,000 45% % San Fernando Valley $ 8,000 13,000 21,000 14,000 50% % San Gabriel Valley $ 9,000 9,000 15,000 14,000 43% % West Central South Bay Gateway $ 9,000 11,000 18,000 12,000 44% % $ 9,000 11,000 12,000 13,000 43% % $ 8,000 11,000 13,000 7,000 47% %
12 Table 2 (continued) MTA System San Fernando Valley San Gabriel Valley West Central South Bay Gateway Mean Age Hispanic/Latino African-American/Black White/Caucasian Asian/Pacific Islander Percentage of Riders 25 Years of Age or Younger Hispanic/Latino African-American/Black White/Caucasian Asian/Pacific Islander 19% % % % % % Percentage of Riders Over 50 Years of Age Hispanic/Latino African-American/Black White/Caucasian Asian/Pacific Islander 21% % % % % %
13 As depicted in Table 3, other than more men riding on Sunday (47% versus 43% on Saturday), the demographic profile of Saturday and Sunday riders are effectively indistinguishable from one another. Table 3: Demographic Profile - Saturday/Sunday Gender Female Male Saturday 57% 43 Sunday 53% 47 Median Household Income $10,000 $10,000 Mean Household Income $13,000 $14,000 Mean Age (Years) Ethnicity Hispanic/Latino African-American/Black White/Caucasian Asian/Pacific Islander 60% %
14 TRAVEL CHARACTERISTICS OF ONE-WAY TRIP Number of Buses/Trains Used Table 4 indicates that weekend Metro Bus riders typically ride more than one train or bus in the course of their one-way trip, with a very substantial 73% of riders using more than one bus or train. Among the buses and trains used by weekend Metro Bus patrons, the vast majority are MTA bus and rail trip segments (97%), leaving only 3% for other bus/rail systems. Among these other systems, Foothill Transit and Santa Monica Big Blue Bus each carry slightly more than one-half of 1% of weekend Metro Bus riders' trip segments. Table 4: Number of Buses/Trains Used on One-Way Trip (Weekend) MTA System San Fernando Valley San Gabriel Valley West Central South Bay Gateway One Bus 27% 24% 24% 24% 27% 33% Two Buses/Trains Three Buses/Trains Four or More Buses/Trains Table 4 also shows that riders in each MTA service sector ride more than one bus or train in very similar patterns, with the exception of Gateway, in which weekend sector riders use only one bus 8
15 to a greater extent (33%) than do riders in the other sectors. San Fernando Valley riders (16%) use 4 or more buses or trains to a greater extent than do riders in the other sectors. Similar to the bus system as a whole, riders in each of the sectors overwhelmingly use MTA buses and trains, ranging from a low of 96% in the San Gabriel Valley to 99% in the San Fernando Valley. In the San Gabriel Valley sector, slightly more than 1% of weekend MTA riders trip segments are on the Foothill Transit bus system. Mode of Access/Egress Table 5 shows that 95% of weekend Metro Bus riders walk to the first bus or rail car of their trip, with West Central service sector riders walking to the greatest extent (98%) and San Fernando Valley riders to the least (92%). Those patrons who ride the bus under one day per week walk less than riders who use the bus 5 or more days per week (87% versus 96%). Table 6 shows that weekend bus riders walk (94%) to their final destination after they get off their last bus or train. This is consistent across service sectors. Bus riders who ride the bus at least once per week walk to their final destination (94%) more than those who ride the bus less than once per week (79%). Origins and Destinations Table 7 indicates that weekend bus riders come primarily from home (75%) before they get on the first bus or train of their one-way trip. Riders in the West Central (81%) and San Gabriel Valley (79%) sectors indicated the highest percentage of origins from home, while riders in the San Fernando Valley have the lowest (64%). San Fernando Valley riders originate from work (16%) more than riders from the other sectors (10%-12%). Table 8 shows that the most prevalent destinations of weekend bus riders after they get off the last bus or train of their one-way trip are work (36%) and home (30%). This lack of symmetry between home as origin (75%) and destination (30%) indicates that, although the surveys were distributed throughout the day, the respondents tended to provide information about their first trip rather than their return trip. A likely contributor to this differential is the mail back option provided 9
16 Table 5: Mode of Travel to First Bus/Train by Sector Weekend MTA System San Fernando Valley San Gabriel Valley West Central South Bay Gateway Walked 95% 92% 95% 98% 94% 94% Dropped Off Drove Bicycle Other* *Other category consists of predominantly unspecified responses. Table 6: Mode of Travel to Destination After Getting Off Last Bus/Train by Sector Weekend MTA System San Fernando Valley San Gabriel Valley West Central South Bay Gateway Walked 94% 94% 93% 93% 94% 95% Picked Up Drove Bicycle Other* *Other category consists of predominantly unspecified responses. 10
17 Table 7: Place Coming From Before Getting On First Bus/Train by Sector Weekend MTA System San Fernando Valley San Gabriel Valley West Central South Bay Gateway Home 75% 64% 79% 81% 73% 76% Work School Shopping Social/Recreation/ Church Medical Other (child care, airport) to riders. Those riders who completed surveys may have reported their first trip even if they were handed the survey on their return trip. Riders in the San Gabriel Valley and West Central indicated the highest percentage of work destinations (38% each), while riders in the South Bay (35%) and Gateway (34%) sectors indicated the lowest. San Fernando Valley riders have shopping as a destination (16%) more than other sectors (8%-11%). The distribution of trips within and among sectors is depicted on the maps that follow. West Central sector riders remain within the West Central area (65%) more than other riders remain within their sectors. San Gabriel Valley riders travel outside of their sector (58%) more than riders in other sectors. It is the only sector where a majority of riders do not travel entirely within their own sector. In the San Gabriel Valley, there is still an intra-sector plurality, indicating significant bus travel within the sector. The major destination for riders outside of their own sector is West Central. For all 11
18 sectors, other than Gateway, travel to West Central is equal to or more frequent than all travel to the remaining sectors combined. Regarding travel within the West Central sector, Appendix B shows that much of the intra-sector West Central travel is actually movement from the Westside to Central Los Angeles. Table 8: Destination After Getting Off Last Bus/Train by Sector Weekend MTA System San Fernando Valley San Gabriel Valley West Central South Bay Gateway Home 30% 33% 28% 27% 29% 32% Work School Shopping Social/Recreation/ Church Medical Other (child care, airport) It is clear that the popular urban growth theories that detail the declining importance of the center city are not applicable to transit usage. Los Angeles is not necessarily the loosely connected association of unrelated suburbs that has so often been portrayed. To the contrary, it is significantly interwoven by transit to and through its central core. 12
19 Destinations of Weekend Bus Trips Originating in South Bay San Fernando Valley 4% West Central 30% San Gabriel Valley 6% 52% South Bay 8% Gateway Service Areas Gateway San Fernando Valley San Gabriel Valley N South Bay West Central W S E Map 1: Destinations of Weekend Bus Trips Originating in South Bay 13
20 Destinations of Weekend Bus Trips Originating in Gateway San Fernando Valley 4% West Central 23% 5% San Gabriel Valley 17% South Bay 51% Gateway Service Areas Gateway San Fernando Valley San Gabriel Valley South Bay N West Central W E S Map 2: Destinations of Weekend Bus Trips Originating in Gateway 14
21 Destinations of Weekend Bus Trips Originating in San Fernando Valley San Fernando Valley 58% 23% West Central San Gabriel Valley 8% 6% South Bay 5% Gateway Service Areas Gateway San Fernando Valley San Gabriel Valley South Bay N West Central W E S Map 3: Destinations of Weekend Bus Trips Originating in San Fernando Valley 15
22 Destinations of Weekend Bus Trips Originating in San Gabriel Valley San Fernando Valley 7% West Central 29% 42% San Gabriel Valley 10% South Bay Gateway 12% Service Areas Gateway San Fernando Valley San Gabriel Valley South Bay N West Central W E S Map 4: Destinations of Weekend Bus Trips Originating in San Gabriel Valley 16
23 Destinations of Weekend Bus Trips Originating in West Central San Fernando Valley 6% West Central 65% San Gabriel Valley 9% 12% South Bay 8% Gateway Service Areas Gateway San Fernando Valley San Gabriel Valley South Bay N West Central W E S Map 5: Destinations of Weekend Bus Trips Originating in West Central 17
24 Production/Attraction Employing the Production/Attraction transportation planning tool, it is possible to analyze the trip purposes of MTA bus riders. Production/Attraction classifies any home-based or homedestination trip as a trip produced at home and attracted by the other end of the trip (e.g., work, school, shopping). All other trips (not involving home) are recorded strictly as being produced at the point of origin and attracted by the destination. Even on weekends, the work trip is the major purpose for using the bus system. Figure 1 depicts the trip purposes in the Production/Attraction mode for all weekend riders. It shows that the home-work trip represents 46% of all weekend bus trips, followed by home-shopping/social/ recreational (22%) and home-other (16% including medical, church, children, bank, auto repairs, among others). Figure 2 examines this factor controlling for frequency of riding and indicates that the homework trip declines in importance as riding frequency declines. That is, whereas home-work trips are 51% of all trips taken on weekends by people who ride the bus 5 or more days per week, these trips decline to 21% for 1-2 day per week travelers and down to 5% for riders who use the bus less than once per month (not shown on Figure 2). In total, home-produced trips represent 90% of all weekend trips for riders who use MTA buses 5 or more days per week, 1 86% for those who ride 3-4 days, and 90% for 1-2 day riders. Home-produced trips decline to 79% for riders of less than once per month. Table 9 shows the major trip purposes by service sector. Home-work trips are of lesser significance in South Bay (41%), Gateway (45%), and San Fernando Valley (46%) than they are in the San Gabriel Valley (52%) and West Central (51%). Home-social/shopping/recreational trips are consistently the second most prevalent trip purpose for weekend bus trips. 1 This total and the others that follow, include the data reflected in Figure 2 plus home-school trips (5% for 5+ day riders 2% for 3-4 day riders 3% for 1-2 day riders). 18
25 Fewer trips are work-related (e.g., home-work, work-shopping, school-work) on Sunday (47%) than on Saturday (53%), with Sunday's social/recreational/shopping trips more significant (31%) than are these trips on Saturday (24%). Table 9: Major Trip Purposes (Production/Attraction) by Service Sector - Weekend San Fernando Valley San Gabriel Valley West Central South Bay Gateway Home-Work 46% 52% 51% 41% 45% Home-Shopping/ Social/Recreation Home-Other Work Produced* School Produced* Shopping/Social/ Recreation Produced* Home-School *These include all non-home trips that originate at work, school, or a shopping/social/recreational site (e.g., work-work, work-shopping, school-social). 19
26 50% Figure 1 Trip Purpose (Production/Attraction) MTA Bus Weekend 45% 40% 35% 30% 25% 20% 15% 10% 5% 0% Home-Work Home-Shopping- Social/Recreational *Other includes medical, church, childcare, among others. Home-Other* Home-School Work-Work Shop- Social/Recreational- Shop- Social/Recreational All Other Trip Purposes Figure 1 Trip Purpose (Production/Attraction) MTA Bus Weekend 20
27 Figure 2 Major Trip Purposes (Production/Attraction) by Riding Frequency MTA-Weekend 60% Riders of 5 or More Days per Week Riders of 3-4 Days per Week Riders of 1-2 Days per Week 50% 51% 40% 37% 30% 30% 31% 29% 20% 21% 20% 23% 14% 10% 0% Home-Work Home-Shopping/Social/Recreational Home-Other* *Other includes medical, church, childcare, among others. Figure 2: Major Trip Purposes (Production/Attraction) by Riding Frequency MTA- Weekend 21
28 Travel Time Figure 3 that shows that an average weekend one-way trip takes 60 minutes. The largest single component is time on all buses and trains (25 minutes). Getting to and from buses and trains consumes 10 minutes each. Riders wait an average of 15 minutes for all weekend buses and trains. Mean travel times (not shown) are greater than the medians (71.1 total minutes versus 60 minutes) because there are some very long trips indicated that skew the mean upward. Table 10 indicates that riders in the San Gabriel Valley make the longest average one-way trip (70 minutes). Waiting time is lowest (12 minutes) in Gateway. West Central riders spend the least amount of time traveling (55 minutes), especially travel time on buses and trains (20 minutes). San Gabriel Valley and Gateway riders take the greatest amount of time getting from their last stop to their final destination (15 minutes each). Frequency of Use Figure 4 shows that 83% of weekend bus riders are frequent riders who use Metro buses 5 or more days per week, with mean usage of the Metro bus system at 5.0 days per week. There is some minor variation in that riders in the San Fernando Valley and South Bay have the highest percentage of frequent riders, while the Gateway sector has the lowest level of frequent riders (84% versus 81%). Method of Payment Figure 5 shows that well over one-half (55%) of Metro bus riders use passes to pay their boarding fare. Figure 5 also shows that 34% of passholders use the regular monthly pass, with the weekly pass (23%) next in usage, and the semi-monthly pass following at 14%. Table 11 shows that passholders are predominant in the South Bay sector (60%) but least prevalent in the San Fernando Valley and Gateway sectors (each 50%). 22
29 Figure 3 Median Time Spent on Various Components of One-Way Trip (in minutes) MTA Bus--Weekend Getting to First Bus/Rail Stop 10 Waiting for All Buses/Trains 15 Traveling on All Buses/Trains 25 Getting from Last Stop to Final Destination 10 Total Time Traveled Figure 3: Median Time Spent on Various Components of One-Way Trip MTA Bus- Weekend 23
30 90% 83% Figure 4 Frequency of Riding Metro Buses MTA System-Weekend 80% 70% 60% % of 5+ Day Riders by Sector San Fernando Valley San Gabriel Valley West Central South Bay Gatew ay 84% 83% 83% 84% 81% 50% 40% 30% 20% 10% 0% 5 or more Days Per Week 11% 4% 3-4 Days Per Week 1-2 Days Per Week Less Than Once Per Week 1% 1% 0% Less Than Once per Month First Time Figure 4: Frequency of Riding Metro Buses MTA System- Weekend 24
31 Figure 5 Method of Payment Used to Board First Bus/Train of One Way Trip MTA Bus Weekend 60% 50% 40% 55% Kind of Pass Regular Monthly Regular Weekly Regular Semi-Monthly Disabled Senior Student Other 34% 23% 14% 12% 10% 4% 3% mean cash fare = $1.47 median cash fare = $ % 24% 21% 20% 10% 0% Pass Cash Token Figure 5: First Bus/Train of One Way Trip MTA Bus- Weekend 25
32 Table 10: Median Time Spent on Various Components of the One-Way Trip (in minutes) by Service Sector - Weekend San Fernando Valley San Gabriel Valley West Central South Bay Gateway Getting to First Bus/Rail Stop Waiting for All Buses/Trains Traveling on All Buses/Trains Getting from Last Stop to Final Destination Total Time Traveled* *Total time traveled is the sum of the above individual trip components; it is not a median. Table 11: Method of Fare Payment by Service Sector - Weekend San Fernando Valley San Gabriel Valley West Central South Bay Gateway Pass 50% 55% 55% 60% 50% Cash Token
33 Figure 5 also shows that 24% of MTA bus riders pay their boarding fare with cash. The mean cash fare is $1.47 and the median fare is $ Riders in the San Fernando Valley pay their fare with cash to a greater extent than riders in the other sectors (31%). Riders 51 years of age and older tend to use passes more than do riders 25 years of age and younger (69% versus 40%). 1 The boarding fare on each line is $1.35 and the cost of a transfer is $
34 SATISFACTION WITH METRO BUS SERVICE FEATURES Generally speaking, Metro Bus weekend riders are satisfied with the service features provided by MTA. Figure 6 shows that overall satisfaction for the entire MTA system is 2.4 on a scale of 1-5, with 1 = very good and 5 = very poor. More than one-half (55%) of all riders on weekends rate overall services as either very good or good. Figure 6 also shows that convenience of route is the most satisfactory of all features (2.1). Next in order of satisfaction is safety while waiting for or riding buses (2.2)... Buses being on time and time spent waiting for a bus are rated as least satisfactory (each 2.8). Using Pearson's r measures of association (Table 12), it is possible to identify those individual features that are most correlated with overall satisfaction. Satisfaction with cost of fare (r =.47), safety (r =.52), and convenience of route (r =.55) have the lowest correlation with the overall satisfaction, although these are moderately strong associations. Satisfaction with buses being on time (r =.64) and buses do not pass by (r =.62) have the strongest satisfaction with overall satisfaction and can be classified as strong relationships. The balance of features all demonstrate correlations with overall satisfaction of between.60 and.61. Taken together, all 11 features explain 68% of overall weekend satisfaction (R 2 =.68), leaving 32% to be explained by other features or characteristics. Income, frequency of travel, amount of fare paid, and age are not important contributors to explaining overall satisfaction, all of which demonstrate weak associations with overall satisfaction. Table 13 shows that riders in the Gateway sector are more satisfied with overall bus service (2.3) than are riders in other sectors, however, the differences are small. The specific service features within the Gateway sector that are most satisfactory in comparison to other sectors are convenience of route (2.0), travel time (2.2), cleanliness inside bus (2.5), and buses being on time (2.6). 28
35 Figure 6 Mean Satisfaction Ratings for Various Features of MTA Bus Service--Weekend (1=very good; 2=good; 3=fair; 4=poor; 5=very poor) Convenience of Route Safety Waiting for/riding Buses Bus Feature % Indicating Choices 1 & 2 Driver Courtesy Travel Time on Bus Overall Bus Service Buses Stop & Do Not Pass By Cost of Fare Cleanliness Inside Bus Availability of Seats/Space on Bus Convenience of Route Safety Waiting... Driver Courtesy Travel Time on Bus Overall Bus Service Buses Stop... Cost of Fare Cleanliness Inside Bus Availability of Seats... Availability of Schedules Buses On Time Time Spent Waiting... 66% 66% 58% 57% 55% 54% 53% 49% 49% 49% 44% 43% Availability of Schedules & Route Info 2.7 Buses On Time 2.8 Time Spent Waiting for Bus Figure 6: Mean Satisfaction Ratings for Various Features of MTA Bus Service- Weekend 29
36 Table 12: Strength of Relationships Between Overall Satisfaction and Satisfaction With Individual Service Features MTA Weekend Bus Riders Service Feature Measure of Association Between Satisfaction with Feature and Overall Satisfaction (Pearson's r) Buses On Time.64 Buses Do Not Pass By.62 Travel Time.61 Cleanliness Inside Bus.61 Availability of Schedules/Timetables.61 Time Waiting for Bus.61 Driver Courtesy.60 Availability of Seats/Space.60 Convenience of Route.55 Safety Waiting/Inside Buses.52 Cost of Fare.47 30
37 Table 13: Satisfaction With Various Service Features* by Service Sector Weekend (1 = very good; 5 = very poor) San Fernando Valley San Gabriel Valley West Central South Bay Gateway Convenience of Route Safety Driver Courtesy Travel Time Overall Bus Service Buses Do Not Pass By Cost of Fare Cleanliness Inside Bus Availability of Seats/Space Availability of Schedule/Route Information Buses on-time Time Waiting *Listed in same order as Figure 6 for comparison purposes. 31
38 San Gabriel Valley riders are least satisfied with overall bus service (2.5) but otherwise do not demonstrate significant differences by specific service feature. San Fernando Valley riders show the greatest satisfaction with safety (2.1) but are least satisfied of all riders regarding time waiting (3.0), buses on time (2.9), and availability of schedules and route information (2.9). The contrast between Saturday and Sunday riders is remarkably indistinct, with exactly the same satisfaction ratings for all service features other than.1 differences in buses being on time (in favor of Sunday) and seat/space availability (in favor of Saturday). Statistical tests of significance (Analysis of Variance, Independent Samples t-test, and Chi- Square) were performed upon the data in order to evaluate the possible existence of relationships between demographic/travel characteristics and satisfaction. Statistically significant relationships that might offer further insight for MTA marketing and MTA operations are highlighted below. Only differences of.4 or greater in satisfaction ratings are reported, although certain other differences are also statistically significant, indicative of real, but relatively inconsequential distinctions. Ethnicity: Asians are significantly more dissatisfied than other ethnic groups with regard to most service features, including the following: Time waiting (3.2 versus 2.7 for African-Americans and Whites and 2.8 for Latinos). Convenience of route (2.4 versus 1.9 for Whites). Income: Riders who earn under $7,500 are more satisfied with the cleanliness inside the bus (2.5) than are those who earn $25,000 and more (2.9). Riders earning under $7,500 are more satisfied with route information and schedule availability (2.5) than are those who earn $25,000 and more (2.9). 32
39 Frequency of Riding: Riders who ride buses 3 or more days per week are less satisfied with the availability of schedules and route information (2.7) than are those who ride less than one day per week (2.2). Riders who use the bus 3 or more days per week are also more dissatisfied with buses that pass them by (2.5) than are those who ride 2 days or less per week (2.1). As a corollary to satisfaction, riders were asked which service feature they would most want to be improved. Figure 7 shows that riders prefer that buses being on time (19%) and time waiting for the bus (18%) were selected most for improvement. This is consistent with the poorer satisfaction rating that these features demonstrated. Overall satisfaction is highest for weekend riders who want schedule availability (2.1) and cost of fare (2.1) improvements, while it is lowest on the weekends among riders who prefer improvements to safety (2.7), travel time (2.7), and buses on time (2.6). Differences among various demographic and travel characteristic subgroups that exceed 6% are provided below. No notable differences, however, exist between Saturday and Sunday riders. Age: Riders over 50 years of age are more inclined to prioritize safety (10% versus 3% for those 25 and under) and on-time performance (24% versus 15% for those 40 and under). Riders over 40 are less inclined to give priority to waiting time (15%) than are younger riders age 25 and under (24%). Ethnicity: Latinos prioritize improvements to waiting time (20%) and driver courtesy (13%) more than do White riders (16% and 5%, respectively). Whites give priority to seat/space availability (19%) to a greater extent than do Latinos (9%) and Asians (12%). Asians demonstrate greater priority for safety improvements (10%) than do Whites (2%) and for on-time improvements (21%) more African-Americans (16%). Frequency: Riders who use the bus 3 or more days per week prioritize on-time performance improvements (18%) more than do less frequent travelers (10%). Those who travel less than once per week give priority to safety enhancements (17%) substantially more than do riders who use the bus at least once per week (4%). 33
40 Attraction: Waiting time improvements are of a higher priority for those riders going to school (24%) than for those going to work (17%). On-time improvements, however, are more important to those going to work (19%) than those going to school (12%). Improvements to seating and space availability have greater priority among those going to school (17%) and to shopping/recreation/social attractions (16%) than among those going to work (10%). 34
41 Figure 7 Service Feature Desired to Be Improved-- MTA Weekend Bus Riders 19% 18% 12% 10% 9% 7% 7% 7% 5% 4% 2% Travel Time Convenience of Route Safety Buses On Tim e Time Waiting Availability of Seats/Space Driver Courtesy Buses Not Pass By Cost of Fare Cleanliness Inside Bus Availability of Schedules/Route Info 25% 20% 15% 10% 5% 0% Figure 7: Service Feature Desired to Be Improved- MTA Weekend Bus Riders 35
42 APPENDIX A: METHODOLOGY Survey Design The FY 2002 On-Board Bus Survey was designed by the combined efforts of the MTA staff and Rea & Parker Research. The process of survey design involved focus groups in March and April Each set of 2 focus groups covered a specific theme. On March 6, two groups in Central Los Angeles were conducted (one in Spanish) concerning advertising the survey with car cards and takeones in addition to identifying the incentives that would contribute most to encouraging participation among riders. Two focus groups were held in Norwalk on March 29 one among young riders to identity their willingness to participate and to pretest some aspects of the survey (e.g., question phrasing, comprehensiveness, understandability, relevance). Two further groups were conducted on April 5 in the Crenshaw area of Los Angeles (one among African-Americans typically an under-participating group of riders). And, lastly, the survey was pretested in East Los Angeles in two focus groups of Latinos in East Los Angeles one group in Spanish. One further focus group was held in August to pretest the telephone survey. Formal pretests of the preliminary survey instrument were conducted on Line 30 and Line 66 from April 19-22, 2001, and again on May 1, These pretests involved 1,128 respondents, 56% of whom (635) provided surveys that were at least 75% complete and 41% of which (466) were completed in Spanish. Problems were identified in respondents' accurately recording other buses and trains that were a part of their trip, in their providing generic responses to specific address requests (e.g., "my home" or "trabajo" instead of addresses), and in their reluctance to complete all 12 parts of the satisfaction questions. Efforts were undertaken to clarify and make bolder certain instructions, to clarify certain wording, and to shorten the "appearance" of the survey instrument. The final survey instrument for MTA buses is attached to this report in Appendix C. There are a total of 19 questions, including an unnumbered home address, totaling 40 individual items (variables). 36
43 Sample Initially, a random sample of bus runs was selected in order to achieve a distribution among bus lines that would include a minimum of 10,000 weekend respondents, 75% of whom (7,500) were to have completed their surveys with sufficient thoroughness to be considered "completed surveys," as defined by MTA below. A "completed" survey shall have: Validated (logically ordered and reasonable) origin and destination x/y coordinates, validated (logically ordered and reasonable) boarding stop and alighting stop x/y coordinates, validated (reasonable) home address x/y coordinates, trip purpose, mode of access and mode of egress. For a survey to be considered complete, it must also have a unique ID number, the line/route, direction, the time period ("peak" or "off-peak") and at least 75% of all other items completed (namely, demographics, trip characteristics, and customer-satisfaction ratings). The initial weekend sampling plan is attached to this Appendix. The number of runs selected was based upon MTA boarding statistics and an assumed 23% response rate, as suggested in the MTA Request for Proposals. On each sampled bus, every passenger of age 13 and over was offered a survey. Survey implementation began on May 29, 2001, and continued into August 2001, when it became apparent to Rea & Parker Research that a 23% response rate was not to be achieved for a variety of reasons, in particular the increased difficulty and complexity of this survey instrument in comparison to the prior one, a completely different sampling plan in this survey compared to the prior one (no effort was made to census smaller volume lines in the previous survey in order to achieve ± 5% margins of error for each line). The initial sampling plan called for surveying to be complete within approximately 20 weeks (mid-october, 2001), but the discovery of the lower response rate caused the sampling plan to be revised to 3,500 weekend MTA participants, with an extension of time to complete surveying to December In early 2002, once the surveys were tallied, it was determined by Rea & Parker Research that there still existed a shortage in meeting the MTA objective. Supplemental surveys were 37
44 conducted in late February and early March 2002, once again on heavily traveled bus lines, but on bus runs not previously surveyed. Ultimately, buses carrying an estimated 64,000 weekend MTA patrons were surveyed. A total of 35,000 (approximate) surveys were distributed on the MTA weekend buses (55% of estimated ridership). From the surveys distributed, 3,794 weekend bus riders provided surveys that qualified as "complete," as defined above, or "acceptably incomplete" containing "some missing address, trip purpose, or mode of access/egress data and at least 50% of all other survey items completed." The response rate from MTA weekend surveys was 6% based upon MTA boarding statistics and 11% based upon actual surveys distributed. Manual post-coding of returned surveys indicated that 73% of the 3,794 MTA weekend surveys were identified as "complete." At a later stage, survey address data were geo-coded. The geo-coding process successfully geo-coded 2,791 MTA weekend boarding stops (74%), 3,114 MTA weekend origin locations (82%), 2,693 MTA weekend alighting stops (71%), 2,835 weekend destination locations (75%), and 2,721 MTA weekend riders' home addresses (74%). Overall, the 3,794 MTA weekend surveys represent a margin of error of ± 1.6%. By sampling plan quartile, the most lightly traveled quartile achieved a ± 6.0% margin of error, with the others achieving considerably better up to ± 2.3%. Among the weekend participants, 60% were Saturday riders and 40% were Sunday riders, reflecting MTA's boarding statistics of 58% on Saturday and 42% on Sunday. In order to establish satisfactory representativeness, weights were calculated and applied for each bus line (where more lightly traveled lines were over-sampled vis-a-vis heavier lines, especially during the early stages of the survey process). These weights (over 100 in number) are contained and described in full in the data set that accompanies this report. For further sample validation, direction of travel can be examined. Table A-1 depicts the distribution of the sample by direction traveled and demonstrates substantial directional symmetry for the sample. 38
45 Table A-1: MTA Weekend Sample Direction f % North South 1, East West 1, Total 3, Survey Implementation The implementation of a such a geographically widespread survey, covering almost all of Los Angeles County and so large in sample size, is a significant task and one that requires substantial personnel, supervision, and significant system controls. The bus runs that were randomly selected originate and end at one of MTA's 11 bus divisions throughout the County from Carson to El Monte to the San Fernando Valley. Rea & Parker Research survey staff members were assigned to board the bus either when it pulled out of the division or with a relief operator when he or she was driven with the surveyor by MTA from the divisions to a boarding stop en route. One last boarding option was at a bus stop that was a walkable distance away from the division. Surveyors reported to the division between 20 and 45 minutes preceding their assignment in order to allow time to prepare for their day and to travel to the bus at another site, if necessary. The Assignment Log for each surveyor contained their time of arrival at the division, the bus run assigned (recognizable on the vehicle itself by the bus route number and a small set of numbers viewable from the front of the bus under the operator area), where and when they would board and alight from the bus, the number of one-way trips their bus run was scheduled to make, and how they would reach or return from a bus stop other than at the division. Surveyors were further given Trip Logs for each 39
46 one-way trip that contained a list of all stops the bus would make in each direction so that the surveyor could record the survey numbers distributed at each stop. The Assignment Log and Trip Log forms are attached in sample form in this Appendix. A supervisor from Rea & Parker Research was on site at the division the entire time surveyors were in the field, from 4 a.m. to 9 p.m. on many occasions. One last control form was utilized the Survey Number Assignment sheet, also attached in this Appendix. This form assigned a specific number of pre-numbered surveys to each assignment (cross-referenced to the Assignment Log number) for on-site supervisors to give to the on-board surveyors. The number of surveys assigned was based upon the pretest and varied from 67% to 80% of the estimated number of riders on-board the bus run, depending upon the total volume (a lower percentage for higher volume buses). At the end of each week, all undistributed surveys were tallied in order to identify the adequacy of the number of surveys being provided to the surveyors. With a few minor early adjustments (some early bus runs were allocated 60%), these percentages held for the entirety of the survey process. On-board surveyors boarded the buses, made certain that a collection bag for passengers to return surveys as they alighted at the rear door was in place, and then assumed their position at the front door in order to distribute surveys to bus patrons as they boarded. Surveyors were instructed to stay at the front door so that they would always know the stop being made (for recording purposes) and always be available to distribute surveys to boarding passengers. Surveyors were provided with a tote bag for their surveys, pencils to distribute to passengers who needed them, a clipboard to facilitate the completion of the Trip Logs, a safety vest, identification badge, and a sign to post in the front of the bus informing passengers that there would be a "Survey Today." At the end of their assignment, surveyors returned the completed surveys collected from passengers or taken from the collection bag to the on-site supervisor for review of quality and quantity and in order to ascertain the adequacy of surveyor performance. 40
47 Weekend Sampling Plan Saturday and Sunday MTA bus routes have been allocated 10,000 surveys in the 2001 On- Board Survey. With average Saturday ridership volume at 615,935 and Sunday at 448,227, the allocation (57.9%-42.1%) between the two days on a proportionate basis is 5,800 Saturday surveys and 4,200 Sunday surveys. In order to achieve these samples, approximately 29,000 and 21,000 riders will have to be approached for participation on Saturday and Sunday, respectively (assuming a 20% response rate). Initially, samples involving representation of all lines was contemplated; however, with a mean ridership per run of approximately 540 on Saturdays and 495 on Sundays, the total number of runs to be surveyed on Saturdays would be approximately 54, with 42 on Sundays. The total number of lines (including contracted lines) operating on these days is 107 (Saturday) and 103 (Sunday). In order to achieve so few as just one sampled run per line, the runs would have to be divided into smaller fractional runs approximately ½ runs on Saturday and 2/5 runs on Sunday. This is somewhat inefficient in terms of manpower deployment and, more importantly, very short of adequate representation on large volume lines. Therefore, Rea & Parker Research proposed an alternative approach that has been approved by MTA. Saturday and Sunday samples were not to be structured to achieve representation on each line and instead were to be stratified into four groupings of bus lines on each of those days, allocated according to natural breaks in the ridership volumes, with roughly equal numbers of lines in each strata, as follows in Exhibit 1 (note that differences between this plan and the earlier memorandum recommending this approach are due to the addition of contract lines to the database): 41
48 Exhibit 1 Distribution of Weekend Bus Lines into Ridership Volume Quartiles Saturday Sunday Riders per line # of Lines Riders per line # of Lines I. under I. under II under II. 700 under III under III under IV and above 26 IV and above 25 In particular, Exhibit 2 depicts the weekend bus lines, including the number of bus runs included within those lines, and the strata to which they were assigned. For diversification purposes, runs were divided into ½ runs and randomly sampled within each stratum. Each stratum was sampled to achieve a minimum +/-5% margin of error, which was accomplished with an oversampling of the four smallest strata (two on Saturday and two on Sunday) and a small undersampling of the large ones. The disproportionate samples will be weighted and expanded to achieve an overall representative sample in the final analysis. Proportionate and disproportionate sample sizes, margins of error, and the corresponding number of riders to be approached are depicted in Exhibit 3. Exhibit 4 lists the bus runs ultimately selected in the samples. This methodology provides an adequate sample of large volume routes, in the aggregate, as opposed to the method initially considered (which would have significantly underrepresented them), and it also represents small volume routes, as an aggregated unit of analysis, to the same +/-5% margin of error as are the individual bus lines on weekdays thereby retaining a certain logic and methodologically symmetrical rationale. 42
49 Exhibit 2 Allocation of Specific Bus Lines to Weekend Strata Stratum Bus Lines # of Bus Runs Saturday I 22, 56, 58, 65, 102, 112, 124, 161, 167, 168, 205, 209, 214, 218, , 225, 232, 236, 250, 254, 256, 270, 487, 608, 631 Saturday II 96, 107, 125, 130, 154, 158, 188, 201, 202, 245, 255, 262, 266, , 268, 305, 362, 401, 434, 439, 444, 460, 471, 483, 490, 550, 605 Saturday III 10, 38, 53, 55, 76, 78, 90, 92, 105, 108, 110, 115, 117, 120, 150, , 163, 166, 200, 206, 212, 217, 230, 234, 260, 446, 484, 603, 750 Saturday IV 14, 16, 18, 20, 26, 28, 30, 33, 40, 45, 60, 66, 68, 70, 81, 94, 111, , 165, 180, 204, 207, 210, 251, 561, 720 Sunday I 22, 56, 58, 65, 96, 102, 112, 124, 130, 161, 167, 201, 202, 205, , 218, 220, 250, 254, 256, 267, 270, 401, 444, 471, 490, 631 Sunday II 10, 90, 107, 120, 125, 158, 166, 188, 232, 236, 245, 255, 262, 266, , 305, 362, 434, 439, 460, 487, 550, 605 Sunday III 38, 53, 76, 78, 92, 105, 108, 110, 115, 117, 150, 152, 163, 165, , 206, 212, 230, 234, 251, 260, 446, 483, 484, 561, 603, 750 Sunday IV 14, 16, 18, 20, 26, 28, 30, 33, 40, 45, 55, 60, 66, 68, 70, 81, 94, , 156, 180, 204, 207, 210, 217,
50 Exhibit 3 Sample Sizes/Number of Riders Needed by Stratum (Weekend) Stratum Total Riders Proportionate Sample Size* Disproportionate Sample Size** Margin of Error +/- Number of Riders Needed*** Saturday I 8, % 1,825 Saturday II 40, % 1,900 Saturday III 147,071 1,385 1, % 6,925 Saturday IV 420,460 3,958 3, % 18,350 Total Saturday 615,935 5,800 5, % 29,000 Sunday I 10, % 1,850 Sunday II 22, % 1,890 Sunday III 162,083 1,519 1, % 6,720 Sunday IV 253,098 2,371 2, % 10,540 Total Sunday 448,227 4,200 4, % 21,000 * Based upon total sample sizes of 5,800 Saturday and 4,200 Sunday ** In order to achieve maximum +/- 5% margins of error for each stratum, smaller strata are to be oversampled, with slight undersampling of larger strata. All undersampling was allocated to Saturday IV because of its dominant size. On Sunday, the undersampling was allocated between Sunday IV and Sunday III. *** Assuming 20% response rate 44
51 Exhibit 4 Randomly Selected Sample Weekend Bus Runs Stratum Bus ½ Runs (Early ½ designated as -1 ; Late ½ as -2 ) Saturday I , , , , , , , , , , , , , , , , , , , , Saturday II , , , , , , , , Saturday III , , , , , , , , , , , , , , , , , , , , , , , , , , , , Saturday IV , , , , , , , , , , , , , , , , , , , , , , , , , , , , , , , , , , , , , , , , , , , , , , , , , , , , Sunday I , , , , , , , , , , , , , , , , , , , , , Sunday II , , , , , , , , , , Sunday III , , , , , , , , , , , , , , , , , Sunday IV , , , , , , , , , , , , , , , , , , , , , , , , , , , , ,
52 Trip Log To be completed by surveyor for each trip Assignment # Trip of MTA 2001 On-Board Survey Surveyor: Date: Day of Week: Bus Line(s) Direction Trip Start Location Trip End Location 10 (48-11) West Avalon Blvd/Avalon Stat Santa Monica/Larrabee STREET STOP CODE AT STREET STARTING SURVEY # AVALON BLVD 580 AVALON STA LAYOVER AVALON TH AVALON TH IMPERIAL 583 AVALON IMPERIAL 584 SAN PEDRO SAN PEDRO TH SAN PEDRO TH SAN PEDRO TH SAN PEDRO TH SAN PEDRO 589 CENTURY SAN PEDRO 590 COLDEN SAN PEDRO ND SAN PEDRO TH SAN PEDRO 593 MANCHESTER SAN PEDRO RD SAN PEDRO ST SAN PEDRO TH SAN PEDRO TH SAN PEDRO TH SAN PEDRO 599 FLORENCE SAN PEDRO TH SAN PEDRO TH 46
53 SAN PEDRO TH GAGE 603 SAN PEDRO GAGE 604 MAIN MAIN ST MAIN TH MAIN 607 SLAUSON MAIN TH MAIN TH MAIN RD MAIN ST MAIN TH MAIN TH MAIN 614 SAN PEDRO MAIN 615 VERNON MAIN RD MAIN ST MAIN ST 618 KING BL KING BL 619 MAIN ST WOODLAWN AV 620 KING BL WOODLAWN 621 MAPLE MAPLE TH MAPLE TH MAPLE 624 JEFFERSON MAPLE TH MAPLE TH MAPLE 627 ADAMS MAPLE RD MAPLE ND MAPLE 630 WASHINGTON MAPLE TH MAPLE 632 PICO MAPLE TH MAPLE TH MAPLE 635 OLYMPIC MAPLE 636 9TH MAPLE 637 8TH 8TH 638 MAPLE 8TH 639 SANTEE 8TH 640 SPRING 8TH 641 BROADWAY 8TH 642 HILL S HILL ST 643 BROADWAY/7TH TMPT HILL 644 7TH HILL 645 6TH HILL 646 5TH HILL 647 4TH 47
54 HILL 648 3RD HILL 649 2ND HILL 650 1ST HILL 651 TEMPLE TEMPLE 652 HILL TEMPLE 653 GRAND TEMPLE 654 FIGUEROA TEMPLE 655 BEAUDRY TEMPLE 656 BOYLSTON TEMPLE 657 EDGEWARE TEMPLE 658 DOUGLAS TEMPLE 659 GLENDALE TEMPLE 660 BELMONT TEMPLE 661 BONNIE BRAE TEMPLE 662 ALVARADO TEMPLE 663 ROSEMONT TEMPLE 664 PARKVIEW TEMPLE 665 RAMPART TEMPLE 666 OCCIDENTAL TEMPLE 667 VENDOME TEMPLE 668 ROBINSON TEMPLE 669 HOOVER TEMPLE 670 VIRGIL PL TEMPLE 671 VIRGIL BEVERLY 672 MADISON VERMONT 673 BEVERLY VERMONT 674 ROSEWOOD VERMONT 675 HOLLYWOOD VERMONT 676 CLINTON VERMONT 677 MELROSE MELROSE 678 EDGEMONT MELROSE 679 ALEXANDRIA MELROSE 680 NORMANDIE MELROSE 681 HARVARD MELROSE 682 WESTERN MELROSE 683 WILTON MELROSE 684 VAN NESS MELROSE 685 BRONSON MELROSE 686 WINDSOR MELROSE 687 LARCHMONT MELROSE 688 VINE MELROSE 689 ARDEN LAYOVER MELROSE 690 CAHUENGA MELROSE 691 WILCOX MELROSE 692 JUNE MELROSE 693 LAS PALMAS 48
55 MELROSE 694 HIGHLAND MELROSE 695 ORANGE MELROSE 696 LA BREA MELROSE 697 FORMOSA MELROSE 698 POINSETTIA MELROSE 699 MARTEL MELROSE 700 GARDNER MELROSE 701 SPAULDING MELROSE 702 OGDEN MELROSE 703 FAIRFAX MELROSE 704 CRESCENT HEIGHTS MELROSE 705 HARPER MELROSE 706 ORLANDO MELROSE 707 LA CIENEGA MELROSE 708 HUNTLEY MELROSE 709 SAN VICENTE SAN VICENTE 710 MELROSE SANTA MONICA 711 SAN VICENTE SANTA MONICA 712 LARRABEE 49
56 MTA ON-Board Survey Assignment Log To be completed by Rea & Parker Research Project Manager and On-Site Supervisor Assignment# Surveyor: DATE: Day of Week: LINE #: BUS RUN (BLOCK)#: EARLY/LATE ½ RUN NUMBER OF TRIPS SCHEDULED ON RUN: STARTING DIRECTION: COLLECTION BAG/POSTER INSTRUCTIONS: Collection Bag Instruction Key: I/L=Install bag at rear door poster behind driver: Leave on board when finished for the day E/R=Existing bag/poster should be there: Remove when finished I/R=Install: Remove when finished [NOTE: Bring extra collection bag and poster in case they are not there] Scheduled Sign In Time: Sign In Site (Division #): Bus Departure Time: Boarding Site (if different from Sign-In): Directions to Boarding Site (if different) Final Stop: Final Stop Time (approx) Scheduled Sign Out Time Sign Out Site (Division #): Directions back to Sign out Site (if different from Final Stop Site): ************************************************************************ Actual Sign In Time: Actual Sign Out Time: Initials (when log form complete) 50
57 To be completed by Rea & Parker Research Project Manager/On-Site supervisor SURVEY NUMBERS ASSIGNED For Bus Division Assignment # Start Survey # Ending Survey # Korean #s Chinese #s Date 51
58 APPENDIX B: PLANNING SUBREGIONS Format of Appendix Weekend Summary Of Findings This appendix presents six Figures and one map for each of seven Subregions of Los Angeles County, as follows: Figure 1: Demographic Profile Figure 2: Travel Characteristics Figure 3: Travel Time Figure 4: Satisfaction Ratings ( means) Figure 5: Satisfaction Ratings (percent choosing good and very good ) Figure 6: Service Features Most in Need of Improvement O/D Map: Destinations for Trips Originating in the Subregion Each Subregion's set of tables is grouped together and starts on the page indicated below: San Fernando Valley Subregion...56 South Bay Cities Subregion...62 Arroyo Verdugo Subregion...68 Gateway Subregion...74 Los Angeles Central Subregion...80 San Gabriel Valley Subregion...86 Westside Cities Subregion...92 Definitions of Subregions The Southern California Association of Governments (SCAG) distinguishes 8 planning Subregions in Los Angeles, the boundaries of which are based on the jurisdictional boundaries of local Councils of Government (COGs). For this study MTA made the following adaptations to these Subregions: (1) the San Fernando Valley was analyzed separately from the City of Los Angeles, (2) contiguous boundaries were drawn around the discontiguous Westside Cities Subregion, and (3) the thin corridor of the City of Los Angeles that stretches to Long Beach Harbor was reassigned to 52
59 neighboring Subregions. Each of these modifications effectively truncates the City of Los Angeles Subregion, the remainder of which is renamed the Los Angeles Central Subregion. The intent is to have each Subregion more accurately reflect transportation commonalities than does the use of meandering political boundaries. Two of the reconfigured Subregions drop out of the analysis because too few respondents live there: the Malibu/Las Virgenes Subregion and the North Los Angeles County Subregion. Demographics While females are the majority of MTA weekend bus in every Subregion, the proportion varies from 51% in the Gateway Subregion to 64% in the Westside Cities. There are large variations in ridership ethnicity by Subregion. Latinos constitute a plurality of patrons in three Subregions (South Bay, San Fernando Valley, and Westside), with a low of 33% in the Westside Cities. They form a majority of riders in the remaining four, with a high of 79% in the Gateway Subregion. Whites are the second most common weekend rider in three Subregions (San Fernando Valley, Arroyo Verdugo and Westside), with a high of 31% in the Westside Cities. They are the least common ethnic group (among the four major groups considered) among riders in the San Gabriel Valley (8%) and also represent low proportions in South Bay (9%), Los Angeles Central (7%), and Gateway (4%). African Americans are the second most common ethnic group among riders in three Subregions (Gateway, Los Angeles Central, and South Bay), with a high of 38% in the South Bay Cities. They are the third most common in the 4 remaining Subregions, with a low of 9% in the Arroyo Verdugo Subregion. Asians are the second most common weekend rider in the San Gabriel Valley (18%), otherwise they come in fourth, with as low a proportion as 2% in both the Arroyo Verdugo and the Gateway Subregions. Median incomes are lowest in Los Angeles Central ($9,000) and highest in Arroyo Verdugo and Westside ($15,000 each). Average age also varies considerably by Subregion, with a low of 39.6 years in the San Fernando Valley and a high of 45.6 years in the Westside Cities. 53
60 Travel Characteristics and Travel Time Most weekend patrons take the bus frequently an average of 5 days a week. Westside Cities riders are an exception; they take the bus 3.9 days a week. Weekend pass use varies dramatically by Subregion, with a high of 66% among Los Angeles Central riders and a low of 19% for Arroyo Verdugo riders. Cash use is highest in South Bay Cities at 47% and lowest in Los Angeles Central at 14%. Token use is very high in Arroyo Verdugo at 39% and lowest in the South Bay Cities at 16%. Home-work trips do not achieve majority in any of the Planning Subregions all of which demonstrate home-work trips between 40% and 48%, with the exception of Westside riders for whom home-work trips represent only 22% of weekend trips taken by bus. For Westside riders, homeshopping/social/recreation trips on weekends are 37%. Travel time does not vary by Subregion as much as do other travel characteristics the range is 60 to 65 minutes total time door to door. Satisfaction Overall satisfaction ranges from a high of 2.2 in Arroyo Verdugo to a low of 2.5 in Los Angeles Central. Satisfaction for separate service attributes is relatively consistent across Subregions. In six of the seven Subregions, Route Convenience and Safety are among the top two most satisfactory service features rated and Time Waiting is the least satisfactory. Buses Being On Time and Time Waiting are the features most often cited as most in need of improvement. Safety is seen as a major need in Arroyo Verdugo and the Westside Cities. Driver Courtesy is seen as most in need of improvement by a substantial minority of riders in San Gabriel Valley and Gateway although approximately 2/3 of the weekend patrons in both Subregions give high marks to it. South Bay Cities riders (23%) think that pass-ups are the problem most in need of fixing and a large number of Westside Cities riders (16%) think availability of seats is the major problem. 54
61 Subregional Origins and Destinations The Subregional maps in this appendix show where trips originating in each Subregion are destined. There is a common pattern for all Subregions: Intra-Subregional travel either makes up a majority or a plurality of trips in five of the seven Subregions. Los Angeles Central is either the most common destination or the second most common destination for all Subregions. Travel to Los Angeles Central is more common than all travel to the remaining Subregions combined. This is not the case for the San Fernando Valley. This central city orientation of inter-subregional travel, and its frequency, contradicts a popular notion of suburban disintegration from the urban core. Los Angeles is not necessarily the loosely connected association of suburbs that has so often been portrayed. To the contrary, it is interwoven by transit to and through its central core The one dramatic exception to this is the San Fernando Valley. With 67% of weekend bus trips being internal to the Subregion, and with connections to the Westside Cities being almost as common as those to Central Los Angeles, the San Fernando Valley has far less a Central Los Angeles orientation than any other Subregion. 55
62 Table B-1: San Fernando Valley Subregion Demographic Profile Weekend (n = 166) Gender Female Male 59% 41% Ethnicity Latino White African-American Asian 49% Median Household Income $11,000 Mean Age (years)
63 Table B-2: San Fernando Valley Subregion Travel Characteristics - Weekend Day Traveled Saturday Sunday Frequency of Riding Mean Number of Days Per Week Percentage Who Ride 5 or More Days Per Week 67% % Walk To First Stop From Last Stop 91% 93 Method of Payment Pass Cash Token Kind of Pass Regular Monthly Regular Weekly Regular Semi-Monthly Trip Purpose (Production/Attraction) Home-Work Home-Shopping/Recreation/Social 58 25* 17 42% % 24 *mean = $1.60 median = $
64 Table B-3: San Fernando Valley Subregion Median Time Spent on Various Components of One-Way Trip - Weekend (in minutes) Components of Trip Minutes Getting to First Bus/Train Stop 10 Waiting for All Buses/Trains 15 Traveling on All Buses/Trains 25 Getting From Last Stop to Final Destination 10 Total Time Traveled* 60 *Total Time Traveled is the sum of the individual time components; it is not a median itself. 58
65 Table B-4: San Fernando Valley Subregion Mean Satisfaction Ratings for Various Features of Bus Service Weekend (1 = very good; 5 = very poor) Bus Feature Mean Safety 2.1 Convenience of Route 2.2 Buses Do Not Pass By 2.3 Overall Bus Service 2.4 Travel Time 2.4 Driver Courtesy 2.5 Availability of Seats/Space 2.6 Cost of Fare 2.6 Cleanliness Inside Bus 2.6 Availability of Route Information 2.9 Buses on Time 3.0 Time Waiting
66 Table B-5: San Fernando Valley Subregion Percentage of Respondents Indicating Choices 1 and 2 Weekend (1 = very good, 2 = good) Bus Features % Indicating Choices 1 and 2 Safety 73% Convenience of Route 62 Buses Do Not Pass By 59 Overall Bus Service 56 Travel Time 52 Driver Courtesy 48 Availability of Seats/Space 48 Cost of Fare 46 Cleanliness Inside Bus 44 Availability of Route Information 39 Buses on Time 31 Time Waiting 29 Table B-6: San Fernando Valley Subregion Service Features That Were Indicated as Most in Need of Improvement - Weekend Feature % Buses on Time 27 Time Waiting 19 60
67 Destinations of Weekday Bus Trips Originating in San Fernando Valley Planning Area North LA 0% San Fernando Valley 67% Arroyo Verdugo 5% San Gabriel Valley Las Virgenes 1% Westside Cities Los Angeles Central 3% 6% 14% Gateway 3% South Bay Cities 1% Destinations of Weekday Bus Trips Originating in San Fernando Valley Planning Area 61
68 Table B-7: South Bay Cities Subregion Demographic Profile - Weekend (n = 206) Demographic Profile Gender Female Male Ethnicity Latino African-American White Asian 62% 38 45% Median Household Income $11,000 Mean Age (years)
69 Table B-8: South Bay Cities Subregion Travel Characteristics - Weekend Day Traveled Saturday Sunday Frequency of Riding Mean Number of Days Per Week Percentage Who Ride 5 or More Days Per Week Walk To First Stop From Last Stop Method of Payment Pass Cash Token Kind of Pass Regular Weekly Regular Monthly Disabled Senior Trip Purpose (Production/Attraction) Home-Work Home-Shopping/Recreation/Social 52% % 96% 92 37% 47* 16 28% % 28 *mean = $ median = $
70 Table B-9: South Bay Cities Subregion Median Time Spent on Various Components of One-Way Trip (in minutes) - Weekend Components of Trip Minutes Getting to First Bus/Train Stop 10 Waiting for All Buses/Trains 10 Traveling on All Buses/Trains 30 Getting From Last Stop to Final Destination 10 Total Time Traveled* 60 * Total Time Traveled is the sum of the above individual trip components. It is not a median, itself. 64
71 Table B-10: South Bay Cities Subregion Mean Satisfaction Ratings for Various Features of Bus Service - Weekend (1 = very good; 5 = very poor) Bus Feature Mean Convenience of Route 2.0 Safety 2.2 Driver Courtesy 2.2 Availability of Seats/Space 2.4 Overall Bus Service 2.4 Travel Time 2.5 Cost of Fare 2.5 Buses Do Not Pass By 2.6 Time Waiting 2.8 Cleanliness Inside Bus 2.8 Availability of Route Information 2.8 Buses on Time
72 Table B-11: South Bay Cities Subregion Percentage of Respondents Indicating Choices 1 and 2 - Weekend (1 = very good, 2 = good) Bus Features % Indicating Choices 1 and 2 Convenience of Route 74% Safety 69 Driver Courtesy 66 Availability of Seats/Space 61 Overall Bus Service 51 Travel Time 52 Cost of Fare 50 Buses Do Not Pass By 53 Time Waiting 43 Cleanliness Inside Bar 41 Availability of Route Information 40 Buses on Time 39 Table B-12: South Bay Cities Subregion Service Features That Were Indicated as Most in Need of Improvement - Weekend Feature % Buses Do Not Pass By 23 Buses on Time 15 66
73 Destinations of Weekday Bus Trips Originating in South Bay Cities Planning Area North LA 0% San Fernando Valley 3% Arroyo Verdugo 1% San Gabriel Valley Las Virgenes 0% Westside Cities 10% Los Angeles Central 33% 3% South Bay Cities 40% Gateway 10% Destinations of Weekday Bus Trips Originating in South Bay Cities Planning Area 67
74 Table B-13: Arroyo Verdugo Subregion Demographic Profile - Weekend (n = 32) Demographic Profile Gender Female Male Ethnicity Latino White African-American Asian 53% 47 70% Median Household Income $15,000 Mean Age (years)
75 Table B-14: Arroyo Verdugo Subregion Travel Characteristics - Weekend Day Traveled Saturday Sunday Frequency of Riding Mean Number of Days Per Week Percentage Who Ride 5 or More Days Per Week Walk To First Stop From Last Stop Method of Payment Pass Cash Token Kind of Pass Regular Monthly Regular Semi-Monthly Senior Regular Weekly Trip Purpose (Production/Attraction) Home-Work Home-Shopping/Recreation/Social 70% % 96% 93 19% 42* 39 31% % 46 *mean = $ median = $
76 Table B-15: Arroyo Verdugo Subregion Median Time Spent on Various Components of One-Way Trip (in minutes) - Weekend Components of Trip Minutes Getting to First Bus/Train Stop 10 Waiting for All Buses/Trains 10 Traveling on All Buses/Trains 30 Getting From Last Stop to Final Destination 10 Total Time Traveled* 60 * Total Time Traveled is the sum of the above individual trip components. It is not a median, itself. 70
77 Table B-16: Arroyo Verdugo Subregion Mean Satisfaction Ratings for Various Features of Bus Service - Weekend (1 = very good; 5 = very poor) Bus Feature Mean Convenience of Route 1.7 Driver Courtesy 1.9 Travel Time 1.9 Buses Do Not Pass By 2.1 Safety 2.1 Cleanliness Inside Bus 2.2 Overall Bus Service 2.2 Cost of Fare 2.3 Time Waiting 2.4 Buses on Time 2.4 Availability of Seats/Space 2.6 Availability of Route Information
78 Table B-17: Arroyo Verdugo Subregion Percentage of Respondents Indicating Choices 1 and 2 - Weekend (1 = very good, 2 = good) Bus Features % Indicating Choices 1 and 2 Convenience of Route 80% Driver Courtesy 82 Travel Time 82 Buses Do Not Pass By 70 Safety 67 Cleanliness Inside Bus 75 Overall Bus Service 68 Cost of Fare 63 Time Waiting 58 Buses on Time 50 Availability of Sets/Spaces 51 Availability of Route Information 44 Table B-18: Arroyo Verdugo Subregion Service Features That Were Indicated as Most in Need of Improvement - Weekend Feature % Buses on Time 48 Time Waiting 14 Safety 13 72
79 Destinations of Weekday Bus Trips Originating in Arroyo Verdugo Planning Area North LA 1% San Fernando Valley 18% Arroyo Verdugo 24% San Gabriel Valley Las Virgenes 0% Westside Cities Los Angeles Central 8% 7% 32% Gateway 6% South Bay Cities 4% Destinations of Weekday Bus Trips Originating in Arroyo Verdugo Planning Area 73
80 Table B-19: Gateway Subregion Demographic Profile - Weekend (n = 327) Gender Female Male Ethnicity Latino African-American White Asian 51% 49 79% Median Household Income $12,000 Mean Age (years)
81 Table B-20: Gateway Subregion Travel Characteristics - Weekend Day Traveled Saturday Sunday Frequency of Riding Mean Number of Days Per Week Percentage Who Ride 5 or More Days Per Week Walk To First Stop From Last Stop Method of Payment Pass Cash Token Kind of Pass Regular Monthly Regular Weekly Regular Semi-Monthly Senior Trip Purpose (Production/Attraction) Home-Work Home-Shopping/Recreation/Social 67% % 94% * 27 27% % 23 *mean = $ median = $
82 Table B-21: Gateway Subregion Median Time Spent on Various Components of One-Way Trip - Weekend (in minutes) Components of Trip Minutes Getting to First Bus/Train Stop 10 Waiting for All Buses/Trains 15 Traveling on All Buses/Trains 25 Getting From Last Stop to Final Destination 10 Total Time Traveled* 60 * Total Time Traveled is the sum of the above individual trip components. It is not a median, itself. 76
83 Table B-22: Gateway Subregion Mean Satisfaction Ratings for Various Features of Bus Service - Weekend (1 = very good; 5 = very poor) Bus Feature Mean Convenience of Route 1.9 Safety 2.1 Driver Courtesy 2.3 Travel Time 2.3 Buses Do Not Pass By 2.3 Overall Bus Service 2.3 Cost of Fare 2.4 Cleanliness Inside Bus 2.5 Availability of Seats/Space 2.5 Availability of Route Information 2.6 Buses on Time 2.7 Time Waiting
84 Table B-23: Gateway Subregion Percentage of Respondents Indicating Choices 1 and 2 Weekend (1 = very good, 2 = good) Bus Features % Indicating Choices 1 and 2 Convenience of Route 76% Safety 76 Driver Courtesy 65 Travel Time 62 Buses Do Not Pass By 62 Overall Bus Service 57 Cleanliness Inside Bus 56 Cost of Fare 55 Availability of Seats/Space 55 Availability of Route Information 50 Buses on Time 47 Time Waiting 44 Table B-24: Gateway Subregion Service Features That Were Indicated as Most in Need of Improvement - Weekend Feature % Time Waiting 29 Buses on Time 15 Driver Courtesy 12 78
85 Destinations of Weekday Bus Trips Originating in Gateway Planning Area North LA 1% San Fernando Valley 2% Arroyo Verdugo 1% San Gabriel Valley Las Virgenes 0% Westside Cities 8% Los Angeles Central 32% 3% South Bay Cities 5% Gateway 54% Destinations of Weekday Bus Trips Originating in Gateway Planning Area 79
86 Table B-25: Los Angeles Central Subregion Demographic Profile - Weekend (n = 1,870) Demographic Profile Gender Female Male Ethnicity Latino African-American White Asian 55% 45 58% Median Household Income $9,000 Mean Age (years)
87 Table B-26: Los Angeles Central Subregion Travel Characteristics - Weekend Day Traveled Saturday Sunday Frequency of Riding Mean Number of Days Per Week Percentage Who Ride 5 or More Days Per Week Walk To First Stop From Last Stop Method of Payment Pass Cash Token Kind of Pass Regular Monthly Regular Weekly Regular Semi-Monthly Disabled Trip Purpose (Production/Attraction) Home-Work Home-Shopping/Recreation/Social 56% % 96% 92 66% 14* 20 34% % 20 * mean=$1.45 median=$
88 Table B-27: Los Angeles Central Subregion Median Time Spent on Various Components of One-Way Trip (in minutes) - Weekend Components of Trip Minutes Getting to First Bus/Train Stop 10 Waiting for All Buses/Trains 12 Traveling on All Buses/Trains 25 Getting From Last Stop to Final Destination 15 Total Time Traveled * 62 * Total Time Traveled is the sum of the above individual trip components. It is not a median, itself. 82
89 Table B-28: Los Angeles Central Subregion Mean Satisfaction Ratings for Various Features of Bus Service - Weekend (1 = very good; 5 = very poor) Bus Feature Mean Convenience of Route 2.2 Safety 2.3 Travel Time 2.4 Driver Courtesy 2.4 Overall Bus Service 2.5 Cost of Fare 2.5 Buses Do Not Pass By 2.6 Availability of Route Information 2.6 Cleanliness Inside Bus 2.6 Availability of Seats/Space 2.7 Buses on Time 2.8 Time Waiting
90 Table B-29: Los Angeles Central Subregion Percentage of Respondents Indicating Choices 1 and 2 - Weekend (1 = very good, 2 = good) Bus Features % Indicating Choices 1 and 2 Convenience of Route 64% Safety 62 Travel Time 57 Driver Courtesy 56 Overall Bus Service 53 Cost of Fare 53 Buses Do Not Pass By 51 Availability of Route Information 49 Cleanliness Inside Bus 48 Availability of Seats/Space 45 Buses on Time 42 Time Waiting 40 Table B-30: Los Angeles Central Subregion Service Features That Were Indicated as Most in Need of Improvement - Weekend Feature % Time Waiting 18 Buses on Time 18 84
91 Destinations of Weekday Bus Trips Originating in Los Angeles Central Planning Area North LA 0% San Fernando Valley 4% Arroyo Verdugo 3% San Gabriel Valley Las Virgenes 0% Westside Cities Los Angeles Central 5% 11% 61% Gateway 10% South Bay Cities 6% Destinations of Weekday Bus Trips Originating in Los Angeles Central Planning Area 85
92 Table B-31: San Gabriel Valley Subregion Demographic Profile - Weekend (n = 137) Gender Female Male Ethnicity Latino Asian African-American White 57% 43 54% Median Household Income $11,000 Mean Age (years)
93 Table B-32: San Gabriel Valley Subregion Travel Characteristics - Weekend Day Traveled Saturday Sunday Frequency of Riding Mean Number of Days Per Week Percentage Who Ride 5 or More Days Per Week Walk To First Stop From Last Stop Method of Payment Pass Cash Token Kind of Pass Regular Monthly Regular Weekly Senior Trip Purpose (Production/Attraction) Home-Work Home-Shopping/Recreation/Social 73% % 98% * 31 30% % 26 *mean = $ median = $
94 Table B-33: San Gabriel Valley Subregion Median Time Spent on Various Components of One-Way Trip - Weekend (in minutes) Components of Trip Minutes Getting to First Bus/Train Stop 10 Waiting for All Buses/Trains 15 Traveling on All Buses/Trains 30 Getting From Last Stop to Final Destination 10 Total Time Traveled* 65 * Total Time Traveled is the sum of the above individual trip components. It is not a median, itself. 88
95 Table B-34: San Gabriel Valley Subregion Mean Satisfaction Ratings for Various Features of Bus Service - Weekend (1 = very good; 5 = very poor) Bus Feature Mean Safety 2.1 Convenience of Route 2.1 Cost of Fare 2.3 Driver Courtesy 2.4 Overall Bus Service 2.4 Travel Time 2.4 Buses Do Not Pass By 2.4 Availability of Route Information 2.5 Cleanliness Inside Bus 2.6 Buses on Time 2.6 Availability of Seats/Space 2.6 Time Waiting
96 Table B-35: San Gabriel Valley Subregion Percentage of Respondents Indicating Choices 1 and 2 - Weekend (1 = very good, 2 = good) Bus Features % Indicating Choices 1 and 2 Safety 71% Convenience of Route 69 Cost of Fare 60 Driver Courtesy 64 Overall Bus Service 55 Travel Time 53 Buses Do Not Pass By 52 Availability of Route Information 51 Cleanliness Inside Bus 50 Buses on Time 50 Availability of Seats/Space 47 Time Waiting 44 Table B-36: San Gabriel Valley Subregion Service Features That Were Indicated as Most in Need of Improvement - Weekend Feature % Buses on Time 26 Driver Courtesy 17 Time Waiting 14 90
97 Destinations of Weekday Bus Trips Originating in San Gabriel Valley Planning Area North LA 1% San Fernando Valley 3% Arroyo Verdugo 4% San Gabriel Valley Las Virgenes 0% Westside Cities Los Angeles Central 43% 6% 29% Gateway 12% South Bay Cities 2% Destinations of Weekday Bus Trips Originating in San Gabriel Valley Planning Area 91
98 Table B-37: Westside Cities Subregion Demographic Profile - Weekend (n = 94) Demographic Profile Gender Female Male Ethnicity Latino White African-American Asian 64% 36 33% Median Household Income $15,000 Mean Age (years)
99 Table B-38: Westside Cities Subregion Travel Characteristics - Weekend Day Traveled Saturday Sunday Frequency of Riding Mean Number of Days Per Week Percentage Who Ride 5 or More Days Per Week Walk To First Stop From Last Stop Method of Payment Pass Cash Token Kind of Pass Disabled Regular Monthly Regular Semi-Monthly Regular with Express Stamps Trip Purpose (Production/Attraction) Home-Shopping/Recreation/Social Home-Work Home-Other 75% % 93% 98 31% 44* 25 27% % * mean=$1.30 median=$
100 Table B-39: Westside Cities Subregion Median Time Spent on Various Components of One-Way Trip (in minutes) - Weekend Components of Trip Minutes Getting to First Bus/Train Stop 10 Waiting for All Buses/Trains 15 Traveling on All Buses/Trains 30 Getting From Last Stop to Final Destination 10 Total Time Traveled* 65 * Total Time Traveled is the sum of the above individual trip components. It is not a median, itself. 94
101 Table B-40: Westside Cities Subregion Mean Satisfaction Ratings for Various Features of Bus Service - Weekend (1 = very good; 5 = very poor) Bus Feature Mean Safety 2.0 Convenience of Route 2.1 Driver Courtesy 2.2 Overall Bus Service 2.3 Buses Do Not Pass By 2.4 Time Waiting 2.6 Cleanliness Inside Bus 2.6 Buses on Time 2.6 Availability of Seats/Spaces 2.6 Cost of Fare 2.7 Availability of Route Information 2.7 Travel Time
102 Table B-41: Westside Cities Subregion Percentage of Respondents Indicating Choices 1 and 2 - Weekend (1 = very good, 2 = good) Bus Features % Indicating Choices 1 and 2 Safety 79% Convenience of Route 72 Driver Courtesy 64 Overall Bus Service 57 Buses Do Not Pass By 67 Time Waiting 53 Cleanliness Inside Bus 48 Buses on Time 46 Availability of Seats/Spaces 44 Cost of Fare 44 Availability of Route Information 44 Travel Time 43 Table B-42: Westside Cities Subregion Service Features That Were Indicated as Most in Need of Improvement - Weekend Feature % Availability of Seats/Space 16 Safety 14 Time Waiting 13 96
103 Destinations of Weekday Bus Trips Originating in Westside Cities Planning Area North LA 0% San Fernando Valley 6% Arroyo Verdugo 3% San Gabriel Valley Las Virgenes 0% Westside Cities 36% Los Angeles Central 39% 4% Gateway 6% South Bay Cities 6% Destinations of Weekday Bus Trips Originating in Westside Cities Planning Area 97

104 APPENDIX C: ON BOARD SURVEY INSTRUMENT 98
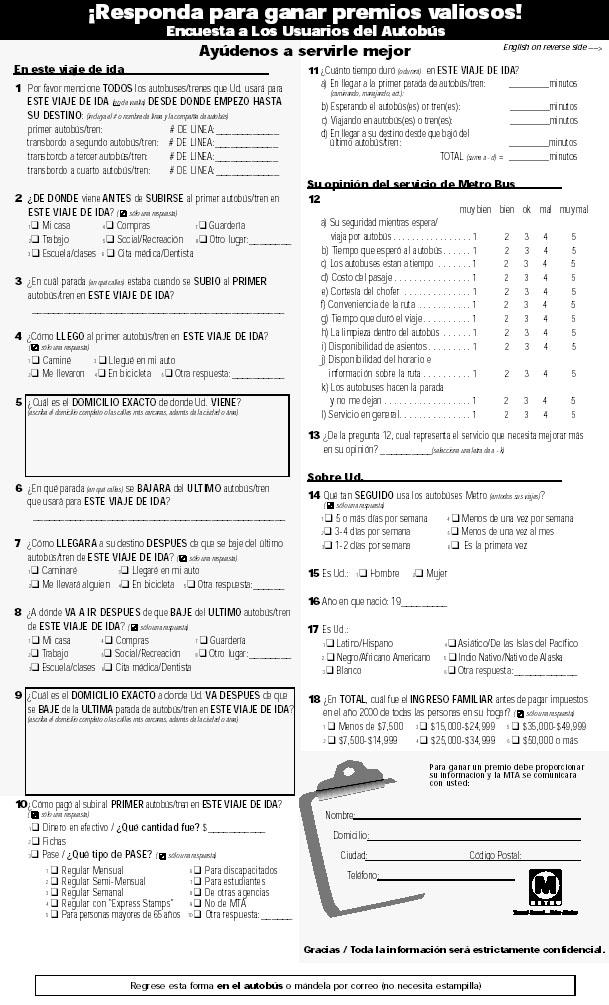
105 99
1999 On-Board Sacramento Regional Transit District Survey
 SACOG-00-009 1999 On-Board Sacramento Regional Transit District Survey June 2000 Sacramento Area Council of Governments 1999 On-Board Sacramento Regional Transit District Survey June 2000 Table of Contents
Los Angeles County Metropolitan Transportation Authority FY 2002 On-Board Bus Survey: Follow-up Telephone Survey Report
 Los Angeles County Metropolitan Transportation Authority FY 2002 On-Board Bus Survey: Follow-up Telephone Survey Report Report to the Los Angeles County Metropolitan Transportation Authority One Gateway
Executive Summary. TUCSON TRANSIT ON BOARD ORIGIN AND DESTINATION SURVEY Conducted October City of Tucson Department of Transportation
 Executive Summary TUCSON TRANSIT ON BOARD ORIGIN AND DESTINATION SURVEY Conducted October 2004 Prepared for: City of Tucson Department of Transportation May 2005 TUCSON TRANSIT ON BOARD ORIGIN AND DESTINATION
Cobb Community Transit
 Cobb Community Transit Ridership Survey January 2014 1 Methodology Paper survey of 315 CCT riders 165 on local routes (margin of sampling error: ± 7.6%) 150 on express routes (margin of sampling error:
Dial A Lift Customer Survey 2011 Executive Summary
 Dial A Lift Customer Survey 2011 Executive Summary Survey conducted and report prepared by Corey, Canapary & Galanis Research 447 Sutter Street San Francisco, CA 94108 Introduction Dial A Lift is a door
Title VI Fare Change Equity Analysis
 Title VI Fare Change Equity Analysis Evaluation Report Submitted to Dallas Area Rapid Transit Submitted by TranSystems June 2012 Title VI Fare Change Equity Analysis Introduction DART has proposed a schedule
Travel and Rider Characteristics for Metrobus
 Travel and Rider Characteristics for Metrobus 040829040.15 Travel and Rider Characteristics for Metrobus: 2012-2015 Overview The Miami Dade County Metropolitan Planning Organization (MPO) conducted a series
Rider Satisfaction Survey Total Market 2006
 Rider Satisfaction Survey Total Market 2006 Prepared For: Valley Metro Fall 2006 2702 North 44 th Street Suite 100-A. Phoenix, Arizona 85008 602-707-0050 www.westgroupresearch.com Valley Metro 2006 Rider
2015 Origin/Destination Study
 2015 Origin/Destination Study Research Report for Prepared by: March 2016 Table of Contents Summary of Findings... 7 Rider Profile... 7 Frequency of Use... 7 Transit Dependence... 7 Age... 7 Income...
PASSENGER SURVEY RESULTS
 ROGUE VALLEY TRANSPORTATION DISTRICT PASSENGER SURVEY RESULTS Date: December 12, 2018 Project #: 21289 To: Paige West, RVTD From: Susan Wright, PE; Molly McCormick; (Kittelson & Associates, Inc.) Subject:
APPENDIX C Arlington Transit On-Board Survey Technical Memorandum
 APPENDIX C Arlington Transit On-Board Survey Technical Memorandum Arlington County Appendix C December 2010 TABLE OF CONTENTS 1.0 Overview of Transit Rider Survey Process... 1 2.0 Responses to Survey Questions...
U.S. Bicycling Participation Study
 U.S. Bicycling Participation Study Report of findings from the 2016 survey Conducted by Corona Insights Commissioned by PeopleForBikes Released July 2017 Table of Contents Background and Objectives 3 Research
Rider Satisfaction Survey Phoenix Riders 2004
 Rider Satisfaction Survey Riders Prepared For: Valley Metro Spring 2720 E. Thomas Rd. Bldg. A, Arizona 85016-8296 602-707-0050 answers@westgroupresearch.com Valley Metro Rider Satisfaction Survey - Page
Briefing Paper #1. An Overview of Regional Demand and Mode Share
 2011 Metro Vancouver Regional Trip Diary Survey Briefing Paper #1 An Overview of Regional Demand and Mode Share Introduction The 2011 Metro Vancouver Regional Trip Diary Survey is the latest survey conducted
The Who and What: Bus Rapid Transit Riders and Systems in the U.S.
 The Who and What: Bus Rapid Transit Riders and Systems in the U.S. Cheryl Thole December 12, 2013 Webinar Center for Urban Transportation Research University of South Florida Pre presentation How familiar
How familiar are you with BRT?
 The Who and What: Bus Rapid Transit Riders and Systems in the U.S. Cheryl Thole December 12, 2013 Webinar Center for Urban Transportation Research University of South Florida Pre presentation How familiar
City of Winston-Salem 2006 Citizen Satisfaction Survey Report
 City of Winston-Salem 2006 Citizen Satisfaction Survey Report Methodology The City of Winston-Salem s 2006 Citizen Satisfaction Survey was conducted from October 6 th through October 20 th of 2006. The
Cabrillo College Transportation Study
 Cabrillo College Transportation Study Planning and Research Office Terrence Willett, Research Analyst, Principle Author Jing Luan, Director of Planning and Research Judy Cassada, Research Specialist Shirley
AAMPO Regional Transportation Attitude Survey
 AAMPO Regional Transportation Attitude Survey Traditionally Underserved Populations helping organizations make better decisions since 1982 2018 Submitted to the AAMPO By: ETC Institute 725 W. Frontier
DKS & WASHINGTON COUNTY Washington County Transportation Survey
 PREPARED FOR: DKS & WASHINGTON COUNTY Washington County Transportation Survey April 2013 PREPARED BY: DHM RESEARCH (503) 220-0575 239 NW 13 th Ave., #205, Portland, OR 97209 www.dhmresearch.com 1 INTRODUCTION
Sun Metro Fixed Route Rider Survey
 University of Texas at El Paso DigitalCommons@UTEP IPED Technical Reports Institute for Policy and Economic Development 8-1-2006 Dennis L. Soden University of Texas at El Paso, desoden@utep.edu Mathew
METROPOLITAN TRANSPORTATION PLAN OUTREACH: INTERACTIVE MAP SUMMARY REPORT- 10/03/14
 METROPOLITAN TRANSPORTATION PLAN OUTREACH: INTERACTIVE MAP SUMMARY REPORT- 10/03/14 INTRODUCTION This document summarizes the results of the online interactive mapping exercise implemented by MIG for the
Philadelphia Bus Network Choices Report
 Philadelphia Bus Network Choices Report JUNE 2018 SEPTA Table of Contents Executive Summary...7 What if transit gave us more freedom?... 8 What is this report?... 8 The main conclusions... 9 What is happening
City of Davenport CitiBus Public Transportation Study. April 2015
 City of Davenport CitiBus Public Transportation Study April 2015 Overview Project Background Key Findings CitiBus Service Allocation Policy Discussion 2 Project Background 3 About CitiBus Operates 17 routes
Customer Satisfaction Tracking Report 2016 Quarter 1
 Customer Satisfaction Tracking Report 2016 Quarter 1 May 2016 Prepared by: NRG Research Group Project no. 317-15-1445 Suite 1380-1100 Melville Street Vancouver, BC V6E 4A6 Table of Contents Background
ADOT Statewide Bicycle and Pedestrian Program Summary of Phase IV Activities APPENDIX B PEDESTRIAN DEMAND INDEX
 ADOT Statewide Bicycle and Pedestrian Program Summary of Activities APPENDIX B PEDESTRIAN DEMAND INDEX May 24, 2009 Pedestrian Demand Index for State Highway Facilities Revised: May 29, 2007 Introduction
2011 Countywide Attitudinal and Awareness Survey Results
 2011 Countywide Attitudinal and Awareness Survey Results Purpose of Study Establish baseline for measuring future performance Identify perceptions about transportation system, issues, priorities Assess
Wildlife Ad Awareness & Attitudes Survey 2015
 Wildlife Ad Awareness & Attitudes Survey 2015 Contents Executive Summary 3 Key Findings: 2015 Survey 8 Comparison between 2014 and 2015 Findings 27 Methodology Appendix 41 2 Executive Summary and Key Observations
Satisfaction with Canada Line and Connecting Buses. Wave 2
 Satisfaction with Canada Line and Connecting Buses March 10, 2011 Prepared by: NRG Research Group Wave 2 Suite 1380-1100 Melville Street Vancouver, BC V6E 4A6 Table of Contents Summary... 3 Method.. 8
Westside Transportation Access Needs Assessment - Short and Long Term Improvements
 ABSTRACT The Los Angeles County Metropolitan Transportation Authority (MTA) adopted the 2001 Long Range Transportation Plan (LRTP), which sets out the County s transportation investments for the next 20-25
2016 Capital Bikeshare Member Survey Report
 2016 Capital Bikeshare Member Survey Report Prepared by: LDA Consulting Washington, DC 20015 (202) 548-0205 February 24, 2017 EXECUTIVE SUMMARY Overview This report presents the results of the November
Pocatello Regional Transit Master Transit Plan Draft Recommendations
 Pocatello Regional Transit Master Transit Plan Draft Recommendations Presentation Outline 1. 2. 3. 4. What is the Master Transit Plan? An overview of the study Where Are We Today? Key take-aways from existing
Report to the Benjamin Hair-Just Swim For Life Foundation on JACS4 The Jefferson Area Community Survey
 Report to the Benjamin Hair-Just Swim For Life Foundation on JACS4 The Jefferson Area Community Survey Prepared by: Kara Fitzgibbon, M.A. Research Analyst Matthew Braswell, M.A. Research Analyst Yuliya
RVTD On-Board Passenger Study
 2014 RVTD Planning Department 12/31/2014 EXECUTIVE SUMMARY In the fall of 2014, RVTD conducted an on-board passenger survey. The survey was created by RVTD planners using methods from previous on-board
Community & Transportation Preferences Survey
 Community & Transportation Preferences Survey Webinar: August 5, 2015 Hugh Morris, AICP, LEED Realtor.org Jennifer Dill, Ph.D. trec.pdx.edu 1 Introduction National Association of Realtors Over 1,000,000
Guidelines for Providing Access to Public Transportation Stations APPENDIX C TRANSIT STATION ACCESS PLANNING TOOL INSTRUCTIONS
 APPENDIX C TRANSIT STATION ACCESS PLANNING TOOL INSTRUCTIONS Transit Station Access Planning Tool Instructions Page C-1 Revised Final Report September 2011 TRANSIT STATION ACCESS PLANNING TOOL INSTRUCTIONS
MTA Surveys: Facts and Findings. NYMTC Brown Bag March 12, 2014 Julia Seltzer, MTA Planning
 MTA Surveys: Facts and Findings NYMTC Brown Bag March 12, 2014 Julia Seltzer, MTA Planning MTA Planning Survey Program Why survey? Who was surveyed? Challenges Methodologies Findings Uses for data 1 Why
Bus Rapid Transit (BRT) sets a new global trend in public transportation
 sets a new global trend in public transportation") 01 Transportation Planning 7 International comparative study of Seoul BRT system Ko, Joonho Summary The ridership of the bus rapid transit system in Seoul is the fifth highest among 162 cities worldwide,
01 Transportation Planning 7 International comparative study of Seoul BRT system Ko, Joonho Summary The ridership of the bus rapid transit system in Seoul is the fifth highest among 162 cities worldwide,
2014 Metro Transit Customer Survey Highlights
 2014 Metro Transit Customer Survey Highlights Metropolitan Council Transportation Committee - April 13, 2015 Presented by: Bruce Howard, Director of Customer Services and Marketing METHODOLOGY : Quantitative
Transportation Issues Poll for New York City
 2016-17 Transportation Issues Poll for New York City 82% support Vision Zero and reducing traffic deaths 72% on average, support more street space for children to play, protected bike lanes and other safety
TRENDS IN PARTICIPATION RATES FOR WILDLIFE-ASSOCIATED RECREATION BY RACE/ETHNICITY AND GENDER:
 TRENDS IN PARTICIPATION RATES FOR WILDLIFE-ASSOCIATED RECREATION BY RACE/ETHNICITY AND GENDER: 1980-2001 Allan Marsinko Professor Department of Forestry and Natural Resources Clemson University Clemson,
Midtown Corridor Alternatives Analysis
 Midtown Corridor Alternatives Analysis Ridership Forecast Methodology and Results December 2013 Prepared by the SRF Consulting Group Team for Table of Contents Introduction... 1 Methodology... 1 Assumptions...
OVERVIEW OF METHODOLOGY
 I N T R O D U C T I O N The Orange County Transportation Authority () is the county transportation commission responsible for planning, funding and delivering transportation improvements in Orange County
Bicycle Helmet Use Among Winnipeg Cyclists January 2012
 Bicycle Helmet Use Among Winnipeg Cyclists January 2012 By: IMPACT, the injury prevention program Winnipeg Regional Health Authority 2 nd Floor, 490 Hargrave Street Winnipeg, Manitoba, R3A 0X7 TEL: 204-940-8300
Community & Transportation Preferences Survey U.S. Metro Areas, 2015 July 23, 2015
 Community & Transportation Preferences Survey U.S. Metro Areas, 2015 July 23, 2015 Realtor.org trec.pdx.edu 1 Highlights: Generation gaps in everyday travel Only 71% of Millennials like driving (the lowest
Golfers in Colorado: The Role of Golf in Recreational and Tourism Lifestyles and Expenditures
 Golfers in Colorado: The Role of Golf in Recreational and Tourism Lifestyles and Expenditures by Josh Wilson, Phil Watson, Dawn Thilmany and Steve Davies Graduate Research Assistants, Associate Professor
Acknowledgements. Ms. Linda Banister Ms. Tracy With Mr. Hassan Shaheen Mr. Scott Johnston
 Acknowledgements The 2005 Household Travel Survey was funded by the City of Edmonton and Alberta Infrastructure and Transportation (AIT). The survey was led by a steering committee comprised of: Dr. Alan
Capital Bikeshare 2011 Member Survey Executive Summary
 Capital Bikeshare 2011 Member Survey Executive Summary Prepared by: LDA Consulting Washington, DC 20015 (202) 548-0205 June 14, 2012 EXECUTIVE SUMMARY Overview This report presents the results of the 2012
Market Factors and Demand Analysis. World Bank
 Market Factors and Demand Analysis Bank Workshop and Training on Urban Transport Planning and Reform. Baku, April 14-16, 2009 Market Factors The market for Public Transport is affected by a variety of
TriMet Title VI and Transit Equity Impacts Assessment Recommended Service Changes Line 47 Baseline/Evergreen and 48 Cornell
 TriMet Title VI and Transit Equity Impacts Assessment Recommended Service Changes Line 47 Baseline/Evergreen and 48 Cornell Final Report May 16, 2013 Table of Contents Executive Summary... 3 Title VI and
2016 Capital Bikeshare Member Survey Report
 2016 Capital Bikeshare Member Survey Report Prepared by: LDA Consulting Washington, DC 20015 (202) 548-0205 February 24, 2017 EXECUTIVE SUMMARY Overview This report presents the results of the November
Modal Shift in the Boulder Valley 1990 to 2009
 Modal Shift in the Boulder Valley 1990 to 2009 May 2010 Prepared for the City of Boulder by National Research Center, Inc. 3005 30th Street Boulder, CO 80301 (303) 444-7863 www.n-r-c.com Table of Contents
Online Open House Survey Report. December 2016
 December 216 I. OVERVIEW & OUTREACH SUMMARY Introduction Washington County evaluated long-term transportation investments and strategies as part of the Transportation Futures Study. The purpose of the
National Community and Transportation Preferences Survey. September 2017
 National Community and Transportation Preferences Survey September Executive Summary - Overview The Community and Transportation Preferences Survey echoes many of the major findings from the previous surveys.
Free Ride Transit System 2014 On Board Passenger Survey
 Free Ride Transit System 2014 On Board Passenger Survey March 28, 2014 INTRODUCTION The last on-board passenger survey was conducted by the Breckenridge Free Ride on March 30, 2012. The 2012 survey had
The Impact of TennCare: A Survey of Recipients 2009
 The Impact of TennCare: A Survey of Recipients 2009 Christopher Carty Research Associate, Center for Business and Economic Research William F. Fox Director, Center for Business and Economic Research and
A Survey of Intercity Transit Passengers 2015 A study conducted by:
 A Survey of Intercity Transit Passengers 2015 A study conducted by: In cooperation with: Study conducted by: Hugh M. Clark, Project Director Selena Barlow Pamela Heller Katie Maloney Table of Contents
Ridership in Virginia by System FY2017
 #6C TO: FROM: Chairman McKay and NVTC Commissioners Kate Mattice, Andrew D huyvetter and Nobuhiko Daito DATE: August 30, 2017 SUBJECT: NVTC FY2017 Annual Ridership Report Overall transit ridership in Northern
IndyGo On-Board Transit Survey DRAFT Report. April 21, Prepared by Lochmueller Group and ETC Institute
 IndyGo On-Board Transit Survey DRAFT Report April 21, 2017 Prepared by Lochmueller Group and ETC Institute (THIS PAGE INTENTIONALLY LEFT BLANK) 2016 IndyGo On-Board Survey IndyGo On-Board Survey TABLE
Final Report, October 19, Socioeconomic characteristics of reef users
 Socioeconomic Study of Reefs in Southeast Florida - Executive Summary By Hazen and Sawyer in association with Florida State University and National Oceanic and Atmospheric Administration, October 19, 2001
VI. Market Factors and Deamnd Analysis
 VI. Market Factors and Deamnd Analysis Introduction to Public Transport Planning and Reform VI-1 Market Factors The market for Public Transport is affected by a variety of factors No two cities or even
Life Transitions and Travel Behaviour Study. Job changes and home moves disrupt established commuting patterns
 Life Transitions and Travel Behaviour Study Evidence Summary 2 Drivers of change to commuting mode Job changes and home moves disrupt established commuting patterns This leaflet summarises new analysis
6. Transport GAUTENG CITY-REGION OBSERVATORY QUALITY OF LIFE SURVEY 2015 LANDSCAPES IN TRANSITION
 GAUTENG CITY-REGION OBSERVATORY QUALITY OF LIFE SURVEY 1 6. Transport Christina Culwick, christina.culwick@gcro.ac.za, 011 717 7296 Dr Siân Butcher, sian.butcher@gcro.ac.za, 011 717 7696 Samy Katumba,
EAST VILLAGE SHOPPERS STUDY A SNAPSHOT OF TRAVEL AND SPENDING PATTERNS OF RESIDENTS AND VISITORS IN THE EAST VILLAGE
 EAST VILLAGE SHOPPERS STUDY A SNAPSHOT OF TRAVEL AND SPENDING PATTERNS OF RESIDENTS AND VISITORS IN THE EAST VILLAGE CONTENTS 2 4 5 6 7 16 17 19 SUMMARY INTRODUCTION BACKGROUND METHODOLOGY RESULTS CONCLUSION
JULY 2014 PRESENTED BY
 JULY 2014 PRESENTED BY 2014 Rider Survey Examine Travel Characteristics, Rider Characteristics, Service Ratings Identify customer satisfaction with TAP and Real Time Information Methodology matches prior
2009 New Brunswick Gambling Prevalence Study
 2009 New Brunswick Gambling Prevalence Study Prepared for: Government of New Brunswick Centennial Building P.O. Box 6000 Fredericton, NB E3B 5H1 Prepared by: TABLE OF CONTENTS EXECUTIVE SUMMARY... 1 STUDY
REPORT. RECOMMENDATION: 1. That the report on Pilot Results Free Transit for Seniors, dated October 25, 2012, from Oakville Transit be received.
 REPORT MEETING DATE: NOVEMBER 15, 2012 FROM: Oakville Transit DATE: October 25, 2012 SUBJECT: Pilot Results - Free Transit for Seniors LOCATION: Town Wide WARD: Town wide Page 1 RECOMMENDATION: 1. That
METRO Light Rail: Changing Transit Markets in the Phoenix Metropolitan Area
 METRO Light Rail: Changing Transit Markets in the Phoenix Metropolitan Area Abhishek Dayal, AICP Planner III, METRO Light Rail Phoenix, AZ BACKGROUND Transit in the Phoenix Region Transit services in the
A SURVEY OF 1997 COLORADO ANGLERS AND THEIR WILLINGNESS TO PAY INCREASED LICENSE FEES
 Executive Summary of research titled A SURVEY OF 1997 COLORADO ANGLERS AND THEIR WILLINGNESS TO PAY INCREASED LICENSE FEES Conducted by USDA Forest Service Rocky Mountain Research Station Fort Collins,
2011 Origin-Destination Survey Bicycle Profile
 TRANS Committee 2011 Origin-Destination Survey National Capital Region December 2012 TRANS Committee Members: City of Ottawa, including OC Transpo Ville de Gatineau Société de transport de l Outaouais
2012 Transit Study Randolph County
 2012 Transit Study Randolph County Appendix B Technical Memorandum 2011 Transportation Survey Prepared for: Randolph County Housing Authority Country Roads Transit Submitted by: July 1, 2012 Table of Contents
WILMAPCO Public Opinion Survey Summary of Results
 Wilmington Area Planning Council WILMAPCO Public Opinion Survey Summary of Results Prepared by: 2955 Valmont Road, Suite 300 Boulder, Colorado 80301 t: 303-444-7863 f: 303-444-1145 www.n-r-c.com Table
Purpose and Need. Chapter Introduction. 2.2 Project Purpose and Need Project Purpose Project Need
 Chapter 2 Purpose and Need 2.1 Introduction The El Camino Real Bus Rapid Transit (BRT) Project (Project) would make transit and other transportation improvements along a 17.6-mile segment of the El Camino
SHORT RANGE TRANSIT PLAN: Survey Results and Analysis
 GOLD COAST TRANSIT DISTRICT SHORT RANGE TRANSIT PLAN: Survey Results and Analysis FY 2014-15 to FY 2018-19 Overview As part of the Short Range Transit Plan (SRTP) community outreach process, Gold Coast
ORANGE COUNTY TRANSPORTATION AUTHORITY. Metrolink Ridership and Revenue Quarterly Report. Staff Report
 ORANGE COUNTY TRANSPORTATION AUTHORITY Metrolink Ridership and Revenue Quarterly Report Staff Report March 8, 2012 To: From: Subject: Transit Committee Will Kempton, Chief Executive Officer Metrolink Ridership
The Impact of TennCare: A Survey of Recipients 2006
 The Impact of TennCare: A Survey of Recipients 2006 Brad Kiser Research Associate, Center for Business and Economic Research William F. Fox Director, Center for Business and Economic Research and Professor
Compression Study: City, State. City Convention & Visitors Bureau. Prepared for
 : City, State Prepared for City Convention & Visitors Bureau Table of Contents City Convention & Visitors Bureau... 1 Executive Summary... 3 Introduction... 4 Approach and Methodology... 4 General Characteristics
Flyaway Bus: GIS Analysis on Current and Potential Ridership, Revenue, and Prospective Stations
 ProfessorBarry Waite & Bonnie Shrewsbury Flyaway Bus: GIS Analysis on Current and Potential Ridership, Revenue, and Prospective Stations 1. Abstract The Flyaway Bus is a long distance non-stop shuttle
2014 Bike to Work Day: Survey Report Denver Regional Council of Governments
 2014 Bike to Work Day: Survey Report Denver Regional Council of Governments Prepared By: Corona Insights CoronaInsights.com CONTENTS Introduction... 3 Summary of Findings... 4 Bike to Work Day Participation...
ALTERNATIVES ANALYSIS EXECUTIVE SUMMARY
 West Valley Connector Corridor ALTERNATIVES ANALYSIS EXECUTIVE SUMMARY FINAL September 2014 Ontario International Airport Ontario Mills Rancho Cucamonga Metrolink Station Kaiser Permanente PARSONS EXECUTIVE
Nebraska Births Report: A look at births, fertility rates, and natural change
 University of Nebraska Omaha DigitalCommons@UNO Publications since 2000 Center for Public Affairs Research 7-2008 Nebraska Births Report: A look at births, fertility rates, and natural change David J.
Baseline Survey of New Zealanders' Attitudes and Behaviours towards Cycling in Urban Settings
 Baseline Survey of New Zealanders' Attitudes and Behaviours towards Cycling in Urban Settings Highlights 67% of urban New Zealanders, 18 years of age or more own or have access to a bicycle that is in
REGIONAL HOUSEHOLD TRAVEL SURVEY:
 Defining the Vision. Shaping the Future. REGIONAL HOUSEHOLD TRAVEL SURVEY: Profile Why we travel How we travel Who we are and how often we travel When we travel Where we travel How far and how long we travel
NJ Transit River LINE Survey
 NJ Transit River LINE Survey March, 2013 NJ Transit River LINE Survey March, 2013 PA Wilmington MD Baltimore DE BUCKS MERCER MONTGOMERY CHESTER PHILADELPHIA DELAWARE BURLINGTON CAMDEN GLOUCESTER New York
. ' motion. APPLtlDK.L - L"iLC_t1GLR 201b APPENDIX 7 TECHNICAL MEMOS
 . ' motion APPLtlDK.L - L"iLC_t1GLR 201b APPENDIX 7 TECHNICAL MEMOS The nmotion program will provide a large number of benefits for Middle Tennessee. This document presents selected benefits and other
Understanding Transit Demand. E. Beimborn, University of Wisconsin-Milwaukee
 Understanding Transit Demand E. Beimborn, University of Wisconsin-Milwaukee 1 Purpose To provide a basic understanding of transit ridership and some common misunderstandings. To explain concepts of choice
SACRAMENTO AREA TRAVEL SURVEY: BEFORE BIKE SHARE
 SACRAMENTO AREA TRAVEL SURVEY: BEFORE BIKE SHARE August 2017 A Research Report from the National Center for Sustainable Transportation Susan Handy, University of California, Davis Drew Heckathorn, University
GOLD COAST TRANSIT DISTRICT SHORT RANGE TRANSIT PLAN FY 2015 FY 2019 APPENDICES
 APPENDICES I. GCTD Ridership Data a. Fixed-Route 10 Year Ridership History b. Ridership Summary - FY 2013-14 & FY 2014-15 c. Performance Indicators By Route FY 2013-14 & FY 2014-15 d. Annual Ridership/Passengers
February 2018 METRO TRANSIT RIDERSHIP AUDIT PROGRAM EVALUATION AND AUDIT
 February 2018 METRO TRANSIT RIDERSHIP AUDIT PROGRAM EVALUATION AND AUDIT INTRODUCTION Background Each weekday, Metro Transit provides more than 250,000 rides across 131 routes. This includes urban local
National Association of REALTORS National Smart Growth Frequencies
 September 520, 2017 3,000 Weighted Online Respondents National Association of REALTORS National Smart Growth Frequencies Q.2 The first question is about the quality of life in your community. How satisfied
COLUMBUS AVENUE NEIGHBORHOOD TRANSPORTATION STUDY
 COLUMBUS AVENUE NEIGHBORHOOD TRANSPORTATION STUDY Pedestrian Survey Findings Survey Main Findings: Transit and walking are the main two modes used by both visitors and residents of the area, regardless
Service Proposal for the City of Ashland, Oregon
 Rogue Valley Transportation District 3200 Crater Lake Avenue Medford, Oregon 97504-9075 Phone (541) 608-2429 Fax (541) 773-2877 Visit our website at: www.rvtd.org 2009-2011 Service Proposal for the City
Evan Johnson, Tindale Oliver & Associates. Alan Danaher, P.E., PTOE, AICP, PTP
 To: Copies: From: Evan Johnson, Tindale Oliver & Associates Matt Muller, RTS Jesus Gomez, RTS Alan Danaher, P.E., PTOE, AICP, PTP Date: January 14, 2014 Subject: Ridership Projections Gainesville Streetcar
UWA Commuting Survey 2013
 UWA Commuting Survey 2013 September 2013 Project: UWA/10 UWA Commuting Survey 2013 September 2013 Client: University of Western Australia Project: UWA/10 Consultants: Donna Hill Petra Roberts Jennifer
Accessibility, mobility and social exclusion
 Accessibility, mobility and social exclusion Dionisis Balourdos Kostas Sakellaropoulos Aim The aim of this paper is to present data from the four cities in the project SceneSusTech concerning the issues
RTC TRANSIT OPERATING STATISTICS RTC RIDE RTC RAPID RTC INTERCITY SIERRA SPIRIT
 RTC TRANSIT OPERATING STATISTICS RTC RIDE RTC RAPID RTC INTERCITY SIERRA SPIRIT September 218 RTC TRANSIT OPERATING STATISTICS REPORT TABLE OF CONTENTS RTC Transit Highlights... Page ii RTC Transit Summary...
Route 9 Davidson County Business 85 Service Equity Analysis
 Route 9 Davidson County Business 85 Service Equity Analysis Transportation is not an end in and of itself, but a means to providing access to opportunity. Source: LivingCities.org 1 P a g e This analysis
Appendix C. Corridor Spacing Research
 Appendix C. Corridor Spacing Research Task 3 of the Twin Cities Bicycle Study called for the development of bicycle corridor spacing guidelines. This section summarizes research of the spacing of planned
Washington Metropolitan Area Transit Authority Board Action/Information Summary. MEAD Number:
 Washington Metropolitan Area Transit Authority Board Action/Information Summary Action Information MEAD Number: 100962 Resolution: Yes No TITLE: Bicycle and Pedestrian Access Improvements Study PURPOSE:
Understanding the Market of Metro Transit's Ridership and Services and How Technology Can Help Kevin J. Krizek Ahmed M. El-Geneidy
 Understanding the Market of Metro Transit's Ridership and Services and How Technology Can Help Kevin J. Krizek Ahmed M. El-Geneidy University of Minnesota Understanding the Market of Metro Transit's