CITI BIKE S NETWORK, ACCESSIBILITY AND PROSPECTS FOR EXPANSION. Is New York City s Premier Bike Sharing Program Accesssible to All?
|
|
|
- Liliana May
- 5 years ago
- Views:
Transcription

1 CITI BIKE S NETWORK, ACCESSIBILITY AND PROSPECTS FOR EXPANSION Is New York City s Premier Bike Sharing Program Accesssible to All?
2 How accessible is Citi Bike s network in New York City? Who benefits from it?
3 Citi Bike s Network, Accessibility and Prospects for Expansion Is New York City s Premier Bike Sharing Program Accessible to All? Tola Oniyangi & Joan Zhang Professor Leah Meisterlin Introduction to Geographic Information Systems 01 May 2017
4
5 Table of Contents 01. Introduction 03. Methodology 07. Findings: Accessibility 13. Findings: Demographics 19. Conclusion 20. Appendix
6 Introduction Transportation systems in cities are complex, and frequently promote multimodal transportation nowadays. Cycling, a transit mode that has gained in prominence recently, is energy-efficient and environmentally friendly. As cycling is a physical activity that takes place outdoors, cyclists often discover scenic routes and explore the city. One does not need to own a bicycle to cycle around the city. Bike sharing is one way in which cycling is made available to the general public as a transportation option. It exists in both formal and informal capacities in a large number of cities around the world. If bike sharing programs are a way to expand cycling from a niche activity for cyclists and those who own bicycles to the general populace, then it follows that those programs should be accessible to the general public. When only a small proportion of the general populace has access to these bike sharing programs, they have less potential to make a large positive impact. New York City s most popular bike sharing program, Citi Bike, presents an interesting case study to analyze the accessibility of these programs to the general public. The program does not exist across all of New York City yet, and has been implemented to different locations in a gradual process. The Citi Bike network exists in a multi-modal framework, as users can connect to different transportation modes from Citi Bike. It can be utilized in conjunction with the subway or bus system as a transit option for areas with inaccessible or inconveniently located subway stations. People can also use Citi Bike alone, or for a part of their journey and switch to the bus or subway as a matter of preference or convenience. Citi Bike has the potential to decrease car-dependency in urban areas, reduce carbon emission and promote livelihood in cities. Analyzing where Citi Bike locates its stations in relation to age and racial demographics can be helpful in determining the program s accessibility across New York City. Citi Bike station locations in different phases of expansion could be an indicator of what Citi Bike deems important in its target demographic. They could also indicate the factors Citi Bike prioritizes in its decisions on where to locate itself, and consequently, who to provide access to. Not all New York City residents live or work in areas close to Citi Bike locations, so it is important to ask who Citi Bike is accessible to. Bike sharing in New York City has a very recent history. The city s first bike sharing program, called Citi Bike, launched in May 2013 and has been operating since then (Citi Bike NYC 2017a). It operates throughout the year for 24 hours a day, every day of the week. Citi Bike runs on a public-private partnership between Motivate and the New York City Department of Transportation (Citi Bike NYC, 2017a). Citi Bank is the title sponsor for Citi Bike, which is operated and managed by Motivate (Citi Bike NYC, 2017a). Citi Bike does not exist in all parts of New York City, and this has been the case since its inception. Citi Bike has been launched in successive stages, and has now expanded from lower Manhattan to upper Manhattan, Brooklyn and Queens. The process of 01 Introduction
7 expansion is still ongoing, and Citi Bike does not serve any borough in its entirety. As a result of this limited service area, Citi Bike is currently accessible to only a portion of New York City residents. Many neighborhoods, particularly those in the outer boroughs, are left out of the program (Citi Bike NYC 2017b). Citi Bike s accessibility is also limited because of its pricing structure. All Citi Bike purchases must be made with a credit or debit card, thus excluding all people who have neither a debit nor a credit card. Citi Bike s single-ride pass costs $4 for up to thirty minutes, and while this is the most affordable option, it is only obtainable through the Citi Bike app (Citi Bike NYC, 2017b). This makes Citi Bike even more exclusive as people without smartphones or tablets cannot access this option. Additionally, Citi Bike places a $100 hold on the card of any casual user until the bike is returned. When you couple these factors with Citi Bike s relatively high pricing, it becomes clear that low-income New Yorkers would find it difficult to use the program. Citi Bike s pricing is time-based, and charges can accrue as a result of this. All rides have a flat fee for the first thirty minutes and cost an extra $4 for each additional fifteen minutes (Citi Bike NYC, 2017b). A day pass costs $12 for unlimited thirty-minute rides and a single ride pass costs $1.25 more than the MTA s $2.75 bus and subway fee (Citi Bike NYC, 2017b; MTA, 2017). Citi Bike is significantly less expensive for subscribers who make an annual commitment (Citi Bike NYC, 2017b). For this type of user, the monthly pass costs $14.95 per month and $163 if paid in full. This is remarkably less than Metrocard subscriptions. A 30-day Metrocard costs $121, and a 7-day Metrocard costs $32 (MTA, 2017). This suggests that Citi Bike is targeting New York City residents who live and work in close proximity to Citi Bike stations, or use multi-modal transit options. This pricing complicates our question about Citi Bike s accessibility in New York City. The reduced fare for annual subscribers makes it more accessible to people with a wider range of socio-economic backgrounds. On the other hand, the requirement that subscribers make an annual commitment limits this option to people with a high degree of financial stability. Moreover, this reduced fee for subscribers suggests that Citi Bike is complementing the MTA s subway and bus system rather than competing with it. How accessible is Citi Bike s network in New York City? Who benefits from this network? This study does not seek to answer questions about Citi Bike s users, but rather to probe whether Citi Bike s locations reproduce, exacerbate, or break from existing spatial patterns of inequity. By asking who has access to Citi Bike and what level of access is afforded to different groups of people, this study seeks to analyze Citi Bike s relationship to people and the spaces they inhabit. To this end, an analysis of the accessibility of the Citi Bike network as well as the race and age demographics of the area it serves was done in three categories. These were areas with immediate access to Citi Bike, those with access to Citi Bike through the subway system, and those with no access to Citi Bike through either avenue. 02 Introduction
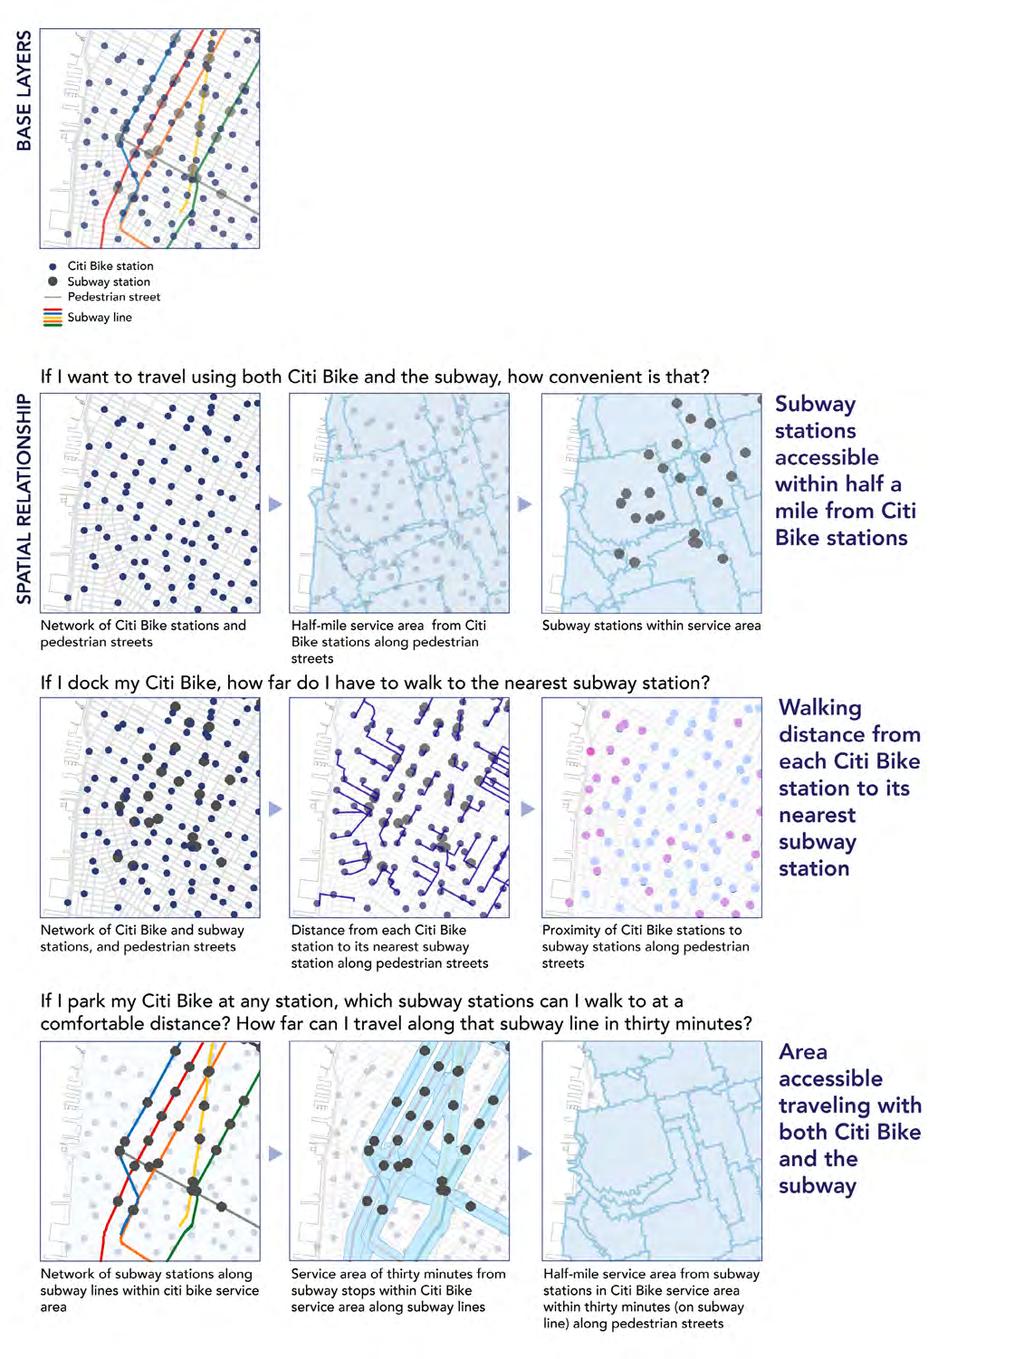
8 Methodology Data Citi Bike Station Information 2015 ACS 5-Year Estimate: Race, Age groups and Total [by Census Tracts] Pedestrian streets extracted from LION shapefile Subway Stations Subway Lines Network Analysis To assess Citi Bike s accessibility, a network analysis in which we investigated the proximity of Citi Bike stations to subway stations was performed. The first step was to set up a network of pedestrian streets. Next, a half-mile was determined to be a comfortable walking distance. This distance was used throughout our analysis. If a Citi Bike user wanted to travel using both Citi Bike and the subway, how convenient would that be? To measure that, Citi Bike stations and subway stations were located. A service area was set up around each Citi Bike station along pedestrian streets using a half-mile search radius. Finally, the number of subway stations located inside these service areas was assessed. If a Citi Bike user docked their bike at a station, how far would they have to walk to get to the nearest subway station? To calculate this, the closest subway station to each Citi Bike station along pedestrian streets was calculated. could they walk to at a comfortable distance? How far would they be able to travel along that subway line in thirty minutes? To answer this question, the distance a train travels in thirty minutes was estimated using 17mph as average speed (Johnson, 2010). A service area around subway stations was created using this distance along subway lines, and the subway stations within this service area were determined. Next, a service area of a half-mile around the subway stations accessible within a commuting time of thirty minutes along subway lines was generated using pedestrian streets. From this process, the subway stations that were accessible within thirty minutes commuting time to Citi Bike stations were assessed. Within this area, people would be able to transfer between the Citi Bike and subway networks. Finally, Citi Bike and subway networks were examined through a bi-modal transportation lens. If a Citi Bike user docked their bike at any station, which subway station 03 Methodology
9 04 Methodology
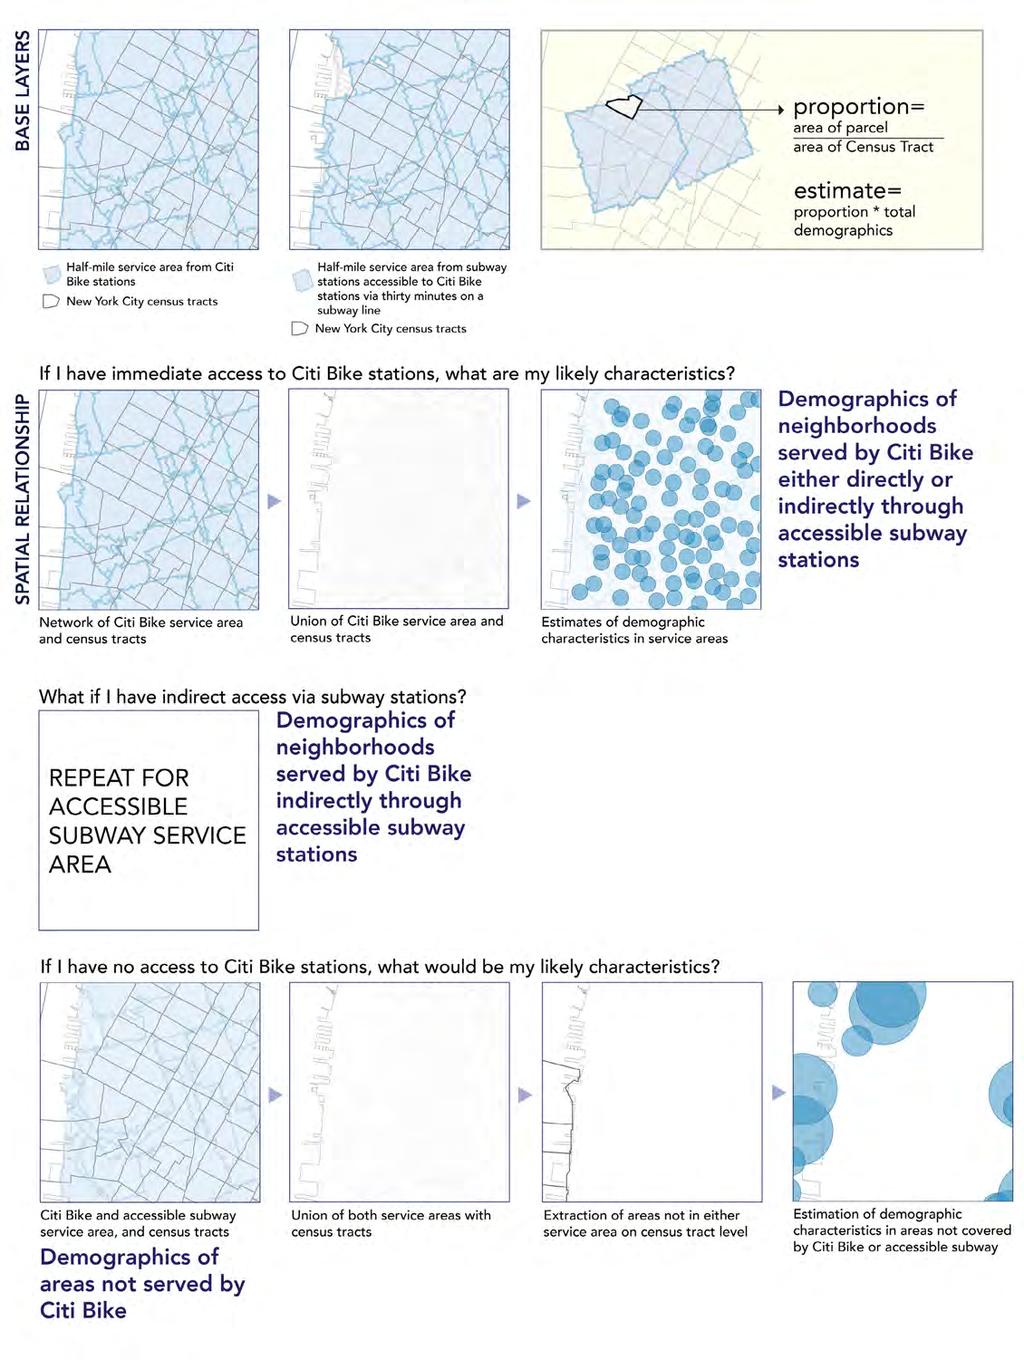
10 Methodology Demographic Analysis To investigate who benefits from the Citi Bike service, age and racial demographics were analyzed and compared. This was done in areas where people had immediate access to Citi Bike stations, indirect access to the Citi Bike network via the subway, and no access through either. Non-white populations and population groups aged 18 to 24, 25 to 44 and 45 to 64 were analyzed in two network service areas constructed from previous network analysis. This analysis was also done in areas outside of these two network service areas. Immediate access to the Citi Bike network was defined as a half-mile pedestrian service area around each Citi Bike station. Demographic information was aggregated by census tracts. Service areas, which intersected with the census tracts, were overlaid on top of each other. To estimate the population in these service areas, a proportional split was performed. The first step in the proportional split was calculating the area for each census tract. Next, this area was split into smaller parcel based on intersections and calculated the area in each small parcel. The proportion was calculated by dividing the area of the small parcel by that of the census tract. Using this proportion, the population in each small parcel was estimated by multiplying the proportion by the area of the parcel. Finally, the split parcels were regrouped into the service areas based on the boundary of service areas. service areas. Similar to the above steps, the area of census tracts was calculated. The next step was to overlay the Citi Bike network service area and the accessible subway service area on all census tracts in New York City. This area was then split into smaller parcels based on intersections and the area in each small parcel was calculated. A new proportion was calculated by dividing the area of each small parcel by that of the census tract in which it was located. The demographics in each small parcel was calculated and regrouped based on the boundary of census tracts. These steps were repeated for accessible subway network service area. The last analyzed area was places outside both network 05 Methodology
11 06 Methodology
12 Findings: Accessibility The Citi Bike service area spans from midtown Manhattan to north-west Brooklyn and the southern tip of Queens in Long Island City. This is unsurprising, and correlates to the distribution of Citi Bike locations in New York City. The walking distance from Citi Bike stations to subway stations varied by location. Walking distances increased towards the western and eastern parts of Manhattan and Brooklyn. This pattern was reflected in the distribution of subway stations, and a strong collocation was evident. The areas with the least walking distance from Citi Bike stations to their nearest subway stations generally had the most subway stations. The maximum walking distance was about 1.4 miles, almost a mile further than the comfortable walking distance previously decided upon. The minimum walking distance, on the other hand, was 15 feet. The average was about 0.3 miles, which was less than the comfortable walking distance. The large range of walking distances from Citi Bike stations to subway stations indicates that the level of access from Citi Bike stations is not uniform across New York City, and the fact that some Citi Bike stations had no subway stations close to them in the service area supports this notion. When the subway was factored in, however, accessibility to the Citi Bike network increased. The service area of Citi Bike stations contained part or all all of each subway line. 39% of subway stations were within the Citi Bike service area, while a much increased 89% of New York City s subway stations were accessible from those subway stations. 07 Accessibility


13 THE CITI BIKE NETWORK 615 Citi Bike stations are located in Manhattan, Brooklyn and Queens. The service area of Citi Bike stations was made using a halfmile distance along pedestrian streets. 08 Accessibility


14 CLOSEST DISTANCE TO SUBWAY STATIONS The shortest walking distance to the nearest subway station was calculated along pedestrian streets. 09 Accessibility
15 NUMBER OF SUBWAY STATIONS WITHIN A HALF-MILE WALKING DISTANCE TO A CITI BIKE STATION The number of subway stations within a comfortable walking distance to each Citi Bike station was calculated along pedestrian streets. The Citi Bike stations in grey had no subway station within a half-mile walking distance. 10 Accessibility


16 SUBWAY LINES AND STATIONS This shows New York City s subway stations and lines. The transparent points and lines indicate areas outside of Citi Bike s immediate service area and its service area via accessible subway stations. 11 Accessibility

17 ACCESSIBLE SUBWAY SERVICE AREA This map shows the service area of accessible subway lines Service area of accessible subway lines i.e. lines within thirty minutes from points within the service area along subway lines 12 Accessibility

18 Findings: Demographics The four maps below show age and racial demographics in areas with immediate access to the Citi Bike network. Each blue dot represents the range of percentage of certain population group in the corresponding service area. The age group with the largest population in the Citi Bike service area was people aged 25 to 44 years old with a 41% share of the population. Interestingly, the average of the 18 to 24 year old population was on par with the city-wide average, while the 45 to 64 year old population had a slightly larger average. The 25 to 44 year old population had a slightly lower average than that of New York City. Here, the average non-white population was 34%. This is comparatively lower than the city-wide average of 56.7%. This non-white population was concentrated in Manhattan s Chinatown and two Bridges neighborhoods, as well as Brooklyn s Crown Heights and Bedford neighborhoods. Neighborhoods further uptown in Manhattan had a significantly lower proportion of the non-white population. Percentage of Population Group Aged 18 to 21 Percentage of Population Group Aged 25 to 44 Minimum: 2.4% Maximum: 22.55% Minimum: 19.1% Maximum: 63% 13 Demographics
19 Citi Bike Service Area Percentage of Population Group Aged 45 to 64 Minimum: 11.78% 14 Demographics Percentage of Non-White Population Maximum: 29% Minimum: 7% Maximum: 94% Miles
20 The four maps below show age and racial demographics in areas with access to the Citi Bike network through the subway system. Each blue dot represents the range of percentage of certain population group in the corresponding service area. held steady at 34%, the proportion of the 25 to 44 years old population reduced from 41% to 37%. This suggests that Citi Bike s target demographic could be young, white people. Looking at areas with access to Citi Bike through the subway system provides similar findings. Here, people aged 25 to 44 years old also had the largest share of the population. While the average of non-white people Percentage of Population Group Aged 18 to 21 Percentage of Population Group Aged 25 to 44 Minimum: 2.5% Maximum: 37% Minimum: 21.19% Maximum: 63% 15 Demographics

21 Accessible Subway Service Area Percentage of Population Group Aged 45 to 64 Percentage of Non-White Population Minimum: 12% Maximum: 46% Minimum: 6.28% Maximum: 96% Miles 16 Demographics
22 The four maps below show age and racial demographics at 63% than that of areas with access to Citi Bike. in areas with no access to the Citi Bike network either The proportion of 25 to 44 year olds also reduced directly or through the subway system. Each blue to 30%, which is slightly lower than the city-wide dot represents the range of percentage of certain average. The proportion of other age groups population group in the corresponding service area. corresponded to that of areas with access to Citi Bike. The distribution of the population in areas with no access to Citi Bike was also quite similar to areas with access to Citi Bike in terms of age. However, the non-white population was significantly higher Percentage of Population Group Aged 25 to 44 Percentage of Population Group Aged 18 to 21 Minimum: 0% 17 Demographics Maximum: 88% Minimum: 0% Maximum: 100%


23 No Access Area Percentage of Population Group Aged 45 to 64 Minimum: 12% 18 Demographics Percentage of Non-White Population Maximum: 46% Minimum: 6.28% Maximum: 96% Miles

24 Conclusion This analysis showed that Citi Bike s accessibility is rather robust when viewed through a bi-modal lens. This extension of the service area allowed for an analysis that took into account people without immediate access to the Citi Bike network. Yet, people in the Bronx, Staten Island, most of Queens, and a large part of Brooklyn had no access to Citi Bike even with this expanded service area. Evaluating the demographics in areas with varying access to Citi Bike demonstrated that access to the Citi Bike network is, in fact, related to race but not to age. Citi Bike s level of access to younger people is unsurprising given New York City s relatively young population. Minority populations are less likely to have access than white populations. For a more comprehensive analysis, the scope of our research question could be expanded to include considerations of income, commercial and residential area, and Citi Bike trip data like travel direction and distance. Our analysis would be bolstered by incorporating data on the proportion of Citi Bike trips that were docked or initiated close to subway stations. It would also be more robust if it explored the relationship between income and accessibility to Citi Bike stations. Our analysis focused on accessibility as it related to residential demographics, but it would gain an additional layer of depth if demographics in business and work areas were also considered. The analysis done here could be factored into a study on the viability of different New York City locations for Citi Bike stations. Finally, this project has the potential to be expanded into an inquiry on how Citi Bike decides where to locate its stations. Our search radius for the network analysis was based on an assumption that half a mile was a comfortable walking distance for people. As a result, the search radius did not take the effect of important factors such as incline and disability into account. Our analysis would have been more thorough if we had included these factors in it. Finally, we used an average subway speed to calculate the distance along a subway line. This did not account for changes in speed between express trains, which skip certain stations, and local trains which make all stops. Additionally, we did not factor differences in speed between subway lines into our analysis. If we were able to account for the various speeds along different subway lines and between express and local trains, our analysis would have been more comprehensive. The Modifiable Areal Unit problem was a challenge we had to reckon with in our demographic analysis. The service area and census tract boundaries did not align, and as a result, we could not use the population values in the census tracts directly in our analysis. We estimated the population in our service areas by calculating the proportion of service areas in the census tract(s) they intersected with. This process limited the accuracy of our results. 19 Conclusion
25 Appendix Data Sources Station Information. (2017). Citi Bike NYC. Retrieved 24 March 2017, from Metropolitan Transit Authority (MTA). Subway Lines [shapefile]. 5 January 2017, updated 5 January < Metropolitan Transit Authority (MTA). Subway Stations [shapefile]. 10 April 2013, updated 5 January < New York City Department of City Planning (DCP). LION [shapefile]. 19 January < U.S. Census Bureau, Year American Community Survey, Selected Characteristics of the Total and Native Populations in the United States by Census Tracts [table]. < gov/faces/tableservices/jsf/pages/productview.xhtml?pid=acs_15_5yr_s0601&prodtype=table> U.S. Census Bureau, Year American Community Survey, Race [table]. < gov/faces/tableservices/jsf/pages/productview.xhtml?pid=acs_15_5yr_b02001&prodtype=table> Bibliography About Citi Bike: Company, History, Motivate Citi Bike NYC. (2017a). Citi Bike NYC. Retrieved 28 April 2017, from Citi Bike Membership & Pass Options Citi Bike NYC. (2017b). Citi Bike NYC. Retrieved 27 April 2017, from MTA/New York City Transit - Fares and MetroCard. (2017). Metropolitan Transit Authority. Retrieved 27 April 2017, from Johnson, M. (2010). Average schedule speed: How does Metro compare?. Greater Greater Washington. Retrieved 27 April 2017, from average-schedule-speed-how-does-metro-compare 20 Appendix
26 21 Appendix

27 22 Appendix
Bike Share Social Equity and Inclusion Target Neighborhoods
 Bike Share Social Equity and Inclusion Target Neighborhoods Target Neighborhoods West End/Visitation Park/Academy/Hamilton Heights Wellsgoodfellow/Kingsway West The Ville/Greater Ville Kingsway East/Fountain
Rochester Area Bike Sharing Program Study
 roc bike share Rochester Area Bike Sharing Program Study Executive Summary ~ January 2015 JANUARY 2015 8484 Georgia Avenue, Suite 800 Silver Spring, MD 20910 3495 Winton Pl., Bldg E, Suite 110 Rochester,
EAST VILLAGE SHOPPERS STUDY A SNAPSHOT OF TRAVEL AND SPENDING PATTERNS OF RESIDENTS AND VISITORS IN THE EAST VILLAGE
 EAST VILLAGE SHOPPERS STUDY A SNAPSHOT OF TRAVEL AND SPENDING PATTERNS OF RESIDENTS AND VISITORS IN THE EAST VILLAGE CONTENTS 2 4 5 6 7 16 17 19 SUMMARY INTRODUCTION BACKGROUND METHODOLOGY RESULTS CONCLUSION
MTA Surveys: Facts and Findings. NYMTC Brown Bag March 12, 2014 Julia Seltzer, MTA Planning
 MTA Surveys: Facts and Findings NYMTC Brown Bag March 12, 2014 Julia Seltzer, MTA Planning MTA Planning Survey Program Why survey? Who was surveyed? Challenges Methodologies Findings Uses for data 1 Why
Canarsie Tunnel Repairs: Planning Ahead for the Crisis
 Canarsie Tunnel Repairs: Planning Ahead for the Crisis Beginning in April 2019, the Canarsie Tunnel between Brooklyn and Manhattan will close for 15 months, affecting over 400,000 daily riders of the L
The North Shore Transportation Improvement Strategy and Western Richmond Terrace 1 : The Forgotten Corridor
 Elm Park Civic Association Island Voice Do Me A Faber The North Shore Transportation Improvement Strategy and Western Richmond Terrace 1 : The Forgotten Corridor Introduction Richmond Terrace is the northernmost
Transportation Issues Poll for New York City
 2016-17 Transportation Issues Poll for New York City 82% support Vision Zero and reducing traffic deaths 72% on average, support more street space for children to play, protected bike lanes and other safety
APPENDIX 2 LAKESHORE ROAD TRANSPORTATION REVIEW STUDY EXECUTIVE SUMMARY
 APPENDIX 2 LAKESHORE ROAD TRANSPORTATION REVIEW STUDY EXECUTIVE SUMMARY Appendix 2 City of Mississauga Lakeshore Road FINAL REPORT Transportation Review Study December 2010 EXECUTIVE SUMMARY Study Purpose
2010 Pedestrian and Bicyclist Special Districts Study Update
 2010 Pedestrian and Bicyclist Special Districts Study Update Pedestrian and Bicyclist Special Districts Program Overview H-GAC s Special Districts Program aims to provide strategic investments in pedestrian
phoenix regional bike share program sponsorship
 phoenix regional bike share program sponsorship High visibility opportunities to promote a healthy lifestyle and sustainable transportation in the Phoenix area what is bike share? Bike share programs are
University of Leeds Travel Plan
 University of Leeds Travel Plan 2015-2018 Contents 1: Introduction 1.1 What is a Travel Plan? 1.2 Why do we need one? 1.3 Sustainability Strategy 2: Overview 2.1 The bigger picture 2.2 The City scale 2.3
NM-POLICY 1: Improve service levels, participation, and options for non-motorized transportation modes throughout the County.
 Transportation PRINCE WILLIAM COUNTY 2008 COMPREHENSIVE PLAN NON-MOTORIZED PLAN CONTENTS Goals, Policies, and Action Strategies Table 4 (Bike Facility Classifications and Descriptions) Table 5 (Bike Facility
2016 Capital Bikeshare Member Survey Report
 2016 Capital Bikeshare Member Survey Report Prepared by: LDA Consulting Washington, DC 20015 (202) 548-0205 February 24, 2017 EXECUTIVE SUMMARY Overview This report presents the results of the November
CITY OF COCOA BEACH 2025 COMPREHENSIVE PLAN. Section VIII Mobility Element Goals, Objectives, and Policies
 CITY OF COCOA BEACH 2025 COMPREHENSIVE PLAN Section VIII Mobility Element Goals, Objectives, and Policies Adopted August 6, 2015 by Ordinance No. 1591 VIII MOBILITY ELEMENT Table of Contents Page Number
How Policy Drives Mode Choice in Children s Transportation to School
 How Policy Drives Mode Choice in Children s Transportation to School Physical Activity through Active Transportation Ruth L. Steiner 2011 Technical Conference and Exhibit Lake Buena Vista, FL April 3-6,
Goodlettsville Bicycle and Pedestrian Plan Executive Summary
 Goodlettsville Bicycle and Pedestrian Plan July 2010 In Cooperation with the Nashville Area Metropolitan Planning Executive Organization Summary Introduction Progressive and forward thinking communities
Typical Rush Hour Commute. PennyforTransportation.com
 Typical Rush Hour Commute In the News Overview of the Plan Collaborative plan with projects in every community Prioritizing connectivity and congestion relief Dedicated transportation-specific funding;
PERSONALISED TRAVEL PLANNING IN MIDLETON, COUNTY CORK
 PERSONALISED TRAVEL PLANNING IN MIDLETON, COUNTY CORK Elaine Brick Principal Transport Planner AECOM Abstract Smarter Travel funding was awarded to the Chartered Institute of Highways and Transportation
University of Victoria Campus Cycling Plan Terms of Reference. 1.0 Project Description
 University of Victoria Campus Cycling Plan Terms of Reference 1.0 Project Description The Campus Cycling Plan, a first for the University, will provide a comprehensive and coordinated approach to support
Briefing Paper #1. An Overview of Regional Demand and Mode Share
 2011 Metro Vancouver Regional Trip Diary Survey Briefing Paper #1 An Overview of Regional Demand and Mode Share Introduction The 2011 Metro Vancouver Regional Trip Diary Survey is the latest survey conducted
Corpus Christi Metropolitan Transportation Plan Fiscal Year Introduction:
 Introduction: The Safe, Accountable, Flexible, Efficient Transportation Equity Act: A Legacy for Users (SAFETEA-LU) has continued the efforts started through the Intermodal Surface Transportation Efficiency
BUILDING THE CASE FOR TRAVEL OPTIONS IN WASHING TON COUNTY. Image: Steve Morgan. Image: Steve Morgan
 BUILDING THE CASE FOR TRAVEL OPTIONS IN WASHING TON COUNTY Image: Steve Morgan Image: Steve Morgan Image: TriMet Image: TriMet WHAT ARE TRAVEL OPTIONS PROGRAMS? Travel options programs encourage residents,
Complete Streets Workshop Follow-up. April 27, 2011 Rockledge City Hall
 Complete Streets Workshop Follow-up April 27, 2011 Rockledge City Hall Agenda Complete Streets draft briefing presentation and sample policy language Share your Complete Streets projects and post workshop
Modal Shift in the Boulder Valley 1990 to 2009
 Modal Shift in the Boulder Valley 1990 to 2009 May 2010 Prepared for the City of Boulder by National Research Center, Inc. 3005 30th Street Boulder, CO 80301 (303) 444-7863 www.n-r-c.com Table of Contents
Midtown Corridor Alternatives Analysis
 Midtown Corridor Alternatives Analysis Ridership Forecast Methodology and Results December 2013 Prepared by the SRF Consulting Group Team for Table of Contents Introduction... 1 Methodology... 1 Assumptions...
CITY OF VAUGHAN EXTRACT FROM COUNCIL MEETING MINUTES OF OCTOBER 30, 2012
 CITY OF VAUGHAN EXTRACT FROM COUNCIL MEETING MINUTES OF OCTOBER 30, 2012 Item 31, Report No. 39, of the Committee of the Whole, which was adopted without amendment by the Council of the City of Vaughan
WALKNBIKE DRAFT PLAN NASHVILLE, TENNESSEE EXECUTIVE SUMMARY NASHVILLE, TENNESSEE
 NASHVILLE, TENNESSEE EXECUTIVE SUMMARY Executive Summary A world-class multi-modal transportation system is essential to a vibrant city and better quality of life. -Mayor Barry The WalknBike plan aims
Guidelines for Providing Access to Public Transportation Stations APPENDIX C TRANSIT STATION ACCESS PLANNING TOOL INSTRUCTIONS
 APPENDIX C TRANSIT STATION ACCESS PLANNING TOOL INSTRUCTIONS Transit Station Access Planning Tool Instructions Page C-1 Revised Final Report September 2011 TRANSIT STATION ACCESS PLANNING TOOL INSTRUCTIONS
ITS-NY ANNUAL MEETING Bus Rapid Transit in New York City: Bus Lane Operations on One-Way Arterial Streets
 ITS-NY ANNUAL MEETING Bus Rapid Transit in New York City: Bus Lane Operations on One-Way Arterial Streets June 9, 2011 Ted Orosz AICP, Director Long Range Bus Planning MTA New York City Transit 1 Overview
METROPOLITAN TRANSPORTATION PLAN OUTREACH: INTERACTIVE MAP SUMMARY REPORT- 10/03/14
 METROPOLITAN TRANSPORTATION PLAN OUTREACH: INTERACTIVE MAP SUMMARY REPORT- 10/03/14 INTRODUCTION This document summarizes the results of the online interactive mapping exercise implemented by MIG for the
1999 On-Board Sacramento Regional Transit District Survey
 SACOG-00-009 1999 On-Board Sacramento Regional Transit District Survey June 2000 Sacramento Area Council of Governments 1999 On-Board Sacramento Regional Transit District Survey June 2000 Table of Contents
ADOT Statewide Bicycle and Pedestrian Program Summary of Phase IV Activities APPENDIX B PEDESTRIAN DEMAND INDEX
 ADOT Statewide Bicycle and Pedestrian Program Summary of Activities APPENDIX B PEDESTRIAN DEMAND INDEX May 24, 2009 Pedestrian Demand Index for State Highway Facilities Revised: May 29, 2007 Introduction
North Shore Transportation Improvement Strategy
 North Shore Transportation Improvement Strategy Preliminary, Near-term Recommendation 2016 April Transportation Improvement Strategy (TIS) Comprehensive and Analytical A multi-modal transportation strategy
LEEDS BECKETT UNIVERSITY. Transport Strategy
 LEEDS BECKETT UNIVERSITY Transport Strategy 2016-2021 2 3 Contents 1. Introduction 1. Introduction...3 Scope of the Document...3 Vision...3 Key Successes...3 2. Our Travel Behaviour...4 Staff and Student
MTP BICYCLE ELEMENT UPDATE. November 2017
 MTP BICYCLE ELEMENT UPDATE November 2017 TIME FOR AN UPDATE Bicycle Element adopted in July 2008 Almost 10 years old Many planned facilities have been implemented 10 years more experience in planning,
Bicycle-Pedestrian Master Plan Update
 Bicycle-Pedestrian Master Plan Update Planning & Zoning Commission November 29, 2017 Overview Project Purpose & Scope Project History Plan Vision & Goals Chapter 5: Making Connections-Beyond the Path Next
Strategies to Promote the Availability of Affordable Healthy Food and Beverages
 Strategies to Promote the Availability of Affordable Healthy Food and Beverages CDC Recommended Strategies and Measurements Strategy #1: Communities Should Increase Availability of Healthier Food and Beverage
Temporal and Spatial Variation in Non-motorized Traffic in Minneapolis: Some Preliminary Analyses
 Temporal and Spatial Variation in Non-motorized Traffic in Minneapolis: Some Preliminary Analyses Spencer Agnew, Jason Borah, Steve Hankey, Kristopher Hoff, Brad Utecht, Zhiyi Xu, Greg Lindsey Thanks to:
A GIS APPROACH TO EVALUATE BUS STOP ACCESSIBILITY
 Advanced OR and AI Methods in Transportation A GIS APPROACH TO EVALUATE BUS STOP ACCESSIBILITY Giuseppe SALVO 1, Simona SABATINI 2 Abstract. This paper proposes a methodology to assess public transportation
WILMAPCO Public Opinion Survey Summary of Results
 Wilmington Area Planning Council WILMAPCO Public Opinion Survey Summary of Results Prepared by: 2955 Valmont Road, Suite 300 Boulder, Colorado 80301 t: 303-444-7863 f: 303-444-1145 www.n-r-c.com Table
Comments EXECUTIVE SUMMARY
 Comments 1. Under any Alternatives, MCDOT should provide better at-grade pedestrian crossing of Georgia Avenue and Forest Glen Road, including improved crosswalks with wider medians and adequate signal
Active Travel and Exposure to Air Pollution: Implications for Transportation and Land Use Planning
 Active Travel and Exposure to Air Pollution: Implications for Transportation and Land Use Planning Steve Hankey School of Public and International Affairs, Virginia Tech, 140 Otey Street, Blacksburg, VA
CONNECTING PEOPLE TO PLACES
 CONNECTING PEOPLE TO PLACES 82 EAST BENCH MASTER PLAN 07 Introduction The East Bench transportation system is a collection of slow moving, treelined residential streets and major arteries that are the
4. ENVIRONMENTAL IMPACT ANALYSIS 9. TRANSPORTATION AND TRAFFIC
 4. ENVIRONMENTAL IMPACT ANALYSIS 9. TRANSPORTATION AND TRAFFIC 4.9.1 INTRODUCTION The following section addresses the Proposed Project s impact on transportation and traffic based on the Traffic Study
Chapter 5 Future Transportation
 Chapter 5 Future Transportation The Future Land Use Plan identifies the desired land use designations. The land uses desired for Crozet depend, in large part, on the success of the transportation system,
Roadway Bicycle Compatibility, Livability, and Environmental Justice Performance Measures
 Roadway Bicycle Compatibility, Livability, and Environmental Justice Performance Measures Conference on Performance Measures for Transportation and Livable Communities September 7-8, 2011, Austin, Texas
Active Travel Towns Funding Scheme Project Proposal. Sligo. Sligo Local Authorities
 Active Travel Towns Funding Scheme 2014-2016 Project Proposal for Sligo by Sligo Local Authorities Introduction Over the last two years, Sligo Local Authorities have implemented years 1 & 2 of their 5
 Time of Change We Are Growing We Are An Attractive Place To Live We Are Age Diverse + Living Longer 50000 40000 30000 20000 10000 0 2010 Census Job Density Housing Sheds Transit Sheds The Project FUNDING
Expansion of Bike Share within San Jose supports the City's ambitious mode shift goals to have 15% of commute trips completed by bicycles by 2040.
 COUNCIL AGENDA: 12/01/15 ITEM: 4 CITY OF SAN JOSE CAPITAL OF SILICON VALLEY TO: HONORABLE MAYOR AND CITY COUNCIL SUBJECT: BAY AREA BIKE SHARE EXPANSION Memorandum FROM: Jim Ortbal DATE: Approved Date irftt/ls'
Vision: Traditional hamlet with an attractive business/pedestrian friendly main street connected to adjacent walkable neighborhoods
 N D. Focus Area II Vision: Traditional hamlet with an attractive business/pedestrian friendly main street connected to adjacent walkable neighborhoods Transit Road Focus Area II is located in the Hamlet
Capital Bikeshare 2011 Member Survey Executive Summary
 Capital Bikeshare 2011 Member Survey Executive Summary Prepared by: LDA Consulting Washington, DC 20015 (202) 548-0205 June 14, 2012 EXECUTIVE SUMMARY Overview This report presents the results of the 2012
Application of Demographic Analysis to Pedestrian Safety. Center for Urban Transportation Research University of South Florida
 Application of Demographic Analysis to Pedestrian Safety BDV25 TWO 977 30 Pei Sung Lin, Ph.D., P.E., PTOE, FITE Program Director Achilleas Kourtellis, Ph.D. Senior Research Associate CUTR, University of
Develop a Multi-Modal Transportation Strategy (Theme 6)
") DEVELOP A MULTI-MODAL TRANSPORTATION STRATEGY (THEME 6) WHY IS THIS THEME ADDRESSED? Develop a Multi-Modal Transportation Strategy (Theme 6) Statement of Ideal Reduce resident and visitor reliance on single
DEVELOP A MULTI-MODAL TRANSPORTATION STRATEGY (THEME 6) WHY IS THIS THEME ADDRESSED? Develop a Multi-Modal Transportation Strategy (Theme 6) Statement of Ideal Reduce resident and visitor reliance on single
Standing Committee on Policy and Strategic Priorities. Mount Pleasant Industrial Area Parking Strategy and Access Improvements
 POLICY REPORT Report Date: April 23, 2018 Contact: Lon LaClaire Contact No.: 604.873.7722 RTS No.: 9944 VanRIMS No.: 08-2000-20 Meeting Date: May 16, 2018 TO: FROM: SUBJECT: Standing Committee on Policy
Transportation and Equity: A 2017 Agenda for Candidates
 In New York, mobility is opportunity. We have succeeded as a global leader in social justice, economic growth and environmental sustainability by investing for more than a century in comprehensive, reliable
TRANSPORTATION & MOBILITY
 TRANSPORTATION & MOBILITY ROADWAY SYSTEM There are approximately 40 miles of roadways in Manitou Springs. For planning purposes, roadways are typically assigned a functional classification which defines
FACTS AND FIGURES: MAKING THE CASE FOR COMPLETE STREETS IN LEE COUNTY
 FACTS AND FIGURES: MAKING THE CASE FOR COMPLETE STREETS IN LEE COUNTY Safety: Close to 5,000 pedestrians and bicyclists die each year on U.S. roads, and more than 70,000 are injured. [Mean Streets, Surface
APPENDIX E BIKEWAY PRIORITIZATION METHODOLOGY
 APPENDIX E BIKEWAY PRIORITIZATION METHODOLOGY INTRODUCTION The network of bikeways recommended in the Bicycle Master Plan is extensive and is likely to be only partially completed during the 25-year life
TRAVEL PLAN: CENTRAL EUROPEAN UNIVERSITY CAMPUS REDEVELOPMENT PROJECT TRAVEL PLAN. Central European University Campus Redevelopment Project.
 TRAVEL PLAN Central European University Campus Redevelopment Project Page 1 Table of Contents Introduction... 3 Background... 7 Building Users... 7 Transportation in Community Consultation... 7 Summary
CHAPTER 7.0 IMPLEMENTATION
 CHAPTER 7.0 IMPLEMENTATION Achieving the vision of the Better Streets Plan will rely on the ability to effectively fund, build and maintain improvements, and to sustain improvements over time. CHAPTER
Preliminary Transportation Analysis
 Preliminary Transportation Analysis Goals of a Robust, Multimodal Transportation Network Safe Accessible/Connected Efficient Comfortable Context-Sensitive Motor Vehicle: Continue to analyze the data to
City of Frederick Bike Share Feasibility Study i
 Executive Summary... 1 Introduction... 3 Purpose of This Study... 3 Background... 3 What is Bike Share?... 3 History of Bike Share... 4 Benefits of Bike Share... 5 Comparable Cities... 8 Existing Conditions...
5. Pedestrian System. Accomplishments Over the Past Five Years
 5. Pedestrian System Accomplishments Over the Past Five Years The Alamo Area Metropolitan Planning Organization (MPO) and its partner agencies recognize the importance of improving pedestrian mobility.
Investment in Active Transport Survey
 Investment in Active Transport Survey KEY FINDINGS 3 METHODOLOGY 7 CYCLING INFRASTRUCTURE 8 Riding a bike 9 Reasons for riding a bike 9 Mainly ride on 10 Comfortable riding on 10 Rating of cycling infrastructure
First and Last Mile Plan. April 2016
 First and Last Mile Plan April 2016 1 First and Last Mile refers to the portion of a transit trip between a transit stop and one s destination, and can include walking, biking, carpooling, rolling or driving,
NYC Pedestrian Safety Study & Action Plan. NYTMC Brown Bag Lunch Presentation December 15, 2010
 NYC Pedestrian Safety Study & Action Plan NYTMC Brown Bag Lunch Presentation December 15, 2010 1 Introduction DOT Safety Goal Strategic Plan: Reduce Fatalities by 50% by 2030 From 274 (2007) to 137 (2030)
Non-motorized Transportation Planning Resource Book Mayor s Task Force on Walking and Bicycling City of Lansing, Michigan Spring 2007 pg.
 Non-motorized Transportation Planning Resource Book pg. 105 of 158 Non-motorized Transportation Planning Resource Book pg. 106 of 158 Non-motorized Transportation Planning Resource Book pg. 107 of 158
Analyzing Gainesville s Bicycle Infrastructure
 Mateo Van Thienen 1 DCP 2002: Intro to GIS II Final Project Paper Abstract: Analyzing Gainesville s Bicycle Infrastructure The main purpose of this project is to determine which areas within Gainesville
Webinar- Importance of Multi- Modal Transit Connections and Fare Policy for Regional Transit Mobility & Equity
 Webinar- Importance of Multi- Modal Transit Connections and Fare Policy for Regional Transit Mobility & Equity Thomas Marchwinski Metro North RR (Previously with NJ Transit) Importance of Multi-Modal Transit
January Project No
 January 13 2015 Project No. 5070.05 Neil Connelly, Director University of Victoria, Campus Planning and Sustainability PO Box 1700 STN CSC Victoria, BC V8P 5C2 Dear Neil: Re: UVic 2014 Traffic Final Report
INNER LOOP EAST. AIA Rochester Annual Meeting November 13, 2013 TRANSFORMATION PROJECT. Bret Garwood, NBD Erik Frisch, DES
 INNER LOOP EAST TRANSFORMATION PROJECT AIA Rochester Annual Meeting November 13, 2013 Bret Garwood, NBD Erik Frisch, DES Why? We are building a city that encourages walking, biking and enjoying the outdoor
Appendix E: Bike Crash Analysis ( )
") Appendix E: Bike Crash Analysis (2009-2012) Davis Bicycle Crashes Analysis 2009-2012 December 2013 Ride Walk Davis Active Transportation Program City of Davis December 2013 Prepared by: Jimmy Fong Active
Appendix E: Bike Crash Analysis (2009-2012) Davis Bicycle Crashes Analysis 2009-2012 December 2013 Ride Walk Davis Active Transportation Program City of Davis December 2013 Prepared by: Jimmy Fong Active
Creating Complete Streets to Accommodate All Users
 Creating Complete Streets to Accommodate All Users Peter Lagerwey, Toole Design Group plagerwey@tooledesign.com Brian Dougherty, Seattle DOT brian.dougherty@seattle.gov International Conference on Urban
Life Transitions and Travel Behaviour Study. Job changes and home moves disrupt established commuting patterns
 Life Transitions and Travel Behaviour Study Evidence Summary 2 Drivers of change to commuting mode Job changes and home moves disrupt established commuting patterns This leaflet summarises new analysis
Public bikesharing has emerged as one of the latest transportation
 Unraveling the Modal Impacts of Bikesharing S U S A N S H A H E E N A N D E L L I O T M A R T I N Public bikesharing has emerged as one of the latest transportation innovations, transforming North American
Flyaway Bus: GIS Analysis on Current and Potential Ridership, Revenue, and Prospective Stations
 ProfessorBarry Waite & Bonnie Shrewsbury Flyaway Bus: GIS Analysis on Current and Potential Ridership, Revenue, and Prospective Stations 1. Abstract The Flyaway Bus is a long distance non-stop shuttle
Bus Rapid Transit (BRT) sets a new global trend in public transportation
 sets a new global trend in public transportation") 01 Transportation Planning 7 International comparative study of Seoul BRT system Ko, Joonho Summary The ridership of the bus rapid transit system in Seoul is the fifth highest among 162 cities worldwide,
01 Transportation Planning 7 International comparative study of Seoul BRT system Ko, Joonho Summary The ridership of the bus rapid transit system in Seoul is the fifth highest among 162 cities worldwide,
A Survey of Planning, Design, and Education for Bikeways and Bus Routes on Urban Streets
 A Survey of Planning, Design, and Education for Bikeways and Bus Routes on Urban Streets, Community & Economic Development Agency, Transportation Services Division (510) 238-3983 bikeped@oaklandnet.com
Goal 3: Foster an environment of partnerships and collaboration to connect our communities and regions to one another.
 Non-Motorized Transportation Plan (NMTP) Draft Vision, Goal and,, Tri-County Regional Planning Commission (TCRPC) Purpose The purpose of the Tri-County Regional Planning Commission (TCRPC) Non-Motorized
CITY OF HAMILTON PUBLIC WORKS DEPARTMENT Transit Division
 CITY OF HAMILTON PUBLIC WORKS DEPARTMENT Transit Division TO: Chair and Members Public Works Committee COMMITTEE DATE: June 4, 2018 SUBJECT/REPORT NO: WARD(S) AFFECTED: PREPARED BY: SUBMITTED BY: Mountain
Eastern PA Trail Summit October 1, 2018
 Eastern PA Trail Summit October 1, 2018 WHO WE ARE + WHY + WE RE * HERE * * * * * * Session Goals: Discuss how to coordinate planning and design in small, urbanized towns Consider how to develop alternative
TRANSPORTATION & ACCESS
 STATE OF CENTER CITY PHILADELPHIA TRANSPORTATION & ACCESS Matt Stanley Center City is well-positioned at the center of an extensive, multi-modal transportation system. It is located just seven miles from
Health Impact Analysis for Integrated Regional Land Use and Transportation Plan
 Health Impact Analysis for Integrated Regional Land Use and Transportation Plan Hsi-Hwa Hu, Guoxiong Huang, Frank Wen, Simon Choi (Southern California Association of Governments) Margaret Shih (Los Angeles
Basalt Creek Transportation Refinement Plan Recommendations
 Basalt Creek Transportation Refinement Plan Recommendations Introduction The Basalt Creek transportation planning effort analyzed future transportation conditions and evaluated alternative strategies for
TRANSIT & NON-MOTORIZED PLAN DRAFT FINAL REPORT Butte County Association of Governments
 1 INTRODUCTION Maintaining a high quality of life is the essence of this plan for transit and non-motorized transportation in Butte County. Curbing greenhouse gas emissions (GHG) by reducing congestion,
Determining bicycle infrastructure preferences A case study of Dublin
 *Manuscript Click here to view linked References 1 Determining bicycle infrastructure preferences A case study of Dublin Brian Caulfield 1, Elaine Brick 2, Orla Thérèse McCarthy 1 1 Department of Civil,
Travel and Rider Characteristics for Metrobus
 Travel and Rider Characteristics for Metrobus 040829040.15 Travel and Rider Characteristics for Metrobus: 2012-2015 Overview The Miami Dade County Metropolitan Planning Organization (MPO) conducted a series
Tunnel Reconstruction South 5 th Street Association October 16, 2018
 Tunnel Reconstruction South 5 th Street Association October 16, 2018 Reconstructing the Tunnel 2 Service During Tunnel Reconstruction April 2019 through July 2020 3 Projected Cross River Travel Paths of
Solana Beach Comprehensive Active Transportation Strategy (CATS)
") Solana Beach Comprehensive Active Transportation Strategy (CATS) 3.0 Goals & Policies The Solana Beach CATS goals and objectives outlined below were largely drawn from the Solana Beach Circulation Element
Solana Beach Comprehensive Active Transportation Strategy (CATS) 3.0 Goals & Policies The Solana Beach CATS goals and objectives outlined below were largely drawn from the Solana Beach Circulation Element
Gordon Proctor Director Policy on Accommodating Bicycle and Pedestrian Travel on ODOT Owned or Maintained Facilities
 Approved: Policy: 20-004(P) Responsible Office: Planning Gordon Proctor Director Policy on Accommodating Bicycle and Pedestrian Travel on ODOT Owned or Maintained Facilities I. POLICY STATEMENT: This policy
Appendix 1 Transit Network Analysis
 Appendix 1 Transit Network Analysis APPENDIX 1 TRANSIT NETWORK ANALYSIS The purpose of this appendix is to provide an update on the transit network analysis as it pertains to: i. SmartTrack ii. Scarborough
 MEMORANDUM - CITY OF PASADENA Department Of Transportation DATE: OCTOBER 21, 2008 TO: ENVIRONMENTAL ADVISORY COMMISSION FROM: ~ FRED C. DOCK, DIRECTOR OF TRANSPORTATION SUBJECT: UPDATE ON DEPT. OF TRANSPORTATION
An Assessment of Potential Greenhouse Gas Emissions Reductions from Proposed On Street Bikeways
 An Assessment of Potential Greenhouse Gas Emissions Reductions from Proposed On Street Bikeways Through the Sustainable Bethlehem Initiative, the Town of Bethlehem has identified both the improvement of
The Route 29 Corridor Study was initiated at the request of Virginia s Commonwealth
 CHAPTER 2: Study Background and approach The Route 29 Corridor Study was initiated at the request of Virginia s Commonwealth Transportation Board in response to requests from members of the General Assembly
Welcome! Public Open House on UBC s Transportation Plan
 1 Welcome! Public Open House on UBC s Transportation Plan Public open house hours: to When it comes to on-campus transportation, what do you think is working well and what are some opportunities for improvement?
Appendix 22 Sea angling from a private or chartered boat
 Appendix 22 Sea angling from a private or chartered boat LUC SMRTS2015 Final Report 359 March 2016 Appendix 22 Sea angling from a private or chartered boat Table A22.1: Summary of sample confidence levels
-Current Get On Board initiative: Existing LTC program to help make LTC accessible, informative, and encourage use of public transit
 2.1.1 Encourage community partners to engage London Transit Commission through the Get On Board program to educate Londoners on how to use the bus system (current initiative)(year 1 to 3) -Current Get
The Move for Food: Food Desert Alleviation for the Greater Madison, WI Area
 The Move for Food: Food Desert Alleviation for the Greater Madison, WI Area University of Wisconsin at Madison GIS Applications (Geography 578), Spring Semester 2016 Michael Dickens, Jonathan Fok, Theresa
o n - m o t o r i z e d transportation is an overlooked element that can greatly enhance the overall quality of life for the community s residents.
 N o n - m o t o r i z e d transportation is an overlooked element that can greatly enhance the overall quality of life for the community s residents. 84 Transportation CHAPTER 11 INTRODUCTION Transportation
Bike Counter Correlation
 Bike Counter Correlation A Story of Synergy: Bike Counts and Strava Metro For decades, transportation planners have used manual and automatic bicycle counters to collect hard data on where and when people