FINAL CORRIDOR SCREENING REPORT
|
|
|
- Baldric Stephens
- 6 years ago
- Views:
Transcription

1 Technical Memorandum Task.5 FINAL CORRIDOR SCREENING REPORT February 5, 2008
2 Table of Contents.0. INTRODUCTION..... STUDY CORRIDOR EVALUATION METHODOLOGY SCREENING PROCESS SCREENING CRITERIA CRITERIA RANKING STUDY CORRIDOR SEGMENTS EVALUATION PRESENCE OF CONGESTION HOV DEMAND Travel Patterns/ Trip Length Distribution (TLD) Person Moving Demand Vehicle Demand HOT DEMAND PHYSICAL ATTRIBUTES PHYSICAL ATTRIBUTES Reversible Lane Analysis SCREENING RECOMMENDATIONS RECOMMENDED FOR PHASE 2 EVALUATION CONDITIONALLY PASSING PHASE SCREENING CRITERIA CORRIDORS NOT PASSING PHASE SCREENING CRITERIA FINAL PHASE RECOMMENDATIONS...35
3 Tables Table -. List of Study Corridors...2 Table 2-. Screening Criteria...7 Table 2-2. Ranking System...9 Table 3-. Congestion Threshold... Table 3-2. Presence of Congestion in 203 and Table 3-3. HOV Demand Threshold...6 Table 3-. Year 2030 HOV Demand...7 Table 3-5. HOT/ TOT Demand Threshold...8 Table 3-6. Year 2030 HOT Demand...9 Table 3-7. Ranking of Physical Attributes...2 Table 3-8. Result of Physical Attributes...22 Table -. Summary of Corridor Screening Results...33 Figures Figure -. Study Corridors...3 Figure -2. Corridor Types... Figure 2-. Screening Process Flow...5 Figure 2-2. Study Corridor Segments...0 Figure 3-. Bottleneck Locations...3 Figure 3-2. Truck Volume Threshold...20 Figure 3-3. Physical Attribute Ranking...28 Figure -. Preliminary Screening Recommendations...3 Figure 5-. Final Phase Screening Recommendations...36

4 .0. INTRODUCTION The purpose of this technical memorandum is to summarize the results of corridor screening based on Phase evaluation criteria developed for this study. These results cover all potential corridors identified by study team members. Recommendations from Phase will determine those corridors that should be evaluated in more detail during Phase 2 of this study. At the study s beginning, a regional technical team (RTT) was formed to work with the consultant team to identify potential corridors. The technical team includes representatives of the North Carolina Department of Transportation (NCDOT), the Charlotte Department of Transportation (CDOT), Metropolitan Planning Organizations (MPOs), Rural Planning Organizations (RPOs) and other local agencies within the Charlotte Region. The RTT also worked with the consultant team to develop screening criteria used in evaluating the corridors. Continuous Access -8 painted buffer I-5, Portland, OR.. Study Corridor Table - lists the major study corridors evaluated during Phase screening of this study while Figure - is a map of the corridors. There are eleven primary corridors, totaling approximately 33 miles. Some corridors are further subdivided to facilitate the evaluation process. The majority (77 percent) operate as freeways/expressways. However, NC-6, NC-2/27, and US-52 are assumed to continue to operate as arterials (see Figure 2). The map also shows roadways that are planned for the future, e.g. US-32 Bypass and Garden Parkway in Gaston County and northeast section of I- 85 loop (between I-77 North and I-85 North). These future roadways are assumed to be in place by the Year The proposed Monroe Connector/Bypass in Union County is not included in this analysis because it has already being approved by the Mecklenburg-Union MPO to operate as a toll road. The remaining sections of this report briefly discuss the screening process, screening criteria, evaluation results, and conclusions with recommendations for moving selected corridors into Phase 2 for more detailed evaluation.
5 Table -. List of Study Corridors Corridor Location / Description Length (Miles) US-52 Between SC-5 in Lancaster County, SC and I-85 south near Ballantyne/ Pineville area. 8. NC-2/27 Between US-7 in Charlotte and US-52 in Albemarle 35.6 Garden Parkway Starting at I-85 and US-32 Bypass, heading south (around Gastonia) and east towards Charlotte, terminating at I-85 near Charlotte Douglas International Airport US32-Bypass Between US-32 and I-85 northwest of Gastonia. 7. US-32 NC-6 Starting at I-85 (Exit 7) in Gastonia and going north and terminating at Lincoln/ Catawba County line. Starting at Lincoln/ Catawba County line at NC-50 and going southeast toward Charlotte; terminating at I-277/ I-77 interchange US-7 Between I-277 loop in Charlotte to I-85 southeast. 3. I-85 south Between US-7 (Exit 0) and I-77 (Exit 38) in Charlotte I-85 north Starting at I-77 (Exit 38) in Charlotte, heading northeast through Cabarrus County and terminating near Long Ferry Road (Exit 8) in Rowan County..8 I-77 south Between Chester/ York County, SC (Exit 73) and I-85 in Charlotte 3.5 I-77 north Between I-85 in Charlotte (including existing HOV lanes) and US- 2/NC-5 (Exit 2) in Iredell County I-85 Includes the entire loop around Charlotte in Mecklenburg County. 65. Total 33.0 Existing I-77 HOV, Charlotte, NC 2


6 Figure -. Study Corridors Monroe connector/ Bypass is shown in this map. However, since it is being considered by North Carolina Turnpike Authority as a toll facility, it is not being studied as part of this Fast Lanes analysis. 3


7 Figure -2. Corridor Types Monroe connector/ Bypass is shown in this map. However, since it is being considered by North Carolina Turnpike Authority as a toll facility, it is not being studied as part of this Fast Lanes analysis.
8 2.0. EVALUATION METHODOLOGY 2.. Screening Process The screening process involves a corridor meeting certain criteria thresholds that typically define effectiveness for managed lane strategies. If thresholds are not met, then the candidate corridor is not typically carried forward. These screening criteria are evaluated successively since the presence of congestion must first exist to generate any potential benefits, which in turn, affect demand. The following diagram illustrates how evaluation criteria are applied. Figure 2-. Screening Process Flow Base Base and and Model Model Runs Runs Presence of Congestion Line Haul or Bottlenecks YES HOV Thresholds Met? NO HOT or Commercial Goods Thresholds Met? YES Include as HOT Or Truck Corridor? NO YES NO No Managed Use Lane Feasible by 2030 Include as HOV or HOT Corridor No Managed Use Lane Feasible by 2030 Refine Network and Concepts for Each Corridor 5
9 2.2. Screening Criteria The purpose of screening criteria is to define corridor fatal flaws before proceeding into more detailed evaluations for each candidate corridor or corridor segments. Screening criteria for this study are based on guidance in the American Association of State Highway and Transportation Officials (AASHTO) Guide for High-Occupancy Vehicle Facilities [], National Cooperative Highway Research Program (NCHRP) HOV Systems Manual [2], and the Parsons Brinckerhoff HOV Facilities Planning, Operation and Design Guide [3]. HOT lane guidelines can be found in the Federal Highway Administration (FHWA) HOT Lane Guide []. Based on the above references, the study team in consultation with RTT committee selected screening criteria responding to regional mobility goals based on the following measures of effectiveness: Congestion levels along a corridor or at isolated traffic bottlenecks (required for any managed lane option) Travel patterns (responds to high occupancy vehicle (HOV), high occupancy toll (HOT) and truck potential) Vehicle demand for HOV, HOT and truck options (responds to overall potential for effectiveness through different eligibilities) Patronage demand for transit and rideshare services (responds to HOV lane person carrying potential) Tolling potential (responds to HOT lane potential) Physical ability to add Fast Lanes, or conversely, to borrow or convert existing lanes based on current corridor operations Table 2- provides a summary of the screening criteria used during Phase of this study. Technical Memorandum.3, Evaluation Criteria, of this analysis explains in detail the development and use of these criteria. Each of the corridors will be evaluated based on these criteria Criteria Ranking All of the corridors/ segments are evaluated based on the criteria for congestion, HOV demand, HOT (pricing) demand, and physical attributes. Each segment is given a value corresponding to a five point scale, using the median value as meeting the threshold. The range of values is determined according to the distribution of results, and each is customized to the values generated for the Charlotte region along with national experience. For example, if none of the corridors meets a minimum threshold, then all values would be reflected below the median and none would pass for that measure of effectiveness. Under the five point ranking process, a segment meeting the criterion threshold receives a value of three. If the segment exceeds the threshold for a criterion, it gets a value of or 5. A score below 3 indicates the minimum threshold is unmet. These numerical values are converted to filled-in circles (similar to Consumer Reports evaluations so as to prevent averaging, tallying and scoring values among different criteria which are not weighted). Table 2-2 shows the ranking system. 6
10 Table 2-. Screening Criteria Screening No. Criteria Threshold(s) to be Met Parameters Source Presence of Congestion.A Line- haul Freeways: Volume/capacity (V/C) greater than.0 and average speeds below 30 mph in the peak period. Arterials: V/C greater than.0 and average speeds below 20 mph in the peak period. Travel speeds Volume/capacity ratio Regional model output based on existing and proposed roadways for 203 and 2030.B Bottlenecks (less than 0.5 miles) V/C below.0 Speeds below 20 mph. Travel speeds Volume/capacity ratio Regional model output for 203 and HOV Demand 2.A Travel Patterns Freeway corridors: Average trip distances of 5 miles or more. Arterial corridors: Average trip distances of 3 miles or more. Vehicle volumes Threshold is either met or not met for each defined corridor or combination of corridors for a defined commute-shed. Regional model select link data for Not applied to connecting route segments in core of region. 2.B Person Moving Demand Parity or greater when compared to general purpose lane person movement in same corridor, on a per-lane basis, assuming 2000 persons/general purpose lane. Person moving demand basis for vehicles must be capped based on a maximum per-lane flow rate of 650 passenger car equivalents (PCEs) per hour for freeways and 900 PCEs per hour on arterials. Carpool forecasts from model (2030 only) Vehicle occupancy surveys from 2007 Transit patronage estimates where number of carpools are below thresholds. Threshold is either met or not met. 2.C Vehicle Demand HOV Freeway: 600 PCEs/hour minimum HOV Arterial: 200 PCEs/hour minimum Vehicle demand determined for peak period. Maximum volume is 650 PCEs/lane Criteria is met or not met. HOV demand from regional model for 203 and Confirm through national sketch planning techniques for select corridors. 7
11 HOT or TOT Demand 3.A Travel Patterns Freeway corridors: Average trip distances of 5 miles or more for commuters or large trucks. Arterial corridors: Average trip distances of 3 miles or more. Vehicle volumes Threshold is either met or not met for each defined corridor Not applied to connecting route segments in core of region. Regional model link data for B Vehicle Demand (203 and 2030) HOT Freeway: 000 PCEs/hour minimum HOT Arterial: 00 PCEs/hour minimum Commercial movement demand 00 large trucks directionally/hour x two lanes= 800 trucks/hour Vehicle demand must be capped based at a maximum per-lane flow rate of 650 PCEs per hour for freeways and 900 passenger car equivalents per hour on arterials. Criteria is met or not met for each vehicle group Demand from regional model for 203 and 2030 Common origins/destinations > 5 miles using corridor 3.C Revenue Potential Forecast revenue (gross) for screening stage Rapid toll optimization model results based on regional travel forecasts per corridor Regional model Toll optimization model for 203 and 2030 Physical Attributes.A Physical Feasibility-Add a lane Space to add a managed lane (typically 6 ft per direction) ROW and roadway characteristics for each corridor Aerials As builts Project plans implemented by 2030.B Physical Feasibility- Convert a lane Ability to convert or borrow an existing lane or shoulder for a peak hour or direction (reversible lanes), without more than one degradation in LOS for traffic in the remaining lanes; no spillover traffic onto other routes. Resulting volumes cannot exceed 2000 vph for conversion, or reductions in lane, shoulder widths acceptable. ADT/lane in peak hours for 203 and 2030 Current observed LOS on existing corridors 8
12 Table 2-2. Ranking System Value Rank Ranking Description Not a good candidate for further analysis 2 2 Below threshold 3 3 Minimum threshold met Exceeds threshold 5 5 Definitely a good candidate for detailed analysis 2.. Study Corridor Segments Many corridors exhibit widely different attributes. Some portions are more congested and thus, exhibit more demand, than other portions. Some segments have different commute shed patterns, as well as different physical attributes. Corridors were segmented in accordance with these different characteristics. Segments generally were defined for screening purposes based on major junctions where traffic volumes change and along regional geographical boundaries. Figure 2-2 shows the major corridors subdivided into segments for analysis purposes. These segments represent sections of corridors that exhibit similar physical and operational attributes. Although entire corridors might not pass the screening criteria, some parts (segments) of those corridors could be considered based on connectivity to other corridors or have strategic significance to the system if they are marginal in some of the criteria. I-85 was divided into nine segments based on junctions with radial corridors. Segmentation also facilitates summarizing the study findings. For example, in later sections of this report, tabulated results are color coded for easy reference/ identification of the segment colors shown in Figure

13 Figure 2-2. Study Corridor Segments Monroe connector/ Bypass is shown in this map. However, since it is being considered by North Carolina Turnpike Authority as a toll facility, it is not being studied as part of this Fast Lanes analysis. 0
14 3.0. EVALUATION The following section presents study findings for Phase screening criteria. In the following summary tables, the first column is color-coded to match the segment map in Chapter 2 (Figure 2-2). Segments are grouped such that expressway/ freeway segments are listed first followed by arterial segments. Future roadway segments (Garden Parkway and the northeast portion of I-85) are listed at the bottom of the table. 3.. Presence of Congestion The presence of recurring, severe traffic congestion indicates that congestion management strategies, including Fast Lanes, should be considered. For this measure, both average travel speeds and volume/capacity ratios (VCR) were evaluated for each of the corridor segments. Table 3- shows the threshold values used in the screening criteria while Table 3-2 lists and ranks the corridor segments. Table 3-. Congestion Threshold Average Speeds Volume-Capacity-Ratio (VCR) Rank Freeway Arterial Freeway Arterial >55 >5 <0.70 < <25 <5 >.50 >.50 Congestion criteria were evaluated for the horizon years of 203 (earliest likely phased openings) and 2030 (long range planning horizon). Some segments could be congested in 203 but not so in 2030 as a result of committed improvements. Therefore, segments passing the congestion criteria also need to confirm congestion in The following five segments, which are highlighted in Table 3-2, do not exhibit sufficient congestion for Fast Lanes to be feasible by 2030: Corridor US-32 US-32 NC-2/27 US-32 Bypass Garden Parkway Location / Description Between I-85 interchange and future interchange of US-32 Bypass. North of US-32 Bypass. In Stanly County. Between US-32 and I-85 South. South of Gastonia, between I-85 South and I-85. Although the majority of the region will experience congestion by 2030, these candidates did not meet congestion criteria by the planning horizon because they are generally new corridors (such as the Garden Parkway and several new bypasses). The areas served
15 by these candidates for Fast Lanes will not have matured sufficiently to generate significant traffic congestion by the horizon year. Congestion is also not as prevalent in outlying areas where growth can be addressed through planned and funded roadway improvements. However, there are isolated areas along these corridors creating bottleneck conditions resulting in isolated delays and poor levels of service. Figure 3- provides bottleneck locations that merit further analysis for improvement which is beyond the scope of this study. SR-9 Express Lane Orange Co., CA 2

16 Figure 3-. Bottleneck Locations Monroe connector/ Bypass is shown in this map. However, since it is being considered by North Carolina Turnpike Authority as a toll facility, it is not being studied as part of this Fast Lanes analysis. 3
17 Table 3-2. Presence of Congestion in 203 and 2030 Year 203 Year 2030 Average Speed VCR Average Speed VCR Segment Desription From TO AM PM AM PM AM PM AM PM I-277 (Brookshire) I-77 US I-277 (John Belk) US-7 I I-85 south I-77 US I-85 south US-52 US I-85 east US-7 NC-2/ I-85 east NC-2/27 I I-85 northwest NC-6 I I-85 northwest I-85 NC I-85 west I-85 Garden Parkway 3 2 I-85 west Garden Parkway I I-77 south, York Co Exit 73, SC Exit 90 (US-2) I-77 south Exit 90 (US-2) Exit (Nations Ford) I-77 south Exit (Nations Ford) I-277(Brookshire) I-77 existing HOV I-277(Brookshire) I-85 north I-77 north, Meck Co I-85 north Meck/ Iredell CL I-77 north, Iredell Co Meck/ Iredell CL US-2/I I-85 south, west Gastonia Cleveland/ Gaston CL Exit 7 (US-32) I-85 south, east Gastonia Exit 7 (US-32) Exit 27 (NC-273) I-85 south, outside I-85 Exit 27 (NC-273) I-85 west 5 I-85 south I-85 west I I-85 north I-77 I-85 east 3 I-85 north, outside I-85 I-85 east Exit 9 (Speedway Blvd) 3 3 I-85 north, Cabarrus Co Exit 9 (Speedway Blvd) Cabarrus/ Rowan CL 2 I-85 north, Rowan Co Cabarrus/ Rowan CL Exit 8, Long Ferry Rd US-32 north US-32 Bypass/ US-32 US-32 Business US-7 I-277 Albemarle Rd US-7 Albemarle Rd I-85 southeast 3 NC-6 Lincoln/Catawba CL Killian Rd NC-6, outside I-85 Killian Rd I-85 northwest 3 5 NC-6, inside I-85 I-85 northwest I-277 (Brookshire) NC-2/27 US-7 I-85 east NC-2/27 I-85 east Cabarrus/ Stanly CL NC-2/27, Stanly Co Cabarrus/ Stanly CL US-52, Albemarle US-32 south US-32 Bypass/ US-32 I-85 US-52, Lancaster Co SC-5, SC SC/NC state line US-52, Meck Co SC/NC state line I-85 south US-32 Bypass US-32 I-85 south These are committed improvements, only Gpkwy - south Gastonia I-85 south I-85 southwest 2 expected to be in place by 2030 I-85 northeast I-77 I-85 3 Legend: = Fail, 2= Below average, 3= Average, =Above average, 5 = Best Highlight indicates that the segment is not being considered for Phase 2 at this point.
18 3.2. HOV Demand HOV demand focuses on person and vehicle movement. Person movement represents the highest and best use of managed lane efficiency in most project settings while a minimum level of vehicle usage is needed to determine if the lane can be adequately used by HOVs alone. The following criteria are evaluated, using 2030 volume, at this stage. If HOV thresholds are met, a managed lane candidate segment moves forward for more detailed evaluation. Candidates not meeting HOV demand thresholds are still viable as HOT or perhaps truck-only toll (TOT) candidates Travel Patterns/ Trip Length Distribution (TLD) Examining the specific travel patterns, including origins and destinations of commuters, is critical to determining the fast lane market because access will typically need to be more restricted in whatever lane treatment is subsequently evaluated. Trips need to be long enough on a given route to generate meaningful time savings, which can in turn, cause spatial and modal shifts into the managed lane. Short distance trips are not typically targeted on left-side oriented managed lanes due to weaving and throughput friction and the need to maintain operating safety and performance. At the screening stage, the best proxy is examining overall trip lengths or select link data for corridor segments between identified travel producers, such as residential areas, and attractions, which include major employment and activity centers. The regional travel demand model was utilized to determine trip length distribution (TLD) at selected locations. The TLD analysis indicates that the study corridors contain enough trips that travel a sufficient distance (minimum of three miles on arterials and five miles on freeways and expressways). Because there is not a significant difference among the corridors or segments with regard to TLD, this criterion was not a differentiating factor in corridor screening Person Moving Demand Existing and likely levels of person movement primarily transit, carpool and vanpool demand are an early study indicator of Fast Lane effectiveness. Vehicle occupancy counts, combined with traffic forecasts for each user group, are typically generated for this determination. Minimum existing demand is critical to determine whether a Fast Lanes can be a success in its opening year. In general, a Fast Lanes should move more people than a general purpose lane would at a reliable level of service. Table 3-3 lists the threshold values used in this study. Study corridors or segments pass this screening test if they are estimated to carry more than,600 persons per hour per lane (pphpl) on freeways and more than 800 pphpl on arterials. Table 3- ranks the corridor segments based on this screening criterion. The table indicates that only a couple of corridors and segments pass the threshold if a HOV3+ policy is adopted. Under a HOV2+ policy, more than half of the corridors and segments pass the screening criteria threshold. This finding suggests that a future operation policy focused on a 2+ minimum occupancy restriction is feasible. The pphpl estimate in the table is conservative because potential bus transit riders were not included. The level of bus transit service represents the greatest potential to improve person movement in a corridor, and thus, the highest level of effectiveness that may be achieved for Fast Lanes. Bus volumes were not able to be extracted from the regional model in a manner to offer consistency in output among other criteria. The expected contribution of transit ridership for typical corridors in the Charlotte region is not likely to 5
19 be high enough by itself to cause a low volume corridor to pass screening. Projected transit patronage will be assessed further for corridors moving into Phase 2 of the study. Table 3-3. HOV Demand Threshold Persons per Hour per Lane PCE Vehicles per Hour per Lane Rank Freeway Arterial Freeway Arterial , , ,580,90, > 3,580 >,90 >,650 > 900 NOTE: Passenger Car Equivalency (PCE) is based on single occupancy vehicles + commercial vehicles + (.5*Medium Trucks) + (2.5*Heavy Trucks) Vehicle Demand A minimum threshold for vehicle demand must be met for any Fast Lane strategy, and this value varies between freeway and arterial treatments, depending on the overall Fast Lanes vehicle moving threshold. Table 3-3 lists the threshold values used in this study. The study corridors/ segments pass this screening test if they are estimated to carry more than 700 vehicles per hour per lane (vphpl) on freeways and more than 350 (vphpl) on arterials. Table 3- ranks the corridor segments in 2030 based on this screening criterion. Similar to person demand, the table also shows that only a couple of corridors and segments pass the threshold if HOV3+ policy is adopted. Under a HOV2+ policy as shown in Table 3-, two-thirds of the corridors and segments pass the screening criteria threshold, validating a 2+ minimum occupancy requirement. Those corridors not meeting the established threshold for both persons and vehicles for AM and PM peak periods include US-32, Garden Parkway and most portions of I-85. These findings would not change based on consideration of transit market potential for the corridors. Primary factors contributing to low HOV levels on these corridors include low volume trips too far from major employment generators and non-radial commute trips, typically oriented from suburb-to-suburb, which cannot be generated in enough critical mass to meet the threshold. This is a typical finding for circumferential corridors such as I-85. 6
20 Table 3-. Year 2030 HOV Demand Persons per Hour per Lane PCE Vehicles per Hour per Lane HOV 2+ HOV 3+ HOV 2+ HOV 3+ Segment Desription From TO AM PM AM PM AM PM AM PM I-277 (Brookshire) I-77 US I-277 (John Belk) US-7 I I-85 south I-77 US I-85 south US-52 US-7 I-85 east US-7 NC-2/27 I-85 east NC-2/27 I I-85 northwest NC-6 I I-85 northwest I-85 NC I-85 west I-85 Garden Parkway 3 3 I-85 west Garden Parkway I I-77 south, York Co Exit 73, SC Exit 90 (US-2) I-77 south Exit 90 (US-2) Exit (Nations Ford) I-77 south Exit (Nations Ford) I-277(Brookshire) I-77 existing HOV I-277(Brookshire) I-85 north I-77 north, Meck Co I-85 north Meck/ Iredell CL I-77 north, Iredell Co Meck/ Iredell CL US-2/I I-85 south, west Gastonia Cleveland/ Gaston CL Exit 7 (US-32) I-85 south, east Gastonia Exit 7 (US-32) Exit 27 (NC-273) I-85 south, outside I-85 Exit 27 (NC-273) I-85 west I-85 south I-85 west I I-85 north I-77 I-85 east I-85 north, outside I-85 I-85 east Exit 9 (Speedway Blvd) I-85 north, Cabarrus Co Exit 9 (Speedway Blvd) Cabarrus/ Rowan CL I-85 north, Rowan Co Cabarrus/ Rowan CL Exit 8, Long Ferry Rd 2 3 US-32 north US-32 Bypass/ US-32 US-32 Business US-7 I-277 Albemarle Rd US-7 Albemarle Rd I-85 southeast NC-6 Lincoln/Catawba CL Killian Rd NC-6, outside I-85 Killian Rd I-85 northwest NC-6, inside I-85 I-85 northwest I-277 (Brookshire) NC-2/27 US-7 I-85 east NC-2/27 I-85 east Cabarrus/ Stanly CL NC-2/27, Stanly Co Cabarrus/ Stanly CL US-52, Albemarle US-32 south US-32 Bypass/ US-32 I-85 US-52, Lancaster Co SC-5, SC SC/NC state line 2 3 US-52, Meck Co SC/NC state line I-85 south US-32 Bypass US-32 I-85 south Gpkwy - south Gastonia I-85 south I-85 southwest I-85 northeast I-77 I Legend: = Fail, 2= Below average, 3= Average, =Above average, 5 = Best Highlight indicates that the segment is not being considered for Phase 2 at this point. 7
21 3.3. HOT Demand The same assessment for demand related to HOT or TOT feasibility was performed based on the year 2030 regional model output. Vehicle demand, travel patterns and potential for revenue generation are primary attributes. While the regional model will generate HOT demand, this demand also was confirmed using a Toll Optimization Model that uses forecasted traffic demand and tests this demand for specific HOT lane potential. This approach yielded a parallel set of HOT lane vehicle demand estimates based on assumptions including value of time, 2+vehicles allowed free use, and other assumptions related to access to HOT lane. Because a HOT lane facility is expected to have greater use than an HOV lane (the HOT lane is open to more potential users), the demand thresholds shown in Table 3-5 are higher than HOV lanes. The study corridors and segments pass this screening test if they are estimated to carry more than,00 vphpl on freeways and 500 vphpl on arterials by the year Table 3-6 ranks the corridor segments based on this screening criterion. Findings for HOT demand show that the same corridors pass the prescribed higher thresholds for 2030, indicating that these corridors could operate as HOV or HOT lanes. Corridors not passing the screening do not exhibit enough demand in the respective commute sheds to support a dedicated lane treatment. Table 3-6 also provides a cursory assessment of the projected number of vehicles willing to pay a toll to use a HOT lane over a -hour AM or PM peak period. These values do not have relevance to screening at this stage, but are indicative of the level of relative demand among corridors, and can help in developing appropriate assumptions for more in-depth study of lane pricing in the next phase of the study. Toll paying vehicles include single-occupant and commercial vehicles only. Heavy truck traffic was excluded from accessing the HOT lanes in this early test scenario because the default lane treatment was a single lane in each direction. Most truck operations only benefit if multiple lane treatments are provided. Table 3-5. HOT/ TOT Demand Threshold High Occupancy Toll (PCE vphpl) Truck Only Toll Rank Freeway Arterial Do not pass Do not pass 3, > 800 trucks per hour, Passes 5 >,650 > 900 Passes Figure 3-2 shows the relative truck demand based on the model s forecasts for the morning peak hour. Segments that do not meet the threshold (<800 vphpl) is shown in red. Segments with large commercial vehicles between 800 and,000 are shown in light green and those carrying more than,000 are shown in dark green. Although some corridors do not meet the prescribed threshold (colored in red), there may be some short segments with significant truck volume that meet the threshold criteria. These findings will be carried into the next phase of the study for the corridors having truck lane potential. 8
22 Table 3-6. Year 2030 HOT Demand PCE vphpl Paying Toll Segment Desription From TO AM PM AM PM I-277 (Brookshire) I-77 US I-277 (John Belk) US-7 I I-85 south I-77 US I-85 south US-52 US I-85 east US-7 NC-2/27 I-85 east NC-2/27 I I-85 northwest NC-6 I I-85 northwest I-85 NC I-85 west I-85 Garden Parkway 3 I-85 west Garden Parkway I I-77 south, York Co Exit 73, SC Exit 90 (US-2) 3 7 I-77 south Exit 90 (US-2) Exit (Nations Ford) 36 I-77 south Exit (Nations Ford) I-277(Brookshire) I-77 existing HOV I-277(Brookshire) I-85 north I-77 north, Meck Co I-85 north Meck/ Iredell CL 8 33 I-77 north, Iredell Co Meck/ Iredell CL US-2/I I-85 south, west Gastonia Cleveland/ Gaston CL Exit 7 (US-32) I-85 south, east Gastonia Exit 7 (US-32) Exit 27 (NC-273) I-85 south, outside I-85 Exit 27 (NC-273) I-85 west I-85 south I-85 west I I-85 north I-77 I-85 east I-85 north, outside I-85 I-85 east Exit 9 (Speedway Blvd) I-85 north, Cabarrus Co Exit 9 (Speedway Blvd) Cabarrus/ Rowan CL 3 38 I-85 north, Rowan Co Cabarrus/ Rowan CL Exit 8, Long Ferry Rd US-32 north US-32 Bypass/ US-32 US-32 Business 0 2 US-7 I-277 Albemarle Rd US-7 Albemarle Rd I-85 southeast NC-6 Lincoln/Catawba CL Killian Rd NC-6, outside I-85 Killian Rd I-85 northwest NC-6, inside I-85 I-85 northwest I-277 (Brookshire) NC-2/27 US-7 I-85 east NC-2/27 I-85 east Cabarrus/ Stanly CL 97 8 NC-2/27, Stanly Co Cabarrus/ Stanly CL US-52, Albemarle 3 US-32 south US-32 Bypass/ US-32 I US-52, Lancaster Co SC-5, SC SC/NC state line US-52, Meck Co SC/NC state line I-85 south US-32 Bypass US-32 I-85 south 0 0 Gpkwy - south Gastonia I-85 south I-85 southwest I-85 northeast I-77 I Legend: = Fail, 2= Below average, 3= Average, =Above average, 5 = Best Highlight indicates that the segment is not being considered for Phase 2 at this point. 9


23 Figure 3-2. Truck Volume Threshold 3.. Monroe connector/ Bypass is shown in this map. However, since it is being considered by North Carolina Turnpike Authority as a toll facility, it is not being studied as part of this Fast Lanes analysis. 20
24 Physical Attributes Screening physical roadway attributes for potential Fast Lanes takes two perspectives: the ability to add Fast Lanes, or the opportunity to convert or borrow existing lanes or shoulders for the respective peak period and direction. At this stage in the study, no engineering investigations have been performed. Potential lane additions involved a review of right-of-way (ROW) width data from NCDOT and verification using aerial images and field observation in some instances. Conversion examines the current and forecast demand on remaining lanes and whether the potential exists to borrow temporarily or permanently lanes and shoulders for part-time managed lanes. Table 3-7 shows the rationale applied in analyzing physical attributes and ranking the corridor segments. Table 3-7. Ranking of Physical Attributes Rank Description and Rationale for Ranking No space is available. Borrowing a lane is considered if VCR on remaining lanes is less than Space is available if available outside right-of-way (ROW) is paved, inside shoulder is converted to a travel lane and/ or remaining lane widths are narrowed. 3 Space is available in median for minimum section (2 ft. each direction). Space is available for full section if either buffer or barrier separation is applied (2 ft. each direction). 5 Space is available for up to two (2) directional Fast Lanes plus dual shoulders (28-0 ft. each direction, including existing inside shoulders). Results from the ranking of physical attributes are shown in Table
25 Table 3-8. Result of Physical Attributes Corridor Route Limits Description Rank I-77S SC-60 to Gold Hill ft left shoulder, NB and SB, 5-25 ft ROW ea side 2 I-77S Gold Hill to County Line ft left shoulder, NB and SB, 5-25 ft ROW ea side 2 I-77S County line to Westinghouse 25 ft median + 0 ft shoulders, SB and NB, 50 ROW ea side 3 I-77S Westinghouse to I ft median + 0 ft shoulders, SB and 3NB w CD 3 I-77S I-85 to Arrowood 25 ft median +0 ft shoulders, 3SB and 3NB plus 3-lane direct ramps, 0-20 ft ROW ea side 3 I-77S Nations Fd Rd to W Arrowood 25 ft median + 0 lft shoulders, SB and NB (aux lanes incl), 20-0 ft ROW ea side 3 I-77S S. Tryon to Nations Fd Rd -8 ft lft shoulder except at Tyvola, 3NB and SB, ft ROW ea side 2 I-77S S. Tryon to West Blvd -8ft lft shoulder, 3NB and SB, ft ROW ea side 2 I-77S West Blvd to I-277 (Belk Fwy) Lft shoulder > ft, NB, 3SB w CD, 20-0 ft ROW ea side, major RR overcrossing w conflicting columns I-77S I-277(Belk Fwy) to No median, no extra ROW, left hand exits (2), 3SB 5 th w CD, 3NB w CD I-77N 5 th to I-277 (Brookshire Fwy) No median, no extra ROW, left hand exits (2), SB w CD, 5NB I-77N I-277 (Brookshire Fwy) to I-85 No median, HOV SB, 5SB-NB, very limited ROW, existing HOV lane planned in both directions 3 I-77N At I-85 SB HOV connector full std, no NB conn.--planned 3 I-77N I-85 to Cindy Ln wide median, 3+SB, NB 5 I-77N Cindy Ln to Sunset 20 ft remaining median, extra ROW on outside, 3+SB and NB w noisewalls on edge of shoulders 5 I-77N Sunset to I ft min median and varies to 20, 3+SB and NB, limited ROW on outside 5 I-77N I-85 to Hambright 20 ft min median with extra ROW and pavement to outside, 3+ both directions (not striped) 5 I-77N Hambright to Gilead 20 ft median to 0 ft varies, 2SB, 3NB (aux), plus outside ROW 5 I-77N Gilead to Catawba 00+ ft median varies down to 50 ft no inside shldr, 2SB and NB I-77N Catawba to Griffith 50 ft median, no inside shldr, 2SB and NB, causeway over L Norman w 0-5 ft outside slopes I-77N Griffith to US-2 Median narrows to about 26 ft, causeway over L Norman w 0-5 ft outside slopes, otherwise min available outside ROW (varies) 3 22
26 Results of Physical Attributes (Continued) Corridor Route Limits Description Rank I-85S US-32 to NC-279 New Hope 22 ft median, 3NB and SB, 30 ft ROW ea side, tight loop ramps, sharp alignment curves and overpasses, needs rebuilding I-85S NC-279 to NC-7 22 ft median, 3NB and SB, 30+ ft ROW ea side, tight bridge cols. I-85S NC-7 McAdenville to Belmont/Mt Holly 22 ft median varies (wide in short stretch), 3NB and SB, ft ROW ea side I-85S Belmont/Mt Holly to I ft median incl shoulders, NB and SB, 30+ ft ROW ea side I-85S I-85 to Graham Pkwy 22 ft median incl shoulders, -5NB and SB, no outside ROW at frontage roads but 30 ft ea side elsewhere 2 I-85S Graham Pkwy to NC-6 22 ft median incl shoulders, -5NB and SB, no outside ROW due to frontage roads for most segments 2 I-85S NC-6 (Brookshire Blvd) to I ft median incl. shoulders, -5NB and SB, limited outside ROW 2 I-85N I-77 to US ft median, NB and SB, 0-0 ft ROW due to frontage rds 2 I-85N US-29 to Harris Blvd 22 ft median, NB and SB, ft ROW I-85N Harris Blvd to I ft median, NB and SB, ft ROW I-85N I-85 to Speedway Blvd 22 ft median, NB and SB, ft ROW I-85N Speedway Blvd to US ft median, NB and SB, ft ROW by 2030 I-85N US-60 (S Cannon Blvd) through Rowan County 22 ft median, NB and SB, ft ROW I-85W I-85 to NC-6 20 ft median, NB and SB, ft outside ROW I-85W NC-6 to I ft median, NB and SB, ft outside ROW 23
27 Results of Physical Attributes (Continued) Corridor Route Limits Description Rank I-85W I-85 to NC-9 30 ft median incl shoulders, 3NB and SB, wide outside ROW I-85S NC-9 to I median incl shoulders, 3NB and SB, 2NB and SB thru I-77 I-85S I-77 to US ft median incl shoulders, 3NB and SB and widening planned into median, I-85S US 52 to NC-5 Pineville Matthews ft median incl shoulders, 3NB and SB, 50+ ft ROW ea side I-85S NC-5 to NC ft median incl shoulders, 2NB and SB, 50+ ft ROW ea side I-85S NC-6 to US ft median incl shoulders, 2NB and SB, 50+ ft ROW ea side I-85E US-7 to Albemarle Rd ft median incl shoulders, 2NB and SB, 50+ ft ROW ea side I-85E Albemarle Rd to NC-9 (Univ City Blvd) ft median incl shoulders, 3NB and SB, 50+ ft ROW ea side I-85E NC-9 to N Tryon ft median incl shoulders, NB and SB, 50+ ft ROW ea side I-85E N. Tryon to I ft median incl shoulders, NB and SB (future striping), 50+ ft ROW ea side US-7E Stallings Rd to I NB and SB, 20 ft median, 0-5 ft ROW ea side. US-7E I-85 to Matthews Mint Hill Rd 3-NB and SB, 0 ft median, channelized left turns, 0-5 ft ROW ea side US-7E Matthews Mint Hill to Matthews Township Pkwy 25 ft median, 2-3NB and SB, no intersections, ft ROW ea side 3 US-7E Matthews Twnshp to Windsor Square 0-25 ft median, 3NB and SB, ft ROW ea side, signal at Windsor Sq US-7E Windsor Sq to Village Lake Dr 0-25 ft median, 2NB and SB, left and right decal lanes Signals at Sam Newell, Sardis Rd N, Village Lake Dr 2
28 Results of Physical Attributes (Continued) Corridor Route Limits Description Rank US-7E Village Lake Dr to Buick Dr ft median, 3NB and SB, left and right decal lanes, 5-25 ft ROW ea side. Signals at Margaret Wallace Rd, E Harris Blvd, Buick Dr. US-7E Buick Dr. to NC- 2/27 (Albemarle Rd) 0-25 ft median, 3NB and SB, left and right decal lanes, no ROW ea side (sidewalks only). Signals at Idlewild Rd, Farmingdale Dr., N Sharon Amity Rd, US-7E NC-2/27 to Eastway Dr Busway (2 ft barriered) in median, NB and SB, no ROW on outside 3 US-7E Eastway Dr to I- 277(Brookshire) Busway (2 ft barriered) in median, 3NB and SB, no ROW on outside, tight ramps with acel/decal lanes. 3 US-52 SC-5 to SC-75 2NB and SB, at-grade crossings, ft median varies to continuous left turn lane in segments, tight ROW US-52 SC-75 to Six Mile Creek Rd 2NB and SB, at-grade crossings, 25 ft median, tight ROW 2 US-52 Six Mile Creek Rd to Laurel Hill Rd 2NB and SB, at-grade crossings, continuous left turn lane, tight ROW US-52 Laurel Hill Rd to Ballantyne Commons Parkway 2NB and SB, at-grade crossings, 25 ft median, tight ROW (landscaped 6-0 ft median at BC Pkwy) 2 US-52 Ballantyne Commons Parkway to I lanes NB and SB, at-grade intersections, no median, tight ROW (future NB to WB flyover site since routing takes I-85) US-32 North of Hardin Rd. 2 lanes NB and SB in expressway with limited crossovers, 5-50 ft median, up to 50 ft ROW ea side US-32 I-85 to future Garden Parkway (Hardin Rd) lane arterial with signals, no median, limited outside ROW. Gains 5-50 ft median s. of Hartman Rd. Expressway w/o signals between of C Grier Beam Blvd and Hardin Rd (2 lanes NB and SB). NC-2/27 US-7 to I-85 Mostly lane arterial with signals, no median, some left turn pockets, limited outside setbacks. 6 lanes from Reddman Rd/Central to Lawyers Rd. Limited median further east. NC-2/27 I-85 through Cabarrus Co lane arterial with 5 ft median, left turn pockets, 25 ft setbacks ea side to Sam Black Rd; 2-lane highway Sam Black to McManus, Browns Hill Rd to SR-23 and east of SR-253. Many intersections. NC-2/27 Cabarrus Co to Albemarle (Stanly Co) Mostly 2 lane highway, many intersections, some setbacks except in communities. 25
29 Results of Physical Attributes (Continued) Corridor Route Limits Description Rank I-277 Brookshire Frwy US-7 to I-77 Old expressway, lots of deficient ramps. Typically 3 lanes ea direction: -3@2 - ea direction over E 0 th St 0-3@2 - SB, -3@2 -ramp NB at N. College -@2 - ea direction at N. Graham 3 lanes ea dir through I-77, w NB left exit to SB I-77, SB I-77 left entry to SB Brookshire, and NB I-77 left entry to NB Brookshire Outside shoulders vary from to 0 Limited outside ROW I-277 Belk Frwy I-77 to US 7/Brookshire Old expressway, lots of deficient ramps. Typically 3 lanes ea direction NC-6 (Brookshire Blvd) NC-6 I-77 to I-85 Partial expy and arterial section, no traffic lights except at I NB and SB with 36 ft median, some outside ROW. Median narrows at Idaho to curb/gutter. Difficult urban IC at I-85. I-85 to N Hoskins Arterial, 3 lanes ea direction, no median, limited ROW Signal at N. Hoskins 3 NC-6 N. Hoskins to Belhaven Blvd Arterial, 2 lanes ea direction, no median on S end and 20 ft median N of Lawton Rd, ROW varies to 20+ ft ea side at Hovis Rd. Signals at Lawton Rd, Hovis/Oakdale, DMV Dr, Belhaven Blvd NC6 Belhaven Blvd to I- 85 Arterial, 2 lanes ea direction, wide 50 ft median, 5 ft ROW ea side. Signals at Pleasant Grove Rd 3 NC6 I-85 to Lucia Bypass/Co Line Arterial 2 lanes ea direction, 0-50 ft median, 30+ ft ROW ea side. Long bridges at Mt Island Lake with narrower outside ROW. 3 Signal at Mt Holly-Huntersville Rd., Nance Cove Rd. 26
 for most corridors needed to borrow a lane or lanes in the off-peak direction without adversely affecting existing or forecast traffic volumes.")

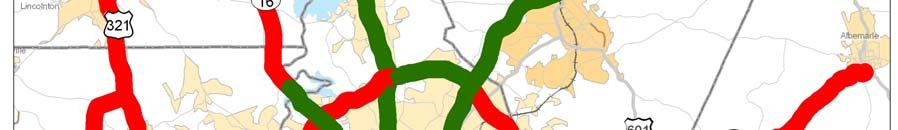
30 3... Reversible Lane Analysis Several of the corridor segments were further evaluated for temporary reversible lane operations based on the directional distribution of traffic during weekday peak periods. In general, there was not a distinct peak direction of travel (i.e. directional split 60/0 or greater) for most corridors needed to borrow a lane or lanes in the off-peak direction without adversely affecting existing or forecast traffic volumes. Although several corridor sections exhibited a more pronounced directional split than others, reversible lanes would have negatively impacted the defined off-peak direction in many candidate corridors based on available travel lanes and estimated 2030 traffic volumes. Two corridors that can be considered for reversible lanes application during Phase 2 are: NC-6 between North Hoskins Road and Belhaven Boulevard is a corridor segment that could benefit from reversible lane operation. This arterial has a 69/3 AM peak split inbound with 920 vehicles per hour outbound which could be accommodated by one lane. Although the entire I-77 corridor in York County does not merit reversible lanes, I-77 between Gold Hill Road and the North Carolina/ South Carolina state line, has a 70/30 split in the AM peak direction (inbound) and borrowing one lane provides adequate capacity for the outbound traffic. Figure 3-3 shows which segments do not pass (red colored lines), pass (green colored lines), or pass under certain assumptions (orange colored lines). For purposes of screening, several corridors not meeting physical attributes above were retained for further consideration where it appeared that borrowing a lane could be feasible. These corridors include NC-6 for a one-mile section north of I-77 and a segment of I-77 south of I-85. Portions of I-85 between Gastonia and I-85 may also be appropriate. These segments were retained as conditionally passing the physical attribute criteria based on directional splits. 27


31 Figure 3-3. Physical Attribute Ranking Monroe connector/ Bypass is shown in this map. However, since it is being considered by North Carolina Turnpike Authority as a toll facility, it is not being studied as part of this Fast Lanes analysis. 28
32 .0. SCREENING RECOMMENDATIONS This section summarizes the Phase screening analysis and provides recommendations on corridors and segments that merit detailed analysis in Phase 2 of this study. Table - summarizes the screening criteria findings for the candidate corridors. Results of corridor screening are depicted on a map in Figure -. Corridors and segments that passed Phase screening and are being recommended for more detailed study in Phase 2 are separated in two groups: Pass to Phase 2 includes corridors and segments that ranked high on the screening criteria and are excellent candidates for Phase 2 evaluation. Pass Conditionally includes corridors and segments that would be a good candidate provided they meet certain conditions that were found in this phase to be marginal unless certain assumptions are changed. The most common basis for conditional passing included constrained physical attributes that could not be overcome without significant design exceptions or major corridor reconstruction. The partnering agencies on the RTT can provide input on the potential these corridors represent and the likelihood that physical attributes can be acceptably addressed in the next study phase... Recommended for Phase 2 Evaluation The following corridors and segments meet the screening criteria and are being recommended for detail study during Phase 2: I-77 North between Center City Charlotte and Iredell County majority of the corridor meets the congestion, HOV demand, and physical attribute criteria. This corridor is also a logical extension of the existing I-77 HOV which is experiencing increased use during peak travel periods. I-85 North in Cabarrus County, northeast of I-85 meets congestion, HOV demand, and physical threshold criteria. US-7 East between Center City Charlotte and I-85 meets congestion, HOV demand, and physical threshold criteria. There is already a bus-only lane for part of this corridor which could be analyzed for conversion to a Fast Lane. Future I-85 northeast, between I-85 and I-77 although traffic forecasts do not fare well against the congestion and HOV demand criteria, the segment should advance to Phase 2 because it is a new facility, has adequate right-of-way, and connects two major freeways (I-77 and I-85) in a growing area. I-85 between Arrowood Road and US-52 passes the congestion threshold and meets HOV demand and physical attribute threshold criteria, especially the section between I-77 South to US-52, which is currently being considered for widening. 29
33 .2. Conditionally Passing Phase Screening Criteria Although some corridors did not meet selected screening criteria, they have potential for managed lanes despite their weaknesses. Successful implementation of Fast Lanes in these corridors would require major improvements and/ or dependent on other factors that will be analyzed further in Phase 2 of the study. Based on inputs from RTT, study team has initially identified these potential corridors. However, the following segments are recommended to conditionally pass Phase, pending final approval from RTT at the start of Phase 2: I-85 from I-85 to Gastonia due to limited ability to add a lane without narrowing other lanes and taking inside shoulders. I-77 from Center City Charlotte to south of I-85 although this corridor has the highest traffic volume and meets the congestion criteria, there is limited right-ofway and would require reconstruction of existing I-77. However, this corridor could be considered a continuation of the existing I-77 HOV facility. Without improvements to this corridor, the segment could develop into a bottleneck which diminishes gains from other Fast Lanes improvements. I-77 south segment north of Gold Hill Road has a 70/30 split in the AM peak direction (inbound) and could be considered for a reversible lane operation by borrowing one outbound lane. During the PM peak period, an inbound I-77 lane would be borrowed. NC-6 (Brookshire Boulevard) between I-77 and I-85 due to a limited number of median breaks and signalized intersections. NC-6 between North Hoskins Road and Belhaven Boulevard could be considered for reversible operation because it has a 69/3 AM peak split inbound with 920 vehicles per hour outbound which could be accommodated by one lane. I-85 between US-52 and US-7 due to marginal demand and congestion that is likely to grow faster than other regional corridors and become critical beyond the planning horizon. US-52 a short section of US-52 south of I-85 is retained because of potential inclusion in the proposed widening of I-85 between I-77 and US Corridors Not Passing Phase Screening Criteria The following corridors are not recommended for further study during Phase 2: US-32 in Lincoln and Gaston Counties did not pass the presence of congestion and HOV demand criteria. Future US-32 Bypass did not pass the congestion and HOV demand criteria. Future Garden Parkway did not pass the congestion and HOV demand criteria. NC-6 Sections in Lincoln County and sections in Gaston County, north of Killian Road did not pass the congestion and HOV demand criteria. 30
34 I-85 North in Rowan County did not pass due to a combination of criteria, especially HOT demand and marginal level of projected congestion. NC-2/27 from US-7 towards Cabarrus and Stanly Counties did not pass the physical attribute criteria. Although sections of this corridor exhibited congestion, uncontrolled access and right-of-way issues, makes it difficult to implement a successful Fast Lanes project. US-52 sections in Lancaster County and southern portion of US-52 near the Ballantyne area did not pass the HOV demand and physical attribute criteria. I-77 south in York County segment south of Gold Hill Road did not meet the HOV demand criteria and directional split does not justify reversible lanes. I-85 East between I-85 North and US-7 did not pass the HOV demand criteria. I-85 West and Northwest between I-77 North and Arrowood Road did not pass the HOV demand criteria. I-277 (Brookshire and Belk Freeways) although this freeway passed the congestion and HOV demand criteria, it did not pass Phase due to the limited physical conditions. However, recognizing the importance of this corridor, major improvements to I-277 should be studied. Before and After examples of intersection improvements of North Main Street in Fairfield, VA The above corridors are not being recommended for study in Phase 2 based on the criteria required for successful implementation of a Fast Lanes project. However, these corridors could benefit from other types of improvements. The following matrix provides guidance on the type(s) of improvement(s) that could apply along these corridors. More information is available from these two publications: Freeway Management and Operations Handbook, FHWA Report No.: FHWA- OP EDL No.: A Toolbox for Alleviating Traffic Congestion and Enhancing Mobility, ITE Informational Report/Traffic Congestion/Transportation Demand Management 3


35 Corridors Types of Improvement US-32 US-52 NC-2/27 NC-6 Intersection Improvement X X X Signal upgrades X X Signal Coordination X X Interchange upgrade X Grade separation X X X Safety improvements X Transit improvements X X ITS improvement X Active traffic management X X X Bottleneck removal X Access management X X X Examples of Access/ Traffic Management using queue bypass 32

36 Table -. Summary of Corridor Screening Results 33

37 Figure -. Preliminary Screening Recommendations Monroe connector/ Bypass is shown in this map. However, since it is being considered by North Carolina Turnpike Authority as a toll facility, it is not being studied as part of this Fast Lanes analysis. 3
38 5.0. FINAL PHASE RECOMMENDATIONS On February 2, 2008, the study screening recommendations discussed in Chapter were presented to the RTT for their approval. A major element of RTT consideration involved examination of the corridors which were recommended for Phase 2 on a conditional basis. The RTT recommended two additions to the corridors that were not recommended in Chapter for further study in Phase 2: I-85 north to Exit 68 in Rowan County This four-lane segment of I-85 will be widened at the same time as the section of the interstate just south of it in Cabarrus County. Because I-85 north of Exit 68 has already been widened to eight lanes, the RTT recommended that the portion in Rowan County which has not been widened be analyzed for managed lanes. I-85 between I-85 and Arrowood Road The potential for expanded freight movements along this section of I-85 near Charlotte-Douglas International Airport prompted RTT interest in retaining this segment of the Charlotte Outer Loop for further study of managed lanes feasibility. Figure 5- illustrates the corridors advancing to Phase 2 of the Fast Lanes Study. About 67 miles of the initial highway system under study advance to the detailed corridor analysis in the project s second phase. 35


39 Figure 5-. Final Phase Screening Recommendations 36
Corridor Advisory Group and Task Force Meeting #10. July 27, 2011
 Corridor Advisory Group and Task Force Meeting #10 July 27, 2011 1 Agenda Recap CAG/TF #9 Public Meeting #2 Summary Single Mode Alternatives Evaluation Results Next Steps 2 3 CAG/TF #9 Recap CAG /TF #9
Complete Street Analysis of a Road Diet: Orange Grove Boulevard, Pasadena, CA
 Complete Street Analysis of a Road Diet: Orange Grove Boulevard, Pasadena, CA Aaron Elias, Bill Cisco Abstract As part of evaluating the feasibility of a road diet on Orange Grove Boulevard in Pasadena,
Subject: Solberg Avenue / I-229 Grade Separation: Traffic Analysis
 MEMORANDUM Transportation Bill Troe, AICP Jason Carbee, AICP 12120 Shamrock Plaza Suite 300 Omaha, NE 68154 (402) 334-8181 (402) 334-1984 (Fax) To: Project File Date: Subject: Solberg Avenue / I-229 Grade
Charlotte Region Fast Lanes Study Phase III
 Charlotte Region Fast Lanes Study Phase III Stakeholder Workshop #3 December 13, 2012 Fast Lanes Study, Phases I and II Performed between 2007 and 2009 Evaluated all types of managed lanes (HOV, HOT, truck-only
APPENDIX G: INTERSECTION NEEDS AT OKEECHOBEE BOULEVARD
 APPENDIX G: INTERSECTION NEEDS AT OKEECHOBEE BOULEVARD INTERSECTION NEEDS AT SR 7 and OKEECHOBEE BOULEVARD SR 7 Extension Project Development and Environment (PD&E) Study From Okeechobee Boulevard (SR
EXECUTIVE SUMMARY... vii 1 STUDY OVERVIEW Study Scope Study Area Study Objectives
 Contents EXECUTIVE SUMMARY... vii 1 STUDY OVERVIEW... 1-1 1.1 Study Scope... 1-1 1.2 Study Area... 1-1 1.3 Study Objectives... 1-3 2 EXISTING CONDITIONS... 2-1 2.1 Existing Freeway Conditions... 2-4 2.1.1
City of Wayzata Comprehensive Plan 2030 Transportation Chapter: Appendix A
 A1. Functional Classification Table A-1 illustrates the Metropolitan Council s detailed criteria established for the functional classification of roadways within the Twin Cities Metropolitan Area. Table
Northwest Corridor Project Interchange Modification, Interchange Justification and System Analysis Report Reassessment (Phase I)
") Northwest Corridor Project Interchange Modification, Interchange Justification and System Analysis Report Reassessment (Phase I) Introduction The Georgia Department of Transportation (GDOT) prepared a
Northwest Corridor Project Interchange Modification, Interchange Justification and System Analysis Report Reassessment (Phase I) Introduction The Georgia Department of Transportation (GDOT) prepared a
APPENDIX 2 LAKESHORE ROAD TRANSPORTATION REVIEW STUDY EXECUTIVE SUMMARY
 APPENDIX 2 LAKESHORE ROAD TRANSPORTATION REVIEW STUDY EXECUTIVE SUMMARY Appendix 2 City of Mississauga Lakeshore Road FINAL REPORT Transportation Review Study December 2010 EXECUTIVE SUMMARY Study Purpose
Operational Comparison of Transit Signal Priority Strategies
 Operational Comparison of Transit Signal Priority Strategies Revision Submitted on: November, 0 Author: Adriana Rodriguez, E.I Assistant Engineer Parsons Brinckerhoff 0 South Orange Avenue, Suite 00 Orlando,
METHODOLOGY. Signalized Intersection Average Control Delay (sec/veh)
") Chapter 5 Traffic Analysis 5.1 SUMMARY US /West 6 th Street assumes a unique role in the Lawrence Douglas County transportation system. This principal arterial street currently conveys commuter traffic
Chapter 5 Traffic Analysis 5.1 SUMMARY US /West 6 th Street assumes a unique role in the Lawrence Douglas County transportation system. This principal arterial street currently conveys commuter traffic
Transportation Master Plan Advisory Task Force
 Transportation Master Plan Advisory Task Force Network Alternatives & Phasing Strategy February 2016 BACKGROUND Table of Contents BACKGROUND Purpose & Introduction 2 Linking the TMP to Key Council Approved
Highway 49, Highway 351 and Highway 91 Improvements Feasibility Study Craighead County
 Highway 49, Highway 351 and Highway 91 Improvements Feasibility Study Craighead County Executive Summary March 2015 Highway 49, Highway 351 and Highway 91 Improvements Feasibility Study Craighead County
Traffic Impact Analysis Chatham County Grocery Chatham County, NC
 Chatham County Grocery Chatham County, NC TABLE OF CONTENTS 1. INTRODUCTION... 1 1.1. Location and Study Area... 1 1.2. Proposed Land Use and Access... 2 1.3. Adjacent Land Uses... 2 1.4. Existing ways...
Highway 217 Corridor Study. Phase I Overview Report
 Highway 217 Corridor Study Phase I Overview Report November 3, 24 BACKGROUND AND OVERVIEW Study purpose The Highway 217 Corridor Study is developing multi-modal transportation solutions for traffic problems
Route 7 Corridor Study
 Route 7 Corridor Study Executive Summary Study Area The following report analyzes a segment of the Virginia State Route 7 corridor. The corridor study area, spanning over 5 miles in length, is a multi
7.0 FREEWAYS CONGESTION HOT SPOT PROBLEM & IMPROVEMENT PROJECT ANALYSIS & DEFINITION
 7.0 FREEWAYS CONGESTION HOT SPOT PROBLEM & IMPROVEMENT PROJECT ANALYSIS & DEFINITION 7.1 INTRODUCTION & METHODOLOGY FEASIBILITY REPORT Congestion hot spot problem locations have been assessed using the
STREET AND HIGHWAY PLAN
 STREET AND HIGHWAY PLAN Introduction The street and highway system in the Winston-Salem Urban Area consists of thousands of miles of traffic carrying facilities, ranging from short local residential streets
MoPac South: Impact on Cesar Chavez Street and the Downtown Network
 MoPac South: Impact on Cesar Chavez Street and the Downtown Network Prepared by: The University of Texas at Austin Center for Transportation Research Prepared for: Central Texas Regional Mobility Authority
Basalt Creek Transportation Refinement Plan Recommendations
 Basalt Creek Transportation Refinement Plan Recommendations Introduction The Basalt Creek transportation planning effort analyzed future transportation conditions and evaluated alternative strategies for
LIVERPOOL TRANSPORTATION MODELING TECHNICAL MEMO MAY 2009
 LIVERPOOL TRANSPORTATION MODELING TECHNICAL MEMO MAY 2009 Syracuse Metropolitan Transportation Council 100 Clinton Square 126 N. Salina Street, Suite 100 Syracuse, NY 13202 Telephone (315) 422-5716; Fax
Chapter 4 Traffic Analysis
 Chapter 4 Traffic Analysis PURPOSE The traffic analysis component of the K-68 Corridor Management Plan incorporates information on the existing transportation network, such as traffic volumes and intersection
University Hill Transportation Study Technical Memorandum Alternatives Modeling and Analysis May 2007
 Technical Memorandum May 2007 Syracuse Metropolitan Transportation Council Edwards and Kelcey with Wallace Roberts and Todd Alta Planning and Design CONTENTS SECTION ONE- INTRODUCTION...1 SECTION TWO-
MONTGOMERY COUNTY PLANNING DEPARTMENT THE MARYLAND-NATIONAL CAPITAL PARK AND PLANNING COMMISSION
 MONTGOMERY COUNTY PLANNING DEPARTMENT THE MARYLAND-NATIONAL CAPITAL PARK AND PLANNING COMMISSION MCPB Item No. 3 Date: 01-19-12 Worksession: Countywide Transit Corridors Functional Master Plan Larry Cole,
3.0 PROJECT DESCRIPTION
 The following section of the Draft EIR contains a description of the proposed Elk Grove Boulevard/SR 99 Interchange Modification project, consistent with the requirements of CEQA Guidelines Section 15124.
EXECUTIVE SUMMARY OF CALEDON TRANSPORTATION NEEDS STUDY
 EXECUTIVE SUMMARY OF CALEDON TRANSPORTATION NEEDS STUDY The Caledon Transportation Needs Study has been undertaken as a joint project by the Town of Caledon and the Region of Peel to determine the existing
ENHANCED PARKWAY STUDY: PHASE 2 CONTINUOUS FLOW INTERSECTIONS. Final Report
 Preparedby: ENHANCED PARKWAY STUDY: PHASE 2 CONTINUOUS FLOW INTERSECTIONS Final Report Prepared for Maricopa County Department of Transportation Prepared by TABLE OF CONTENTS Page EXECUTIVE SUMMARY ES-1
MOUNTAIN HOUSE SPECIFIC PLAN I 9.1 INTRODUCTION ASSUMPTIONS TRANSPORTATION FACILITIES TRANSPORTATION IMPROVEMENTS PHASING 9.
 CHAPTER NINE: TRANSPORTATION AND CIRCULATION 9.1 INTRODUCTION 9.1 9.2 ASSUMPTIONS 9.1 9.3 TRANSPORTATION FACILITIES 9.1 9.4 TRANSPORTATION IMPROVEMENTS PHASING 9.3 LIST OF FIGURES LIST OF TABLES Figure
Circulation in Elk Grove includes: Motor vehicles, including cars and trucks
 Circulation, as it is used in this General Plan, refers to the many ways people and goods move from place to place in Elk Grove and the region. Circulation in Elk Grove includes: Motor vehicles, including
Truck Climbing Lane Traffic Justification Report
 ROUTE 7 (HARRY BYRD HIGHWAY) WESTBOUND FROM WEST MARKET STREET TO ROUTE 9 (CHARLES TOWN PIKE) Truck Climbing Lane Traffic Justification Report Project No. 6007-053-133, P 101 Ι UPC No. 58599 Prepared by:
Review of DRAFT STIP. January 18, 2017 MPO Meeting
 Review of DRAFT 2018-2027 STIP January 18, 2017 MPO Meeting Presentation Notes Initial staff review since STIP was released on January 4 Not a complete assessment of all projects and programs will be a
4. ENVIRONMENTAL IMPACT ANALYSIS 9. TRANSPORTATION AND TRAFFIC
 4. ENVIRONMENTAL IMPACT ANALYSIS 9. TRANSPORTATION AND TRAFFIC 4.9.1 INTRODUCTION The following section addresses the Proposed Project s impact on transportation and traffic based on the Traffic Study
Sketch Level Assessment. of Traffic Issues. for the Fluor Daniel I-495 HOT Lane Proposal. Ronald F. Kirby
 Sketch Level Assessment of Traffic Issues for the Fluor Daniel I-495 HOT Lane Proposal Ronald F. Kirby Director of Transportation Planning National Capital Region Transportation Planning Board (TPB) Metropolitan
Harrah s Station Square Casino
 Transportation Analysis Harrah s Station Square Casino Pittsburgh, Pennsylvania Submitted To: City of Pittsburgh and Pennsylvania Gaming Control Board Prepared By: DKS Associates GAI Consultants December
Managed Lanes. Steve Schilke, P.E. Major Projects Unit Head District 1. Illinois Traffic Engineering and Safety Conference October 2016
 Managed Lanes Steve Schilke, P.E. Major Projects Unit Head District 1 Illinois Traffic Engineering and Safety Conference October 2016 Agenda Managed Lanes Projects I-55 (Stevenson Expressway) Express Toll
2.0 Existing Conditions
 20 2.0 Existing Conditions 2.1 Land Use, Future Growth Patterns, Physical Barriers Geographic Overview Sutter County s land use pattern is characterized by extensive agricultural areas, significant natural
Highway 111 Corridor Study
 Highway 111 Corridor Study June, 2009 LINCOLN CO. HWY 111 CORRIDOR STUDY Draft Study Tea, South Dakota Prepared for City of Tea Sioux Falls Metropolitan Planning Organization Prepared by HDR Engineering,
Washington DC Section of ITE Project Briefing
 Washington DC Section of ITE Project Briefing November 5, 2015 Renée Hamilton, VDOT, Deputy District Administrator I-66 Outside the Beltway Improvement Area Project Location Virginia 2 Purpose and Need
5.3 TRAFFIC, CIRCULATION AND PARKING
 5.3 TRAFFIC, CIRCULATION AND PARKING This section is based upon the Downtown Lancaster Specific Plan Traffic Impact Analysis (April 2, 2008) and the Downtown Lancaster Specific Plan Parking Analysis (May
Traffic Impact Study WestBranch Residential Development Davidson, NC March 2016
 Traffic Impact Study WestBranch Residential Development Davidson, NC March 216 TRAFFIC IMPACT STUDY FOR THE WestBranch Residential Development LOCATED IN DAVIDSON, NC Prepared For: Lennar Carolinas, LLC
TRAFFIC IMPACT STUDY CRITERIA
 Chapter 6 - TRAFFIC IMPACT STUDY CRITERIA 6.1 GENERAL PROVISIONS 6.1.1. Purpose: The purpose of this document is to outline a standard format for preparing a traffic impact study in the City of Steamboat
MnPASS System Today and the Future
 MnPASS System Today and the Future April 2010 By Nick Thompson Minnesota Department of Transportation Topics Minnesota s Current and Future MnPASS High Occupancy Toll Systems Overview of the MnPASS System
Waterford Lakes Small Area Study
 Waterford Lakes Small Area Study Existing Traffic Conditions PREPARED FOR: ORANGE COUNTY PUBLIC WORKS DEPARTMENT TRAFFIC ENGINEERING DIVISION ORLANDO, FLORIDA PREPARED WITH: INWOOD CONSULTING ENGINEERS
Welcome. The Brooklin Secondary Plan and Transportation Master Plan are collectively referred to as the Brooklin Study.
 Welcome The Town of Whitby is undertaking a study to prepare a Secondary Plan and Transportation Master Plan to guide and manage growth in the Brooklin area. The Brooklin Secondary Plan and Transportation
MCTC 2018 RTP SCS and Madera County RIFP Multi-Modal Project Eval Criteria GV13.xlsx
 MCTC 8 RTP SCS and Madera County RIFP Multi-Modal Project Eval Criteria GV.xlsx Madera County Transportation Commission Regional Transportation Plan / Sustainable Communities Strategy Multi-Modal Project
DUNBOW ROAD FUNCTIONAL PLANNING
 DUNBOW ROAD FUNCTIONAL PLANNING Final Report August 3, 216 #31, 316 5th Avenue NE Calgary, AB T2A 6K4 Phone: 43.273.91 Fax: 43.273.344 wattconsultinggroup.com Dunbow Road Functional Planning Final Report
APPENDIXB. Traffic Operations Technical Memorandum
 APPENDIXB Traffic Operations Technical Memorandum Environmental Assessment - Lincoln County, SD 85 th Street: Sundowner Avenue to Louise Avenue November 2017 MEMORANDUM Transportation Jim Kollbaum, PE
Intersection Traffic Control Feasibility Study
 Intersection Traffic Control Feasibility Study CSAH 9 at CSAH 60 (185th Avenue) Prepared For: Dakota County Transportation Department Western Service Center 14955 Galaxie Avenue, 3rd Floor Apple Valley,
DRAFT. Memo. Range of the Alternatives Considered in the EIS
 Memo Date: Friday, December 09, 2016 Project: To: From: Subject: State Route 30 EIS UDOT Vince Izzo This memorandum summarizes the draft State Route (S.R.) 30 Level 1 screening results. A more detailed
Chapter 5 Future Transportation
 Chapter 5 Future Transportation The Future Land Use Plan identifies the desired land use designations. The land uses desired for Crozet depend, in large part, on the success of the transportation system,
Traffic Impact Analysis Walton Acres at Riverwood Athletic Club Clayton, NC
 Traffic Impact Analysis Walton Acres at Riverwood Athletic Club Clayton, NC 1. TABLE OF CONTENTS INTRODUCTION...1 1.1. Site Location and Study Area...1 1.2. Proposed Land Use and Site Access...2 1.3.
Southwest Bus Rapid Transit (SW BRT) Functional Planning Study - Executive Summary January 19 LPT ATTACHMENT 2.
 Functional Planning Study - Executive Summary January 19 LPT ATTACHMENT 2.") Southwest Bus Rapid Transit (SW BRT) Functional Planning Study - Executive Summary 2011 January 19 1 of 19 Introduction This executive summary presents the results of the Southwest Bus Rapid Transit (SW
Southwest Bus Rapid Transit (SW BRT) Functional Planning Study - Executive Summary 2011 January 19 1 of 19 Introduction This executive summary presents the results of the Southwest Bus Rapid Transit (SW
JONESBORO HIGHWAY 63 HIGHWAY 18 CONNECTOR STUDY
 JONESBORO HIGHWAY 63 HIGHWAY 18 CONNECTOR STUDY Craighead County May 2007 JONESBORO HIGHWAY 63 HIGHWAY 18 CONNECTOR STUDY Craighead County May 2007 Prepared by Planning and Research Division Arkansas State
3.0 Future Conditions
 3.0 Future Conditions In order to be able to recommend appropriate improvements to the transportation system of the Town, it is important to first understand the nature and volume of traffic that is expected
5858 N COLLEGE, LLC N College Avenue Traffic Impact Study
 5858 N COLLEGE, LLC nue Traffic Impact Study August 22, 2016 Contents Traffic Impact Study Page Preparer Qualifications... 1 Introduction... 2 Existing Roadway Conditions... 5 Existing Traffic Conditions...
Abrams Associates. Transportation Impact Analysis. City of Rocklin. Prepared for: David Mohlenbrok City of Rocklin 4081 Alvis Court Rocklin, CA 95677
 Transportation Impact Analysis Sierra College Boulevard Commercial Project City of Rocklin Prepared for: David Mohlenbrok City of Rocklin 081 Alvis Court Rocklin, CA 95677 Prepared by: 1875 Olympic Boulevard,
PRELIMINARY DRAFT WADDLE ROAD / I-99 INTERCHANGE PROJECT ALTERNATIVE ANALYSIS FINAL TRAFFIC SUMMARY REPORT
 PRELIMINARY DRAFT WADDLE ROAD / I-99 INTERCHANGE PROJECT ALTERNATIVE ANALYSIS FINAL TRAFFIC SUMMARY REPORT Prepared by: In Association with: November 2013 EXECUTIVE SUMMARY Patton Township, in partnership
TRANSPORTATION ANALYSIS REPORT US Route 6 Huron, Erie County, Ohio
 TRANSPORTATION ANALYSIS REPORT US Route 6 Huron, Erie County, Ohio December 12, 2012 Prepared for: The City of Huron 417 Main Huron, OH 44839 Providing Practical Experience Technical Excellence and Client
Chapter 3 BUS IMPROVEMENT CONCEPTS
 Chapter 3 BUS IMPROVEMENT CONCEPTS The purpose of this chapter is to describe potential bus improvement strategies and potential impacts or implications associated with BRT implementation within the existing
ROUTES 55 / 42 / 676 BUS RAPID TRANSIT LOCALLY PREFERRED ALTERNATIVE
 ROUTES 55 / 42 / 676 BUS RAPID TRANSIT LOCALLY PREFERRED ALTERNATIVE April, 2012 1 INTRODUCTION The need for transit service improvements in the Routes 42/55/676 corridor was identified during the Southern
South King County High-Capacity Transit Corridor Study
 HIGH-CAPACITY TRANSIT CORRIDOR STUDY South King County Corridor South King County High-Capacity Transit Corridor Study Corridor Report August 2014 South King County High Capacity Transit Corridor Report
Design Traffic Technical Memorandum
 State Road 7 Extension PD&E Study Design Traffic Technical Memorandum Palm Beach County, FL October 2010 State Road 7 Extension PD&E Study Design Traffic Technical Memorandum Palm Beach County, FL Prepared
Appendix B: Forecasting and Traffic Operations Analysis Framework Document
 Existing Conditions Report - Appendix Appendix B: Forecasting and Traffic Operations Analysis Framework Document This document defines the methodology and assumptions that will be used in the traffic forecasting
Defining Purpose and Need
 Advanced Design Flexibility Pilot Workshop Session 4 Jack Broz, PE, HR Green May 5-6, 2010 Defining Purpose and Need In your agency s project development process, when do design engineers typically get
An Easier Commute. Learn how to use I-77 Express to save you time.
 An Easier Commute Learn how to use I-77 Express to save you time PUBLIC-PRIVATE PARTNERSHIP I-77 Express is the first-ever toll lane public-private partnership with NCDOT I-77 Mobility Partners is financing,
Appendix D: Concept Screening
 Concept Description Concept #1 Route 288 Roadway Widening This concept consists of constructing a third lane on northbound and southbound Route 288 between Powhite Parkway and US 360. This improvement
Figure 1: East West Connector Alignment Alternatives Concept Drawing
 Page 2 of 9 Figure 1: East West Connector Alignment Alternatives Concept Drawing The Montebello Drive extension will run north south and connect Wilsonville Road to the Boones Ferry Road to Brown Road
Traffic Impact Statement
 Traffic Impact Statement Mixed Use Development, US 41 and Old Trail Drive aka Tide-Starbucks 4900 9 th Street North General Development Site Plan (GDSP) Collier County, FL 10/6/2015 Prepared for: Prepared
Stakeholder Focus Group Meeting #3 January 9, 2013 Cattlemens, 2000 Taylor Road, Roseville
 PRESENT Stakeholder Focus Group Meeting #3 January 9, 2013 Cattlemens, 2000 Taylor Road, Roseville PROJECT TEAM REPRESENTATIVES Name Organization Celia McAdam Luke McNeel Caird Leo Heuston Judy Matsui
Review of DRAFT STIP. January 5, 2017 TCC Meeting
 Review of DRAFT 2018-2027 STIP January 5, 2017 TCC Meeting Presentation Notes Initial staff review since STIP was released on January 4 Not a complete assessment of all projects and programs will be a
Alberta Infrastructure HIGHWAY GEOMETRIC DESIGN GUIDE AUGUST 1999
 Alberta Infrastructure HIGHWAY GEOMETRIC DESIGN GUIDE AUGUST 1999,1'(; A ACCELERATION Data on acceleration from stop D-29 Effects of grade D-35 Intersections D-97, D-99 Lanes D-97, F-5, F-7, F-15, F-21,
TABLE TRAFFIC ANALYSIS SCENARIOS
 4.11 TRANSPORTATION The potential traffic impacts of the proposed project are evaluated in the Buena Park Beach/Orangethorpe Mixed Use Project Traffic Analysis (Traffic Analysis) by Austin-Foust Associates
Clackamas County Comprehensive Plan
 ROADWAYS The County s road system permits the movement of goods and people between communities and regions, using any of a variety of modes of travel. Roads provide access to virtually all property. They
3 ROADWAYS 3.1 CMS ROADWAY NETWORK 3.2 TRAVEL-TIME-BASED PERFORMANCE MEASURES Roadway Travel Time Measures
 ROADWAYS Approximately 6 million trips are made in the Boston metropolitan region every day. The vast majority of these trips (80 to percent, depending on trip type) involve the use of the roadway network
INTRODUCTION. The focus of this study is to reduce congestion and improve mobility for all modes of transportation. Figure ES-1 Study Corridor Map
 INTRODUCTION The I-280 Corridor Study is a highway planning study led by Santa Clara VTA, in partnership with the City of Cupertino and in coordination with other stakeholders in the study area. The study
I-66 Corridor Improvements Route 15 to I-495. November 2014
 I-66 Corridor Improvements Route 15 to I-495 November 2014 I-66 Corridor: Haymarket to the Beltway = Park and Ride Lots 2 Purpose and Need Improve multimodal mobility along the I-66 corridor by providing
I-264 CORRIDOR EVALUATION STUDY. September 7, 2016 Eric Stringfield VDOT Planning Director Chris Lawrence AECOM Senior Transportation Engineer
 I-264 CORRIDOR EVALUATION STUDY September 7, 2016 Eric Stringfield VDOT Planning Director Chris Lawrence AECOM Senior Transportation Engineer Study Overview Interchange Locations Study Context Follow-up
ROADSOADS CONGESTION HAMPTON SYSTEMYSTEM MANAGEMENT. Part II Roadway Congestion Analysis Mitigation Strategies and Evaluation
 HAMPTON ROADSOADS CONGESTION MANAGEMENT SYSTEMYSTEM Part II Roadway Congestion Analysis Mitigation Strategies and Evaluation Presented by: Dwight Farmer, PE Deputy Executive Director, Transportation April
CITY OF ALPHARETTA DOWNTOWN MASTER PLAN TRAFFIC EVALUATION
 CITY OF ALPHARETTA DOWNTOWN MASTER PLAN TRAFFIC EVALUATION June 2015 CITY OF ALPHARETTA DOWNTOWN MASTER PLAN TRAFFIC EVALUATION Introduction The Alpharetta Downtown Master Plan was developed in the fall
MEMORANDUM. Date: September 22, Don Skillingstad, Spokane Transit Authority. Yongliang Zhu, Lochner
 MEMORANDUM Date: September 22, 2014 To: Don Skillingstad, Spokane Transit Authority From: Yongliang Zhu, Lochner Re: Attachments: Median Flyer Stop Weave Analysis West Plains Transit Center IJR Project
Regional Transportation Needs Within Southeastern Wisconsin
 Regional Transportation Needs Within Southeastern Wisconsin #118274 May 24, 2006 1 Introduction The Southeastern Wisconsin Regional Planning Commission (SEWRPC) is the official areawide planning agency
Congestion Reducing Activities. Toby Carr GDOT Director of Planning April 10, 2014
 Congestion Reducing Activities Toby Carr GDOT Director of Planning April 10, 2014 GDOT Performance Dashboard Congestion Congestion Relief Strategies 511 HEROS RTOP Highway Emergency Response Operators
I-25 PEL: CO Springs Denver South Connection. Presentation to Castle Rock Town Council
 I-25 PEL: CO Springs Denver South Connection Presentation to Castle Rock Town Council June 20, 2017 An Important Corridor to Colorado Links the state s two major metropolitan areas and communities between
HCM Sixth Edition. Plus More. Rahim (Ray) Benekohal University of Illinois at Urban Champaign,
 Benekohal University of Illinois at Urban Champaign,") HCM Sixth Edition What s New in the HCM Sixth Edition Plus More Rahim (Ray) Benekohal University of Illinois at Urban Champaign, 65 th Traffic Engineering and Safety Conference October 19 20, 2016 Institute
HCM Sixth Edition What s New in the HCM Sixth Edition Plus More Rahim (Ray) Benekohal University of Illinois at Urban Champaign, 65 th Traffic Engineering and Safety Conference October 19 20, 2016 Institute
San Tomas Expressway
 Implementation Plan San Tomas Expressway Roads and Airports Department August 19, 2003 Implementation Plan San Tomas Expressway County of Santa Clara Roads and Airports Department 101 Skyport Drive San
Preliminary Transportation Analysis
 Preliminary Transportation Analysis Goals of a Robust, Multimodal Transportation Network Safe Accessible/Connected Efficient Comfortable Context-Sensitive Motor Vehicle: Continue to analyze the data to
Appendix C. NORTH METRO STATION AREA TRAFFIC IMPACT STATEMENT 88th Avenue Station
 Appendix C NORTH METRO STATION AREA TRAFFIC IMPACT STATEMENT 88th Avenue Station Prepared for: Regional Transportation Department and URS Corporation as part of the North Metro EIS David Evans and Associates,
I-35W Solutions Alliance Project Update July 13, 2017
 Title I-35W Solutions Alliance Project Update July 13, 2017 Evaluating the potential for Bus Rapid Transit and MnPASS Express Lanes in the southwest Metro, Investigating options for improved bus service
Proposed Action, Purpose and Need Technical Memorandum
 Proposed Action, Purpose and Need Technical Memorandum MoPac (State Loop 1) Intersections, Austin District From North of Slaughter Lane to South of La Crosse Avenue CSJ: 3136-01-015 Travis County, Texas
Appendix 3 Roadway and Bike/Ped Design Standards
 Appendix 3 Roadway and Bike/Ped Design Standards OTO Transportation Plan 2040 4/20/2017 Page A3-1 Adopted Standards The adopted OTO Design Standards and Major Thoroughfare Plan are contained herein.
NORTH HOUSTON HIGHWAY IMPROVEMENT PROJECT DRAFT NEED AND PURPOSE
 NORTH HOUSTON HIGHWAY IMPROVEMENT PROJECT DRAFT NEED AND PURPOSE APPROVED BY FHWA: JULY 2010 UPDATED: OCTOBER 2011 Section 1 Need for and Purpose of Proposed Action Per Council on Environmental Quality
Toll Express Lanes for the Research Triangle region Including discussion of possible applications on I-40
 Toll Express Lanes for the Research Triangle region Including discussion of possible applications on I-40 Presentation for discussion at Durham-Chapel Hill-Carrboro MPO TAC meeting Wednesday, December
Purpose and Need Report. Appendix B. Purpose and Need Report
 Purpose and Need Report Appendix B Purpose and Need Report I-35W North Corridor Project EA Minnesota Department of Transportation Purpose and Need Statement I-35W North Corridor Preliminary Design Project
SELECTED ROADWAY CAPACITY ANALYSIS
 CHAPTERFOUR SELECTED ROADWAY CAPACITY ANALYSIS 4.1 SELECTED ROADWAY CAPACITY ANALYSIS Introduction Capacity analysis was performed on six selected roadways within the Dearborn County study area using the
Planning Study SR 976. Project Advisory Team Meeting May 24, 2017
 ` SR 976 BIRD ROAD/SW 40TH STREET FROM SR 821/HEFT TO SR 5/US-1 Miami-Dade County, Florida FPID No.: 434845-4-22-01 Planning Study Project Advisory Team Meeting May 24, 2017 1 Agenda Introductions Project
WELCOME TO OPEN HOUSE # 1 June 14, 2017
 Langstaff Road Weston Road to Highway 7 Class Environmental Assessment Study WELCOME TO OPEN HOUSE # 1 June 14, 2017 Please sign in and join our mailing list Purpose of Open House #1 & Study Area York
THE FUTURE OF THE TxDOT ROADWAY DESIGN MANUAL
 THE FUTURE OF THE TXDOT ROADWAY DESIGN MANUAL Kenneth Mora, P.E. (Design Division) 10/10/2017 Table of contents 1 2 Reduction in FHWA design controlling criteria Innovative Intersection Guidance 3-7 8-42
Freeway System Considerations
 Session 11 Jack Broz, PE, HR Green May 5-7, 2010 Freeway System Considerations Mainline Transit: Shoulder Operations, BRT, Stations HOV, HOT, UPA Interchanges Exit Ramps Entrance Ramps Bridges Local Crossings
Capital Region Council of Governments
 March 23, 2018 Capital Region Council of Governments PROJECT CONCEPT REPORT Realignment of Swamp and Northfield Road s approaches to Route 44 (Boston Turnpike) Town of Coventry SUMMARY: The Town of Coventry
CIRCLE DRIVE TRAFFIC AND ACCESS MANAGEMENT POLICY GUIDE. Management Principles and Implementation Concepts
 CIRCLE DRIVE TRAFFIC AND ACCESS MANAGEMENT POLICY GUIDE A. PREFACE Management Principles and Implementation Concepts The intent of this policy guide is to provide interim guidance on the implementation