2012 POST SEASON REVIEW
|
|
|
- Marilynn Mills
- 5 years ago
- Views:
Transcription

1 2012 POST SEASON REVIEW SALMON NORTH COAST AREAS 1-6 & CENTRAL COAST AREAS 7-10 FISHERIES AND OCEANS CANADA 1
2 2012 POST SEASON REVIEW Table of Contents Table of Contents Expectations and Results... 4 Statistical Area Map... 8 Area Area 1 Sub-district Map... 9 First Nations Fishery Review Recreational Review Commercial Net Fishery...13 Commercial Troll Fishery Review Area 1 Stream Escapements Area 2 East Area 2 Sub-district Map First Nations Recreational Review Commercial Net Fishery Review Area 2 East Stream Escapements Area 2 West First Nations Recreational Review Commercial Net Review Stream Escapement Summary Area Area 3 Sub-district Map First Nations Fishery FSC Catch Summary Nass River Salmon Stock Assessment Update ESSR Review Nass River Demonstration Fishery Recreational Fishery Review Commercial Net Fishery Review Stream Escapements Area Area 4 Sub-district Map First Nations Fishery Skeena Inland Demonstration Fishery ESSR Review Recreational Fishery Review Commercial Net Fishery Summary Stream Escapements Area Area 5 Sub-district Map First Nations Fishery FSC Catch Summary Recreational Fishery Review Commercial Net Fishery Summary Stream Escapements Area Area 6 Sub-district Map First Nations Fishery Recreational Fishery Review Commercial Net Fishery Summary
3 2012 Stream Escapements North Coast Enhancement Activities Babine Projects Kitimat Hatchery Central Coast Enhancement Upper Skeena Highlights of the 2012 North Coast Troll Fishery Resource Restoration Unit Update..79 Central Coast Post Season Review Areas 7 to (Page numbering restarts within the CC portion) Conservation and Protection Post Season Summary North Coast Revisions Date Page Change 3
4 2012 Expectations and Results 1. Preseason Expectations 2012 EXPECTATIONS & RESULTS AREAS 1 TO 6 - QCI, NASS, SKEENA, GRENVILLE-PRINCIPE & BUTEDALE Expected Area Sockeye Coho Pink Chum Chinook Return 1-2W unk unk Good Poor unk ,000 unk Poor Poor 26, ,400,000 unk Very Poor Poor unk 5 unk unk Very Poor Poor unk 6 unk unk Very Poor Poor unk Interim Target 1 147,000 unk 1,152,000 62,000 5,000 Escapement 2 2E 26,000 unk 728, , W 15,000 unk 411, , ,000 unk 592, ,000 15, ,000 unk 2,097,800 55,000 41, ,500 unk 254,500 35, ,850 unk 1,344, ,000 40,000 Total 1,402,350 unk 6,580,989 1,440, ,860 Food, Social and Ceremonial Alloc. 1-2W 20,000 2,500 2,500 3,000 5, , &5 216,000 5,000 30,000 1,000 15, ,500 1,000 2,000 1,000 2,500 Total 248,500 9,000 34,685 5,025 23,620 Treaty Nisga'a ,000 17,000 45, ,300 Expected 1-2W 0 unk 100, Commercial 3 166,000 unk 60, ,000 Net Catch 4 172,000 unk 15, , unk 1,000 0 unk unk 0 Poor unk Total 338,000 unk 176,000 unk unk 1 - Nisga'a Fisheries Sockeye and Chinook sibling forecasts 2 - Target Escapements are based on subjective spawning capacity with some reference to historic esc. and subsequent returns 3 - Skeena and Nass sockeye and Skeena pink escapement targets are the product of stock recruitment analysis. 4 - Chinook targets for the Skeena and Nass Rivers are the PST stock rebuilding goals 5 - Nisga'a Treaty and Harv. Agr. allocation based on pre-season forecast returns to Can. of "Nass Area" salmon stocks 6 - Hatchery chum return to Kitimat River provides the only Area 6 surplus 4
5 2. Post Season Catch (preliminary) Commercial Area Sockeye Coho Pink Chum Chinook Troll 1/ , ,897 66,266 Closed 62,339 2E/ ,706 0 Closed Closed In-season Hail 2W/ ,437 3,611 Closed 17,918 3/ ,893 1,261 Closed Closed ,758 4,165 Closed Closed Closed Closed 6/ Closed Closed Total 1, ,781 75, ,257 Area Sockeye Coho Pink Chum Chinook Gillnet 1 Closed Closed Closed Closed Closed In-season Hail 2E Closed Closed Closed Closed Closed 2W Closed Closed Closed Closed Closed 3 113,241 Closed 58,528 14, In-land Demo 3 4,250 Closed Closed Closed Closed 4 399,892 Closed 24,214 Closed 314 In-land Demo 4 23,942 Closed Closed Closed Closed 5 2,730 Closed 85 Closed 0 6 Closed Closed 1,546 14, Total 544, ,373 28, Area Sockeye Coho Pink Chum Chinook Seine 1 Closed Closed Closed Closed Closed In-season Hail 2E Closed Closed 219,000 Closed Closed 2W Closed Closed 18,000 Closed Closed 3 5,366 Closed 339,239 25,993 Closed ,340 Closed 10,251 Closed Closed In-land Demo 4 91,733 Closed Closed Closed Closed 5 Closed Closed Closed Closed Closed 6 Closed Closed Closed Closed Closed Total 220, ,490 Closed Closed 7 - Validated Chinook landings 8 - Validated sockeye landings 2012 EXPECTATIONS & RESULTS AREAS 1 TO 6 - QCI, NASS, SKEENA, GRENVILLE-PRINCIPE & BUTEDALE Sport Area Sockeye Coho Pink Chum Chinook Tidal ,660 2, ,600 2E 0 2, W 20 7, ,000 3,4, ,581 2, ,011 6 Unk Unk Unk Unk Unk Total ,301 5, ,061 Freshwater Babine Lake 4 15,000 Closed Closed Closed Closed Babine River 4 Unk Unk Closed Closed Unk Middle Skeena 4 Unk Unk Unk Closed Unk Lower Skeena 4 9 3,978 1, Closed 403 Total 18,978 1, Closed Skeena River from Terrace area downstream Correction: The troll pink catch for Area 6 was 2810 plus 48 pink caught in 106 for a total of The total for all areas is 57,983. 5
6 2. Post Season Catch (preliminary) cont'd 2012 EXPECTATIONS & RESULTS AREAS 1 TO 6 - QCI, NASS, SKEENA, GRENVILLE-PRINCIPE & BUTEDALE First Nations Area Sockeye Coho Pink Chum Chinook Jacks Steelhead FSC Tidal ,000 UNK UNK Non-tidal 1 6, UNK UNK Tidal 2E UNK UNK Non-tidal 2E 2, UNK UNK Tidal 2W UNK UNK Non-tidal 2W UNK UNK Tidal 3 UNK UNK UNK UNK UNK UNK UNK Non-tidal 3 9, Tidal 4 UNK UNK UNK UNK UNK UNK UNK Non-tidal 4 85, UNK 1790 Tidal 5 4,372 UNK UNK UNK UNK UNK UNK Tidal Total 109,330 3,903 3, ,455 UNK 1,790 Treaty - Nisga'a (all catch) 3 69,030 11,804 19, , ESSR 2E Closed Closed Closed Closed Closed Closed Closed 3 Closed Closed Closed Closed Closed Closed Closed Babine Lake 4 216,125 Closed Closed Closed Closed 0 Closed Moricetown Canyon 4 Closed Closed Closed Closed Closed Closed Closed Total 216, Escapement (preliminary) 10 Area Sockeye Coho Pink Chum Chinook 1 19,050 UNK 207,200 4,010 UNK 2E 10,000 11, ,800 90,809 DNS 2W 11 5,000 UNK 293,715 96,860 DNS 3 159,112 9, ,131 16,886 2, ,070,536 29, ,029 2,254 34, , , ,755 28, , ,155 UNK Total 1,276,453 79,445 2,863, ,623 36, Sum of preliminary escapement estimates from surveyed systems only 11-2W Sockeye is from Mercer Creek 6
7 4. Commercial Fishery Statistics EXPECTATIONS & RESULTS AREAS 1 TO 6 - QCI, NASS, SKEENA, GRENVILLE-PRINCIPE & BUTEDALE Date of First Date of Last Closed for Days Total Boat Gillnet Area Fishery Fishery Balance Fishing Days 1 Closed Closed Closed Closed Closed 2E Closed Closed Closed Closed Closed 2W Closed Closed Closed Closed Closed 3 Jun. 19 Jul. 29 Aug ,375 4 Jun. 15 Jul. 25 Aug ,388 5 Jul. 13 Jul. 25 Aug Aug. 6 Aug. 13 Aug Seine 1 Closed Closed Closed Closed Closed 2E Aug. 22 Sep. 3 Oct W Aug. 22 Aug. 22 Oct Jul. 9 Aug. 7 Aug Jul. 21 Jul. 27 Aug Closed Closed Closed Closed Closed 6 Closed Closed Closed Closed Closed Troll Area F Jun. 21 Sept. 30 Sept , FOS Hail Data 7
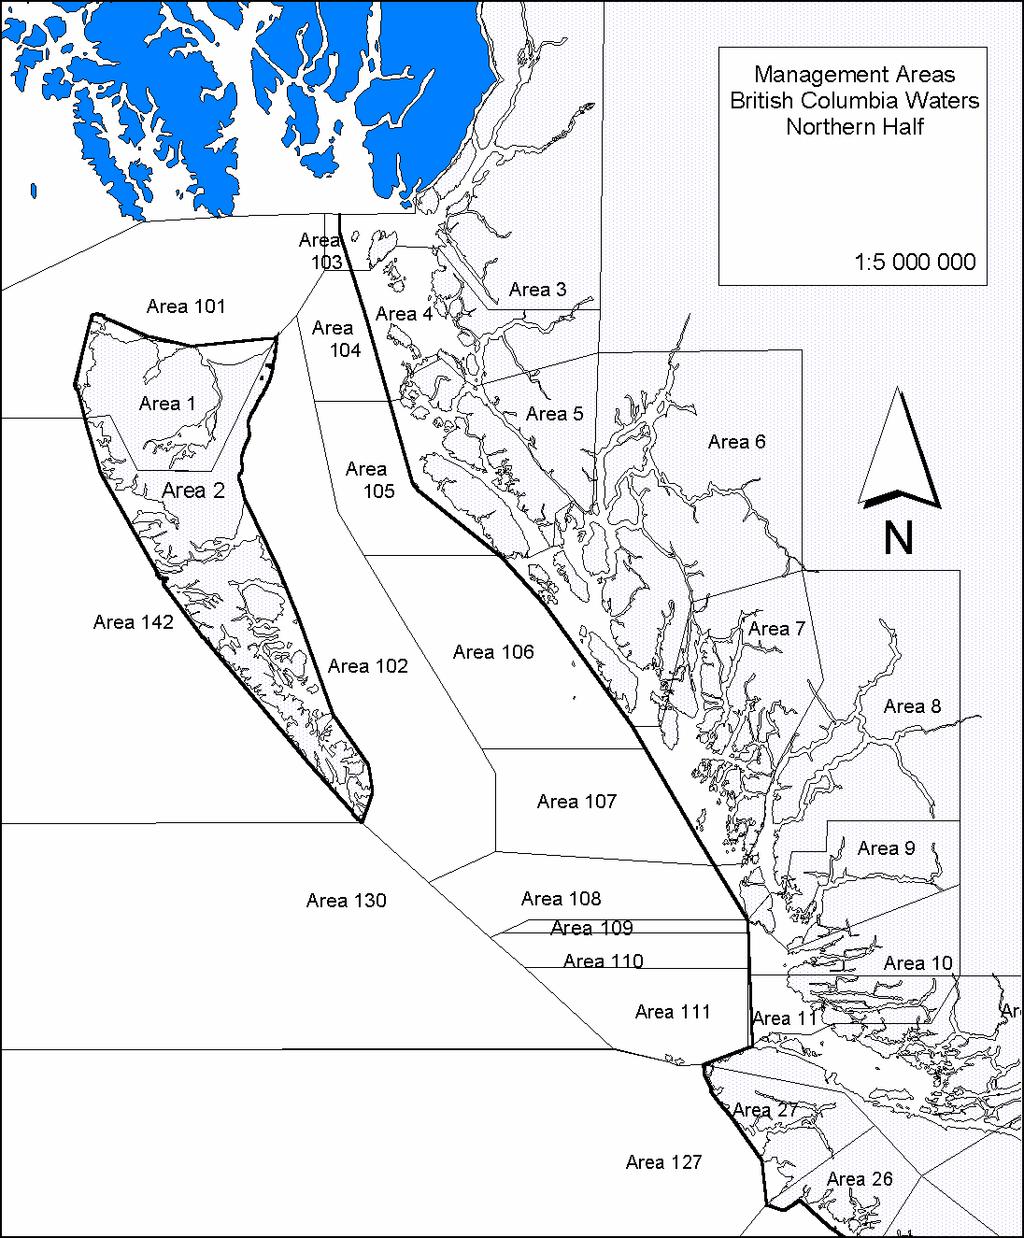
8 Statistical Area Map 8

9 Area 1 Area 1 Sub-district Map 9
10 Area 1 First Nations Fishery Review Salmon fishing for food, social, and ceremonial purposes is open April 1, 2012 to March 31, Haida Sockeye 6,458 (terminal) and 30 (interception) Coho 500 (interception) Pink 170 (interception) Chum 300 (terminal) Chinook 1,000 (interception) FSC Review - The 2012 Haida traditional sockeye fisheries in Masset Inlet streams proceeded under the direction of the Masset Inlet Advisory Committee. The Haida Fisheries Program provided technical advice to the committee and Haida Fisheries Guardians monitored the fisheries and provided onsite management in Masset Inlet. Harvest information for Naden Harbour was obtained through interviews with harvesters post season. Terminal sockeye returns normally support only a small percentage of the community requirements, however, sockeye returns to the Naden River were far stronger than expected and contributed significantly to the overall terminal sockeye harvest. In past years, the majority of FSC salmon have been harvested within Dixon Entrance by seine, gillnet and commercial troll gear, particularly in the Langara Island area. In recent years the low abundance of migrating sockeye and/or lack of availability of a seine vessel had resulted in minimal harvests of Skeena and/or Fraser bound stocks. During the 2012 season the CHN seine Haida Provider attempted to harvest at Langara Island July 18 21, however, sockeye abundance was very low at the time and the catch was minimal with only 30 sockeye caught. There was some effort by a few individuals from Old Masset to harvest terminal chum salmon at the Ain River estuary in the fall. There were no reports of terminal gillnetting activities in other estuaries, such as the Hancock River (across from the Village of Old Masset) and the Yakoun River. ESSR Review There were no ESSR licences issued in Area 1 during the 2012 season. 10
11 Haida Gwaii Food, Social, & Ceremonial Fishery Catch Summary 2012 Area Location Period Sockeye Coho Pink Chum Chinook Comments Haida Gwaii Stocks 1 Yakoun River late May to mid June 1, gillnet terminal sockeye late Sept. to mid. Oct gillnet terminal chum - no known effort Ain River closed through season sockeye conservation concerns October gillnet terminal chum Awun River late May to late June gillnet terminal sockeye Naden River mid July to mid August 4, gillnet terminal sockeye Interception Dixon Entrance July interception seine catch Dixon Entrance June to September interception gillnet catch - no known effort Dixon Entrance June, July & August ,000 *interception troll/sportfish Area 1 Total Catch 6, ,000 Catch information for terminal sockeye and interception seine has been provided by the Haida Fisheries Program. *: The estimated FSC harvest of coho and chinook by hook and line is also included in the total recreational catch estimate. The estimates of coho and chinook harvested by FSC hook and line methods are thought to be conservative. Recreational Review The interception salmon sport fishery received minimal participation by locals over the winter months. Fishing effort departing out of Masset began early May and continued to late September. In addition to a fleet made up of independent anglers and charter operators, mostly operating in McIntyre Bay and Virago Sound, there were 8 fly in lodge operations (floating and land based) within Area 1; 5 present at Langara and 3 in Naden Harbour. Approximately 22,600 chinooks have been harvested in Area 1 during the 2012 season. This is a decrease of approximately 18% when compared to the 2011 season. Recreational (Tidal) Chinook salmon open January 1 to December 31. Daily limit two. Coho salmon open January 1 to December 31 with a daily limit of four. In the tidal portion of all streams the daily limit of coho was two. Sockeye, pink, and chum salmon open January 1 to December 31. Daily limit four. The waters of Masset Inlet and Sound south of a line from Griffiths Point are closed to chinook retention from May 15 to October 31. The waters of Masset Inlet and Sound south of a line from Entry Point to Westacott Point are closed to chinook retention from June 15 to October 31. In the tidal portion of all streams only a single barbless hook may be used. Recreational (Non-tidal) Coho salmon open April 1 to October 31 for four per day, only one over 50 cm. Coho salmon closed November 1, 2012 to March 31,
12 Sockeye, pink, chum, and chinook salmon closed January 1 to December 31. In the non-tidal portion of all streams only a single barbless hook may be used. Table 1. Season estimates of total recreational fishing catch for Haida Gwaii Season Catch By Species Month Area Coho Chinook Pink Sockeye Chum Rockfish Halibut Lingcod May E W May Total June E W June Total July E W July Total Aug E W Aug Total Sept E W Sept. Total May Sept. 2E W Season Total: % of total Log Book 72% 69% 76% 78% 80% 80% 67% 77% catch by Creel 22% 29% 12% 8% 16% 16% 22% 18% source Estimate 6% 3% 12% 14% 4% 4% 11% 6% Note: Catch estimates are preliminary and subject to change. Data sources include Logbook program from fishing lodges, Haida Creel and anecdotal information 12
13 2012 QCI/HAIDA GWAII RECREATIONAL CATCH SUMMARY AREA 1: AREA 2E: AREA 2W: sockeye 0 -sockeye 20 sockeye 32,660 -coho 2,100 -coho 7,960 -coho 2,055 -pink 150 -pink 255 -pink 360 -chum 0 -chum 240 -chum 22,600 -chinook 450 -chinook 17,000 - chinook 12,600 -halibut 1,150 -halibut 4,350 -halibut 4,325 -lingcod 200 -lingcod 5,325 -lingcod 7,620 -rockfish 350 -rockfish 9,730 - rockfish TOTAL AREAS 1+2: 120 -sockeye 42,720 -coho 2,460 -pink 600 -chum 40,050 -chinook 18,100 -halibut 9,850 -lingcod 17,700 -rockfish Note: Anecdotal information was used for catch estimates in : i) Area 2E ii) the months of January to May and October to December. Commercial Net Fishery No gillnet or seine fisheries were directed on passing stocks. Commercial net openings to harvest terminal pink salmon and chum salmon are determined in season on identified surpluses of local stocks. There were no surplus terminal pink or chum salmon harvest opportunities identified in Area 1 during the 2012 season. Commercial Troll Fishery Review The 2012 Salmon License Area F Harvest Management performance continued to be guided by a number of harvest objectives respecting the conservation of Chinook and coho stocks originating from B.C. Rivers and streams. The main conservation issues identified within the Integrated Fisheries Management Plan (IFMP) are i) Chinook stocks of concern originating from the West Coast of Vancouver Island (WCVI); ii) poor pre-season forecasts of Fraser River Spring 52 and Summer 52 Chinook; and iii) weak coho stocks originating from northern areas, notably, the lower and coastal Nass River, upper Skeena River, Haida Gwaii and portions of the Central Coast. Chinook in Northern BC (NBC) are managed pursuant to the Pacific Salmon Treaty (PST) and allocations are administered through this process. The 2012 Aggregate Abundance Based Model (AABM) total allowable catch (TAC) for NBC was 173,600 Chinook. This allocation provided 48,000 Chinook for Area 1 & 2 recreational harvesters and 125,600 Chinook for Area F Troll 13
14 harvesters. As in past years, there was a continuation of the Chinook Demonstration ITQ harvest management fishery involving all 282 license holders. Under the ITQ regime this translated to 445 Chinook per vessel. This quota was amended in August, as the 2012 season Chinook catch by the Area 1 & 2 recreational fishery was forecasted to be approximately 10,000 pieces below the preseason allocation. Therefore an additional 10,000 pieces were added to the 2012 commercial troll TAC resulting in ITQ increasing to 481 Chinook per licence. The Salmon License Area F Harvest Committee (AFHC) continued to provide recommendations to the management of the fishery. Their recommendations were as follows: 1. Chinook Management: i) Opening date: June 19. This date was selected after considering the WCVI and early timed Fraser River 52 stocks of concern. ii) Boundaries: Same boundaries as 2011 with proviso that after September 15 the southern boundary on the West Coast be moved further south to Cape St. James. iii) Inseason closures: DFO to consult with the AFHC to discuss the WCVI stock status, fleet status and how the remainder of the season will be managed, iv) prior to any Chinook closure. Reopen September 15: Chinook fishery should be re-opened (if closed) September 15 whether there are WCVI morts left or not. v) Leasing process: Quota leasing procedures to stay the same as last year. i.e. Implementing a quota ceiling for each license holder so as to not exceed 1,500 uncaught Chinook. 2. Coho Management: i) Opening date: July 1 on the A/B line. July 15 in the main areas. ii) Open the mainland areas as indicated by DFO triggers. 14
15 3. Pink Management: i) Opening date: Concurrent with the Chinook opening and continues through the other openings. 4. Sockeye Management: i) Opening date: Open under the same procedures as 2011 After public consultation, consideration of the recommendations from the AFHC and consideration of domestic stocks of concern, DFO developed the decision guidelines for the management of the fishery as stated in section 7.13 in the 2012 Northern B.C. Salmon IFMP. ITQ Chinook Troll Fishery. The Chinook fishery opened on June 21st with similar fishing boundaries and constraints as in The opening of the fishery was delayed to June 21st as part of a region wide strategy to reduce the impacts on early timed Fraser River 52 Chinook. During the second week of July, Area F Troll interception of WCVI Chinook was projected to reach the maximum allowable WCVI catch of 3,150 pieces between July 17 and 19. This projection was based on the proportion of WCVI Chinook in 2 DNA sample results (3.4%, 4.6% WCVI from catch between June 21 and July 2) and the estimated inseason catch. After consultation with the Area F Harvest Committee, Fisheries Management closed the Chinook fishery on July 15. The fishery was re-evaluated with updated DNA sample results (3.7%, 3.4% WCVI from catch between July 2 10) and effort estimates in the third week of July which resulted in a revised catch estimate of 59,900 pieces containing 2,350 WCVI Chinook. After discussions with the Area F Troll Harvest Committee, DFO reopen Area F troll on July 20th to the retention of Chinook with 800 WCVI Chinook mortality allowance remaining and the expectation that the fishery would close at the start of August when the proportion of WCVI in the troll catch has historically risen dramatically. The fishery continued until Aug. 11 when it was closed after receiving DNA sample results from catch between July that contained 5.2% WCVI Chinook resulting in an estimated WCVI Chinook total catch of 2,856 by Aug. 7. The fishery was re-evaluated further using additional DNA sample results (5.4% WCVI in catch between July 28 and August 11) and validated total catch of 79,172 Chinook that contained 2,870 pieces of the maximum 3,150 WCVI mortality allowance. Area F Troll was reopened to retention of Chinook on Sept. 4 as the proportion of WCVI typically decreases in September. In the first week of the fishery after reopening, fishing effort dropped dramatically (< 20 vessels) and very low CPUE of Chinook. Therefore the risk of exceeding the maximum WCVI limit by Area F Troll was deemed to be low leading to the expansion of the fishing area by moving the southern boundary on the western side of Haida Gwaii down to Cape Freeman on Sept. 7. The ribbon boundary on the northern shore of Graham Island was removed on Sept. 10, after all the large recreational fishing lodges in the area closed for the season. The fishery then continued to until September 30th when it was closed for the balance of the 2012 season. 15
16 Table 1. Area F Troll Chinook 2012 allocation and catch. Allocation No. No. Estimated Licences CH/Licence Catch PST - AABM Fisheries: 173,600 1 Area 1-2 Rec. 48,000 40,050 2 Area F Troll a 125, b 135, ,256 DFO owned ATP Licences: 10, Total: 120,306 Stocks of Concern: WCVI CH 3,150 2,902 Note: a- Start of season. b- Troll allocation increased for Sept. 4 restart. Coho Fishery The A-B Line directed pink fishery opened on July 1 with the allowance to harvest all salmon species except chum and Chinook salmon. The directed coho fishery opened on July 18th with similar fishing boundaries and constraints as in Retention of pink salmon was permitted in all coho fishing areas while sockeye salmon was permitted in a reduced area. Notably Area 3 10 were closed due to coho stock concerns in mainland areas. The fleet concentrated in Dixon Entrance from Masset to Rose Spit and Two Peaks (Area 103 and 104). Average CPUE during the first 4 days of the main fishery was 153 coho per day per vessel with approximately 100 to 120 vessels participating. Average CPUE dropped to an average of 34 coho per day per vessel with approximately 80 to 100 vessels participating for August. Area 3 troll was opened to coho retention on August 23, after Nass River Fishwheels indicated strong coho returns that were well above average. Area 4 10 coho stock strength remained low and did not permit an opening. The fishery then continued to until September 30th when it was closed for the balance of the 2012 season. Table 2. Estimated total catch and effort by area and species. Management Area Effort Chinook Coho Pink Sockeye ,127 59,834 16, ,409 54, ,063 49,471 1,149 2W 144 3, , ,750 1,659 2, , , ,987 1, ,758 4, TOTAL 5,897 80, ,780 75,341 1,984 16
17 Area 1 Stream Escapements AREA 1 (preliminary) STREAM ESCAPEMENTS 2012 SOCKEYE COHO PINK CHUM STREAM Esc. Target* Esc. Target* Esc. Target* Esc. Target* MASSET SUBAREA Ain River 150 (15,000) N/I (20,000) 5,000 3,000 (25,000) Awun River 2,400 (20,000) N/I (8,000) N/O 500 (15,000) Datlamen Creek - N/I (5,000) 5,000 (30,000) N/I Mamin River - A/P (15,000) 1,200 (50,000) 10 McClinton Creek - N/I 1,000 - Yakoun River 1 4,500 (45,000) A/P (45,000) 120,000 (650,000) N/I NADEN SUBAREA Davidson Creek - N/I 10,000 (100,000) N/O Lignite Creek - N/I 10,000 (50,000) N/I Naden River 12,000 (20,000) N/I 15,000 (100,000) 500 (20,000) Stanley Creek - N/I N/O N/O (2,000) OUTSIDE SUBAREA Chown River - N/I - - Hiellen River - N/I - - Jalun River N/I (20,000) N/I 40,000 (50,000) - 1 * Yakoun River - was not inspected (N/I) for chinook escapement. Anecdotal information from the Marie Lake Hatchery Crew was that chinook escapement was average (approximatley 5000). Targets are not a biological escapement goals. They are used as a surrogate to assist management identify surplus harvest opportunities. N/O: None observed. N/I: Not inspected. A/P: Adults present. 17

18 Area 2 East Area 2 Sub-district Map 18
19 Area 2 East First Nations Salmon fishing for food, social, and ceremonial purposes is open April 1, 2012 to March 31, Haida Sockeye 2,508 (terminal) Coho 300 (terminal) Pink 0 Chum 0 Chinook 50 (interception) FSC Review - Local food fisheries normally target sockeye salmon in late spring and early summer and to a much lesser degree coho salmon later in the fall. The Copper River sockeye fishery is managed by the Haida Fisheries Program in consultation with a Skidegate Advisory Committee. The Copper River estuary was open to gillnetting for three weekends in May. Sockeye abundance to the Copper River was considered to be average and supported a modest community harvest. Terminal sockeye returns normally support only a portion of the community FSC requirements and are usually supplemented by the harvest of migrating Fraser River bound sockeye by seine at either Rennell Sound and/or Langara Island. During the 2012 season, the CHN seine Haida Provider attempted to harvest at Langara Island July 18 21, however, sockeye abundance was very low and the catch was minimal. Haida Gwaii Food, Social, & Ceremonial Fishery Catch Summary 2012 Area Location Period Sockeye Coho Pink Chum Chinook Comments Haida Gwaii Stocks 1 Yakoun River late May to mid June 1, gillnet terminal sockeye late Sept. to mid. Oct gillnet terminal chum - no known effort Ain River closed through season sockeye conservation concerns October gillnet terminal chum Awun River late May to late June gillnet terminal sockeye Naden River mid July to mid August 4, gillnet terminal sockeye Interception Dixon Entrance July interception seine catch Dixon Entrance June to September interception gillnet catch - no known effort Dixon Entrance June, July & August ,000 *interception troll/sportfish Area 1 Total Catch 6, ,000 Catch information for terminal sockeye and interception seine has been provided by the Haida Fisheries Program. *: The estimated FSC harvest of coho and chinook by hook and line is also included in the total recreational catch estimate. The estimates of coho and chinook harvested by FSC hook and line methods are thought to be conservative. ESSR Review There were no ESSR licences issued in Area 2 East during the 2012 season. 19
20 Recreational Review The early chinook salmon fishery in East Skidegate during mid March to mid May was reported to be poor. Some chinook fishing occurred in Area 2E during the summer months, however the total harvest of chinook in Area 2 East was minimal compared to the number recreationally intercepted salmon harvested on the west and north coasts of Haida Gwaii. Area 2 East is most recognised for its fall coho fisheries which occur along the shores and in key producing streams of East Skidegate Inlet, Cumshewa Inlet, Copper Bay and Tlell. During the 2012 terminal season coho abundance was reported to be average by most recreational anglers. Recreational (Tidal) Chinook salmon open January 1 to December 31. Daily limit two. Coho salmon open January 1 to December 31 with a daily limit of four. In the tidal portion of all streams (other than Pallant Creek and Braverman Creek) the daily limit of coho was two. Sockeye salmon open January 1 to December 31, daily limit of four, except for a local closure in subareas 2-1 and 2-2 (west of a line from Lawn Point to Gray Point) where non-retention of sockeye is in effect from April 1, 2012 to March 31, Pink and chum salmon open January 1 to December 31, daily limit four, except for a local closure in the waters of Skidegate Inlet shoreward of a line between two boundary signs on either side of Sachs Creek estuary from August 15 to October 31. In the tidal portion of all streams only a single barbless hook may be used. Recreational (Non-tidal) Coho salmon open April 1 to October 31 for four per day, only one over 50 cm. Coho salmon closed November 1, 2012 to March 31, Sockeye, pink, chum, and chinook salmon closed January 1 to December 31. In the non-tidal portion of all streams only a single barbless hook may be used. Table 1. Season estimates of total recreational fishing catch for Haida Gwaii Season Catch By Species Month Area Coho Chinook Pink Sockeye Chum Rockfish Halibut Lingcod May E W May Total June E W June Total July E W July Total
21 Aug E W Aug Total Sept E W Sept. Total May Sept. 2E W Season Total: % of total Log Book 72% 69% 76% 78% 80% 80% 67% 77% catch by Creel 22% 29% 12% 8% 16% 16% 22% 18% source Estimate 6% 3% 12% 14% 4% 4% 11% 6% Note: Catch estimates are preliminary and subject to change. Data sources include Logbook program from fishing lodges, Haida Creel and anecdotal information 2012 QCI/HAIDA GWAII RECREATIONAL CATCH SUMMARY AREA 1: AREA 2E: AREA 2W: sockeye 0 -sockeye 20 sockeye 32,660 -coho 2,100 -coho 7,960 -coho 2,055 -pink 150 -pink 255 -pink 360 -chum 0 -chum 240 -chum 22,600 -chinook 450 -chinook 17,000 - chinook 12,600 -halibut 1,150 -halibut 4,350 -halibut 4,325 -lingcod 200 -lingcod 5,325 -lingcod 7,620 -rockfish 350 -rockfish 9,730 - rockfish TOTAL AREAS 1+2: 120 -sockeye 42,720 -coho 2,460 -pink 600 -chum 40,050 -chinook 18,100 -halibut 9,850 -lingcod 17,700 -rockfish Note: Anecdotal information was used for catch estimates in : 21
22 i) Area 2E ii) the months of January to May and October to December. Commercial Net Fishery Review Pink salmon returns to Area 2E were above average in 2012 with surpluses identified in Darwin Sound and Cumshewa Inlet. A commercial net fishery was opened to seines in management sub-area 2-10 August 22 and 23, targeting Salmon River pink salmon. A total of 10 seines participated in the fishery resulting in a total catch of approximately 175,000 pink salmon. An additional fishery was provided on September 3 which was attended by 4 seines. Pink salmon escapements into Salmon River and surrounding streams were hindered significantly by an absence of rainfall resulting in extremely low water levels throughout the terminal season. As a result pinks either held in estuaries near streams or moved into systems to experience significant pre spawn mortalities. There was reluctance toward an aggressive harvest by seines as surpluses were mixed with the required spawning stock and/or there was a need to ensure additional spawners to replenish fish lost due to prespawn mortalities. A fishery in Cumshewa Inlet was not considered due to by-catch concerns on coho, chum and Chinook mixed in with the pinks near Pallant Creek, which is no longer being supported by hatchery production. No surplus terminal chum salmon harvest opportunities were identified in Area 2 East during the 2012 season. AREA 2 EAST Haida Gwaii Commercial Net Catch Summary, 2012 Gillnets: Darwin Sound Seines: Darwin Sound Date # of gillnets sockeye coho pink chum chinook Date # of seines sockeye coho pink chum chinook Aug. 22 N/A Aug , Aug. 23 N/A Aug , Sept. 3 N/A Sept , Totals: Totals: , AREA 2 WEST Gillnets: West Skidegate Inlet Seines: West Skidegate Inlet Date # of gillnets sockeye coho pink chum chinook Date # of seines sockeye coho pink chum chinook Aug. 22 N/A Aug , Totals: Totals: , Area 2 Total Catch: , N/A : Not applicable, fishery was not open to this gear type. Commercial Troll Fishery See Area 1 Commercial Troll Fishery Review 22
23 Area 2 East Stream Escapements AREA 2 EAST (preliminary) STREAM ESCAPEMENTS 2012 SOCKEYE COHO PINK CHUM STREAM Esc. Target* Esc. Target* Esc. Target* Esc. Target* TLELL SUBAREA Tlell River - 9,000 (25,000) 20,000 (25,000) - SKIDEGATE SUBAREA Branch 10 Creek - N/I - N/I Cameron Creek - N/I N/I N/I Carson Bigalow Creek - N/I - N/I Charlie Hartie Creek - N/I - N/I Crabapple Creek - N/I - N/I Deena River - 2,500 (12,000) 75,000 (100,000) 12,000 (30,000) East Narrows Creek - N/I (2,500) East Narrows Canbouy Creek - N/I N/I N/I East Narrows Dolphine Creek - N/I N/I N/I Gore Brook Creek - N/I - N/I Haans Creek - N/I (2,500) 20,000 (5,000) 15 (2,000) Honna River - N/I (2,000) 49,000 (25,000) 300 (10,000) Indian Cabin Creek - N/I 85 1,400 (8,000) Indian Cabin R/H Creek - N/I N/I N/I Jarvis Creek - N/I - N/I Lagins Creek - 24 (3,000) 1,150 (3,500) 17,274 (25,000) Lagins R/H Creek - N/I N/I N/I Lawn Creek - N/I - N/I MacMillan Creek - N/I - N/I Maude Island South Creek - N/I - N/I Mud Bay Creek - N/I A/P 500 (3,000) Muncord Creek - N/I - N/I Outlook Creek - N/I (2,500) Sachs Creek - N/I (500) 10,000 (10,000) 100 (3,500) Saltspring Creek - N/I (250) N/O 270 (2,500) Saltspring Bay L/H Creek - N/I N/I N/I Skidegate Chan. South Creek - N/I - N/I Slatechuck Creek - N/I (2,000) 1,200 2,500 (18,000) Slatechuck R/H Creek - N/I N/I N/I South Bay Dump Creek - N/I N/I N/I South Bay Culvert Creek - N/I N/I N/I Tarundl Creek - N/I (1,500) (5,000) Two Torrent Creek - N/I N/O 130 (2,500) COPPER SUBAREA Blaine Creek - N/I - - Copper River 10,000 (10,000) N/I (15,000) 50,000 (75,000) N/I Grey Bay Creeks (4) - N/I - - Sheldons Bay Creek - N/I - - * Targets are not a biological escapement goals. They are used as a surrogate to assist management identify surplus harvest opportunities. N/O: None observed. N/I: Not inspected. A/P: Adults present. 23
24 AREA 2 EAST (preliminary) STREAM ESCAPEMENTS 2012 SOCKEYE COHO PINK CHUM STREAM Esc. Target* Esc. Target* Esc. Target* Esc. Target* CUMSHEWA SUBAREA Aero Creek - N/I N/I N/I Braverman Creek - N/I N/I N/I Carmichael Creek - N/I 1,500 N/I Chadsey Creek - A/P 3,000 A/P (3,500) Mathers Creek N/I (5,000) N/I (8,000) N/I (75,000) N/I (20,000) Pallant Creek - A/P (3,000) 150,000 (75,000) 20,000 (30,000) Skedans Creek - N/I 60,000 (75,000) N/I SELWYN SUBAREA Big Goose Creek - N/I (200) 7,100 (20,000) 750 (7,000) Breaker Bay Creek - N/I N/I N/I Clint Creek (Sewell L/H#3) - N/I N/I 150 (500) Dana #1 Creek - A/P 10 1,500 (2,500) Dana #2 Creek - N/I N/I 325 (500) Dana #3 Creek - N/I N/I 160 (1000) Dass Creek N/I A/P George Creek (Sewell L/H#2) - N/I N/I N/I Lagoon Creek - A/P (1,500) 40 12,000 (25,000) Little Goose Creek - N/I (150) 550 (5,000) 550 (4,000) Pacofi Creek - A/P (3,500) Sewell Inlet Head Creek - N/I (1,500) 15 1,850 (6,500) Sewell Point Creek - N/I N/I A/P (500) Talunkwan Creek - N/I N/I N/O Thorsen Creek (Sewell L/H#1) - A/P (200) 250 1,650 (2,000) Thurston Creek - N/I (2,000) Traynor Creek - N/I N/I N/I Waterfall Creek - N/I (2,000) ATLI SUBAREA Beljay Bay Creeks (2) - N/I N/I 5 Moore Creek - N/I N/I 40 (3,000) Powrivco Creek - N/I N/I 250 (5,000) Richardson Creek - N/I N/I 150 Sandy Creek - N/I N/I 650 (4,500) Takelley Creek - N/I N/I N/O DARWIN SUBAREA Anna Inlet Creek - N/I 12,000 (10,000) N/O (1,500) Cresent Creek - N/I (1,000) 30,000 (30,000) 650 (6,500) Echo Harbour Creek - N/I 30,000 (15,000) N/I Kostan Creek - N/I N/I N/I (1,500) Salmon River - N/O (750) 250,000 (100,000) 1,000 (25,000) * Targets are not a biological escapement goals. They are used as a surrogate to assist management identify surplus harvest opportunities. N/O: None observed. N/I: Not inspected. A/P: Adults present. 24
25 AREA 2 EAST (preliminary) STREAM ESCAPEMENTS 2012 SOCKEYE COHO PINK CHUM STREAM Esc. Target* Esc. Target* Esc. Target* Esc. Target* JUAN PEREZ SUBAREA Alder Island Creek - N/I N/I (10,000) N/I (5,000) Arrow Creek - N/I (250) N/I N/I (2,000) Gate Creek - N/I 28,000 (20,000) N/I Hutton Head Creek - N/I 410 (15,000) A/P (5,000) Hutton L/H Creek - N/I N/I A/P (3,000) Island Bay L/H Creeks - N/I N/I A/P (2,500) Island Bay R/H Creeks - N/I N/I N/I (2,000) Marker Creek - N/I N/I N/I Marshall Creeks (3) - A/P 2,100 (7,000) A/P (3,000) Matheson L/H Creek - A/P 30,000 (30,000) 500 (6,000) Matheson R/H Creek - N/I 11,000 (5,000) A/P (3,000) Sedgwick Creek - N/I (250) N/I 3,700 (7,000) Skaat Hbr. Creek (5) - N/I (300) N/I A/P (7,000) Windy Bay Creek - N/I (500) 75,000 (70,000) N/I SKINCUTTLE SUBAREA Bag Harbour Creek - N/I (1,000) 2,000 (1,500) 6,000 (12,000) George Bay Creek - A/P (500) 1,000 (1,000) 2,000 (12,000) Harriet Harbour Creek - N/I - N/I (6'000) Huston Inlet Creek - N/I N/I N/I (3,000) Jedway Creek - N/I - N/I (1,500) Slim Inlet Creek - N/I - N/I (1,500) Tangle Creek - N/I (4,000) SOUTH SUBAREA Heater Harbour Creek - N/I N/O A/P * Targets are not a biological escapement goals. They are used as a surrogate to assist management identify surplus harvest opportunities. N/O: None observed. N/I: Not inspected. A/P: Adults present. Area 2 West First Nations Salmon fishing for food, social, and ceremonial purposes is open April 1, 2012 to March 31, Haida Sockeye 0 Coho 250 (interception) Pink 0 Chum 0 Chinook 750 (interception) FSC Review - There were no attempts at harvesting terminal stocks for food fish in Area 2 West during the 2012 season. The were also no attempts to harvest passing sockeye salmon stocks 25
26 by seine at Rennell Sound or West Skidegate during the summer migration period. FSC fish harvests occurred throughout the summer using hook and line gear in the West Skidegate and Rennel Sound areas. Haida Gwaii Food, Social, & Ceremonial Fishery Catch Summary 2012 Area Location Period Sockeye Coho Pink Chum Chinook Comments Haida Gwaii Stocks 1 Yakoun River late May to mid June 1, gillnet terminal sockeye late Sept. to mid. Oct gillnet terminal chum - no known effort Ain River closed through season sockeye conservation concerns October gillnet terminal chum Awun River late May to late June gillnet terminal sockeye Naden River mid July to mid August 4, gillnet terminal sockeye Interception Dixon Entrance July interception seine catch Dixon Entrance June to September interception gillnet catch - no known effort Dixon Entrance June, July & August ,000 *interception troll/sportfish Area 1 Total Catch 6, ,000 Catch information for terminal sockeye and interception seine has been provided by the Haida Fisheries Program. *: The estimated FSC harvest of coho and chinook by hook and line is also included in the total recreational catch estimate. The estimates of coho and chinook harvested by FSC hook and line methods are thought to be conservative. ESSR Review There were no ESSR licences issues for Area 2 West during Recreational Review The interception salmon sport fishery received minimal participation by locals over the winter months. Fishing effort by anglers departing out of Queen Charlotte and Sandspit began early May and mainly occurred between late May and late September. In addition to a significant fleet made up of independent anglers and charter operators, mostly operating in the West Skidegate area, there were 5 fly in lodge operations set up in Port Louis, Nesto Inlet (2), Kano Inlet, and Douglas Inlet in Area 2 West during the 2012 interception season. Approximately 17,000 chinook were harvested in Area 2 West during the 2012 season. This is represents a 14% decrease to the number of chinook harvested during the 2011 season. Recreational (Tidal) Chinook salmon open January 1 to December 31. Daily limit two. Coho salmon open January 1 to December 31 with a daily limit of four. In the tidal portion of all streams the daily limit of coho was two. Sockeye, pink, and chum salmon open January 1 to December 31, daily limit of four. Sockeye closed May 15 to August 15 in the waters of Fairfax Inlet shoreward of a line from Magneson Point to Reid Point. In the tidal portion of all streams only a single barbless hook may be used. 26
27 Recreational (Non-tidal) Coho salmon open April 1 to October 31 for four per day, only one over 50 cm. Coho salmon closed November 1, 2012 to March 31, Sockeye, pink, chum, and Chinook salmon closed January 1 to December 31. In the non-tidal portion of all streams only a single barbless hook may be used. Table 1. Season estimates of total recreational fishing catch for Haida Gwaii Season Catch By Species Month Area Coho Chinook Pink Sockeye Chum Rockfish Halibut Lingcod May E W May Total June E W June Total July E W July Total Aug E W Aug Total Sept E W Sept. Total May Sept. 2E W Season Total: % of total Log Book 72% 69% 76% 78% 80% 80% 67% 77% catch by Creel 22% 29% 12% 8% 16% 16% 22% 18% source Estimate 6% 3% 12% 14% 4% 4% 11% 6% Note: Catch estimates are preliminary and subject to change. Data sources include Logbook program from fishing lodges, Haida Creel and anecdotal information 27
28 2012 QCI/HAIDA GWAII RECREATIONAL CATCH SUMMARY AREA 1: AREA 2E: AREA 2W: sockeye 0 -sockeye 20 sockeye 32,660 -coho 2,100 -coho 7,960 -coho 2,055 -pink 150 -pink 255 -pink 360 -chum 0 -chum 240 -chum 22,600 -chinook 450 -chinook 17,000 - chinook 12,600 -halibut 1,150 -halibut 4,350 -halibut 4,325 -lingcod 200 -lingcod 5,325 -lingcod 7,620 -rockfish 350 -rockfish 9,730 - rockfish TOTAL AREAS 1+2: 120 -sockeye 42,720 -coho 2,460 -pink 600 -chum 40,050 -chinook 18,100 -halibut 9,850 -lingcod 17,700 -rockfish Note: Anecdotal information was used for catch estimates in : i) Area 2E ii) the months of January to May and October to December. Commercial Net Review Pink salmon returns to streams throughout Area 2W were near or at desired escapement levels in The most abundant return was at Government Creek in West Skidegate Inlet where a surplus appeared to be mixed in with the escapement. A commercial net fishery was opened to seines in management sub-area 2-67 on August 22. A total of 2 seines participated in the 5 hour fishery resulting in a total catch of approximately 18,000 pink salmon. Pink salmon escapements to streams throughout Area 2 West were hindered significantly by an absence of rainfall resulting in extreme low water levels throughout the terminal season. As a result pinks either held in estuaries near streams or moved into systems to experience significant pre spawn mortalities. There were no surplus terminal chum salmon harvest opportunities in Area 2 West during the 2012 season. 28
29 Haida Gwaii Commercial Net Catch Summary, 2012 AREA 2 EAST Gillnets: Darwin Sound Seines: Darwin Sound Date # of gillnets sockeye coho pink chum chinook Date # of seines sockeye coho pink chum chinook Aug. 22 N/A Aug , Aug. 23 N/A Aug , Sept. 3 N/A Sept , Totals: Totals: , AREA 2 WEST Gillnets: West Skidegate Inlet Seines: West Skidegate Inlet Date # of gillnets sockeye coho pink chum chinook Date # of seines sockeye coho pink chum chinook Aug. 22 N/A Aug , Totals: Totals: , Area 2 Total Catch: , N/A : Not applicable, fishery was not open to this gear type. Commercial Troll Review See Area 1 Commercial Troll Fishery Review 29
30 Stream Escapement Summary AREA 2 WEST (preliminary) STREAM ESCAPEMENTS 2012 SOCKEYE COHO PINK CHUM STREAM Esc. Target* Esc. Target* Esc. Target* Esc. Target* ATHLOW/OTARD SUBAREA Celestial River - N/I (1,500) N/I (10,000) N/I (4,000) Coates Creek - N/I (5,000) N/I N/I Hobbs Creek - N/I N/I N/I (2,000) Mace Creek - N/I (1,500) N/O 15,000 (5,000) Mercer Creek 5,000 (10,000) N/I (2,000) N/O (10,000) 9,000 (5,000) Nesto Creek (inner) - N/I N/I N/I (2,500) Nesto Creek (outer) - N/I N/I N/I Otard Creek - N/I N/I (10,000) N/I Port Louis Creek - N/I N/I N/I Steel Creek - N/I (1,000) N/I 50 (2,500) RENNELL SUBAREA Bonanza Creek - N/I (1,500) 30,000 (25,000) N/I (1,000) Clapp Basin Creek - N/I N/O A/P Clonard Bay Creek - N/I N/I N/I (1,000) Givenchy Anchorage Creek - N/I N/I N/I Gregory Creek - N/I (500) 5,000 (25,000) N/I (1,000) Indian Bay Creek - N/I N/I N/I Kano Creek (head) - N/I 15,000 (20,000) N/I (4,000) Kano Creek (outer) - N/I N/O (8,000) N/I (3,000) Mountain Creek - N/I N/O 300 (2,000) Rennell Creek - N/I N/O A/P (1,500) Riley Creek - N/I (2,000) 20,000 (20,000) N/I (4,000) Rock Run Creek - N/I (1,000) N/I 200 (3,500) Seal Inlet Creek - N/I (1,000) 9,000 (10,000) 800 (6,000) Shields Creek - N/I N/I 150 Tartu Creek (head) - N/I (750) 3,000 (17,500) 300 (2,500) Tartu Creek (outer) - N/I (500) 3,000 (15,000) N/O (2,000) Yakoun Trail Creek - N/I N/I N/I (1,500) W. SKIDEGATE SUBAREA Buck Channel Creek #8 - N/I N/I 450 Buck Channel Creek #5 - N/I N/I N/I Buck Channel Creek #4 - N/I N/O N/O Buck Channel Creek #1 - N/I N/O N/O Buck Channel Creek #8 - N/I N/O 550 Buck Channel Creek #3 - N/I N/O N/O Buck Channel Creek #2 - N/I N/O 520 Canoe Pass Creek - A/P 60 2,950 (2,000) Dawson Harbour Creek - N/O (300) N/O 2,050 (3,000) Dawson Inlet Creek - 55 (200) (1,000) Government Creek - A/P (2,000) 86,000 (60,000) 3,900 (7,500) Trounce Creek (head) - N/O (300) (4,000) Trounce R/H Creek - N/O 20 1,660 (3,500) West Narrows Creek - N/I N/I N/I (3,000) * Targets are not a biological escapement goals. They are used as a surrogate to assist management identify surplus harvest opportunities. N/O: None observed. N/I: Not inspected. A/P: Adults present. 30
31 AREA 2 WEST (preliminary) STREAM ESCAPEMENTS 2012 SOCKEYE COHO PINK CHUM STREAM Esc. Target* Esc. Target* Esc. Target* Esc. Target* ENGLEFIELD SUBAREA Boomchain Bay Creek - N/I N/I N/I Bottle Inlet Creek - N/I (200) N/I N/I (2,000) Douglas Inlet Creek (head) - N/I N/I N/I Douglas Inlet R/H Creek - N/I N/I N/I (1,000) Inskip Creek - N/I 5,800 (10,000) 1,500 (1,500) Kaisun Creek - N/I (500) 30,800 (30,000) 160 (1,500) Kootenay Inlet Creek (north) - N/I (500) N/I N/I (5,000) Kootenay Inlet Creek (south) - N/I (500) N/I N/I (5,000) MacKenzie Cove Creek - N/I (500) N/I (20,000) N/I (2,000) Mitchell Inlet spillway (Gold Hb - N/I 20 6,600 (4,000) Mudge Creeks (3) - N/I N/0 200 (1,000) Peel Inlet Creek (head) - 30 (200) 200 7,260 (3,500) Peel Inlet L/H #1 Creek - N/I 10 1,020 (1,500) Peel Inlet L/H #2 Creek - N/I (200) 500 2,500 (3,500) Security Inlet L/H Creek - 40 (2,000) 11,000 (40,000) 1,500 (15,000) Security Inlet R/H Creek - 20 (1,000) 2,500 (20,000) 840 (5,000) TASU SUBAREA Botany Inlet Creek (head) - N/I (300) N/O 10,000 (5,000) Botany Inlet Creek (outer) - N/I N/O 15,000 (4,000) Edwards Creek - N/I N/I N/I Fairfax Inlet Creek N/I 2, (1,000) N/I 6,000 (3,000) Fairfax Outer Creek - N/I (1,000) N/I N/I (3,000) Flat Creek - N/I N/I N/I (2,000) Lomgon Creek - N/I N/I N/I Tasu Creek - A/P (1,000) 71,700 (25,000) 3,450 (10,000) Wilson Bay Creek - N/I N/I N/I (2,000) SOUTH SUBAREA Flamingo Inlet Creek - N/I N/I N/I Goski Bay Creek - N/I N/O 1,500 Louscoone Inlet Creek (outer) - N/I N/I N/I Louscoone Inlet Creek - N/I N/O 300 Sperm Bay Creek - N/I N/I N/I Staki Creek - N/I N/I N/I Yakulanas Creek - N/I N/O 400 * Targets are not a biological escapement goals. They are used as a surrogate to assist management identify surplus harvest opportunities. N/O: None observed. N/I: Not inspected. A/P: Adults present. 31

32 Area 3 Area 3 Sub-district Map 32
33 Area 3 First Nations Fishery There are three First Nations groups that fish for Food, Social and Ceremonial purposes in Area 3 or the Nass River. These are: a) Lax Kw alaams (Port Simpson). b) The Nisga a Lisims Government - Kincolith, Greenville, Canyon City and Aiyansh. c) The Gitanyow - Member band Kitwancool. (Nass River Harvest) 2012 FSC Catch Summary FSC CATCHES 2012 Sockeye Coho Pink Chum Chinook Steelhead SKEENA Lower Mid Upper Total NASS Catch numbers are preliminary and incomplete as of Nov 30, Please See Nass River Salmon Stock Assessment Update below for Nisga a FSC Nass River Salmon Stock Assessment Update from Nisga a Lisims Government Monday 26 November Attached is the final public Nass River salmon stock assessment update for 2012 (pdf format) from the Nisga a Fisheries and Wildlife Department of Nisga a Lisims Government. Sayt K'il'im Goot one heart, one path, one nation. All data presented in this update are preliminary and subject to change with further assessment information and analyses. Please review final program summary reports prepared by Nisga a Fisheries for final numbers. DAILY FISHWHEEL CATCHES AND ESCAPEMENT ESTIMATES FROM THE NISGA A FISHERIES AND WILDLIFE DEPARTMENT ARE AVAILABLE AT THE FOLLOWING 33
34 LINK (It is recommended to refresh link (F5) each time & copy files to your machine before opening): ftp://ftp.lgl.com/nass%20stock%20assessment%20updates/ NISGA A FISHERIES PRELIMINARY SALMON & STEELHEAD ASSESSMENT PROGRAM POST-SEASON UPDATE FOR 2012: GITWINKSIHLKW (GW) FISHWHEELS (NASS TEST FISHERY - 19TH YEAR STARTED IN 1994): The Nass River test fishery fishwheels (FW#1 and FW#2) operated between 31 May and 15 September 2012 for tagging and historical catch index assessments for salmon and summer-run Steelhead. All fish caught in the GW fishwheels were released alive after tagging and/or counting. The 2012 water levels were ideal for most of the season with high catchability conditions during the salmon and steelhead runs. The water levels averaged 2.7 m and ranged between 0.6 m (12 September) and 6.1 m (25 June). Water temperatures averaged 8 o C and ranged between 5 o C (31 May) and 10 o C (mid-to-late August). A chart is provided in the attachment for reference. GREASE HARBOUR (GH) FISHWHEELS: Three fishwheels (FW 3, FW5, and FW6) operated between 8 June and 13 September 2012 at Grease Harbour (upstream of Ts'im Anwiihlist) for in-season mark-recapture tag recoveries and abundance estimates, and additional tagging (adult Chinook, Chum and Pacific lamprey). All fish caught in the GH fishwheels were released alive after any tagging and/or counting. NASS FISHWHEEL CATCH SUMMARY (31 May to 15 September 2012): The 2012 Nass fishwheel catches were above average for large adult Sockeye (62,385), Coho (15,608), Summer-run Steelhead (1,525), and Pacific Lamprey (674), and below average for Chinook (4,059), even year Pink (7,649), and Chum salmon (106) when compared to the mean catches from 1994 to 2011 (Table 1). The 2012 fishwheel catches of small (jacks) salmon (<50 cm NFL for Chinook, <45 cm NFL for Sockeye, and <40 cm NFL for Coho) were above average for Chinook (1,150 vs. 560), and below average for Sockeye (2,735 vs. 3,375) and Coho salmon (225 vs. 510) when compared to the mean catches from 1994 to Charts showing catches and number tagged are provided in the attachment for reference. Other fishwheel catches in 2012 included: 424 Dolly Varden, 180 Northern Pike Minnow, 129 Peamouth Chubb, 108 Whitefish, 59 Cutthroat, 45 Rainbow, 27 Sucker, 22 Sculpin, 8 River Lamprey, 4 Red-side Shiner, 68 salmon smolts (30 Chinook, 35 Coho and 3 Sockeye), 2 seals, 1 beaver, and 1 frog. Of the non-salmon fishwheel catches, Pacific Lamprey, Dolly Varden, Pike Minnow, and Peamouth Chub species were all above average when compared to the mean catches from 1994 to Table 1. Nass fishwheels catches of salmon and non-salmon species from
35 Chinook salmon ( 50 cm FL) Sockeye salmon ( 45 cm FL) Coho salmon ( 40 cm FL) Summerrun Steelhead ( 50 cm Total Dolly Cutthroat Rainbow Peamouth # of Start End Effort Pink Chum ( 20 ( 20 cm ( 20 cm White Pacific Pike Red-side Longfin Year Fw date date (days) salmon salmon FL) cm FL) FL) FL) Fish Lamprey Minnow Chub Suckers Sculpins Shiner Smelts Jun 7-Sep 92 2,667 24,746 6,990 12, Jun 4-Sep ,090 1,837 8, May 22-Sep 116 2,191 23,063 4,029 23, May 2-Sep 104 3,736 27,762 1,438 13, Jun 20-Sep 100 3,071 17,185 3,760 10, Jun 30-Sep 115 3,476 41,545 6,393 22, , Jun 18-Sep 99 5,003 33,879 8,529 10, , Jun 14-Sep 99 12,106 32,821 22,705 42, , Jun 9-Sep 81 6,785 58,728 14,556 15, , Jun 5-Sep 83 5,802 47,556 9,460 33, Jun 10-Sep 91 3,314 43,782 11,788 35, , Jun 16-Sep 102 4,111 40,320 14,508 19, Jun 3-Sep 87 9,089 50,769 9,671 2, Jun 20-Sep 98 9,440 38,942 11,638 17, Jun 6-Sep 93 4,331 34,702 14,640 1, Jun 12-Sep 103 7,136 43,426 20,270 42, , Jun 22-Sep 113 1,140 25,703 12,938 4, , Jun 17-Sep 108 1,795 38,083 5,752 10, Jun 15-Sep 106 4,059 62,385 15,608 7, , to current: Even Yr: Mean 5 6-Jun 13-Sep 93 4,784 35,783 10,050 13, Min 4 21-May 2-Sep , , Max 6 20-Jun 30-Sep ,106 58,728 22,705 35, ,688 1, , MEZIADIN FISHWAY COUNTS (1 July to 4 October 2012): The Meziadin Fishway counts were conducted from 1 July to 4 October The fishway water levels and temperatures averaged 1.25 m (ranged from 1.07 to 2.20 m) and 13 o C (ranged from 9 o C to 18 o C), respectively. Counts at the fishway in 2012 were below average for large adult Chinook salmon (255 vs. 500), Sockeye (144,923 vs. 163,600), and Summer-run Steelhead (34 versus 40); and above average for Coho salmon (4,980 vs. 4,300) when compared to mean counts from 2000 to 2011 (Table 2). Counts of small salmon (jacks) were above average for Chinook (99 vs. 50) and Coho (81 vs. 50), and below average for Sockeye (1,732 vs. 6,000) when compared with mean counts from 2000 to A total of 43 adult Bull Trout (>20 cm NFL) were also counted in Escapement targets for adult large salmon at Meziadin Fishway are approximately: 160,000 Sockeye, 475 Chinook and 3500 Coho. The escapement target for Coho salmon at Meziadin was reached; but not for the other species. Table 2. Counts of large salmon and steelhead at the Meziadin Fishway, 2000 to Meziadin Fishway (~149 km from tagging site): Adult large salmon counted Tags counted Mark rates (%) observed Year Period of Operation Chinook Sockeye Coho Steelhead Chinook Sockeye Coho Steelhead Chinook Sockeye Coho Steelhead June to 13 October ,042 1, , % 2.2% 2.5% 4.3% July to 15 October ,192 5, , % 2.6% 2.9% 12.5% July to 15 October ,442 5, , % 1.8% 1.9% 4.9% July to 10 October ,852 3, , % 2.4% 2.3% 3.3% July to 3 October ,923 4, , % 3.1% 3.7% 20.7% July to 15 October ,751 7, , % 2.7% 3.6% 10.6% July to 12 October ,954 5, , % 3.2% 4.6% 2.6% July to 11 October ,308 2, , % 3.9% 2.7% 7.4% July to 9 October ,396 3, , % 3.3% 4.3% 6.9% July to 6 October ,392 5, , % 2.9% 1.8% 11.1% July to 23 October ,120 4, , % 1.7% 3.1% 8.6% July to 6 October ,524 2, , % 2.5% 1.9% 8.3% July to 4 October ,923 4, , % 4.2% 4.9% 14.7% Average ( ) ,600 4, , % 2.6% 3.0% 10.0% KWINAGEESE WEIR NET UPSTREAM COUNTS (19 July to 11 October 2012): The Kwinageese weir operations started on 19 July after water levels dropped to install the fence. The water levels and temperatures at the weir averaged 0.30 m (ranged from 0.16 m to 0.65 m) and 12 o C (ranged from 6 o C to 19 o C), respectively. The weir was functional during the entire monitored period (i.e., was not topped by high water). Counts were below average for salmon (Chinook, Sockeye and Coho) and above average for Steelhead (Table 3) when compared to the 35
36 average counts between 2002 and A total of 114 adult Bull Trout (>20 cm NFL) were also counted. Three salmon jacks (3 Chinook) were also counted at the weir in A total of 155 adult Coho salmon were counted through the Kwinageese River video weir. It is uncertain how many more Coho would have subsequently passed the weir after operation, therefore this count should be considered a minimum escapement estimate for Three helicopter inspections (17 April, 9 August, and 4 September) of the 2011 blockage site on the lower Kwinageese River were surveyed by the Nisga a Fish and Wildlife Department in The surveys confirmed the concrete structures installed in August 2011 were still in place and functioning well by pooling water at the base of the barrier. Daily counts of fish indicated good passage by the falls in Table 3. Counts of large salmon and steelhead at the Kwinageese Weir, 2002 to Kwinageese Weir (~208 km from tagging site): Adult large salmon counted (net upstream) Tags counted (net upstream) Mark rates (%) observed Year Period of Operation Chinook Sockeye Coho Steelhead Chinook Sockeye Coho Steelhead Chinook Sockeye Coho Steelhead July to 17 October 1,893 5,891 1, % 1.5% 0.6% 3.0% August to 22 October 538 3,186 2, % 1.2% 2.2% 8.2% August to 5 October 410 2,700 1, % 4.6% 3.2% 4.7% July to 15 October % 0.0% 0.0% 12.1% July to 19 October % 0.0% 4.2% 6.4% July to 5 October , % 2.3% 4.4% 0.0% July to 11 October 715 3, % 3.9% 3.2% 9.5% ADJUSTED MEAN COUNT AT KWIN (2002,05,06,11) 1,140 6,730 1, % 2.4% 2.6% 4.0% KWINAGEESE / FRED WRIGHT WATERSHED GROUND SURVEYS for Sockeye salmon were conducted on 31 August, 11 and 12 September and 9 October. Escapement estimates were calculated using a survey life of 14.4 days (± standard deviation of 2.4 days) based on the average of Gingit Creek Sockeye salmon tag life curve-based survey life estimates since 2004 (n=7); zero count dates were estimated using AUCMonteMaster2.04. Combining the AUC escapement estimates for Upper Kwinageese River (3,090; 90% CIs 2,504-4,055) and Bonney Creek (370; 90% CIs ) resulted in an overall Sockeye salmon escapement estimate of 3,460 for the Kwinageese Fred Wright System. This estimate was similar to the preliminary video weir count on the upper Kwinageese River (3,688). We recommend that the weir count (when finalized) be used as the final Sockeye salmon escapement estimate for the Kwinageese/Fred Wright system. Chinook salmon carcass surveys were conducted in the Kwinageese River downstream of Fred Wright Lake on 4, 10, and 15 September. Seven tagged carcasses were recovered from a total of 29 examined. Live Chinook counts were conducted on 4 September from Fred Wright Lake to Second Lake and from Second Lake to the old weir site. A total of 580 live adult Chinook salmon and 3 carcasses were counted on 4 September. Expanding for observer efficiency this gives a total peak count estimate of 719 adult Chinook salmon for the Kwinageese River. This estimate was very similar to the net upstream Chinook count through the Kwinageese video weir (718). We recommend that the weir count be used as the final Chinook salmon escapement estimate for the Kwinageese/Fred Wright system in LOWER NASS SOCKEYE SURVEYS were conducted at Gingit Creek (a sea-type Sockeye stock) on 19 and 26 July; 2, 9, 16, 23 & 30 August; and 5 and 14 September by a crew of 2 or 3 walking upstream from the old road crossing at 55 o N, 129 o W to the head pond at 55 o N, 129 o W. Along with live adults, jacks and carcasses; reach and tag colour specific counts of live tagged fish, tagged carcasses, and 2012 tags found on the bank or streambed were also recorded. For escapement calculation it was assumed that spawning occurs in an additional 1000 m of habitat downstream of the 3,550 m survey area at an density 1/3 of that in the survey area. Survey life for Gingit Creek Sockeye in 2012 (11.5 days) was estimated using a tag life curve for spaghetti tags applied at the Gitwinksihlkw fishwheels and observed during visual surveys. Survey life was modelled as varying normally with a standard deviation of 2.4 days (this is the standard deviation of the tag life curve based survey life estimates since 2004; n 36
37 = 7). An estimate of jack Sockeye escapement was also generated assuming the same observer efficiency and survey life parameters as used for adult Sockeye. Escapement estimates of 7,499 (90% CIs 5,289-11,636) adults and 1,377 (90% CIs ) jacks were calculated for The peak estimated (observer efficiency expanded) live count (2,855) occurred on 23 August; the peak carcass count (466) also occurred on 22 August. The escapement estimate for 2012 is the second highest since Nisga a Fisheries began escapement surveys in 2000 and is above the average (mean=4,000, range: 400 (2002) to 11,837 (2011)). Sockeye salmon were also observed in 2012 during surveys of the Tseax Side Channel to enumerate Chum and Pink salmon (see below). It is likely that these were also sea-type Sockeye similar to the Gingit Creek population. Adult Sockeye salmon were observed on all Tseax Side Channel surveys and an escapement estimate of 94 (90% CIs ) spawners was calculated for During a single survey of Gitzyon Creek on 27 August, 24 live adult, one live jack and one Sockeye salmon carcass were counted. One live fish was tagged and an additional Sockeye spaghetti tag was found on the bank. This suggests that some sea-type Sockeye salmon also spawn in Gitzyon Creek. DAMDOCHAX WATERSHED SURVEYS were conducted by air and ground on 4, 10, and 15 September. A total of 33 tagged Chinook were recovered from 125 adult Chinook carcasses examined downstream of the lake. Raw live counts were expanded for habitat not surveyed and reach and survey specific estimates of observer efficiency. A preliminary escapement estimate of 851 Chinook salmon was calculated using a 27.8 day survey life (Koski et al. 1996) and estimated 0 count dates of 4 August and 30 September. Due to the very long survey life used, this escapement estimate was almost identical to the observer efficiency expanded peak count (828) plus dead count (20) on 4 September (total 848). The similarity between peak counts and the weir and AUC estimates for Kwinageese River and Damdochax River respectively in 2012 suggest that in future years a well timed peak count, expanded for observer efficiency, may be an adequate escapement estimate for these systems. We recommend that the AUC estimate of 851 (90% CIs 716-1,040) adult Chinook salmon be used as the preliminary escapement estimate for Damdochax River in Aerial Sockeye salmon counts of Wimnasik Creek between Wimnasik Lake and Damdochax Lake were conducted on 4 and 15 September. Raw live counts were expanded by the helicopter observer efficiency expansion factor (1.95 x) developed in 2011 using same day helicopter and ground counts at Upper Kwinageese Creek. The number of spawners on 9 October was estimated from the number of spawners on 4 September and the ratio of the 9 October count to the peak count on the Upper Kwinageese River (5%) in A preliminary escapement estimate of 2,902 (90% CIs 1,963-4,502) Sockeye salmon was calculated using a survey life of 14.4 days (± standard deviation of 2.4 days) based on the average of Gingit Creek Sockeye salmon tag life curve based survey life estimates since 2004 (n=7); zero count dates were estimated using the MonteMaster AUC program. Adult Sockeye salmon were also counted in Damdochax River downstream of Damdochax Lake during Chinook salmon surveys. Counts, expanded for observer efficiency, were 202 on 4 September, 347 on 10 September and 152 on 16 September. The majority of these fish were observed in a pool created by a new (since 2011) landslide upstream of Sansixmor Creek. These fish may have been enroute to primary spawning areas in Wimnasik Creek so no attempt was made to calculate an escapement estimate. UPPER NASS NON-MEZIADIN SOCKEYE AERIAL RECONNAISSANCE SURVEYS were conducted on 15 September The goal of these surveys was to locate possible previously undetected spawning populations of Sockeye salmon in Upper Nass tributaries. An aerial survey of Vile Creek from the mouth to the headwaters was conducted to look for possible river-type 37
38 Sockeye spawning. Despite large quantities of excellent spawning habitat only 2 salmon were observed (likely Chinook). The lower reaches of Sanskisoot Creek (Tributary at river left just upstream of Kwinageese River) were surveyed from the air to assess if a small tributary entering the creek at river right, and draining two small lakes, was passable to salmon and represented possible Sockeye spawning habitat. The tributary was tiny and apparently impassable and no Sockeye were observed. Sanyam Creek (river right tributary between Sanskisoot and Kwinageese) was surveyed from the air to confirm the presence of an impassable obstruction that would prevent access to small lakes upstream. This system is clearly impassable. Shanalope Creek was surveyed from its confluence with Kwinageese River to a large wetland contained by a northerly bend of the creek. The connection between Moonlight Lake and Shanalope Creek was determined to be impassable under normal flow conditions (very tiny stream). No Sockeye were observed. A small non-gazetted system upstream of the Meziadin confluence at river left was surveyed from the air. This was a very small, tannin stained system with very low flow velocities. This system could be an excellent Coho producing system late in the season but is unlikely to support Sockeye. The system that was flown was not the system that was intended to be surveyed (this system is slightly further upstream); however, based on gradient and drainage size it is likely that the two systems are very similar. LOWER NASS CHUM AND PINK GROUND SURVEYS were conducted between 6 August and 25 September For AUC escapement estimation Chum salmon survey life was assumed to be 7 days with a standard deviation of 3 days. The standard deviation estimate was based on the coefficient of variation for Chum salmon survey life (0.42) reported in Perrin and Irvine (1990) multiplied by our estimated survey life of 7 days. Survey life for Pink Salmon was assumed to be 12.6 days and vary normally with a standard deviation of 4 days. These values are based on an average of 7 BC Central Coast streams reported in Perrin and Irvine (1990). Eight surveys were conducted on Ksemamaith Creek in 2012 with Chum salmon counted on four (13, 20, and 27 August and 3 September). AUC escapement estimates were 32 Chum salmon (90% CIs 19-97) and 1,723 Pink salmon (90% CIs ). Seven surveys were conducted on a groundwater-fed tributary of the Tseax Slough (locally known as the Tseax second mouth) with Chum salmon counted on all surveys (13, 20 & 27 August; and 3, 13, 18 & 25 September). AUC escapement estimates were 143 Chum salmon (90% CIs ) and 187 Pink salmon (90% CIs ). Three surveys were conducted on Kincolith River (28 August and 9, 21 September) yielding an AUC escapement estimate of 7,546 Pink salmon (90% CIs 4,707-16,102). Only one live Chum salmon was observed during Kincolith surveys. Exploratory surveys were also conducted on Zolzap Creek, Gitzyon Creek, Vetter Creek sloughs, Georgie River, Belle Bay Creek, Donahue Creek, Walt Creek and Roberson Creek. Survey effort was not adequate to generate escapement estimates; however, Pink and Chum salmon were counted in all surveyed systems. A Chum salmon escapement estimate was calculated for Zolzap Creek by expanding the weir count (see below) by 40% to account for fish spawning downstream of the weir or entering the creek prior to weir installation. This yields escapement estimates of 3 Chum salmon for Zolzap Creek in A Pink salmon escapement estimate was calculated for Zolzap Creek by expanding the weir count by 40% to account for fish spawning downstream of the weir and adding the estimated peak count prior to weir installation on 27 August (300 fish). This yields an escapement estimate of 490 Pink salmon for Zolzap Creek in Most Sockeye salmon would have entered Zolzap Creek prior to weir installation so no escapement estimate can be calculated. ZOLZAP CREEK ADULT COHO FENCE operated from 6 September to 8 November to enumerate coded wire tagged and unmarked adult Coho salmon and to apply marks to facilitate a mark-recapture escapement estimate for Zolzap Creek. The fence was fish tight through the entire period and was never over-topped by high water. Total upstream adult counts at the Zolzap 38
39 fence were 162 CWT Coho, 678 unmarked Coho, 2 Chum, 114 Pink, 1 Sockeye salmon, and 6 Dolly Varden. Of the 843 adult Coho handled at the fence, 832 were marked with a left operculum punch and a cinch up vinyl tag. A 114 Coho with intact heads were recovered upstream of the fence by angling, dip netting, or as carcasses. Of these 96 (84%) had been marked at the fence. Based on these data and accounting for an estimated 10% tagging related mortality, a preliminary mark recapture escapement estimate of 888 Coho salmon was calculated for Zolzap Creek in 2012; this is below the average for this system from previous years of weir operation ( ; 1,536). Due to the high proportion of fish recaptured upstream of the fence (>10%) the uncertainty around this estimate is low (CV=10%). We recommend that when finalized this mark-recapture estimate be considered the final escapement estimate for Zolzap Creek Coho salmon in A juvenile fence was also operated in 2012 (23 April to 10 June) where 45,407 Coho smolts were CWT. LOWER NASS COHO GROUND SURVEYS were conducted in 2012 on the following systems: Zolzap Creek: Seven spawning ground surveys were conducted at the time of this report (30 September 10, 18, 20, 30 October; 8, 14 November), live Coho were observed on only four of these surveys (18, 20, 30 October and 8 November) and the peak count, expanded for observer efficiency, was only 44 fish. It was not possible to calculate an AUC escapement estimate given the small numbers of fish counted. When compared to the preliminary mark recapture escapement estimate of 888 Coho Salmon these results call into question the utility of AUC escapement estimation in Zolzap Creek on small return years. Only the shallow spawning reaches of Zolzap Creek are feasible to survey, and at very low spawner densities, predation likely dramatically reduces survey life and limits the utility of visual surveys. Ansedegan Creek: Six surveys were conducted at the time of this report (30 September; 10, 20 & 30 October; and 8 & 14 November); live Coho were observed on all but the September survey. The peak count to date was 233 adult Coho salmon on 20 October. A preliminary AUC escapement estimate of 408 Coho salmon (90% CIs ) was calculated using a survey life of 19 ± 3 days and running 1000 iterations in AUCmonteMASTER2.04. This is close to the average for this system (452). Diskangieq Creek: Seven surveys have been conducted to date (1, 5, 11, 21 & 31 October; and 9 & 15 November); live Coho were observed on all but the first survey. The peak count as of this report was 1,743 adult Coho on 21 October. A preliminary AUC escapement estimate of 1,946 Coho salmon (90% CIs 1,726-2,169) was calculated using a survey life of 19 ± 3 days and running 1000 iterations in AUCmonteMASTER2.04. This is close to the average for this system (2,192). Final lower Nass Coho salmon surveys will be conducted in late November and early December Overall the results of the Zolzap adult Coho salmon fence and Lower Nass tributary surveys indicate an average Coho return to lower Nass streams in PRELIMINARY NASS RUN SIZE ESTIMATES TO GITWINKSIHLKW AND NET ESCAPEMENT ESTIMATES FOR 2012: Preliminary post-season aggregate estimates for Upper Nass salmon and summer-run Steelhead returns in 2012 (Table 4) were calculated from current mark-recapture data (Table 5). Preliminary post-season aggregate run size estimates to Gitwinksihlkw fishwheels in 2012 to date are: ~254,000 Sockeye, ~11,000 Chinook, ~69,000 Coho, and ~12,000 summer-run Steelhead. Based on the 2012 preliminary results, system-wide Upper Nass net escapement goals were not reached for Chinook; but were reached for Sockeye, Coho and Steelhead. The in-season Sockeye 39
40 salmon estimate was ~6% lower than the post-season estimate. The in-season population estimates were higher than the post-season estimates for both Upper Nass Chinook (~52%) and Coho (~46%) indicating that the fishwheels were more efficient in capturing each species than estimated during the season with the ideal water levels experienced in The 2012 preliminary post-season estimates of net escapement for Lower Nass and Coastal Pink, Chum, Pink and Coho salmon were calculated according to methods developed by the Nisga a-canada- BC Joint technical committee (NCBJTC). These estimates are included in the net escapement estimates shown in Table 4. Based on these preliminary results, escapement goals were reached for Nass Area Pink and Coho salmon; but not for Chinook or Chum salmon. Salmon escapement in 2012 was below the average for all species. Table 4. Preliminary estimates of GW run size and net escapement for Nass salmon and summer-run Steelhead, R un Size Estima te to GW Net Escapement (Coastal, Lower, Middle and Upper Nass) Ye a r Socke ye Pink Chinook Coho Chum Ste e lhe a d Socke ye Pink Chinook Coho Chum Ste e lhe a d ,584 UNK 21,617 72,175 UNK 13, , ,629 19, ,358 22,737 13, ,033 UNK 34,703 89,536 UNK 11, , ,319 32, ,768 37,204 11, ,083 UNK 16, ,829 UNK 14, , ,561 17, ,515 18,115 14, ,916 UNK 29,462 77,574 UNK 14, ,688 1,072,921 28, ,021 79,255 13, ,712 UNK 17,984 60,106 UNK 4, ,857 1,314,520 17,670 72,937 60,663 4, ,916 UNK 16,764 99,906 UNK 7, ,559 1,345,191 16, ,828 36,957 7, ,338 UNK 28,618 54,730 UNK 4, , ,758 28,577 77,079 63,304 4, ,238 UNK 27,173 55,944 UNK 5, , ,324 27, ,884 13,508 5, ,222 UNK 21,687 84,817 UNK 11, , ,498 21, ,040 3,749 11, ,235 UNK 30, ,681 UNK 22, , ,405 27, ,660 24,852 22, ,722 UNK 20,706 92,134 UNK 19, , ,430 19, ,241 10,490 19, ,636 UNK 11,554 74,108 UNK 17, , ,280 10,263 85,910 8,605 17, ,217 UNK 10,926 69,383 UNK 11, , ,033 9, ,522 13,316 11,545 Mean ,000 23,000 94,000 12, , ,000 22, ,000 32,000 12,000 Targets 200, ,000 15,000 60,000 45,000 10,000 The preliminary Upper Nass escapement estimates for salmon and summer-run Steelhead to Gitwinksihlkw in 2012 were based on the information presented in Table 5. The preliminary adult summer-run Steelhead estimate is based on a mark-recapture estimate versus the fishwheel catch index method based on a more accurate estimate of the method (i.e., lower CV%). The fishwheel catch index method involves an expansion of the adult Steelhead catches at GW fishwheels after 1 July by post-season Coho salmon mark rates with adjustments to GW operational effort and mean difference in method to mark-recapture techniques. Table 5. Mark-recapture estimates for Nass salmon (Chinook, Sockeye and Coho) and summer-run Steelhead returns to Gitwinksihlkw and spawning grounds, Best estimates are bolded. Net marks available (M*) Marks Population recovered Estimate to (R) GW (N) SE CV% Net escapement estimate Species Marked (M) Censored % marks removed Examined (C) Chinook-stratified by size 3, % 2,549 1, , % 8,771 Chinook-pooled 3, % 2,549 1, , % 9,017 Sockeye 13,106 3,315 25% 9, ,923 6, ,217 2, % 217,845 Coho 4,450 1,382 31% 3,068 5, ,383 3, % 62,320 Steelhead (fin marks) 1, % 1, ,838 1, % 11,545 Steelhead (Coho MR index) 10,937 2, % 10,644 % marks removed are associated with initial handling/capture induced mortality, primary tag loss if applicable, and selective removal in fisheries below Grease Harbour. 40
41 PRELIMINARY HARVEST ESTIMATES FOR ADULT NASS SALMON & STEELHEAD ALASKAN FISHERIES IN SE ALASKA (information courtesy from ADFG s website): Alaskan gillnet fisheries in Districts 101 (Tree Point) and 106 (Sumner and Upper Clarence) started on 17 June and 16 June, respectively. Alaskan seine fisheries start dates: Districts 101 (Lower Clarence/Revilla) on 1 July, 102 (Middle Clarence) on 17 June, 103 (Cordova) on 22 July, and 104 (Noyes/Dall) on 1 July. The table below shows the catches of salmon in Alaskan net fisheries in Districts (and mean catch comparisons between 2000 and 2011) to week ending 22 September based on data from ADFG s website. District net catches were above average for Pink, Chum and Coho salmon; and below average for Sockeye and Chinook for Of the total in-season Sockeye catch reported in Alaskan fisheries (220,000), approximately 63,000 (29%) are estimated as Nass origin based on mean stock composition estimates from 1982 to The average total mean harvest of Nass Sockeye in Alaskan fisheries from 2000 to 2009 is 159,000. Table 6. In-season salmon catch estimates in Alaskan net fisheries in Districts , IN-SEASON ALASKAN CUM. SALMON CATCH ESTIMATES (ADFG WEBSITE) WEEK END: 22-Sep-12 SOCK AVG (00- CHIN AVG (00- PINK AVG EVE CHUM AVG (00- COHO AVG (00- DISTRICTS AREA CATCH 11) CATCH 11) CATCH (00-11) CATCH 11) CATCH 11) DIST 101 GN TREE PT 51,000 83,000 1,100 1, , , , ,000 53,600 41,600 DIST 106 GN UPP. CLAR 43, ,000 1,500 1, , , , , , ,600 DIST 101 SN LOW CLAR 16,000 64, ,732,000 4,687, , ,000 46,300 36,800 DIST 102 SN MID CLAR. 44,000 34, ,985,000 2,912,300 1,235, ,000 81,600 47,500 DIST 103 SN CORDOVA 3,000 28, ,010,000 2,247,000 37, ,000 14,000 31,000 DIST 104 SN NOYES/DALL 63, ,000 2,800 6,800 5,231,000 2,101, , ,000 82,200 62,500 CUMULATIVE TOTAL 220, ,500 6,300 11,850 14,286,810 12,491,400 2,087,000 1,473, , ,000 CANADIAN COMMERCIAL HARVEST DATA: IN-SEASON AREA 3 GILLNET AND SEINE CATCH DATA (information courtesy from DFO Prince Rupert): DFO commercial net fishery openings in Area 3 for 2012 were: 10 gillnet and 8 seine. Commercial net harvest and release data for salmon and Steelhead caught in Area 3 are shown below. Net fisheries in Area 3 were closed after 7 August. Table 7. In-season salmon and steelhead catch estimates in DFO net fisheries in Area 3,
42 GEAR DATE Vessels SO-harv SO-Rel CO-HARV CO-Rel PK-HARV PK-Rel Chum-harv Chum-Rel CH-harv CH-Rel STEEL-Rel GN 6/19/ , /25/ , /26/ , /2/ , /3/ , /5/ , , /6/ , , /11/ , , /28/ , , /29/ , GN Total 1, , ,212 38, ,195 2, SN 7/9/ /10/ , /16/ , /17/ , /30/ , , /31/ , , /6/ , , /7/ , SN Total 165 5,358 2, , , ,993 10, Grand Total 1, ,565 2, , , ,188 13, ,351 LABELS: SO=SOCKEYE, PK=PINK, CO=COHO, CH=CHINOOK; STEEL=STEELHEAD, HARV=HARVESTED, 451 AND REL=RELEASED. PRELIMINARY POST-SEASON AREA 3 NET AND TROLL CATCH ESTIMATES FOR NASS SALMON STOCKS: Preliminary harvest estimates of Nass salmon in Areas 1-5 commercial fisheries for 2012 are approximately: 113,000 Sockeye, 59,000 Pink, 800 Chinook, 23,000 Coho and 2,200 Chum based on commercial catch data from DFO Prince Rupert and methods developed by the NCBJTC. Total harvest estimates below for Nass salmon are in all Canadian fisheries including First Nation and recreational fisheries. Table 8. Preliminary post--season Nass salmon harvest estimates in commercial and all fisheries, COMMERCIAL (NET & T ROLL) HARVEST T OT ALS (ALL FISHERIES) Year Sockeye Pink Chinook Coho Chum Sockeye PinkChinook Coho Chum ,022 78,162 1,826 2,367 7, ,098 84,248 13,424 6,066 9, , , ,478 5, , ,041 15,642 29,412 6, , ,820 5,980 11,886 3, , ,863 13,548 25,393 4, , ,333 6,076 24,836 14, , ,282 15,323 44,438 14, , ,506 6,689 35,694 10, , ,034 15,322 60,615 11, , ,649 3,115 29,873 2, , ,168 11,624 50,866 3, ,650 33,264 4,513 9,870 14, ,131 37,017 14,513 22,904 15, , ,752 4,031 18,748 1, , ,911 14,107 32,801 2, ,975 3, , ,825 7,585 7,946 15, ,572 65,065 1,123 19,143 2, ,190 89,637 9,318 40,795 2, ,079 4, ,807 1, ,043 7,275 6,437 30,326 1, ,691 13,374 1,204 21, ,230 59,093 7,358 28, ,420 59, ,867 2, ,477 79,511 5,271 37,443 2,529 Mean , ,000 3,000 17,000 5, , ,000 12,000 32,000 6,000 RECREATIONAL CATCH ESTIMATES: Preliminary harvest estimates of Nass salmon in recreational fisheries for 2012 are approximately: ~900 Chinook, and ~2,500 Coho based on 42
43 preliminary data from DFO Prince Rupert and methods developed by the NCBJTC (Table 9). Inriver recreational catches were monitored by Nisga a Fisheries at two systems in 2012 including: Kincolith (~20 Chinook kept) and Tseax (~200 Chinook and 60 Coho kept) from July to end of September. These system estimates combined with a historical harvest rate method were used to generate Lower Nass and Upper Nass in-river harvests for Nass Chinook (550) and Coho (160) salmon in Table 9. Table 9. Preliminary post--season Nass salmon harvest estimates in recreational fisheries, In-river Recreational Catch Tidal Recreational Catch Total Recreational Catch Year Sock. Pink Chin. Coho Chum Sock. Pink Chin. Coho Chum Sock. Pink Chin. Coho Chum UNK 1, UNK UNK UNK 986 1,376 UNK 15 UNK 2,223 1,651 UNK UNK 1, UNK UNK UNK 1,705 7,418 UNK 3 UNK 2,755 7,829 UNK UNK UNK UNK UNK 1,116 4,125 UNK 25 UNK 1,986 4,465 UNK 2003 UNK UNK 1, UNK UNK UNK 1,167 4,495 UNK UNK UNK 2,357 4,652 UNK 2004 UNK UNK UNK UNK UNK 1,925 4,370 UNK UNK UNK 2,855 4,541 UNK 2005 UNK UNK UNK UNK UNK 1,542 4,844 UNK UNK UNK 2,315 5,306 UNK 2006 UNK UNK 1, UNK UNK UNK 983 4,147 UNK UNK UNK 2,294 4,217 UNK 2007 UNK UNK 1, UNK UNK UNK 1,810 3,945 UNK UNK UNK 3,328 4,411 UNK 2008 UNK UNK 1, UNK UNK UNK 1,620 5,102 UNK UNK UNK 2,937 5,250 UNK 2009 UNK UNK 1,296 1,600 UNK UNK UNK 1,316 5,931 UNK UNK UNK 2,612 7,531 UNK UNK UNK UNK UNK 399 3,822 UNK 119 UNK 946 4,034 UNK UNK UNK UNK UNK 898 4,789 UNK 7 UNK 1,467 5,008 UNK U NK UNK UNK UNK 273 2,145 UNK 0 UNK 823 2,307 UNK Mean , ,300 4, ,300 4,900 GITANYOW HARVEST ESTIMATES: Preliminary harvest estimates of Nass salmon in Gitanyow fisheries in the Upper Nass River were reported by the Gitanyow Fisheries Authority to week ending 8 September as: 14,298 adult Sockeye (381 tags recovered), 111 adult Chinook (105 large (13 tags) and 6 small), and 187 adult Coho (2 tags recovered). The total adult Sockeye harvested includes a commercial harvest of Sockeye (4,573) below the Meziadin Fishway as part of DFO s Inland Demonstration Economic Fishery that occurred between 14 August and 25 August Harvests in 2012 were above average for Sockeye (14,298 vs. 6,000), below average for Coho (187 vs. 200) and large Chinook (105 vs. 200) based on mean harvests from 2000 to NISGA A NATION CATCH ESTIMATES: Table 10 shows preliminary harvest estimates of Nass salmon and Steelhead in Nisga a fisheries in Total harvests were: 68,759 Sockeye, 3,547 Chinook, 12,082 Coho, 20,224 Pink, 316 Chum salmon and 851 Steelhead (includes winter-run catches in May and summer-run catches from June to August). Table 10. Preliminary Nisga a salmon and steelhead harvests, Gityanow Ye a r Sock. Pink Chin. Coho Chum , , , , , , , , , , , , , Mean ,
44 NISGA'A TOTAL HARVEST SUMMARY MARINE SALE FISHERY TOTAL IN-RIVER SALE FISHERY TOTAL INDIVIDUAL SALE (IS) FISHERY TOTAL COMMUNAL SALE FISHERY [GH FISHWHEELS] COMMUNAL SALE FISHERY [SEINE] DOMESTIC (FSC) FISHERY - FINAL DRAFT GRAND TOTAL SOCK CHIN COHO PINK-EVE CHUM 14, ,724 CLOSED 30, ,695 0 CLOSED 44, ,935 3,724 CLOSED CLOSED CLOSED CLOSED CLOSED CLOSED CLOSED CLOSED ,027 CLOSED 24,564 2,772 2,470 1, ,759 3,547 12,082 20, STEEL CLOSED CLOSED CLOSED CLOSED CLOSED The 2012 domestic FSC salmon fishery was monitored from 1 May to 1 September as part of the Nisga a Fisheries salmon and steelhead catch monitoring program. Incidental salmon and Steelhead catches after August, plus an estimate of Steelhead release mortalities in the Coho IS net fisheries, were added from the non-salmon catch and recreational catch monitoring programs. Nisga a individual sale fisheries were conducted between 21 June and 17 August Domestic harvesting continued after the closure on 17 August. A total of 203 permits were registered for the sale fisheries in 2012 and 145 permits sold fish. A total of five marine (21 June, 8 July, 9 July, 22 July, and 23 July) and eight in-river (July 3, 5, 9, 29, 31; August 13, 15, and 17) individual sale fisheries were conducted in Total catches in the IS fisheries were: 44,195 Sockeye, 775 Chinook, 8,935 Coho, and 3,724 Pink salmon. Selective harvesting of Nass Area Pink and Coho salmon were harvested in Area 3 by a Nisga a seiner between 2 August and 17 August. A total of 15,027 Pink and 1,473 Coho salmon were harvested in Seine releases included: 494 Chum, 37 Chinook salmon, and 80 Steelhead. Preliminary Nisga a entitlements for 2012 were below average for Sockeye, Pink, Chinook, and Chum, and average for Coho salmon based on mean entitlements from (Table 11). Note that there are currently no defined entitlement for Steelhead (winter or summer-run); but domestic harvests are permitted. Preliminary Nisga a harvests in 2012 were below average for Sockeye, Chinook, and Chum salmon; and above average for Steelhead, Pink and Coho salmon based on mean catches from 2000 to Nisga a catch estimates for Steelhead not only include summer-run stocks caught from late June onward but also winter/spring run stocks caught in May and June. The Nisga a entitlement estimates for 2012 shown below are based on preliminary data to date and include entitlement adjustments from any Canadian over harvests as calculated from the Nisga a Final Agreement. The Nisga a entitlements shown in Table 11 for Sockeye, Chinook, Coho, and Chum salmon do not account for any underages or overages cumulated from Table 11. Preliminary Nisga a entitlement and harvest summary for Nass salmon and Steelhead,
45 Nisga'a Entitlement Nisga'a Harvests Ye a r Sock. Pink Chin. Coho Chum Sock. Pink Chin. Coho Chum Ste e l ,853 28,033 7,031 9,072 12,601 93,177 6,086 9,326 1,950 1, , ,952 10,421 14,977 7,071 77,183 79,378 11,764 14,706 1, ,288 53,031 6,489 19,200 9, ,666 2,043 5,431 9, , ,090 9,198 13,637 7, ,861 18,949 6,709 14, , ,943 6,928 10,684 5, ,241 10,528 5,548 20,336 1, , ,964 5,940 15,816 3, ,345 4,519 6,015 14, ,590 21,121 9,049 7,999 6,285 88,021 3,753 7,250 8,425 1, , ,845 8,798 10, ,863 6,159 6,724 9, ,754 3,213 6,160 9, ,444 4,372 4,450 3, , ,977 7,798 19,200 2,917 69,446 24,572 5,435 13, ,488 39,567 5,520 13, ,691 2,493 4,581 10, ,029 13,374 6,474 9, ,441 45,719 4,584 2, ,710 64,047 4,901 12, ,759 20,224 3,547 12, Mean , ,000 7,000 13,000 4,700 91,000 17,000 6,000 10,000 1, PRELIMINARY NASS SALMON TOTAL RETURN TO CANADA (TRTC) ESTIMATES: The preliminary TRTC estimates used by the Nisga a Fisheries and Wildlife Department for tracking Nisga a salmon entitlements for 2012 are: 414,000 Sockeye, 15,000 Chinook, 162,000 Coho, 630,000 Pink, and 16,000 Chum. The preliminary TRTC salmon estimates were higher than the pre-season estimates for Sockeye (414,000 vs. 373,000), Pink (630,000 vs. 510,000), Chum (16,000 vs. 11,000), and Coho (162,000 vs. 160,000); and below average for Chinook (16,000 vs. 24,000). Nass salmon returns in 2012 were all below average based on mean returns from 2000 to Charts of the 2012 TRTC, escapement, and Nisga a catch compared to past years are provided in the attachment that follows this summary. Table 11. Preliminary Total Return to Canada and Net Escapement estimates for Nass salmon, Total Return To Canada (TRTC) Net Escapement Ye a r Sock. Pink Chin. Coho Chum Sock. Pink Chin. Coho Chum , ,878 32, ,424 31, , ,629 19, ,358 22, ,859 1,233,360 48, ,180 43, , ,319 32, ,768 37, ,278, ,423 30, ,908 22, , ,561 17, ,515 18, ,023,605 1,268,202 43, ,459 93, ,688 1,072,921 28, ,021 79, ,369 1,820,554 32, ,553 71, ,857 1,314,520 17,670 72,937 60, ,590 1,707,359 28, ,694 40, ,559 1,345,191 16, ,828 36, , ,775 43,090 99,983 78, , ,758 28,577 77,079 63, ,855 1,113,235 41, ,685 15, , ,324 27, ,884 13, , ,083 29, ,636 4, , ,498 21, ,040 3, ,090 1,004,043 37, ,455 27, , ,405 27, ,660 24, , ,705 26, ,567 11, , ,430 19, ,241 10, , ,373 17, ,880 9, , ,280 10,263 85,910 8, , ,544 15, ,965 15, , ,033 9, ,522 13,316 Mean , ,000 36, ,000 40, , ,000 23, ,000 34,000 Targets Esc. Goal 200, ,000 15,000 60,000 45,000 Special thanks to all of the staff from the Nisga'a Fisheries and Wildlife Department and Nisga'a Lisims Government in 2012 for their dedicated efforts that enabled these updates to be produced and helped achieve the majority of the aggregate escapement goals for Upper Nass salmon and Steelhead returns in Thanks also to the staff from the various governmental and other organizations (DFO (Prince Rupert), BC Fisheries (Smithers), ADFG, LGL and GFA) that provided information or supported the in-season tracking of the Nass salmon returns in
46 Richard Alexander, R.P.Bio Nisga a Fisheries Stock Assessment Management Biologist Nisga a Lisims Government - Fisheries & Wildlife Department PO Box 228, New Aiyansh, BC, V0J 1A0 Nisga a Fisheries (website: ) LGL Limited (website: ) ESSR Review No ESSR sockeye opportunities were identified in the Nass River for the 2012 season. Sockeye escapements to the Nass River did not exceed spawning requirements. The Gitanyow did receive a limited economic opportunity to harvest sockeye for sale at Meziadin. All Economic and ESSR Fisheries must be conducted by selective means as a conservation measure to protect weaker non-target species (coho and steelhead). Details of the fisheries were as follows: Nass River Demonstration Fishery In-season calculations, 2012 Both Commercial gillnet and Seine opportunities were realized in Area 3 for 2012 but only area 59 Area C gillnet licenses and 17 Area A seine licenses were utilized for this fishery with an additional 88 Area C industry licenses. As it is only the third year of operation this Fishery was capped pre season at 3000 pieces. The Area 3 marine seine fishery was not managed as an IVQ fishery Inland seine allocations were calculated the same as gillnet but utilizing the Area 3 marine seine catch. With the exception of the 3000 piece cap. Allocations of inland economic opportunities were calculated in the same manner as the Skeena. Example Gillnet and Seine Calculation Day of Week Sunday Monday Tuesday Wednesday Thursday Friday Saturday Week Day 01-Jul 02-Jul 03-Jul 04-Jul 05-Jul 06-Jul 07-Jul Daily Gillnet Marine Effort Daily Gillnet Marine Catch 20,938 13,885 13,033 7,265 Catch per total # of licenses Total Gillnet Catch per Licence 86 Daily Seine Marine Effort Daily Seine Marine Catch Catch per total # of licenses Total Seine Catch per Licence 0 Meziadin River ATP gillnets ATP seines 18 Other gillnets Other seines Start Fishing End Fishing TAC Wk Catch Ttl Catch Remaining Carry Over TAC + CO Meziadin River 1, ,555 1,555 Recreational Fishery Review The tidal water interception salmon sport fishery begins in late April. Initial effort is mostly by local independent anglers out of Prince Rupert, however the most significant portion of the sport fishing season develops late May and continues to mid September. In addition to a significant fleet made up of independent anglers and charter operators, there were lodge operations set up. A tidal water creel survey was conducted in 2012, but the final report is not complete Commercial Net Fishery Review The Area 3 commercial net fishery was planned in anticipation of harvesting a surplus of 166,392 Nass sockeye with a below average pink return while meeting a number of pre-season commitments. These commitments included managing in accordance to the Nisga a Treaty, the Pacific Salmon Treaty, gear and sector allocations, chum, Chinook and Kwinageese sockeye 46
47 rebuilding, and limiting impacts on steelhead. Some of the restrictions put into place to deal with these commitments were, closed areas, daylight only fisheries, non-retention chum and steelhead for both gear types, mandatory brailing for seines, non-retention Chinook for seines and a request for gill nets to release all live Chinook Sockeye escapements to the Kwinageese River have improved as a result to the barrier mitigation work performed by Nisga a Fisheries in However management actions continued in 2012 to reduce harvest impacts on Kwinageese sockeye reducing marine commercial fishing opportunities from July 8 th to July 28th (peak migration timing of Kwinageese sockeye through the commercial fishery based on DNA analysis) in Area 3. The first commercial gill net sockeye opening in Area 3 occurred June 19 with 128 vessels taking part in the fishery. The Wales Island (1 mile boundary), Pearse Island (.5 mile shore boundary) and Emma Pass (the lead waters into the Khutzeymateen Inlet) boundaries were in place until July 2. In the early part of July boundaries were drawn up around the southern portion of Wales Island to allow chum retention while targeting Nass sockeye. (five openings July 2, 3, 5, 6 & 11). Based on thermal mark analysis of otoliths from the Alaska Tree Point gillnet fishery, it is believed that the vast majority of these chum would be of Alaska hatchery origin. The upper portion of Area 3 was also open to gill nets but chum retention was not permitted throughout the whole season and a.5 mile ribbon boundary off of Pearse Island was in place to reduce impacts on chums returning to Area 3. In early July due to low Chinook escapements recorded past the Nisga a fishwheels it was decided in season to go non-retention for the duration of the season. Coho and steelhead were non-retention, non-possession in Area 3 throughout the season. The maximum number of gill nets operating in Area 3 occurred July 11 with a count of 186 gill nets actively fishing. The total number of openings was 10 for 1,375 vessel operating days compared to the 10 year average of 15.8 openings and 3,033 vessel operating days. The first seine opening in Area 3 occurred July 9 with 6 vessels participating in the fishery. Three distinct boundaries were drawn in Area 3 early in the season with separate retention regulations. Boundary descriptions: Wales Island 1 nautical mile ribbon boundary (pink, chum and sockeye retention), Emma Pass boundary (pink and sockeye retention), and Upper Area 3 boundary with 3-7 and 3-12 within a.5 mile ribbon off of Pearse Island (pink and sockeye retention). The effort was low during all four openings with modest catches of pink and chum. The July 16 & 17 openings were closed to sockeye retention throughout Area 3 due to concerns for Kwinageese sockeye. These openings were also the last of the season with a chum retention area around Wales Island as the prevalence of non-hatchery origin chum is believed to increase later in the season. Peak seine effort in Area 3 occurred on July 30 th with 28 boats participating. Sockeye and pink seine catches remained modest throughout the season increasing slightly towards the end of the July and early August. Stream Inspections/reports towards the end of July and early August suggested an average run of pinks limiting seine pink fishing to the first week in August. The total number of openings for 2012 was 8 for 165 vessel operating days compared to the 10 year average of 14.7 openings and vessel operating days. The total Area 3 hailed commercial net catch for 2012 was 118,607 sockeye, 397,767 pink. This compares to the 10 year average catch of 237,174 sockeye and the five even-year average of 542,786 pink. Total commercial chum catch for Area 3 was 40,188 chums. Nisga a Fisheries did a remarkable job in regards to Nass in-river assessment throughout the 2012 season. Fish-wheels were monitored and moved constantly throughout the season to maximize catch rates during fluctuating water conditions. Consistent and detailed updates throughout the season continue to assist in the management of Area 3. 47
48 48
49 49
50 Commercial Troll Fishery Review See Area 1 Commercial Troll Fishery Review 2012 Stream Escapements AREA PRELIMINARY ESCAPEMENT ESTIMATES Last updated November 23, 2012 N/O - NONE OBSERVED, N/I - NOT INSPECTED, DNS - DOES NOT SPAWN IN THIS CREEK, A/P - ADULTS PRESENT, INADEQUATE IFORMATION TO MAKE ESTIMATE Location Stream Name Sockeye Coho Pink Chum Chinook Comments COASTAL BOAT HARBOUR CREEK DNS DNS 1,700 DNS DNS BRUNDIGE CREEK WEST DNS DNS 800 N/I DNS BRUNDIGE CREEK DNS A/P 2400 N/I DNS SANDY BAY CREEK DNS N/I 3,500 N/I DNS STUMAUN CREEK DNS N/I 7000 A/P DNS TRACY BAY #2 CREEK DNS N/I 850 DNS DNS TRACY CREEK DNS A/P 975 N/I DNS WHITLY POINT CREEK DNS DNS 450 DNS DNS NASS RIVER ANSEDAGAN CREEK DNS 408 N/I N/I DNS AUC estimate provided by LGL BROWN BEAR CREEK 6 A/P N/O N/O N/O Sockeye and Coho estimates provided by Gitanyow Fisheries Authority CHAMBERS CREEK DNS N/I A/P Estimates provided by DFO Charter Patrol DAMDOCHAX RIVER AND LAKE 2902 N/I DNS DNS 851 AUC estimates provided by LGL DISKANGIEG CREEK DNS 1946 N/I DNS N/I AUC estimate provided by LGL GINGIT CREEK 7,499 N/I N/I N/I N/I AUC calculation provided by LGL GINLULAK CREEK DNS N/I N/I N/I N/I IKNOUK RIVER N/I N/I N/I N/I N/I Pink flight inspections on odd years only. KINCOLITH RIVER N/I N/I 7546 N/I N/I AUC estimate provided by LGL KSEMAMAITH CREEK (Kseaden Creek) DNS N/I 1, DNS AUC estimates provided by LGL KWINAGEESE RIVER (weir count) 3, Weir counts provided by LGL MEZIADIN RIVER AND LAKE 144,923 4,980 N/O N/O 255 Fishway counts provided by LGL NASS MAIN A/P A/P A/P A/P A/P SEASKINNISH CREEK N/I N/I N/I N/I N/I TEIGEN CREEK DNS N/I DNS DNS N/I TSEAX RIVER 94 N/I N/I AUC estimates provided by LGL ZOLZAP CREEK N/I N/I LGL estimates - Mark Recapture for Coho/Visual surveys for Chum & Pink OBSERVATORY INLET PORTLAND CANAL ILLIANCE RIVER DNS N/O N/I Counts by Charlie Fleenor / Kitsault KITSAULT RIVER DNS N/I N/I Counts by Charlie Fleenor / Kitsault KSHWAN RIVER DNS N/I A/P 1,100 DNS SALMON COVE CREEK DNS N/I 30 N/I DNS STAGOO CREEK DNS N/I 21,000 6,000 DNS Counts by Charlie Fleenor / Kitsault WILAUKS CREEK DNS N/I DNS Counts by Charlie Fleenor / Kitsault DOGFISH BAY CREEK DNS A/P N/I DNS Estimates provided by DFO Charter Patrol PORTLAND INLET CEDAR CREEK DNS A/P 400 A/P DNS Estimates provided by DFO Charter Patrol CRAG CREEK DNS DNS 1,850 DNS DNS Estimates provided by DFO Charter Patrol CROW LAGOON CREEK DNS A/P 1, DNS Estimates provided by DFO Charter Patrol KHUTZEYMATEEN RIVER DNS A/P 124,000 7, Estimates provided by DFO Charter Patrol KWINAMASS RIVER DNS A/P 90,000 A/P 354 Estimates provided by DFO Charter Patrol LARCH CREEK DNS A/P 1397 A/P DNS Estimates provided by DFO Charter Patrol LIZARD CREEK DNS N/I 1500 N/I DNS Estimates provided by DFO Charter Patrol MANZANITA COVE CREEK DNS A/P 1587 DNS DNS Estimates provided by DFO Charter Patrol MOUSE CREEK DNS DNS DNS Estimates provided by DFO Charter Patrol PIRATE COVE CREEK DNS DNS 280 DNS N/I Estimates provided by DFO Charter Patrol TSAMSPANAKNOK BAY CREEK DNS 20 4,250 DNS DNS Estimates provided by DFO Charter Patrol WORK CHANNEL ENSHESHESE RIVER N/I N/I Estimates provided by DFO Charter Patrol LACHMACH RIVER DNS A/P 3, DNS TOON RIVER DNS N/I 27,000 1,500 A/P Estimates provided by DFO Charter Patrol TOTAL 159,112 9, ,

51 Area 4 Area 4 Sub-district Map 51
52 Area 4 First Nations Fishery A number of First Nations harvest fish for Food, Social and Ceremonial purposes in Area 4 or the Skeena River. These are: a) The Tsimshian Communities of Lax Kw alaams (Port Simpson), Metlakatla, Kitkatla, Kitsum Kalum and Kitselas. b) Gitxsan (GWA) - This group is generally split up into Lower Skeena, Upper Skeena, c) Wet suwet en - This Group harvest in the Bulkley River. d) Babine Lake First Nation - The main communities are Lake Babine, Fort Babine and Burns Lake. e)the Takla Lake and Yekooche First Nations Fishing activities were conducted in much the same fashion and locations as in past years. As in recent years, all the bands were licensed to fish through a communal fishing license and specific allocations of each salmon species. All bands were responsible for designating fishers as well as gathering and reporting catch information to DFO. FSC CATCHES 2012 Sockeye Coho Pink Chum Chinook Steelhead SKEENA Lower* Mid Upper Total NASS Catch numbers are preliminary and incomplete as of Nov 30, * Lower Skeena FSC includes marine component received. Estimated 30-40K yet to be reported. Skeena Inland Demonstration Fishery Gillnet and Seine opportunities in Area 4 were available in Commercial marine seine opportunities for sockeye were conducted as an IVQ fishery. DFO had assigned 59 Area C Gillnet licences and industry provided an additional 88 gill net licenses to be utilized in the inland fishery. DFO provided 17 Area A seine licences to be set aside for demonstration fisheries in The calculation method for determining licence quota is as follows: 52
53 All 146 (59+88) Area C and 17 Area A licenses are considered to have participated in the marine fishery and are calculated into the marine fishery effort. In the case of gill nets, the daily total sockeye harvest is divided by 650 (number of Area C licenses) which would equate to a license share of the TAC. The share value would then be multiplied by the number of Area C Licenses available for the Inland Fishery. Example Gillnet Catch Calculation Marine Catch: For example, if the marine commercial gill net catch was 50,000 divided by 650 (number of Area C licenses) = 77 x 90 (number of Area C gillnet Licenses assigned to the Inland Fishery) = 6930 sockeye to be allocated inland. In the case of Area A seine licenses, marine seine fisheries for sockeye were conducted as an IVQ type fishery. The same weekly IVQ assigned in the marine fishery was assigned to each license in the Inland Fishery. Example Seine Catch Calculation If weekly IVQ for a Seine license was determined to be 100 then 100 would be multiplied by 17 (the number of Area A licenses assigned Inland) and 1700 pieces of sockeye would be assigned to the inland fishery Example Gillnet and Seine Calculation Day of Week Sunday Monday Tuesday Wednesday Thursday Friday Saturday Week Day 08-Jul 09-Jul 10-Jul 11-Jul 12-Jul 13-Jul 14-Jul Daily Gillnet Marine Effort Daily Gillnet Marine Catch 92,088 68,781 Catch per total # of licenses Total Gillnet Catch per Licence 252 Total ATP 36,813 Daily Seine Marine Effort Daily Seine Marine Catch Catch per total # of licenses Total Seine Catch per Licence 0 Total ATP 0 Terrace Area ATP gillnets ATP seines Other gillnets Other seines Mid-River 29 ATP gillnets 8.5 ATP seines 49 Other gillnets Other seines Babine River 29 ATP gillnets 8.5 ATP seines 39 Other gillnets Other seines Start Fishing End Fishing TAC Wk Catch Ttl Catch Remaining Carry Over TAC + CO Terrace Area 15-Jul 21-Jul Mid-River 22-Jul 28-Jul 19, ,667 19,667 Babine River 29-Jul 04-Aug 17, ,146 17,146 Inland Demonstration Fishery: See table below. Area First Nation Date Allocation Catch Comments Mid Skeena GWA 24-Jul 19,967 19,967 Beach SN Mid Skeena GWA 01-Aug 17,219 17,219 Beach SN Mid Skeena GWA 05-Aug 15,000 15,000 Beach SN Mid Skeena GWA 09-Aug 9,085 3,716 Beach SN Babine Fence LBN 03-Aug 17,146 17,146 Dip net Babine Fence LBN 08-Aug 15,011 15,011 Dip net Babine Fence LBN 10-Aug 27,900 27,497 Dip net Meziadin Gitanyow Aug 19 6,000 4,250 Dip net 53
54 ESSR Review ESSR opportunities for sockeye in the Skeena River occurred in 2012 with a directed harvest in Babine Lake at the mouths of Pinkut Creek and Fulton River. The ESSR allocations were determined by the escapements past the Tyee Test Fishery and by consultation with the facility manager of Pinkut Creek and Fulton River Spawning Channels, Stock Assessment, and Resource Management. Low pink returns to the Skeena in 2012 did not permit opportunities for ESSR or Economic Opportunities to proceed with the exception of a small ESSR harvest at Moricetown. Excess Salmon to Spawning Requirement (ESSR) fishery: See table below: Area First Nation Date Allocation Catch Comments Pinkut LBN Sept , ,295 Seined Validated landings Fulton LBN Sept , ,830 Seined Validated landings Recreational Fishery Review The tidal water interception salmon sport fishery begins in late April. Initial effort is mostly by local independent anglers out of Prince Rupert and Port Edward, however the most significant portion of the sport fishing season develops late May and continues to mid September. The fleet operating in Area 4 is made up mainly of independent anglers and charter operators. A tidal water creel survey was conducted in Commercial Net Fishery Summary The first Chinook opening on the Skeena took place June 15 & 16 (30 hrs), 54 gill nets participated for a total catch of 314 pieces. Due to poor overall gill net catch and a low Chinook index past the Skeena River Tyee Test fishery a second (Chinook) gill net opening did not take place. The Area 4 net fishery was planned in anticipation of a commercial sockeye surplus of 224,000 and a poor pink return. The fishing plan was consistent with goals for, rebuilding coho, chum & wild sockeye stocks, limited steelhead exploitation, Chinook escapements and gear/sector allocations. Some of the restrictions in place to attain these goals were non-retention chum & steelhead for seines and gill nets, time and area closures, sockeye exploitation rate limitations, daylight only fisheries, mandatory brailing for seines, non-retention Chinook for seines, half-length gill nets and 20 minute sets. High river water levels from spring freshet in late June and early July in combination with high ocean tides effectively held salmon migrating to Area 4 on the outside of the Skeena river. Anecdotal food fishing catches / visual reports on the outside of Smith Island along with the reported condition of the fish (dark in colour) supported this fact. As the tides subsided the sockeye figures past the Skeena Tyee Test fishery began to increase (July ,955 recorded past the Skeena Test Fishery) with the first gill net opening targeting sockeye taking place July 13. Strong sockeye catches were recorded throughout Area 4 from Edye Pass, through the Slough and Glory Hole to the Skeena River. The sockeye were reported to be large (6.2 lbs vs. traditional average of 5 lbs) with little mixing of sizes and low incidental catches of non-target species. With strong catches throughout Area 4 (with the exception of Finlayson Island) it was decided in-season to fish a second day. Sockeye past the Test fishery continued to hold strength throughout the following week subsequently Area 4 was opened July 18 and extended for a second day due to strong sockeye catches. The final gill net opening in Area 4 occurred on July 54
55 25 with catches on par with previous openings. Upon reaching exploitation rate limits further openings in Area 4 were not anticipated for the rest of the season. Peak gill net fleet in Area 4 for 2012 occurred July 18, 19 & 25 with 277 vessels participating in the fishery. Area 4 gill nets fished a total of 6 openings (1 Chinook and 5 sockeye openings) with 1,388 vessel operating days compared to the ten year average of 10.2 openings and vessel operating days. Total sockeye catch was recorded at 399,892 sockeye compared to the ten year average of 306,859. The ITQ seine fishery was opened in Area 4 July 21 July 27achieving a final sockeye catch of 123,340 (quota managed) and a final pink catch (not quota) of 10,251, compared to the last ten year sockeye average of 82,455 and five year even average of 240,021 pinks. Commercial Troll Fishery Review See Area 1 Commercial Troll Fishery Review 55
56 56
57 57
58 2012 Stream Escapements AREA PRELIMINARY ESCAPEMENT ESTIMATES Last Updated November 28, 2012 N/O - NONE OBSERVED, N/I - NOT INSPECTED, DNS - DOES NOT SPAWN IN THIS CREEK, A/P - ADULTS PRESENT, INADEQUATE IFORMATION TO MAKE ESTIMATE,? = INFORMATION EXPECTED Location Stream Name Sockeye Coho Pink Chum Chinook Comments BABINE BEAR BABINE RIVER - SECTIONS 1, 2 AND 3 90,000 N/I N/I DNS A/P BABINE RIVER - SECTION 4 A/P A/P A/P N/I 1,338 BABINE RIVER - SECTION 5 N/I N/I N/I N/I 880 BABINE UNACCOUNTED * 326,905 6,206 47,925 N/I A/P BERNANN CREEK (DEEP CR.) A/P DNS DNS DNS DNS BOUCHER CREEK N/I A/P FIVE MILE CREEK A/P DNS DNS DNS DNS FOUR MILE CREEK 7,267 DNS DNS DNS DNS FULTON RIVER 378, N/I N/I MORRISON CREEK 19,963 N/I N/I DNS DNS NICHYESKWA RIVER N/O A/P N/O DNS DNS NILKITKWA RIVER DNS DNS DNS NINE MILE CREEK 2,109 N/I N/I DNS DNS PENDELTON CREEK (CROSS CREEK) 600 DNS DNS DNS DNS PIERRE CREEK 20,353 N/I N/I DNS DNS PINKUT CREEK 123,292 4 N/O DNS N/O SHASS CREEK 3,900 N/I DNS DNS DNS SIX MILE CREEK (GULLWING CR.) 324 DNS DNS DNS DNS SOCKEYE CREEK A/P DNS DNS DNS DNS SUTHERLAND RIVER N/I N/I DNS DNS DNS TACHEK CREEK 4,916 A/P DNS DNS DNS TAHLO CREEK - (LOWER) 16,500 A/P DNS DNS DNS TAHLO CREEK - UPPER (SALMON CR.) A/P N/I DNS DNS DNS TSEZAKWA CREEK 1,000 N/I A/P DNS DNS TWAIN CREEK 4,725 DNS N/I DNS DNS WRIGHT CREEK (BIG LOON CR.) 57 DNS DNS DNS DNS *Sockeye estimate is fence count minus estimates for specific systems above fence ASITKA LAKE 1, DNS DNS 89 AZUKLOTZ CREEK 5,400 A/P DNS DNS DNS BEAR LAKE 860 N/I DNS DNS N/I BEAR RIVER N/I 1,114 N/I DNS 3,066 DAMSHILGWIT CREEK 937 1, Estimates provided by Gitksan Watershed Authority MOTASE LAKE A/P 160 DNS DNS DNS SHILAHOU CREEK N/I N/I N/I N/I 22 Chinook estimate provided by Gitksan Watershed Authority SUSTUT RIVER AND LAKE* 1, DNS DNS 395 BULKLEY / MORICE ATNA RIVER AND LAKE A/P A/P DNS DNS N/I BULKLEY RIVER - LOWER N/I N/I N/I N/I N/I BULKLEY RIVER - UPPER N/I N/I N/I DNS 290 GOSNELL CREEK DNS A/P N/I N/I N/I MORICE LAKE A/P N/I DNS DNS DNS MORICE RIVER N/O A/P N/I DNS 17,441 NANIKA RIVER 6,671 A/P N/I DNS 118 OWEN CREEK N/I N/I N/I DNS DNS STATION CREEK DNS 400 N/I DNS DNS TELKWA RIVER DNS A/P DNS DNS DNS TOBOGGAN CREEK DNS 3,050 N/I DNS N/I TOUHY CREEK N/I A/P N/I N/I N/I 58
59 N/O - NONE OBSERVED, N/I - NOT INSPECTED, DNS - DOES NOT SPAWN IN THIS CREEK, A/P - ADULTS PRESENT, INADEQUATE IFORMATION TO MAKE ESTIMATE,? = INFORMATION EXPECTED Location Stream Name Sockeye Coho Pink Chum Chinook Comments COASTAL KISPIOX KITSUMKALUM LAKELSE OTHER LOWER SKEENA OTHER MIDDLE SKEENA DENISE CREEK N/I N/I N/I N/I N/I DIANA CREEK 120 A/P A/P DNS DNS ECSTALL RIVER A/P 2,600 A/P 1,200 A/P HAYS CREEK DNS 41 N/I DNS DNS KHYEX RIVER N/I N/I N/I N/I N/I KLOIYA RIVER DNS N/I 200 N/I 189 LA HOU CREEK DNS N/I 11,150 A/P DNS Estimates provided by John and Norma Leakey/DFO Charter Patrol MCNICHOL CREEK DNS N/I N/I N/I DNS OLDFIELD CREEK DNS 277 N/I N/I DNS OONA RIVER DNS N/I N/I N/I DNS PRUDHOMME CREEK 550 N/I A/P DNS DNS SHAWATLAN RIVER 1,700 A/P N/O DNS N/O SILVER CREEK DNS N/I N/I N/I N/I SPILLER RIVER DNS A/P 2,582 DNS DNS BARNES CREEK 215 N/I DNS DNS DNS Sockeye estimate provided by Gitksan Watershed Authority BEAVERLODGE CREEK DNS 187 DNS DNS DNS Coho estimate provided by Gitksan Watershed Authority CLIFFORD CREEK N/I 160 N/I DNS DNS Coho estimate provided by Gitksan Watershed Authority CLUB CREEK (LOWER) 4,529 N/I DNS DNS N/I Sockeye estimate provided by Gitksan Watershed Authority CLUB CREEK (UPPER) 70 N/I DNS DNS N/I Sockeye estimate provided by Gitksan Watershed Authority CULLON CREEK N/I 200 N/I N/I N/I Coho estimate provided by Gitksan Watershed Authority DATE CREEK N/I N/I N/I A/P N/I Chum estimate provided by Gitksan Watershed Authority FALLS CREEK 336 N/I DNS DNS DNS Sockeye estimate provided by Gitksan Watershed Authority FOOTSORE CREEK DNS 253 DNS DNS DNS Coho estimate provided by Gitksan Watershed Authority FOOTSORE CREEK UPPER DNS 15 DNS DNS DNS Coho estimate provided by Gitksan Watershed Authority HODDER CREEK N/I 4 DNS DNS DNS Coho estimate provided by Gitksan Watershed Authority IRONSIDE CREEK DNS 69 N/I DNS DNS Coho estimate provided by Gitksan Watershed Authority JACKSON CREEK 125 N/I DNS DNS DNS Sockeye estimate provided by Gitksan Watershed Authority KISPIOX RIVER N/I N/I N/I A/P N/I Chum estimate provided by Gitksan Watershed Authority MCCULLY CREEK N/I N/I N/I A/P N/I Chum estimate provided by Gitksan Watershed Authority MURDER CREEK DNS 30 N/I DNS DNS Coho estimate provided by Gitksan Watershed Authority NANGEESE RIVER N/I 400 N/I N/I DNS Coho estimate provided by Gitksan Watershed Authority SKUNSNAT CREEK DNS 21 N/I DNS DNS Coho estimate provided by Gitksan Watershed Authority STEEP CANYON CREEK N/I 181 N/I N/I N/I Coho estimate provided by Gitksan Watershed Authority UNNAMED SWAN LAKE CREEK N/I N/I DNS DNS DNS CEDAR RIVER N/I N/I N/I N/I N/I CLEAR CREEK N/I N/I N/I N/I N/I DRY CREEK 174 N/O DNS DNS DNS Estimate provided by Chris Culp KITSUMKALUM LAKE 9,160 DNS DNS DNS DNS KITSUMKALUM RIVER - LOWER N/I N/I N/I N/I 9,363 KITSUMKALUM RIVER - UPPER N/I N/I N/I N/I N/I DASQUE CREEK N/I N/I N/I N/I N/I GAINEY CREEK 68 N/I N/I N/I N/I HATCHERY CREEK (GRANITE CREEK) 59 N/I N/I DNS DNS LAKELSE RIVER N/I N/I 160,000 N/I A/P SALMON CREEK (N. GRANITE CREEK) 23 N/I DNS DNS DNS SCHULBUCKHAND CREEK 2,500 N/I N/I DNS DNS SOCKEYE CREEK 1,200 A/P N/I DNS N/I WILLIAMS CREEK 7,000 N/O N/I DNS N/I ALASTAIR LAKE 5,800 N/I DNS DNS DNS September 18 - Heli inspection by Stan Hutchings ANDESITE CREEK DNS DNS N/I DFO - Stock Assessment DOG TAG CREEK DNS N/I N/I 100 N/I DFO - Stock Assessment ERLANDSEN CREEK N/I 88 N/I N/I N/I Estimate provided by Chris Culp EXCHAMSIKS RIVER N/I 1,200 A/P N/I A/P August 31 Heli inspection - Glacial water conditions - 12 Cn observed EXSTEW RIVER AND SLOUGH N/I 2,500 N/O N/I 46 GITNADOIX RIVER DNS 300 1, KADEEN CREEK N/I 150 N/I N/I N/I KASIKS RIVER DNS 1, MAGAR CREEK DNS 450 N/I N/I 30 MIDDLE CREEK DNS A/P DNS MOLYBDENUM CREEK N/I N/I N/I N/I N/I SHAMES RIVER DNS N/I N/I 5 DNS SOUTHEND CREEK 11,600 N/I DNS DNS DNS ZYMAGOTITZ RIVER DNS 800 N/I N/I N/I KITSEGUECLA RIVER KITWANGA RIVER (fence count) 5,478 2,961 16, Provided by Gitanyow Fisheries Authority KLEANZA CREEK N/I N/I 100 A/P N/I SALMON RUN CREEK DNS 152 DNS DNS N/I Estimate provided by Chris Culp SINGLEHURST CREEK N/I 147 N/I DNS DNS Estimate provided by Chris Culp THOMAS CREEK DNS N/I DNS DNS N/I 59

60 Area 5 Area 5 Sub-district Map 60
61 Area 5 First Nations Fishery A number of First Nations harvest fish for Food, Social and Ceremonial purposes in Area 4 or the Skeena River. These are: a) The Tsimshian Communities of Lax Kw alaams (Port Simpson), Metlakatla, Kitkatla, Kitsum Kalum and Kitselas. b) Gitxsan (GWA) - This group is generally split up into Lower Skeena, Upper Skeena, c) Wet suwet en - This Group harvest in the Bulkley River. d) Babine Lake First Nation - The main communities are Lake Babine, Fort Babine and Burns Lake. e) The Takla Lake and Yekooche First Nations Fishing activities were conducted in much the same fashion and locations as in past years. As in recent years, all the bands were licensed to fish through a communal fishing license and specific allocations of each salmon species. All bands were responsible for designating fishers as well as gathering and reporting catch information to DFO FSC Catch Summary FSC CATCHES 2012 Sockeye Coho Pink Chum Chinook Steelhead SKEENA Lower Mid Upper Total NASS Catch numbers are preliminary and incomplete as of Nov 30, * Lower Skeena FSC includes marine component received. Estimated 30-40K yet to be reported. Recreational Fishery Review The tidal water interception salmon sport fishery begins in late April. Initial effort is mostly by local independent anglers out of Prince Rupert and port Edward, however the most significant portion of the sport fishing season develops late May and continues to Mid September. The fleet operating in Area 5 is made up mainly of independent anglers and charter operators. 61
62 Commercial Net Fishery Summary Area 5 is largely managed as an extension of the Area 4 fishery with a potential late fishery on local pink stocks. The forecasted surplus of local pinks was for a below average return. Low chum escapements remain a concern and fisheries continue to be managed to rebuild these stocks. All fisheries were conducted with non-retention chum. Area 5 was opened to gill nets in conjunction with Area 4 to harvest Skeena River sockeye migrating through Ogden channel. Peak gill net fleet in Area 5 occurred July 18, 19 & 25 with 4 vessels participating in the fishery. Sockeye catches improved the later part of July with a reported increase of sockeye moving through Odgen Channel that was possibly the result of strong winds forcing the sockeye further south through Edye Pass and Ogden Channel. Area 5 gill nets fished a total of 5 openings with 14 vessel operating days compared to the ten year average of 6.8 openings and 37.2 vessel operating days. Due to indications of low abundance from charter patrol pink stream inspection reports, Area 5 was not opened to seines for Total sockeye catch for 2012 in Area 5 was recorded at 2,730 sockeye and 85 pinks. Commercial Troll Fishery Review See Area 1 Commercial Troll Fishery Review 62
63 63
64 2012 Stream Escapements AREA PRELIMINARY ESCAPEMENT ESTIMATES Last Updated November 23, 2012 N/O - NONE OBSERVED, N/I - NOT INSPECTED, DNS - DOES NOT SPAWN IN THIS CREEK, A/P - ADULTS PRESENT, INADEQUATE IFORMATION TO MAKE ESTIMATE Location Stream Name Sockeye Coho Pink Chum Chinook LOWER GRENVILLE BELOWE CREEK DNS 98 N/O N/O DNS LOWE INLET SYSTEM N/I N/I N/I N/I DNS RED BLUFF CREEK DNS N/O DNS DNS DNS STEWART CREEK N/I N/I N/I N/I DNS SYLVIA CREEK DNS 61 N/I N/I DNS TSIMTACK LAKE SYSTEM A/P 101 A/P A/P DNS LOWER PRINCIPE BOLTON CREEK N/I N/I N/I N/I N/I CURTIS CREEK N/I N/I N/I N/I N/I DEVON LAKE SYSTEM N/I N/I N/I N/I N/I KOORYET CREEK A/P DNS MIKADO LAKE SYSTEM N/I N/I N/I N/I N/I SHENEEZA CREEK N/I N/I A/P N/I DNS UPPER PRINCIPE HANKIN CREEK N/I N/I N/I N/I N/I OGDEN / KITKATLA ALPHA CREEK DNS N/I 5,200 N/I DNS CAPTAIN COVE CREEK N/I N/I 2, DNS PETREL CHANNEL / ALA PASS HEVENOR INLET CREEKS N/I N/I DNS MARKLE INLET CREEK A/P DNS NEWCOMBE HARBOUR CREEKS (3) A/P N/I 68 2 DNS RYAN CREEK 90 A/P 400 N/I DNS SHAW CREEK DNS A/P 1270 N/I DNS WILSON INLET CREEK DNS N/I DNS PORCHER INLET HEAD CREEK N/I N/I 1,450 N/I DNS SALT LAGOON CREEK DNS N/I N/I N/I DNS WOLF CREEK DNS N/I 1200 DNS DNS KITKATLA CREEK DNS N/I 5300 N/I DNS PORCHER CREEK DNS N/I 1880 N/I DNS UPPER GRENVILLE FALSE STEWART CREEK N/I A/P 800 N/I DNS KLEWNUGGIT INLET CREEKS N/I N/I N/I N/I DNS KUBAS CREEK N/I N/I N/I N/I N/I KUMEALON CREEK A/P , KXNGEAL CREEK DNS DNS DNS PA-AAT RIVER DNS 100 4,700 8 DNS AREA 5 TOTAL

65 Area 6 Area 6 Sub-district Map 65
2018 NASS RIVER SALMON STOCK ASSESSMENT UPDATE MONDAY, 9 JULY
 218 NASS RIVER SALMON STOCK ASSESSMENT UPDATE MONDAY, 9 JULY The following is the fourth general public update for 218 of Nass River salmon and summer run steelhead stock assessments from the Nisga a Lisims
2018 NASS RIVER SALMON STOCK ASSESSMENT UPDATE MONDAY, 20 AUGUST
 218 NASS RIVER SALMON STOCK ASSESSMENT UPDATE MONDAY, 2 AUGUST The following is the tenth general public update for 218 of Nass River salmon and summer run steelhead stock assessments from the Nisga a
2018 NASS RIVER SALMON STOCK ASSESSMENT UPDATE MONDAY, 10 SEPTEMBER
 218 NASS RIVER SALMON STOCK ASSESSMENT UPDATE MONDAY, 1 SEPTEMBER The following is the thirteenth general public update for 218 of Nass River salmon and summer run steelhead stock assessments from the
2018 Fraser River Fishery Summary to Accompany December 2018 Presentation for FORUM
 2018 Fraser River Fishery Summary to Accompany December 2018 Presentation for FORUM Chinook... 1 Coho... 3 Chum... 4 Sockeye... 5 Pink... 6 Chinook FSC Chinook directed fisheries were open year round Below
PRE-SEASON PLANNING FOR FRASER SALMON and STOCKS OF CONCERN. Forum on Conservation and Harvest Planning for Fraser Salmon January 22, 2010
 PRE-SEASON PLANNING FOR FRASER SALMON and STOCKS OF CONCERN Forum on Conservation and Harvest Planning for Fraser Salmon January 22, 2010 2 Outline South Coast Chinook Status Management Actions Recovery
2016 Fraser River Stock Assessment and Fishery Summary Chinook, Coho and Chum
 2016 Fraser River Stock Assessment and Fishery Summary Chinook, Coho and Chum 1 Background and Stock Assessment 2 Fraser River Chinook - Background Diverse group of populations exhibit a wide range of
PACIFIC REGION 1996 SALMON NET MANAGEMENT PLAN AREAS B, D, AND E SOUTH COAST AND FRASER RIVER
 , " PACIFIC REGION 1996 SALMON NET MANAGEMENT PLAN AREAS B, D, AND E SOUTH COAST AND FRASER RIVER This Salmon Net Management Plan is intended for general purposes only. Where there is a discrepancy between
Rivers Inlet Salmon Initiative
 Rivers Inlet Salmon Initiative 5-YEAR BUSINESS PLAN C AS E F O R S U P P O R T M AR C H 2 0 1 5 Dedication Rick Hansen had been inspired to go to Rivers Inlet in July 2010 by his good friend, and fellow
South Coast Salmon Bulletin August 30, 2018 Assessment Update Barkley/Alberni (Area 23) Terminal Chinook
 Terminal Chinook") 1 South Coast Salmon Bulletin August 30, 2018 Assessment Update Barkley/Alberni (Area 23) Terminal Chinook Pre-season Expectations Somass/Robertson Creek Hatchery chinook: The forecast terminal return
1 South Coast Salmon Bulletin August 30, 2018 Assessment Update Barkley/Alberni (Area 23) Terminal Chinook Pre-season Expectations Somass/Robertson Creek Hatchery chinook: The forecast terminal return
We recommend that whenever possible you use the following guidelines for choosing the most sustainable options in 2010.
 Ocean Wise Seasonal salmon report 2010 NOTE: THE FOLLOWING RECOMMENDATIONS ARE BASED ON EARLY TEST FISHERY RESULTS. ACTUAL IN-SEASON RUN STRENGTH CAN CHANGE AND WILL BE UPDATED AS NECESSARY. Returns of
Salmon and Migratol~Y Trout of the N,anaimo 'River lind Adjacent Streams (Revised 1,973)
") .. '.' ~! ~j-:-t. ~" I. This s~rie~ includes " unpublished preliminary' reports. ana Glatd rec
.. '.' ~! ~j-:-t. ~" I. This s~rie~ includes " unpublished preliminary' reports. ana Glatd rec
Steelhead Stock Status Review British Columbia
 Steelhead Stock Status Review British Columbia Mark Beere - Senior Fisheries Biologist Skeena Region BC Ministry of Forests, Lands and Natural Resource Operations Overview 1. Stocks and Ecotypes in BC
Tuesday, April 10, 2018, 5:08 PM
 TABLE 2. 2018 Recreational management measures for non-indian ocean salmon fisheries - Council adopted. (Page 1 of 5) North of Cape Falcon Supplemental Management Information 1. Overall non-indian TAC:
Her Majesty the Queen in Right of Canada, 2009.
 Canadian Manuscript Report of Fisheries and Aquatic Sciences 288 29 CERTIFICATION UNIT PROFILE: NORTH COAST AND CENTRAL COAST PINK SALMON by B. Spilsted and G. Pestal 1 Fisheries & Aquaculture Management
Interior Fraser River Coho Management Post-season update and 2016 Fisheries Planning FN FORUM Meeting March 9, 2016 Draft 5
 Interior Fraser Coho Management 2015 Post-season update and 2016 Fisheries Planning FN FORUM Meeting March 9, 2016 Draft 5 1 Interior Fraser Coho Background In response to significant stock declines through
2016 Ocean Salmon and Terminal Area Fishery Regulations
 2016 Ocean Salmon and Terminal Area Fishery Regulations 2016 Ocean Salmon Regulations On May 1 ocean salmon regulations for federal waters (3-200 miles) began based on the seasons adopted by PFMC on April
Maintaining biodiversity in mixed-stock salmon fisheries in the Skeena watershed
 Maintaining biodiversity in mixed-stock salmon fisheries in the Skeena watershed A 130-year history Chris C. Wood Principle: Mixed-stock transboundary fisheries impose special requirements on management
OREGON AND WASHINGTON DEPARTMENTS OF FISH AND WILDLIFE JOINT STAFF REPORT SUMMER FACT SHEET NO.
 OREGON AND WASHINGTON DEPARTMENTS OF FISH AND WILDLIFE JOINT STAFF REPORT SUMMER FACT SHEET NO. 1 Columbia River Compact/Joint State Hearing June 28, 2018 Fisheries under consideration: Treaty commercial
Proposed 2018 Fisheries Management Measures to Support Recovery of Interior Fraser River Steelhead
 Proposed 2018 Fisheries Management Measures to Support Recovery of Interior Fraser River Steelhead 22-March-2018 Spawning escapements of two Interior Fraser River steelhead stocks, Thompson and Chilcotin
18 March 2016 Oregon Department of Fish and Wildlife
 18 March 2016 Oregon Department of Fish and Wildlife Background Joint OR/WA policy adoption 2012 OR re-adoption of rules 6/13 Transition period (2013-2016) Phased allocation shift Mainstem gillnets allowed
ALASKA DEPARTMENT OF FISH AND GAME DIVISION OF COMMERCIAL FISHERIES NEWS RELEASE
 ALASKA DEPARTMENT OF FISH AND GAME DIVISION OF COMMERCIAL FISHERIES NEWS RELEASE Sam Cotten, Commissioner Scott Kelley, Director Contact: Pat Shields, Area Management Biologist or Phone: (907) 262-9368
2017 PACIFIC HALIBUT CATCH SHARING PLAN FOR AREA 2A
 (a) FRAMEWORK 2017 PACIFIC HALIBUT CATCH SHARING PLAN FOR AREA 2A This Plan constitutes a framework that shall be applied to the annual Area 2A total allowable catch (TAC) approved by the International
MINISTRY OF ENVIRONMENT ENVIRONMENTAL STEWARDSHIP DIVISION FISH AND WILDLIFE BRANCH. Horsefly River Angling Management Plan
 MINISTRY OF ENVIRONMENT ENVIRONMENTAL STEWARDSHIP DIVISION FISH AND WILDLIFE BRANCH Horsefly River Angling Management Plan January 30 th, 2006 Area/Fishery Description The Horsefly River watershed provides
PACIFIC REGION 1998 SALMON NET MANAGEMENT PLAN AREAS B, D & E SOUTH COAST & FRASER RIVER
 PACIFIC REGION 1998 SALMON NET MANAGEMENT PLAN AREAS B, D & E SOUTH COAST & FRASER RIVER This Area B, D and E Salmon Management Plan is intended for general purposes only. Where there is a discrepancy
2017 Non-Treaty Columbia River Summer/Fall Fishery Allocation Agreement June 15, 2017
 2017 Non-Treaty Columbia River Summer/Fall Fishery Allocation Agreement June 15, 2017 Management Intent and Expectations for Summer Chinook and Sockeye Fisheries The preseason forecast for upper Columbia
2006 Nicomen Slough/Norrish Creek Recreational Fishery Assessment October 9 to November 30, 2006
 2006 Nicomen Slough/Norrish Creek Recreational Fishery Assessment October 9 to November 30, 2006 Prepared By: Jason Mahoney Assessment Biologist Stock Assessment Lower Fraser Area Regulations Regulations
TABLE 1. Commercial troll management measures adopted by the Council for non-indian ocean salmon fisheries, 2016.
 (Page 1 of 5) North of Cape Falcon Supplemental Management Information 1. Overall non-indian TAC: 70,000 Chinook and 18,900 coho marked with a healed adipose fin clip (marked). 2. Non-Indian commercial
Attachment 1. Agenda Item Summary BACKGROUND
 Attachment 1 Agenda Item Summary BACKGROUND Spring Chinook Salmon: Prior to the late 1970s, non-treaty spring Chinook fisheries in the mainstem Columbia River occurred from February through May and harvested
2016 Fraser River Chinook Key Information for Management. FN Forum March 8-10 Nanaimo, BC
 2016 Fraser River Chinook Key Information for Management FN Forum March 8-10 Nanaimo, BC 1 Outline Provide background information, management objectives and fisheries management approach for: Fraser Spring
2016 PACIFIC HALIBUT CATCH SHARING PLAN FOR AREA 2A
 (a) FRAMEWORK 2016 PACIFIC HALIBUT CATCH SHARING PLAN FOR AREA 2A This Plan constitutes a framework that shall be applied to the annual Area 2A total allowable catch (TAC) approved by the International
Recreational Sturgeon Commercial Shad MANAGEMENT GUIDELINES
 OREGON AND WASHINGTON DEPARTMENTS OF FISH AND WILDLIFE JOINT STAFF REPORT - SUMMER FACT SHEET NO. 2 Columbia River Compact/Joint State Hearing June 28, 2005 Fisheries under consideration: Recreational
Canadian Mark Recovery Program CWT Sampling, Coordination, Lab Operations and Reporting Year 1
 Canadian Mark Recovery Program CWT Sampling, Coordination, Lab Operations and Reporting Year 1 October, 2016 Prepared by: K. Fraser Fisheries and Oceans Canada, Pacific Biological Station, Nanaimo, BC
OREGON AND WASHINGTON DEPARTMENTS OF FISH AND WILDLIFE JOINT STAFF REPORT - SPRING FACT SHEET NO.
 OREGON AND WASHINGTON DEPARTMENTS OF FISH AND WILDLIFE JOINT STAFF REPORT - SPRING FACT SHEET NO. 2a Columbia River Compact/Joint State Hearing June 5, 2018 Fisheries under consideration: Mainstem recreational
ESTIMATED RETURNS AND HARVEST OF COLUMBIA RIVER FALL CHINOOK 2000 TO BY JOHN McKERN FISH PASSAGE SOLUTIONS
 ESTIMATED RETURNS AND HARVEST OF COLUMBIA RIVER FALL CHINOOK 2000 TO 2007 BY JOHN McKERN FISH PASSAGE SOLUTIONS ESTIMATED RETURNS AND HARVEST OF COLUMBIA RIVER FALL CHINOOK 2000 TO 2007 This analysis of
Submitted by the Alaska Department of Fish and Game at the request of Alaska Board of Fisheries. January 23, 2018
 Submitted by the Alaska Department of Fish and Game at the request of Alaska Board of Fisheries. January 23, 2018 Alaska Board of Fisheries recommendations on Unuk, Chilkat, and King Salmon rivers king
Stock status of Skeena River coho salmon
 DFO Science Pacific Region Stock Status Report D6-02 (1999) Stock status of Skeena River coho salmon Background The coho salmon (Oncorhynchus kisutch) is one of six species of anadromous Pacific salmon
Review of North and Central Coast Salmon Indicator Streams and Estimating Escapement, Catch and Run Size for each Salmon Conservation Unit
 EA3357 Review of North and Central Coast Salmon Indicator Streams and Estimating Escapement, Catch and Run Size for each Salmon Conservation Unit Prepared by: Karl K. English, Tony Mochizuki, and Dave
Salmon Seasons and Fishery Information. Presented to the Ocean Salmon Industry Group Meeting. Eric Schindler, Oregon Dept. of Fish and Wildlife
 Salmon Seasons and Fishery Information Presented to the Ocean Salmon Industry Group Meeting Eric Schindler, Oregon Dept. of Fish and Wildlife February 27, 2014 Summary of 2013 Oregon Ocean Salmon Seasons
Salmon Escapement to Englishman River, 2005
 Salmon Escapement to Englishman River, 2005 Ian Matthews and Alan Eden 1 South Coast Area Fisheries and Oceans Canada 3225 Stephenson Point Road Nanaimo, BC V9T 1K3 March 2005 1 365 Dunsmuir Rd, Qualicum
2017 PRE-SEASON EXPECTATIONS: 2017 OBSERVATIONS TO DATE:
 South Coast Salmon Bulletin #4 22 September, 2017 Escapement Update All salmon species - Strait of Georgia Stock Assessment SUMMARY: This bulletin details the current in-season escapement information for
Ned Currence, Nooksack Indian Tribe
 Ned Currence, Nooksack Indian Tribe Problem Status Distribution Habitat Hatcheries Harvest 25000 20000 Natural-Origin Spawners 15000 10000 22500 5000 0 Historic catch Spawners (2011-2015) Problem Status
OREGON AND WASHINGTON DEPARTMENTS OF FISH AND WILDLIFE JOINT STAFF REPORT - FALL FACT SHEET NO.
 OREGON AND WASHINGTON DEPARTMENTS OF FISH AND WILDLIFE JOINT STAFF REPORT - FALL FACT SHEET NO. 3 Columbia River Compact/Joint State Hearing August 28, 2018 Fisheries under consideration: Non-treaty mainstem
"Recommended Improvements for the Next Pacific Salmon Treaty"
 "Recommended Improvements for the Next Pacific Salmon Treaty" Randall M. Peterman School of Resource and Environmental Management Simon Fraser University Burnaby, British Columbia, Canada Web site: http://www.rem.sfu.ca/fishgrp/
PACIFIC REGION INTEGRATED FISHERIES MANAGEMENT PLAN SALMON NORTHERN B.C. JUNE 1, MAY 31, 2008
 PACIFIC REGION INTEGRATED FISHERIES MANAGEMENT PLAN SALMON NORTHERN B.C. JUNE 1, 2007 - MAY 31, 2008 Oncorhynchus sp This Integrated Fisheries Management Plan is intended for general purposes only. Where
Salmon Technical Team Preseason Report III Tables
 Attachment 4 Oregon Fish and Wildlife Commission Date: April 20, 2012 EXHIBIT C Salmon Technical Team Preseason Report III Tables Salmon Management Measures Adopted by the Council for 2012-April 2013 Ocean
***Please Note*** April 3, Dear advisory committee members:
 April 3, 29 Dear advisory committee members: The fifth meeting of the CHF advisory committee will be held April 13 in Grants Pass from 6:-8:3 PM, and the purpose of this document is to help committee members
IPHC Regulatory Area 2A Directed Commercial Pacific Halibut Fishery Sample Vessel Fishing Period Limit Options for Longer Fishing Periods
 Agenda Item G.1.a IPHC Report 1 September 2017 IPHC Report September 2017 IPHC Regulatory Area 2A Directed Commercial Pacific Halibut Fishery Sample Vessel Fishing Period Limit Options for Longer Fishing
Recent Environmental Conditions and BC Salmon Outlook to 2020
 Recent Environmental Conditions and BC Salmon Outlook to 2020 K. Hyatt & S. Grant Pacific Biological Station, Nanaimo Contributors: I. Perry, L. Weitkamp, M. Galbraith, J. Boldt, P. Chandler, S. King,
OREGON DEPARTMENT OF FISH AND WILDLIFE REPORT ON INSEASON CHANGES
 Agenda Item E.10.a Supplemental REVISED ODFW Report 1 September 2017 OREGON DEPARTMENT OF FISH AND WILDLIFE REPORT ON INSEASON CHANGES Oregon Research Set-Aside for Yelloweye Rockfish The Oregon Department
OREGON AND WASHINGTON DEPARTMENTS OF FISH AND WILDLIFE JOINT STAFF REPORT - WINTER FACT SHEET NO.
 OREGON AND WASHINGTON DEPARTMENTS OF FISH AND WILDLIFE JOINT STAFF REPORT - WINTER FACT SHEET NO. 3a Columbia River Compact/Joint State Hearing February 21, 2018 Fisheries under consideration: Mainstem
STAFF COMMENTS ON KODIAK FINFISH REGULATORY PROPOSALS ALASKA BOARD OF FISHERIES MEETING KODIAK, ALASKA JANUARY 7-10, 2014
 STAFF COMMENTS ON KODIAK FINFISH REGULATORY PROPOSALS ALASKA BOARD OF FISHERIES MEETING KODIAK, ALASKA JANUARY 7-10, 2014 Regional Information Report No. 4K13-13 The following staff comments were prepared
2017 PRE-SEASON EXPECTATIONS: 2017 OBSERVATIONS TO DATE:
 South Coast Salmon Bulletin #15 8 Decemeber, 2017 Escapement Update All salmon species - Strait of Georgia Stock Assessment SUMMARY: This bulletin details the current in-season escapement information for
2007 Adult Returns and 2008 Expectations Columbia River
 2007 Adult Returns and 2008 Expectations Columbia River Preliminary Draft December 11, 2007 (updated ) Adult Returns Willamette Spring Upriver Spring Upriver Summer Sockeye Upriver Summer Steelhead Bright
PREPARED FOR Pacific Fisheries Resource Conservation Council Suite 290, 858 Beatty Street, Vancouver, BC V6B 1C1
 Responsible Fishing in Canada s Pacific Region Salmon Fisheries: Synopsis FebruARY 2009 PREPARED FOR Pacific Fisheries Resource Conservation Council Suite 290, 858 Beatty Street, Vancouver, BC V6B 1C1
Tuesday, April 10, 2018, 5:04 PM
 TABLE 1. 2018 Commercial troll management measures for non-indian ocean salmon fisheries - Council adopted. (Page 1 of 6) A. SEASON DESCRIPTIONS North of Cape Falcon Supplemental Management Information
Gulf of Maine Research Institute Responsibly Harvested Seafood from the Gulf of Maine Region Report on Atlantic Sea Scallops (Inshore Canada)
") Gulf of Maine Research Institute Responsibly Harvested Seafood from the Gulf of Maine Region Report on Atlantic Sea Scallops (Inshore Canada) The fishery is managed by a competent authority and has a management
Gulf of Maine Research Institute Responsibly Harvested Seafood from the Gulf of Maine Region Report on Atlantic Sea Scallops (Inshore Canada) The fishery is managed by a competent authority and has a management
2017/2018 Salmon Fishery Planning
 2017/2018 Salmon Fishery Planning Sockeye and Pink Salmon Key Management Issues for 2017 FN Forum Meeting March 7-9 th, 2017 1. 2017 Management Issues Outline Fraser Sockeye and Pink Forecasts Environmental
NICOMEN SLOUGH/NORRISH CREEK RECREATIONAL FISHERY ASSESSMENT October 13 th to November 30 th, 2008
 POST SEASON SUMMARY - DRAFT Date: November 30 th, 2008 NICOMEN SLOUGH/NORRISH CREEK RECREATIONAL FISHERY ASSESSMENT October 13 th to November 30 th, 2008 Table 1 Nicomen Slough salmon retention limits
There are two types of selective commercial fisheries conducted by Talok Fisheries:
 Lake Babine Nation Inland Fishery The inland commercial fishery on Lake Babine is operated by a private fishing company named Talok that is owned by the Lake Babine Nation (LBN). This company is governed
Dauphin Lake Fishery. Status of Walleye Stocks and Conservation Measures
 Dauphin Lake Fishery Status of Walleye Stocks and Conservation Measures Date: December, 21 Dauphin Lake Fishery Status of Walleye Stocks and Conservation Measures Background: Walleye stocks in Dauphin
Management Strategies for Columbia River Recreational and Commercial Fisheries: 2013 and Beyond
 Management Strategies for Columbia River Recreational and Commercial Fisheries: 2013 and Beyond Recommendation of the Columbia River Fishery Management Workgroup to the Fish and Wildlife Commissions of
Canadian Manuscript Report of Fisheries and Aquatic Sciences #### CERTIFICATION UNIT PROFILE: FRASER RIVER CHUM SALMON. S.Grant and G.
 Submitted to the Marine Stewardship Council on June 1, 2009. The Manuscript Report will be available through DFO s library website at http://inter01.dfo-mpo.gc.ca/waves2/index.html Canadian Manuscript
1 INTRODUCTION AND SUMMARY
 December 10, 2012 Pacific Booker Minerals 1702 1166 Alberni Street Vancouver, British Columbia V6E 3Z3 Erik Tornquist Executive VP and COO Dear Mr. Erik Tornquist: 1 INTRODUCTION AND SUMMARY This letter
2 Report of the Fraser River Panel to the Pacific Salmon Commission on the 2002 Fraser River Sockeye Salmon Fishing Season
 2 0 0 2 Report of the Fraser River Panel to the Pacific Salmon Commission on the 2002 Fraser River Sockeye Salmon Fishing Season Prepared by the Pacific Salmon Commission June, 2005 Pacific Salmon Commission
2009 JOINT STAFF REPORT CONCERNING STOCK STATUS AND FISHERIES FOR STURGEON AND SMELT
 2009 JOINT STAFF REPORT CONCERNING STOCK STATUS AND FISHERIES FOR STURGEON AND SMELT Joint Columbia River Management Staff Oregon Department of Fish and Wildlife Washington Department of Fish and Wildlife
JOINT STAFF REPORT WINTER FACT SHEET NO. 9 Columbia River Compact March 18, 2004
 JOINT STAFF REPORT WINTER FACT SHEET NO. 9 Columbia River Compact March 18, 2004 Purpose: To review ongoing commercial fisheries and consider non-indian commercial fishing seasons for salmon, smelt and
Risk Assessments in the Pacific Fisheries for BC & Yukon
 Risk Assessments in the Pacific Fisheries for BC & Yukon MARCH, 2017 CONTENTS Introduction to Risk Assessments... 2 Q&As on the Risk Assessment Process... 3 Overview of the Risk Assessment Tool... 4 Example
PRELIMINARY 2017 SALMON OUTLOOK
 Preliminary Salmon, December, 2016 pg 1 of 27 PRELIMINARY SALMON OUTLOOK Since 2002, Pacific Region (BC & Yukon) Stock Assessment staff has provided a categorical outlook for the next year s salmon returns.
FALL FACT SHEET NO. 1 Columbia River Compact July 29, Non-Indian Select Areas
 FALL FACT SHEET NO. 1 Columbia River Compact July 29, 2004 Fisheries Under Consideration: Non-Indian commercial mainstem Non-Indian Select Areas MANAGEMENT GUIDELINES Salmon A Management Agreement for
In the area between the U.S./Canada border and the Queets River, the landing and possession limit is 50
 TABLE 1. 2019 Commercial troll management Alternatives for non-indian ocean salmon fisheries - Council Adopted. (Page 1 of 11) North of Cape Falcon North of Cape Falcon North of Cape Falcon Supplemental
NATIONAL MARINE FISHERIES SERVICE REPORT ON PACIFIC HALIBUT CATCH SHARING PLAN CHANGES FOR 2015
 Agenda Item G.1.b Supplemental NMFS Report 1 November 2014 NATIONAL MARINE FISHERIES SERVICE REPORT ON PACIFIC HALIBUT CATCH SHARING PLAN CHANGES FOR 2015 Table of Contents Purpose of the document... 2
NATIVE FISH CONSERVATION PLAN FOR THE SPRING CHINOOK SALMON ROGUE SPECIES MANAGEMENT UNIT
 Attachment 4 NATIVE FISH CONSERVATION PLAN FOR THE SPRING CHINOOK SALMON ROGUE SPECIES MANAGEMENT UNIT Figures in Draft Plan of February 28, 27 Figure 1. Map of the Rogue River Basin. PASSAGE ESTIMATES
ANALYSIS OF PRELIMINARY SALMON MANAGEMENT ALTERNATIVES FOR 2016 OCEAN FISHERIES
 Agenda Item E.7.a Supplemental STT Report March 2016 SALMON TECHNICAL TEAM ANALYSIS OF PRELIMINARY SALMON MANAGEMENT ALTERNATIVES FOR 2016 OCEAN FISHERIES March 13, 2016 Page Intentionally Blank Preseason
CALIFORNIA DEPARTMENT OF FISH AND WILDLIFE RECOMMENDATIONS ON ADDITIONAL WINTER-RUN PROTECTIONS IN 2016 OCEAN FISHERIES
 Agenda Item E.1 CDFW Supplemental Report April 216 CALIFORNIA DEPARTMENT OF FISH AND WILDLIFE RECOMMENDATIONS ON ADDITIONAL WINTER-RUN PROTECTIONS IN 216 OCEAN FISHERIES In April 215, CDFW recommended
SOUTHEASTERN DISTRICT MAINLAND (ALASKA PENINSULA AREA) SALMON MANAGEMENT PLAN, 1994
 SALMON MANAGEMENT PLAN, 1994") SOUTHEASTERN DISTRICT MAINLAND (ALASKA PENINSULA AREA) SALMON MANAGEMENT PLAN, 1994 James N. McCullough and Rodney D. Campbell Regional Information ~ e~ort' No. 4K94-14 Alaska Department of Fish and Game
SOUTHEASTERN DISTRICT MAINLAND (ALASKA PENINSULA AREA) SALMON MANAGEMENT PLAN, 1994 James N. McCullough and Rodney D. Campbell Regional Information ~ e~ort' No. 4K94-14 Alaska Department of Fish and Game
Information Document to Assist Development of a. Fraser Chinook Management Plan
 2006 Information Document to Assist Development of a Fraser Chinook Management Plan RECORD OF REVISIONS Plan: 2006 Fraser River Chinook Information Document Date last revised: Monday, 13 March 2006 Version
Distribution List. Date: December 1, Chilliwack River Recreational Fishery Assessment. September 15 - November 15, 2006.
 To: Prepared by: Distribution List Jason Mahoney Assessment Biologist Stock Assessment Lower Fraser Area Date: December 1, 2006 Chilliwack River Recreational Fishery Assessment September 15 - November
Harvest Mgmt. & Fishery Regulations 2017 KATHRYN KONOSKI, FISHERIES BIOLOGIST STILLAGUAMISH TRIBE OF INDIANS
 Harvest Mgmt. & Fishery Regulations 2017 KATHRYN KONOSKI, FISHERIES BIOLOGIST STILLAGUAMISH TRIBE OF INDIANS Harvest Management Annual Cycle Egg Alevin Post Season Pre-Season Spawn Adult In-Season Fishery
COLLATION OF PRELIMINARY SALMON MANAGEMENT ALTERNATIVES FOR 2018 OCEAN FISHERIES
 Agenda Item E.4.a Supplemental STT Report 1 March 2018 SALMON TECHNICAL TEAM COLLATION OF PRELIMINARY SALMON MANAGEMENT ALTERNATIVES FOR 2018 OCEAN FISHERIES March 11, 2018 TABLE 1. 2018 Commercial troll
Summary of 2014 Oregon Ocean Salmon Seasons Including: Regulations, Effort, and Landings
 Summary of 2014 Oregon Ocean Salmon Seasons Including: Regulations, Effort, and Landings Oregon s Ocean Salmon Management Areas, Major Ports of Landing, and Klamath Management Zone Designations 2 Mar-Apr
REPORT ON THE 2017 PACIFIC HALIBUT FISHERIES IN AREA 2A
 Agenda Item E.1.a NMFS Report 1 November 2017 REPORT ON THE 2017 PACIFIC HALIBUT FISHERIES IN AREA 2A The 2017 Area 2A Pacific halibut (halibut) total allowable catch (TAC) of 1,330,000 pounds (lbs.),
YUKON RIVER SALMON SEASON REVIEW FOR 1994 AND TECHNICAL COMMITTEE REPORT. Prepared by THE UNITED STATES/CANADA YUKON RIVER JOINT TECHNICAL COMMITTEE
 YUKON RIVER SALMON SEASON REVIEW FOR 1994 AND TECHNICAL COMMITTEE REPORT Prepared by THE UNITED STATES/CANADA YUKON RIVER JOINT TECHNICAL COMMITTEE December 1994 Whitehorse, Yukon Territory 144 ~ABLE
The Fishery. Newfoundland Region Stock Status Report D2-05
 Fisheries Pêches and Oceans et Océans DFO Science Newfoundland Region Stock Status Report D2-05 ATLANTIC SALMON INSULAR NEWFOUNDLAND, SOUTHWEST COAST, SALMON FISHING AREAS 12-13 Background Salmon Fishing
Columbia River Fisheries Management. Estimating Effort, Catch, and ESA Impacts in Recreational Fisheries
 Columbia River Fisheries Management Estimating Effort, Catch, and ESA Impacts in Recreational Fisheries Columbia River Fisheries Management Recreational Fisheries Responsibilities: Estimate angler effort
Pêches et Océans Canada
 Fisheries and Oceans Canada Pêches et Océans Canada Pacific Region Suite 200 401 Burrard Street Vancouver, British Columbia V6C 3S4 Région du Pacifique Piece 200 401 rue Burrard Vancouver (C-B.) V6C 3S4
ATLANTIC SALMON NEWFOUNDLAND AND LABRADOR, SALMON FISHING AREAS 1-14B. The Fisheries. Newfoundland Region Stock Status Report D2-01
 Fisheries Pêches and Oceans et Océans DFO Science Newfoundland Region Stock Status Report D2-01 ATLANTIC SALMON NEWFOUNDLAND AND LABRADOR, SALMON FISHING AREAS 1-14B Background There are 15 Atlantic salmon
REPORT ON THE 2018 PACIFIC HALIBUT FISHERIES IN AREA 2A (10/5/2018)
") Agenda Item F.1.a NMFS Report 1 November 2018 REPORT ON THE 2018 PACIFIC HALIBUT FISHERIES IN AREA 2A (10/5/2018) The 2018 Area 2A Pacific halibut (halibut) total allowable catch (TAC) of 1,190,000 pounds
Agenda Item F.1.a NMFS Report 1 November 2018 REPORT ON THE 2018 PACIFIC HALIBUT FISHERIES IN AREA 2A (10/5/2018) The 2018 Area 2A Pacific halibut (halibut) total allowable catch (TAC) of 1,190,000 pounds
Discussion Paper: February 15, 2018
 Discussion Paper: February 15, 2018 Proposed 2018 Salmon Fishery Management Measures to Support Chinook Salmon Prey Availability for Southern Resident Killer Whales Contents 1. Purpose... 2 1.0 Background...
Juan de Fuca Recreational Chinook Fishery Proposal. Forum on Conservation & Harvest Planning for Fraser Salmon April 13, 2015
 Juan de Fuca Recreational Chinook Fishery Proposal Forum on Conservation & Harvest Planning for Fraser Salmon April 13, 2015 1 Outline Origin of proposal What is the rationale for the proposal? What is
Looking Forward: 2019 Salmon Fisheries
 Looking Forward: 2019 Salmon Fisheries Preliminary Pre-season Planning Considerations Southern BC Post-season Review Meetings December 6, 2018 Outline A. IFMP Planning Considerations: 1. COSEWIC and SARA
PREPARED FOR Pacific Fisheries Resource Conservation Council Suite 290, 858 Beatty Street, Vancouver, BC V6B 1C1
 Responsible Fishing in Canada s Pacific REGIOn Salmon Fisheries February 2009 PREPARED FOR Pacific Fisheries Resource Conservation Council Suite 290, 858 Beatty Street, Vancouver, BC V6B 1C1 PREPARED BY
2017 CONSERVATION HARVESTING PLAN Atlantic Halibut (4RST) Prince Edward Island fixed gear fleet Less than meters
 Prince Edward Island fixed gear fleet Less than meters") Approved on July 13, 2017 APPLICATION This Conservation Harvesting Plan (CHP) applies to all Prince Edward Island (PEI) fixed gear licence holders fishing Atlantic halibut in NAFO Divisions 4RST with vessels
Approved on July 13, 2017 APPLICATION This Conservation Harvesting Plan (CHP) applies to all Prince Edward Island (PEI) fixed gear licence holders fishing Atlantic halibut in NAFO Divisions 4RST with vessels
Early Marine Migrations. General geography Four general patterns Influence of genetics
 Early Marine Migrations General geography Four general patterns Influence of genetics Coastal range of anadromous Pacific salmon and trout Techniques employed to study salmon at sea Recently developed
Olympic National Park Fishing and Shellfish Regulations
 Olympic National Park Fishing and Shellfish Regulations Effective May 1, 2008 through April 30, 2009 Olympic National Park is managed as a natural area. The primary objectives of the fisheries management
Visit the DFO Pacific Region Recreational Fishing website at General Fishing Information Line
 1 Area 18 Unless otherwise described below. limit is 62 cm Subareas 18-1, 18-3, 18-6, 18-11 Chinook Jun 1 Jun 28 Jun 29- Jul 31 of which only one (1) may be > 67 cm. 62-85 cm. Subareas 18-6, that portion
Factors that affect steelhead and salmon catch and release survival in freshwater sport fisheries throughout Washington state
 Factors that affect steelhead and salmon catch and release survival in freshwater sport fisheries throughout Washington state Ian Courter, Thomas Buehrens, Forrest Carpenter, Benjamin Briscoe, Joshua Richards,
OREGON AND WASHINGTON DEPARTMENTS OF FISH AND WILDLIFE JOINT STAFF REPORT SUMMER FACT SHEET NO. 1 June 10, 2010
 OREGON AND WASHINGTON DEPARTMENTS OF FISH AND WILDLIFE JOINT STAFF REPORT SUMMER FACT SHEET NO. 1 June 10, 2010 Fisheries under consideration: Non-Indian commercial salmon STOCK STATUS Upper Columbia Summer
Pacific Salmon Treaty (PST)- Fraser River Sockeye & Pink Salmon Chapter Renewal. February 26, 2013 First Nations Consultations Saanichton, BC
- Fraser River Sockeye & Pink Salmon Chapter Renewal. February 26, 2013 First Nations Consultations Saanichton, BC") Pacific Salmon Treaty (PST)- Fraser River Sockeye & Pink Salmon Chapter Renewal February 26, 2013 First Nations Consultations Saanichton, BC 1 Renewal Context Annex IV, Chapter 4 (Fraser River Sockeye
Pacific Salmon Treaty (PST)- Fraser River Sockeye & Pink Salmon Chapter Renewal February 26, 2013 First Nations Consultations Saanichton, BC 1 Renewal Context Annex IV, Chapter 4 (Fraser River Sockeye
California Department of Fish and Wildlife Report to the International Pacific Halibut Commission on 2017 California Fisheries
 IPHC-2018-AM094-AR08 Received: 22 December 2017 California Department of Fish and Wildlife Report to the International Pacific Halibut Commission on 2017 California Fisheries California Department of Fish
Nez Perce Treaty of 1855
 2007 Nez Perce Tribal Steelhead Fishery Proposal A Harvest Recovery Strategy Presented by Joseph Oatman NPT Harvest Biologist FISH 510 -- Advanced Fish Management Nez Perce Treaty of 1855 The exclusive