Potential Fishing Communities in the Carolinas, Georgia and Florida: An effort in baseline profiling and mapping
|
|
|
- Hubert Todd
- 5 years ago
- Views:
Transcription


1 Potential Fishing Communities in the Carolinas, Georgia and Florida: An effort in baseline profiling and mapping "We can identify a thing only by pointing to what it was before it became the thing that it will presently cease to be." Carl Becker, 1932 by Michael Jepson, Kathi Kitner, Ana Pitchon, Wendy Wicke Perry and Brent Stoffle South Atlantic Fishery Management Council One Southpark Circle, Ste. 306 Charleston, SC National Ocean and Atmospheric Administration National Marine Fisheries Service, SERO 9721 Executive Center Dr., North St. Petersburg, FL 33702
2 Table of Contents Table of Contents... i 1.0 Introduction Methodology for Defining Fishing Communities Census Demographic and Employment Data Caveats North Carolina Communities with Substantial Fishing Activity Varnamtown (28462) Community Description Varnamtown Census Demographics Varnamtown Fishing Demographics Southport/ Bald Head Island (28461) Community Description Bald Head Census Demographics Southport Census Demographics Southport/Bald Head Island Fishing Demographics Carolina Beach (28428) Community Description Carolina Beach Census Demographics Carolina Beach Fishing Demographics Wilmington (28401,28403, 28405, 28411, 28412) Community Description Wilmington Census Demographics Wilmington Fishing Demographics Wrightsville Beach (28480) Community Description Wrightsville Beach Census Demographics Wrightsville Beach Fishing Demographics Surf City/Topsail Beach (28445) & Hampstead (28443) Community Description Topsail Beach Census Demographics Topsail Beach Fishing Demographics Sneads Ferry (28460) Community Description Sneads Ferry Census Demographics Sneads Ferry Fishing Demographics Swansboro Community Description Swansboro Census Demographics Swansboro Fishing Demographics Atlantic Beach (28512) Community Description Atlantic Beach Census Demographics Atlantic Beach Fishing Demographics Morehead City (28557) i
3 Community Description Morehead City Census Demographics Morehead City Fishing Demographics Beaufort (28516) Community Description Beaufort Census Demographics Beaufort Fishing Demographics Harker s Island (28531) Community Description Harker s Island Census Demographics Harker s Island Fishing Demographics Hatteras (27959) Community Description Hatteras Census Demographics Hatteras Fishing Demographics Oriental (28571) Community Description Oriental Census Demographics Oriental Fishing Demographics Vandemere/Mesic (28587) Community Description Vandemere Census Demographics Mesic Census Demographics Vandemere Fishing Demographics Bath (27808) Community Description Bath Census Demographics Bath Fishing Demographics Belhaven (27810) Community Description Belhaven Census Demographics Belhaven Fishing Demographics Wanchese (27981) Community Description Wanchese Census Demographics Wanchese Fishing Demographics Manteo (27954) Community Description Manteo Census Demographics Manteo Fishing Demographics Ocracoke (27960) Community Description Ocracoke Census Demographics Ocracoke Fishing Demographics Elizabeth City (27909) Community Description ii
4 Elizabeth City Fishing Demographics North Carolina Fishing Infrastructure and Community Characterization South Carolina Communities with Substantial Fishing Activity Hilton Head Island (29926, 29928) Community Description Hilton Head Census Demographics Hilton Head Fishing Demographics Beaufort/Port Royal (29935) Community Description Port Royal Census Demographics Port Royal Fishing Demographics Edisto Beach (29438) Community Description Edisto Beach Census Demographics Edisto Island Fishing Demographics Seabrook Island (29455) Community Description Seabrook Census Demographics Seabrook Fishing Demographics Mt. Pleasant (29464) Community Description Mount Pleasant Census Demographics Mount Pleasant Fishing Demographics Isle of Palms (29451) Community Description Isle of Palms Census Demographics Isle of Palms Fishing Demographics McClellanville (29458) Community Description McClellanville Census Demographics McClellanville Fishing Demographics Georgetown (29440) Community Description Georgetown Census Demographics Georgetown Fishing Demographics Murrells Inlet (29576) Community Description Murrell s Inlet Census Demographics Murrell s Inlet Fishing Demographics Little River (29566) Community Description Little River Census Demographics Little River Fishing Demographics South Carolina Fishing Infrastructure and Community Characterization iii
5 4.0 Georgia Communities with Substantial Fishing Activity Tybee Island ( 31328) Community Description Tybee Island Census Demographics Tybee Island Fishing Demographics Thunderbolt (31404, 31410) Community Description Thunderbolt Census Demographics Thunderbolt Fishing Demographics Darien (31305) Community Description Darien Census Demographics Darien Fishing Demographics Brunswick (31520, 31523, Community Description Brunswick Census Demographics Brunswick Fishing Demographics St. Simons Island (31522) Community Description St. Simons Island Census Demographics St. Simons Fishing Demographics St. Mary s (31558) Community Description St. Mary s Census Demographics St. Marys Fishing Demographics Georgia Fishing Infrastructure and Community Characterization Florida Communities with Substantial Fishing Activity Fernandina Beach (32034) Community Description Fernandina Beach Census Demographics Fernandina Beach Fishing Demographics Atlantic Beach (32233) Community Description Atlantic Beach Census Demographics Atlantic Beach Fishing Demographics St. Augustine (32084, 32085, 32086, 32092) Community Description St. Augustine Census Demographics St. Augustine Fishing Demographics Ponce Inlet (32127) Community Description Ponce Inlet Census Demographics Ponce Inlet Fishing Demographics Merritt Island (32952, 32953) Community Description iv
6 5.5.2 Merrit Island Census Demographics Merritt Island Fishing Demographics Cape Canaveral (32920) Community Description Cape Canaveral Census Demographics Cape Canaveral Fishing Demographics Sebastian (32976, 32958) Community Description Sebastian Census Demographics Sebastian Fishing Demographics Fort Pierce (34950) Community Description Fort Pierce Census Demographics Fort Pierce Fishing Demographics Jupiter (33458,33468,33469,33477,33478) Community Description Jupiter Census Demographics Jupiter Fishing Demographics Palm Beach (33480) Community Description Palm Beach Census Demographics Palm Beach Fishing Demographics Boca Raton (33487, 33431, 33486, 33496, 33432, 33434) Community Description Boca Raton Census Demographics Boca Raton Fishing Demographics Key Largo (33037) Community Description Key Largo Census Demographics Key Largo Fishing Demographics Islamorada (33070, 33036) Community Description Islamorada Census Demographics Islamorada Fishing Demographics Marathon (33050) Community Description Marathon Census Demographics Marathon Fishing Demographics Big Pine Key (33042, 33043) Community Description Big Pine Key Census Demographics Big Pine Key Fishing Demographics Key West (33040, 33041, 33045) Community Description Key West Census Demographics Key West Fishing Demographics v
7 5.17 Florida Fishing Infrastructure and Community Characterization References Appendix vi
8 1.0 Introduction This description of potential fishing communities for the U. S. South Atlantic coast includes a compilation of various social indicators that are relevant to fishing, fishermen and fishing communities. These indicators provide baseline information from which assumptions about social impacts might be made regarding future regulatory actions. A number of data sources were used to assemble community profiles, including: the U.S. Census Bureau Decennial census and zip code business patterns; the federal permit system and state permit system. These profiles were bolstered by field visits in many of these communities to confirm the presence of fishing related activity and to interview key informants about the interconnectedness of that activity to the larger economy and culture of the community. This was accomplished using what is called rapid assessment. While this methodology is no substitute for the more in-depth ethnographic methods commonly used by anthropologists in community studies, it was all that was possible under the budgetary constraints of this research. In addition, these data were compiled into a Geographic Information System (GIS) to facilitate data mapping and amalgamation with other GIS data. 1.1 Methodology for Defining Fishing Communities Previous descriptions of fishing communities tied to particular management actions have provided an indication of the difficulties in defining community and a community s relation to fishing dependence (Aguirre International, 1996; Impact Assessment, Inc., 1991; NPFMC, 1994; Johnson and Orbach, 1996). Griffith and Dyer (Aguirre International, 1996) developed a typology of fishing community dependence for the Northeast Multi-species Groundfish Fishery (MGF). In that typology, the authors identified indicators of dependence which included specific physical-cultural and general social-geographic indicators, i.e., number of repair/supply facilities; number of fish dealers/ processors; presence of religious art/architecture dedicated to fishing; presence of secular art/architecture to fishing; number of MGF permits; and the number of MGF vessels. Using previous results and rapid appraisal they developed a fishery dependence index score for the five primary ports in the MGF. As a result they were able to document five variables that best predicted dependence upon the MGF: (1) relative isolation or integration of fishers into alternative economic sectors, including political participation; (2) vessel types within the port s fishery; (3) degree of specialization; (4) percentage of population involved in fishery or fishery-related industries; and (5) competition and conflict within the port, between different components of the MGF (Aguirre International, 1996). McCay and Cieri (2000) recently compiled a social and economic profile of the fishing ports and coastal counties of the Mid-Atlantic region. In their study they used the a variety of sources for information: (1) federal census and employment data, analyzed for the counties associated with the commercial fisheries of each state; (2) NMFS weigh-out data on 1998 landings, by species, geartype, and port, together with similar data, by county, from the state of North Carolina; and (3) field visits and interviews. Their approach was to identify fishing communities recognized as ports by the port agents of the NMFS. Detailed community profiles have been conducted in Alaska to understand the impacts of harvest allocation on communities and on fisheries (Impact Assessment, Inc., 1991; NPFMC, 1994). These profiles utilized census data, permit data, and other available reports supplemented by ethnographic 1
9 data collection for each community. The profiles provided baseline data to facilitate social impact assessment for license limitation management of the ground fish and crab fisheries. Johnson and Orbach (1996) combined several counties into management areas, which reflected many sociological, ecological and environmental differences; differences, which were reflected by the types of fishing found in the various fishing communities. Although they did not attempt to define dependence or specify specific fishing communities, they did contend that management of fisheries would be enhanced if it were to take into consideration the broader social and ecological realities of fishermen s behavior. More recent research to identify fishing communities has been undertaken in both the Northeast and the Southeast. Hall-Arber et al used several approaches in assessing a community s dependence upon fishing. One was a regional model of fishing-related employment compared to alternative employment. Another focused on fishing structure complexity and the degrees of individual communities gentrification and the third approach used community profiles with detailed port characteristics and stakeholder views on community, way of life, institutions and fisheries management. They conclude that a regional analysis reflects the incorporation of a fishing component into economy of contemporary coastal communities. In their study of Florida fishing communities, Jacob et al used a protocol based on central place theory which combined federal and state fishing permit data and census employment data aggregated at the Zip code level to sort population centers and their surrounding hinterlands into central places for the entire state of Florida. Zip code was used for the basic unit of aggregation because it is a geographic identifier for many forms of commercial and recreational fishing data, it is also a relatively small unit of measure, and its boundaries form a service delivery area. To account for the embedded nature of economic linkages in fishing communities, regional economic multipliers for employment were used to estimate the number of jobs that were directly and indirectly related to fishing in each community. Based upon their measure of dependency a small number of coastal communities were determined to be dependent upon fishing. However, using such a dependency measure is not without its drawbacks as concerns about the undercounting of certain occupations within the census data and the inability to satisfactorily measure the recreational sector in terms of its contribution to the local economy are noted. Because there has been little or no research to document fishing communities in the South Atlantic, this description of communities will use a modified approach similar to that used by Jacob et al. (2002). Although a regional approach is sometimes warranted, it is apparent that in their Florida research (Jacob et al., 2002) some fishing communities became subsumed within the larger service sector economy of Florida s coastal regions. That economy is fueled by the rapidly growing tourism and recreation sectors. While it is true that most Floridians do participate in an economy that extends beyond their community, it is likely that the majority of their needs are met within the confines of that place they consider their home or what we are referring to as a community. It is improbable that the same boundary serves as community for all individuals. Therefore we have to assume that based upon certain criteria a pre-determined boundary will encompass an area that captures a sense of community for most of those who live within that boundary. Without extensive ethnographic research into social networks and sense of place, it is impractical to assume that we know the exact boundary around a fishing community. For that reason, in this description there will 2
10 be no definite boundary assumed, however the fishing community will be understood to exist within a range of boundaries. Data at the census designated place level (CDP) are used for describing the demographic character of most communities. Where zip code level data only are available (permits, NAIC employment figures), data are compiled for the all zip codes associated with the area identified. A map, which shows the zip code boundary for each CDP, is provided along with the outline of the CDP. One of the difficulties in using CDP data is that it has been shown that fishermen will often live outside the boundaries of the CDP where their vessel is home ported (Jacob et al. 2001). Data at the CDP level will not always have a direct one to one correspondence with other data such as the fisherman s home zip code or zip code business patterns for fishing employment locations. Therefore data that correspond to one level of place may not correspond to another. Consequently, it is important to understand these differences when undertaking any assessment of impacts to a community. Furthermore, it has been noted that census data often underreport certain groups of people. Recent research (Kitner, 2001) has identified coastal communities and fishing communities as being part of those groups who may not be fully represented by census data. Because at this time there are no standard guidelines for delineating the boundaries of a fishing community, this description will combine data from different levels and concepts of place (zip code, homeport and Census Designated Place). Each, in its own way, may represent some part of a fishing community, but none will represent the community in its entirety. Such boundaries cannot be determined without extensive research, as mentioned before. The data presented here will highlight the differences in the types of data used in determining the boundaries of a community and any such impacts that might ensue. 1.2 Census Demographic and Employment Data Caveats When using census data it is important that certain caveats be made clear. As mentioned previously, census data has been notorious for underreporting certain groups of people who difficult to locate and therefore are often not reported in the census. Commercial fishermen are part of that group as outlined in recent research by Kitner (2001). For that reason, it must be assumed that census data as it relates to fishing communities underreports employment and participation in work related to commercial fishing. As was pointed out in earlier research (Jacob et. al, 2001) any attempt at quantifying employment or income from commercial or recreational fishing becomes problematic. Data may be suppressed or grossly underreported and therefore any description will miss important economic and social contributions of fishing related businesses. At the same time, census data is the only demographic data that can be applied over large geographic areas and population ranges. It is easily available and represents the most affordable alternative for describing any community at this time. Although these data are suspect, it can only be assumed that any underreporting is consistent across geographic area and population range. Although this situation is not ideal, by combining several different data from various sources, a general description of community and the fishing activity associated with it may be attained. Until more detailed ethnographic research that can examine the social and economic networks that exist in fishing 3
11 communities can be undertaken, this general and often broad description of community will have to suffice. Census demographic data were collected for communities and appear under each community description. Those data include the following variables for each community: total population by age; educational attainment; race; industry; occupation; average wage or salary; poverty status. These data were collected for census years 1970, 1980, 1990, and Census data for the first three decades were compiled using the MARFIN Socioeconomic Database created by the Louisiana Population Data Center. The census data for the year 2000 were compiled from the U.S. Census Bureau s Amercian Factfinder Webpage. 1 In using data from the 2000 census there are several caveats that must be noted. The 2000 census was the first year that individuals were allowed more than one choice when deciding race. Therefore, when comparing the category race to the previous three decades, the association will not be consistent. In order to lessen misunderstanding for this description only those categories where one race alone was chosen were used. In other words, those who chose more than one race were not included. This will result in some underreporting for the year 2000 in the tables presented. Other significant changes in the 2000 census were made to the industry and occupation categories. This was the first decennial census to use the North American Industry Classification Code (NAIC) in replacement of the Standard Industry Code (SIC). In the transition from SIC to the NAIC, many industry and occupation categories were reclassified making it difficult to compare any previous census and the most recent. For the purposes of comparison here, certain industry categories were reclassified and compiled to reflect the best representation of the previous classification used in the preceding census (See Appendix 1). This recoding was done after comparing certain industry classifications which were moved into other categories with the switch to the NAIC from SIC. While admittedly not perfect, this reclassification was necessary to make comparisons of industry changes over time. The task of reclassifying the occupation category was deemed too onerous and therefore the only category reported for 2000 is the Farm, fish and forestry category, which did not change and most likely contains the majority of fishing related employment. Employment data collected by the Census Bureau were also used at the zip code level for the community descriptions. Again, it must be assumed for reasons stated earlier that these data are likely to underreport actual fishing employment. In addition, the category of fishing that is reported in the economic census does not include those individuals who report themselves as self-employed, of which most commercial fishermen consider themselves to be. Therefore, employment figures again grossly distort the actual employment from commercial and recreational fishing. In addition, like Jacob et al. 2001, employment for the recreational sector was difficult to quantify and the marinas sector is once again used to provide some indication of community employment for the recreational sector. It is recognized that this measure is inadequate and is one component of a much larger employment sector. At the end of each state s community profiles, two tables have been provided to categorize both the attendant fishing infrastructure in those communities, but to also begin a process of determining which of the following communities might warrant further consideration as a fishing community. The information provided in these tables is considered highly subjective based upon the presence or 1 4
12 absence of certain criteria and an assessment of other information provided through interviews or historical data. It is therefore suggested that any future determination of fishing community status use these tables cautiously and be judicious in attempting to incorporate any other information that might be available to categorize any of the communities included in this document. It must also be noted that during field research and as part of the management process, other communities have been mentioned for inclusion to be considered as fishing communities and therefore those communities included in this document do not constitute an exhaustive listing of potential fishing communities. 5

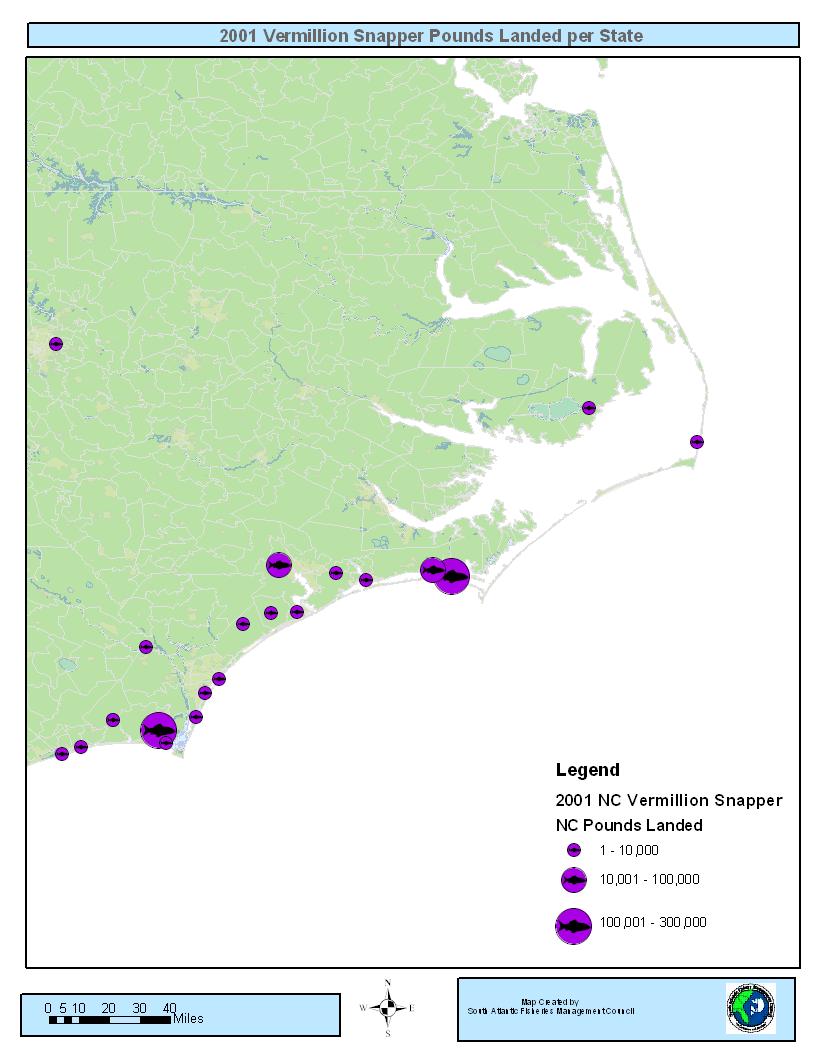
13 2.0 North Carolina Communities with Substantial Fishing Activity Fig North Carolina Potential Fishing Communities. According to the National Marine Fisheries Service North Carolina has landed close to 140 and 160 million pounds of seafood in 2001 and 2002 respectively. Two ports, Wanchese-Stumpy Point, and Beaufort-Morehead City, both rank within the top 50 ports in terms of landings and value for those same years. Since 1998, North Carolina has had a high of 535 vessels with federal permits, now down to 439 in 2001 (Table 2.1). Most vessels with federal permits had either king or Spanish mackerel with snapper grouper class 1 permits being the next most common. 6
14 Table 2.1 Number of Federal Permit by Type for North Carolina (Source: NMFS 2002) Type of Permit Total permitted vessels Commercial King Mackerel Commercial Spanish Mackerel Commercial Spiny Lobster Charter/Headboat for Coastal Pelagics Charter/Headboat for Snapper Grouper Snapper Grouper Class Snapper Grouper Class Swordfish Shark Rock Shrimp There were over 9500 state licenses sold with capability of sale and over 5500 reported sales in 2002 (Table 2.1). Although the overall number of license sold has been increasing since 1994, the number of licenses reporting sales has been decreasing and the number of licenses without sales has been increasing. Table 2.2. Number of licenses sold by the North Carolina Division each license year, the number of licenses with selling privileges that potentially can report catch on trip tickets by license year and the number of licenses actually used to report catches. Individuals may hold more than one license with selling privileges. (Source: NCDMF 2002) Number of licenses sold* Number of licenses reporting sales Number of licenses sold, but did not report sales License Year ,781 Not available Not available 1994/1995 7,535 6, /1996 7,898 7, /1997 8,173 6,700 1, /1998 8,595 7,000 1, /1999 8,426* 6,515 1, / ,711 6,015 3, /2001* 9,677 6,057 3, /2002* 9,712 5,509 4,203 *Licenses from 1994 to June 1999 are Endorsement to Sell licenses. Licenses from 1999 to the present include number of SCFL, RSCFL, Shellfish, Menhaden License for Non-Residents without SCFL, Recreational Fishing Tournament License to Sell Fish, and Land or Sell licenses. License year is July to June. Source: /98 license year sales were derived from historical reports. 1998/ /2002 from FIN license sales reports. *1998/99 was a transition year and not all dbase licenses were migrated to FIN. The numbers provided were from FIN. *1999/00 to 2001/02 include licenses sold that were subsequently surrendered without a refund /2000 license counts were stated as much higher in other documents. This was due to the grace period when switching from ETS to SCFL. The number above is correct. The majority of license sales are for commercial fishing vessels, with over 9400 permits or 46.9 percent in 2002 (Table 2.3). Standard commercial fishing license is the next most frequent with 32.9 and shellfish licenses third at 11.4 percent. There were 832 dealer licenses sold for the year 2002 in North Carolina. 7
15 Table 2.3 Number of State Permit by Type for North Carolina (Source: NCDMF 2002) Type Permits Percent Commercial Fishing Vessel Registration Dealer License Flounder License Land or Sell License 59.3 Non-resident Menhaden License 10.0 Ocean Fishing Pier License 25.1 Spotter Plane License 11.1 Retired Standard Commercial Fishing License Standard Commercial Fishing License Shellfish License Recreational Fishing Tournament to Sell License 31.2 Total There has been considerable research conducted with North Carolina fishermen and their communities over time. Johnson and Orbach s research (1996) combined several counties into management areas which reflected many sociological, ecological and environmental differences. Those differences were related to the different types of fishing found in the various communities. Although they did not attempt to specify specific fishing communities, they did contend that management of fisheries would be enhanced if it were to take into consideration the broader social and ecological realities of fishermen s behavior. Griffith (1999) has written extensively about North Carolina fishermen and their communities and Garrity-Blake (1994) has also provided an in-depth look at the menhaden fishery. Numerous journal articles and gray papers have also contributed to an understanding of North Carolina and its fisheries. But to date there has been no systematic attempt to identify fishing communities and begin baseline data collection. The communities describe here were selected from a list of fishing communities identified by various advisory panel members who are knowledgeable about North Carolina fisheries and their communities. The list was modified after conducting rapid assessment in some of those communities. These descriptions are not a definitive list of fishing communities in North Carolina, but represent the first phase of assembling both the data and descriptions to begin identifying those communities which may indeed be classified as fishing community. A map for each community is provided which displays federal dealers and a symbol indicating the number of federal permits by zipcode. The zipcode area name is displayed in light blue while the CDP name is in black. The symbol for permits is centered within the zipcode area and does not represent the precise location of any permit holder. Dealer permits are displayed near their physical location. 8
16 9
. Just over fifty percent of the population is in the labor force for the last two decennial censuses, but the percent unemployed has declined from 8.2 percent in 1990 to 5.1 percent in 2000.")
17 2.1 Varnamtown (28462) Community Description Varnamtown Varnamtown has seen a slight population increase from 1990 to The majority of housing is owner occupied (Table ) and residence is fairly stable with most living in the same house within the last five years for both the 1990 and 2000 census (Table ). Just over fifty percent of the population is in the labor force for the last two decennial censuses, but the percent unemployed has declined from 8.2 percent in 1990 to 5.1 percent in The population is almost entirely White with a few Latinos according to Table The poverty rate has declined from 17.2 percent in 1990 to 11.2 percent in Employment in the retail and wholesale industry leads with construction and transportation next. There has been a slight decline in both the categories of Agriculture, Fishing and Mining (Table ) and Farm, Fish, Forest (Table ) from 1990 to Varnamtown is supposedly the fishing hub for this region, although as evidenced by the above map and Tables and , many fishermen list Supply as their residence for some reason, which 10
18 may be where the post office is located. A sign at the town entrance prominently displays a shrimp trawler welcoming you to the community. Varnamtown is relatively rural and surrounded by farmland. There are at least five fish houses and a marina which services non-commercial boats. One of the fish houses does have charter operations and a jet-ski business that operate under the same roof. One fish house owner commented that they struggle with their seafood business because shrimpers are having difficulty making ends meet. Most fishermen who dock and sell at local fish houses live near the town itself. A large percentage of locals make some kind of a living off the water harvesting fish, clams, or oysters according to those interviewed. Some fish year-round, but many have other jobs such as carpentry and work on dredge boats. Development has changed the community; outsiders are a more common sight now, according to one individual, whereas in the past it was primarily locals living in the community Sunset Beach / Seaside Sunset Beach is really two communities one on the creek side and the other the ocean side. The creek side with its strip malls and mobile homes is where the locals live year-round. It appears to be much more working-class than its ocean side counterpart. The beach side is developed with expensive homes, gift shops, and beach wear stores. On the creek side and a little more inland is the town of Seaside, where there is some fishing. There is the Pelican Point Marina in nearby Shallotte; it is primarily a recreational marina and has no commercial boats. There is a seafood restaurant where some small trawlers dock and a steel and aluminum welding shop that caters to the fishing population Holden Beach, North Carolina Developed much like Sunset Beach, Holden Beach has one marina but no charter operations. It is tourist centered, with beach wear marts and a couple seafood restaurants Supply, North Carolina Supply is an unincorporated area, yet the zip code area in the above map is named after this small community. Viewing the permit tables and the zip code related employment table it is obvious there is considerable fishing activity within the zip code area that does not appear in federal permit tables (Table ) nor the state permit table (Table ) for Varnamtown. Supply has over 600 licenses issued in 2002 with 167 shell fishing licenses and over 130 standard commercial fishing licenses. There are 22 dealers licensed in Supply and over 260 commercial vessels according to Table Interviews conducted by Ana Pitchon, May
19 2.1.2 Varnamtown Census Demographics Population Table Total Persons and Persons by Age category for Varnamtown, North Carolina (Source U.S. Census Bureau & MARFIN Sociodemographic Database. Louisiana Population Data Center & National Marine Fisheries Service). Total Persons and Age Category Total Persons Persons Age Persons Age Persons Age Persons Age Persons Age Persons Age Persons Age Persons Age Persons Age Housing Tenure Table Housing Tenure for Varnamtown, North Carolina (Source: U.S. Census Bureau). Percent Renter Occupied Percent Owner Occupied Residence in 1985 and 1995 Table Residence in 1985 and 1995 for Varnamtown, North Carolina (Source: U.S. Census Bureau). Different House Same County Same House Employment/Unemployment Table Employment and Unemployment for Varnamtown, North Carolina (Source: U.S. Census Bureau). Persons 16 yrs and over Percent in labor force Percent unemployed
20 Race Table Race for Varnamtown, North Carolina (Source U.S. Census Bureau & MARFIN Sociodemographic Database. Louisiana Population Data Center & National Marine Fisheries Service). Race Black Persons Latino Black Persons Latino Persons White Persons Latino White Persons Education Table Years of Education by Category for those 25 Years and Older for Varnamtown, North Carolina (Source: U.S. Census Bureau & MARFIN Sociodemographic Database. Louisiana Population Data Center & National Marine Fisheries Service). Education w/ 0-8 years education w/ 9-11 years education w/ HS diploma w/ years. education w/ College Degree Drop outs Income and Poverty Table Average Household Wage/Salary and Persons Below the Poverty Level for Varnamtown, North Carolina (Source: U.S. Census Bureau & MARFIN Sociodemographic Database. Louisiana Population Data Center & National Marine Fisheries Service). Wage or Salary Average Household Wage/Salary Income (dollars).. $26590 $33750 Poverty Level Persons Below Poverty Level Age 65+ Below Poverty Level Households with Public Assistance
21 Industry Table Employment by Industry for Varnamtown, North Carolina (Source: U.S. Census Bureau & MARFIN Sociodemographic Database. Louisiana Population Data Center & National Marine Fisheries Service). Industry Agriculture, Fishing, Mining Construction Business Services Communication/Utilities Manufacturing Financial, Insurance & Real Estate Services Wholesale/Retail Trade Transportation Occupation Table Employment by Occupation for Varnamtown, North Carolina (Source: U.S. Census Bureau & MARFIN Sociodemographic Database. Louisiana Population Data Center & National Marine Fisheries Service). Occupation Sales Clerical Craft Exec/Managerial Farm/Fish/Forest Household Services Laborer/Handler Operative/Transport Service, except Household Technical
22 2.1.3 Varnamtown Fishing Demographics Table Number of Federal Permit by Type for Varnamtown, North Carolina (Source: NMFS 2002) Type of Permit Total permitted vessels Commercial King Mackerel Commercial Spanish Mackerel Commercial Spiny Lobster Charter/Headboat for Coastal Pelagics Charter/Headboat for Snapper Grouper Snapper Grouper Class Snapper Grouper Class Swordfish Shark Rock Shrimp Federal Dealers Table Employment in Fishing Related Industry for Varnamtown, North Carolina (Zip code Business Patterns, U.S. Census Bureau 1998) Category NAIC Code Number Employed Fishing Seafood Canning Seafood Processing Boat Building Fish and Seafoods Fish and Seafood Markets Marinas Total Fishing Employment 52 Table Number of State Permit by Type for Varnamtown,, North Carolina (Source: NCDMF 2002) Type Permits Commercial Fishing Vessel Registration 0 Dealer License 0 Flounder License 0 Land or Sell License 0 Non-resident Menhaden License 0 Ocean Fishing Pier License 0 Spotter Plane License 0 Retired Standard Commercial Fishing License 0 Standard Commercial Fishing License 0 Shellfish License 0 Recreational Fishing Tournament to Sell License 0 Total 0 15
 Type Permits Commercial Fishing Vessel Registration 264 Dealer License 22 Flounder License 0 Land or Sell License 0")
23 Table Number of State Permit by Type for Supply, North Carolina (Source: NCDMF 2002) Type Permits Commercial Fishing Vessel Registration 264 Dealer License 22 Flounder License 0 Land or Sell License 0 Non-resident Menhaden License 0 Ocean Fishing Pier License 0 Spotter Plane License 0 Retired Standard Commercial Fishing License 21 Standard Commercial Fishing License 131 Shellfish License 167 Recreational Fishing Tournament to Sell License 0 Total Southport/ Bald Head Island (28461) 16
24 2.2.1 Community Description Southport Southport is a quaint fishing community located at the mouth of the Cape Fear River, originally incorporated in 1792; this community caters to both tourists and locals. The downtown marina has restaurants, gift shops and several inns. There are at least three marinas in the area, with several seafood restaurants nearby. There is a dredging company and a nearby boat yard and a welding company that provide marine repairs. The North Carolina State Ports Authority has a small boat harbor located here and the NC Maritime Museum has a branch in Southport. There are several recreational fishing tournaments held in Southport including the US Open King Mackerel Fishing Tournament held in October which attracts more than 500 boats annually. Other tournaments include the Lady Anglers King Mackerel Tournament in August and the Wildlife Bait and Tackle Flounder Tournament held in September. Southport has some seafood employment with most in seafood processing and fish and seafoods as shown in Table There are over 200 state permits with the majority being commercial vessel registrations and the next being standard commercial fishing licenses at 76. There were 14 dealer permits listed also. Southport has seen a decrease in its population since 1980 from 2835 to 2386 in Approximately 70 percent of the housing was owner occupied in 1990 and 2000 and a large majority of the population has remained stable, living in the same home as five years before for both censuses. The percentage of people in the work force has increased while the percentage of unemployed has dropped according to Table The majority of the population is White (76%) with 22% Black and less than 2% Latino. The poverty rate in 2000 was 12.5 percent which is up from 10 percent in There has been a decline in both the Agriculture, Fishing and Mining industry category and the Farm, Fish, and Forestry occupation category since 1990 (Table and ) Bald Head Island, Bald Head Island is an exclusive community with a private ferry operated by the island. Many Southport residents work on the island or for the ferry system. There are a few restaurants, an inn, and gift shops located around a marina on the island. The marina is a full service marina with electrical service which will accommodate vessels up to 90 feet in length. There is a charter fishing operation at the marina, but no commercial vessels dock there. People do fish from shore and there is the annual fishing rodeo in May. The population on Bald Head Island has doubled since 1990 to 165 persons. Housing tenure has shifted somewhat with the percent renter occupied growing from 8.3 percent in 1990 to 37.9 percent in 2000 (Table ). Residence is beginning to show some stability with the percentage of people living in the same house as five years ago in 2000 more than in 1990 according to Table A greater percentage of people are now in the labor force and unemployment has risen also as shown in Table The population is predominately White according to Table , but 17
25 there has been a recent increase in the category for Blacks although relatively slight in terms of overall population. According to Table the average wage or salary has dropped considerably since 1990 and the number of persons in poverty has also risen. These dramatic changes reflect the total persons identified in the census for this island which has a relatively small population Bald Head Census Demographics Population Table Total Persons and Persons by Age category for Bald Head Island, North Carolina (Source U.S. Census Bureau & MARFIN Sociodemographic Database. Louisiana Population Data Center & National Marine Fisheries Service). Total Persons and Age Category Total Persons Persons Age Persons Age Persons Age Persons Age Persons Age Persons Age Persons Age Persons Age Persons Age Housing Tenure Table Housing Tenure for Bald Head Island, North Carolina (Source: U.S. Census Bureau). Percent Renter Occupied Percent Owner Occupied Residence in 1985 and 1995 Table Residence in 1985 and 1995 for Bald Head Island, North Carolina (Source: U.S. Census Bureau). Different House Same County Same House Employment/Unemployment 18
26 Table Employment and Unemployment for Bald Head Island, North Carolina (Source: U.S. Census Bureau). Persons 16 yrs and over Percent in labor force Percent unemployed Race Table Race for Bald Head Island, North Carolina (Source U.S. Census Bureau & MARFIN Sociodemographic Database. Louisiana Population Data Center & National Marine Fisheries Service). Race Black Persons Latino Black Persons Latino Persons White Persons Latino White Persons Education Table Years of Education by Category for those 25 Years and Older for Bald Head Island, North Carolina (Source: U.S. Census Bureau & MARFIN Sociodemographic Database. Louisiana Population Data Center & National Marine Fisheries Service). Education w/ 0-8 years education w/ 9-11 years education w/ HS diploma w/ years. education w/ College Degree Drop outs Income and Poverty Table Average Household Wage/Salary and Persons Below the Poverty Level for Bald Head Island, North Carolina (Source: U.S. Census Bureau & MARFIN Sociodemographic Database. Louisiana Population Data Center & National Marine Fisheries Service). Wage or Salary Average Household Wage/Salary Income (dollars) Poverty Level Persons Below Poverty Level Age 65+ Below Poverty Level Households with Public Assistance Industry 19
27 Table Employment by Industry for Bald Head Island, North Carolina (Source: U.S. Census Bureau & MARFIN Sociodemographic Database. Louisiana Population Data Center & National Marine Fisheries Service). Industry Agriculture, Fishing, Mining Construction Business Services Communication/Utilities Manufacturing Financial, Insurance & Real Estate Services Wholesale/Retail Trade Transportation Occupation Table Employment by Occupation for Bald Head Island, North Carolina (Source: U.S. Census Bureau & MARFIN Sociodemographic Database. Louisiana Population Data Center & National Marine Fisheries Service). Occupation Sales Clerical Craft Exec/Managerial Farm/Fish/Forest Household Services Laborer/Handler Operative/Transport Service, except Household Technical Southport Census Demographics Population Table Total Persons and Persons by Age category for Southport, North Carolina (Source U.S. Census Bureau & MARFIN Sociodemographic Database. Louisiana Population Data Center & National Marine Fisheries Service). Total Persons and Age Category Total Persons Persons Age Persons Age Persons Age Persons Age Persons Age
28 Persons Age Persons Age Persons Age Persons Age Housing Tenure Table Housing Tenure for Southport, North Carolina (Source: U.S. Census Bureau). Percent Renter Occupied Percent Owner Occupied Residence in 1985 and 1995 Table Residence in 1985 and 1995 for Southport, North Carolina (Source: U.S. Census Bureau). Different House Same County Same House Employment/Unemployment Table Employment and Unemployment for Southport, North Carolina (Source: U.S. Census Bureau). Persons 16 yrs and over Percent in labor force Percent unemployed Race Table Race for Southport, North Carolina (Source U.S. Census Bureau & MARFIN Sociodemographic Database. Louisiana Population Data Center & National Marine Fisheries Service). Race Black Persons Latino Black Persons Latino Persons White Persons Latino White Persons
29 Education Table Years of Education by Category for those 25 Years and Older for Southport, North Carolina (Source: U.S. Census Bureau & MARFIN Sociodemographic Database. Louisiana Population Data Center & National Marine Fisheries Service). Education w/ 0-8 years education w/ 9-11 years education w/ HS diploma w/ years. education w/ College Degree Drop outs Income and Poverty Table Average Household Wage/Salary and Persons Below the Poverty Level for Southport, North Carolina (Source: U.S. Census Bureau & MARFIN Sociodemographic Database. Louisiana Population Data Center & National Marine Fisheries Service). Wage or Salary Average Household Wage/Salary Income (dollars). $16282 $28062 $33714 Poverty Level Persons Below Poverty Level Age 65+ Below Poverty Level Households with Public Assistance Industry Table Employment by Industry for Southport, North Carolina (Source: U.S. Census Bureau & MARFIN Sociodemographic Database. Louisiana Population Data Center & National Marine Fisheries Service). Industry Agriculture, Fishing, Mining Construction Business Services Communication/Utilities Manufacturing Financial, Insurance & Real Estate Services Wholesale/Retail Trade Transportation
30 Occupation Table Employment by Occupation for Southport, North Carolina (Source: U.S. Census Bureau & MARFIN Sociodemographic Database. Louisiana Population Data Center & National Marine Fisheries Service). Occupation Sales Clerical Craft Exec/Managerial Farm/Fish/Forest Household Services Laborer/Handler Operative/Transport Service, except Household Technical Southport/Bald Head Island Fishing Demographics Table Number of Federal Permit by Type for Southport, North Carolina (Source: NMFS 2002) Type of Permit Total permitted vessels Commercial King Mackerel Commercial Spanish Mackerel Commercial Spiny Lobster Charter/Headboat for Coastal Pelagics Charter/Headboat for Snapper Grouper Snapper Grouper Class Snapper Grouper Class Swordfish Shark Rock Shrimp Federal Dealers Table Number of Federal Permit by Type for Bald Head Island, North Carolina (Source: NMFS 2002) Type of Permit Total permitted vessels Commercial King Mackerel Commercial Spanish Mackerel Commercial Spiny Lobster Charter/Headboat for Coastal Pelagics Charter/Headboat for Snapper Grouper Snapper Grouper Class Snapper Grouper Class Swordfish Shark Rock Shrimp Federal Dealers
31 Table Employment in Fishing Related Industry for Southport/Bald Head Island, North Carolina (Zip code Business Patterns, U.S. Census Bureau 1998) Category NAIC Code Number Employed Fishing Seafood Canning Seafood Processing Boat Building Fish and Seafoods Fish and Seafood Markets Marinas Total Fishing Employment 28 Table Number of State Permit by Type for Southport, North Carolina (Source: NCDMF 2002) Type Permits Commercial Fishing Vessel Registration 103 Dealer License 14 Flounder License 0 Land or Sell License 0 Non-resident Menhaden License 0 Ocean Fishing Pier License 0 Spotter Plane License 0 Retired Standard Commercial Fishing License 12 Standard Commercial Fishing License 76 Shellfish License 7 Recreational Fishing Tournament to Sell License 1 Total 213 Table Number of State Permit by Type for Bald Head Island, North Carolina (Source: NCDMF 2002) Type Permits Commercial Fishing Vessel Registration 3 Dealer License 0 Flounder License 0 Land or Sell License 0 Non-resident Menhaden License 0 Ocean Fishing Pier License 0 Spotter Plane License 0 Retired Standard Commercial Fishing License 0 Standard Commercial Fishing License 2 Shellfish License 0 Recreational Fishing Tournament to Sell License 1 Total 6 24

32 2.3 Carolina Beach (28428) Community Description Carolina Beach Carolina Beach is situated along what is referred to as the Crystal Coast and has a storied history from Colonial times to the Civil War. Close to Wrightsville Beach, this community is not nearly as crowded or developed, but is still a major tourist destination that relies heavily on the charter boat industry. The municipal marina is where the charter and head boats are docked. Three head boats and three party/cruise boats and approximately 22 charters utilize the municipal marina. There are several bait & tackle shops nearby and there remains one commercial fish house in the community; out of at least five in the past. Five commercial vessels dock at the municipal marina. There are about eight seafood restaurants in the community and most of the hotels are independently owned rather than national chains. The area hosts three fishing tournaments each year: the Atlantic Anglers Spring Classic Surf Fishing Tournament in May, the East Coast Got-Em-On-Live-Bait Classic King 25
33 Mackerel Tournament by the in July, and the Carolina Beach Surf Fishing Tournament in October. The community also hosts an annual Fall Seafood, Blues and Jazz festival. 3 Carolina Beach s population has grown steadily since 1980 to over 4700 people in Housing tenure has grown in the area of owner occupied since 1990 and more people seem to be living in the same house as they did five years ago. The number of persons in the labor force has not changed much while unemployment has dropped from 1990 to 2000 (Table ). Racial percentages for the population have remained relatively stable with a predominantly White population according to Table Carolina Beach has over twenty vessels with federal permits and by far the majority of those vessels hold charter permits for both snapper grouper and coastal pelagics (Table ). Most of the employment for the zip code area is in fish and seafood (Table ) while the majority of the 184 state permits are for commercial fishing vessels at 84 (Table ). There are another 57 standard commercial fishing licenses and 22 shellfish licenses in Carolina Beach Carolina Beach Census Demographics Population Table Total Persons and Persons by Age category for Carolina Beach, North Carolina (Source U.S. Census Bureau & MARFIN Sociodemographic Database. Louisiana Population Data Center & National Marine Fisheries Service). Total Persons and Age Category Total Persons Persons Age Persons Age Persons Age Persons Age Persons Age Persons Age Persons Age Persons Age Persons Age Housing Tenure Table Housing Tenure for Carolina Beach, North Carolina (Source: U.S. Census Bureau). Percent Renter Occupied Percent Owner Occupied ( 26
34 Residence in 1985 and 1995 Table Residence in 1985 and 1995 for Carolina Beach, North Carolina (Source: U.S. Census Bureau). Different House Same County Same House Employment/Unemployment Table Employment and Unemployment for Carolina Beach, North Carolina (Source: U.S. Census Bureau). Persons 16 yrs and over Percent in labor force Percent unemployed Race Table Race for Carolina Beach, North Carolina (Source U.S. Census Bureau & MARFIN Sociodemographic Database. Louisiana Population Data Center & National Marine Fisheries Service). Race Black Persons Latino Black Persons Latino Persons White Persons Latino White Persons Education Table Years of Education by Category for those 25 Years and Older for Carolina Beach, North Carolina (Source: U.S. Census Bureau & MARFIN Sociodemographic Database. Louisiana Population Data Center & National Marine Fisheries Service). Education w/ 0-8 years education w/ 9-11 years education w/ HS diploma w/ years. education w/ College Degree Drop outs
35 Income and Poverty Table Average Household Wage/Salary and Persons Below the Poverty Level for Carolina Beach, North Carolina (Source: U.S. Census Bureau & MARFIN Sociodemographic Database. Louisiana Population Data Center & National Marine Fisheries Service). Wage or Salary Average Household Wage/Salary Income (dollars). $14147 $28055 $37662 Poverty Level Persons Below Poverty Level Age 65+ Below Poverty Level Households with Public Assistance Industry Table Employment by Industry for Carolina Beach, North Carolina (Source: U.S. Census Bureau & MARFIN Sociodemographic Database. Louisiana Population Data Center & National Marine Fisheries Service). Industry Agriculture, Fishing, Mining Construction Business Services Communication/Utilities Manufacturing Financial, Insurance & Real Estate Services Wholesale/Retail Trade Transportation Occupation Table Employment by Occupation for Carolina Beach, North Carolina (Source: U.S. Census Bureau & MARFIN Sociodemographic Database. Louisiana Population Data Center & National Marine Fisheries Service). Occupation Sales Clerical Craft Exec/Managerial Farm/Fish/Forest Household Services Laborer/Handler Operative/Transport Service, except Household Technical
36 2.3.3 Carolina Beach Fishing Demographics Table Number of Federal Permit by Type for Carolina Beach, North Carolina (Source: NMFS 2002) Type of Permit Total permitted vessels Commercial King Mackerel Commercial Spanish Mackerel Commercial Spiny Lobster Charter/Headboat for Coastal Pelagics Charter/Headboat for Snapper Grouper Snapper Grouper Class Snapper Grouper Class Swordfish Shark Rock Shrimp Federal Dealers Table Employment in Fishing Related Industry for Carolina Beach, North Carolina (Zip code Business Patterns, U.S. Census Bureau 1998) Category NAIC Code Number Employed Fishing Seafood Canning Seafood Processing Boat Building Fish and Seafoods Fish and Seafood Markets Marinas Total Fishing Employment 44 Table Number of State Permit by Type for Carolina Beach, North Carolina (Source: NCDMF 2002) Type Permits Commercial Fishing Vessel Registration 84 Dealer License 13 Flounder License 0 Land or Sell License 0 Non-resident Menhaden License 0 Ocean Fishing Pier License 1 Spotter Plane License 0 Retired Standard Commercial Fishing License 6 Standard Commercial Fishing License 57 Shellfish License 22 Recreational Fishing Tournament to Sell License 1 Total

37 2.4 Wilmington (28401,28403, 28405, 28411, 28412) Community Description Wilmington Wilmington was previously known as New Liverpool, New Town and Newton, and founded by a group of Englishmen, many of whom were maritime businessmen. Located on the Cape Fear River, the town became an important port, but growth was originally slow following the Revolutionary War because of a lack of decent roads and the long distance of the port from the mouth of the river. However, in the mid-1800s, the port began to develop into a center for exports with rice, peanuts, flax, cotton, and naval stores being shipped all over the world. With the advent of the Civil War the export trade in Wilmington halted, but the town gained prominence however as the lifeline of the Confederacy, involving itself in the blockade running/profiteering business. After the war, cotton exports were still an important commodity shipped from the port, but World War II brought a shift in 30
38 the economy with more of an emphasis upon ship building. Today, Wilmington continues to be an important port with the State s Port Authority located there. 4 The total number of persons living in Wilmington has grown steadily since the 1970s according to Table Housing tenure has not changed much with an almost even split between owner and renter occupied housing. Residence has changed to some degree with more people living in a different house outside the county, so the new migration from outside the county and state must be taking place. The percentage of people in the labor force has not changed much but unemployment has risen since 1990 from 3.8 to 8.6 in the year The population is still predominantly white, yet there is a substantial Black population that has historically been there. The poverty rate has dropped since 1970 when it was 25.2, but still remains at 18.8 percent for the year 2000 (Table ). As with most communities there has been a substantial drop in the number of those persons employed in the agriculture, fishing and mining category of industry as well as the category of farm, fish and forestry under occupation for Wilmington (Tables and ). Wilmington has had between 30 to 40 vessels with federal permits since 1998 and most of those have had permits to fish coastal pelagics and snapper grouper (Table ). There is considerable employment in the realm of fish and seafood and seafood markets, but the majority is in marinas and some also in boat building as reported in Table There were over 1000 state permits issued for Wilmington with the majority of those issued for commercial vessels. There were almost 300 standard commercial fishing licenses and 152 shellfish licenses sold for Wilmington residents. Over 50 dealer licenses were issued as were 6 recreational fishing tournaments to sell licenses (Table ) Wilmington Census Demographics Population Table Total Persons and Persons by Age category for Wilmington, North Carolina (Source U.S. Census Bureau & MARFIN Sociodemographic Database. Louisiana Population Data Center & National Marine Fisheries Service). Total Persons and Age Category Total Persons Persons Age Persons Age Persons Age Persons Age Persons Age Persons Age Persons Age Persons Age Persons Age
39 Housing Tenure Table Housing Tenure for Wilmington, North Carolina (Source: U.S. Census Bureau). Percent Renter Occupied Percent Owner Occupied Residence in 1985 and 1995 Table Residence in 1985 and 1995 for Wilmington, North Carolina (Source: U.S. Census Bureau). Different House Same County Same House Employment/Unemployment Table Employment and Unemployment for Wilmington, North Carolina (Source: U.S. Census Bureau). Persons 16 yrs and over Percent in labor force Percent unemployed Race Table Race for Wilmington, North Carolina (Source U.S. Census Bureau & MARFIN Sociodemographic Database. Louisiana Population Data Center & National Marine Fisheries Service). Race Black Persons Latino Black Persons Latino Persons White Persons Latino White Persons Education 32
40 Table Years of Education by Category for those 25 Years and Older for Wilmington, North Carolina (Source: U.S. Census Bureau & MARFIN Sociodemographic Database. Louisiana Population Data Center & National Marine Fisheries Service). Education w/ 0-8 years education w/ 9-11 years education w/ HS diploma w/ years. education w/ College Degree Drop outs Income and Poverty Table Average Household Wage/Salary and Persons Below the Poverty Level for Wilmington, North Carolina (Source: U.S. Census Bureau & MARFIN Sociodemographic Database. Louisiana Population Data Center & National Marine Fisheries Service). Wage or Salary Average Household Wage/Salary Income (dollars) $7151 $15057 $26529 $31099 Poverty Level Persons Below Poverty Level Age 65+ Below Poverty Level Households with Public Assistance Industry Table Employment by Industry for Wilmington, North Carolina (Source: U.S. Census Bureau & MARFIN Sociodemographic Database. Louisiana Population Data Center & National Marine Fisheries Service). Industry Agriculture, Fishing, Mining Construction Business Services Communication/Utilities Manufacturing Financial, Insurance & Real Estate Services Wholesale/Retail Trade Transportation
41 Occupation Table Employment by Occupation for Wilmington, North Carolina (Source: U.S. Census Bureau & MARFIN Sociodemographic Database. Louisiana Population Data Center & National Marine Fisheries Service). Occupation Sales Clerical Craft Exec/Managerial Farm/Fish/Forest Household Services Laborer/Handler Operative/Transport Service, except Household Technical Wilmington Fishing Demographics Table Number of Federal Permit by Type for Wilmington, North Carolina (Source: NMFS 2002) Type of Permit Total permitted vessels Commercial King Mackerel Commercial Spanish Mackerel Commercial Spiny Lobster Charter/Headboat for Coastal Pelagics Charter/Headboat for Snapper Grouper Snapper Grouper Class Snapper Grouper Class Swordfish Shark Rock Shrimp Federal Dealers Table Employment in Fishing Related Industry for Wilmington, North Carolina (Zip code Business Patterns, U.S. Census Bureau 1998) Category NAIC Code Number Employed Fishing Seafood Canning Seafood Processing Boat Building Fish and Seafoods Fish and Seafood Markets Marinas Total Fishing Employment
 Type Permits Commercial Fishing Vessel Registration 515 Dealer License 53 Flounder License 1 Land or Sell License")
42 Table Number of State Permit by Type for Wilmington, North Carolina (Source: NCDMF 2002) Type Permits Commercial Fishing Vessel Registration 515 Dealer License 53 Flounder License 1 Land or Sell License 0 Non-resident Menhaden License 0 Ocean Fishing Pier License 0 Spotter Plane License 0 Retired Standard Commercial Fishing License 44 Standard Commercial Fishing License 298 Shellfish License 152 Recreational Fishing Tournament to Sell License 6 Total Wrightsville Beach (28480) 35
43 2.5.1 Community Description Wrightsville Beach The town of Wrightsville Beach occupies one of the barrier islands along North Carolina s southeastern coast. Today, the island is 1,000 to 5,000 feet in width and stretches almost four miles from Masonboro Inlet on the south to Mason Inlet on the north. Originally the island was called New Hanover Banks, a sandy barrier island cut by the shallow Moor s Inlet. The northern part of the island was called Shell Island. Development of the island was slow due to the distance and lack of transportation other than boats. The island was once owned by the State of North Carolina until it was transferred into private hands in three separate grants between 1791 and One of the families who owned land was the Wright family, for which the island is named. For a century following, there were no residents on the island. However, hunters and fishermen were drawn to the area for the Spanish Mackerel and Blue Fish. Sailing also became popular around the area and frequent races led to the establishment of the Carolina Yacht Club in Members of the Carolina Yacht Club erected a clubhouse, which was the first structure built on what would be called Wrightsville Beach. The Club is recognized as the third oldest yacht club in the United States. A turnpike was completed in 1887, which connected Wilmington to Wrightsville Sound, and increased development and growth on the island. Also the Wilmington Seacoast Railroad Company extended its track from Wilmington to the island. More yacht clubs were established, along with beach cottages, hotels and local stores, leading the area to become a popular summer vacation spot. On March 6, 1889, the town of Wrightsville Beach was incorporated. A public pavilion was created in 1905 on the end of the rail line. This pavilion included a bowling alley, shooting gallery, movie theatre and snack bar. In 1935, a large two-lane bridge across the Intracoastal Waterway to Harbor Island, then over Bank s Channel to Wrightsville Beach. A population of about 110 year-round residents in 1930 grew to about 1500 in There has been a slight decline in the total population for Wrightsville Beach since Housing tenure has remained approximately the same with a slight increase in the number of owner occupied housing. There seems to be increased stability residence with more people living in the same house in 2000 than there were in 1990 in terms of percentage. The percentage of individuals in the labor force has remained about the same with a slight decrease and unemployment is relatively unchanged at 2.0 percent since The majority of the population remains White with slight increases in the number of Latinos and Blacks. Average wage or salary saw a significant increase from 1980 to 1990 but a much smaller increase in The poverty rate has remained around 9.0 percent throughout the last three decades. There has been a steady decrease in the number of vessels with federal permits from Wrightsville Beach with only 14 in 2001 and most of those permits have been for coastal pelagics (Table ). There are 5 federal dealers in the community and most of the fishing related employment has been in the marina sector according to Table There were 12 commercial vessels registered with the state and two dealers (Table )
44 2.5.2 Wrightsville Beach Census Demographics Population Table Total Persons and Persons by Age category for Wrightsville Beach, North Carolina (Source U.S. Census Bureau & MARFIN Sociodemographic Database. Louisiana Population Data Center & National Marine Fisheries Service). Total Persons and Age Category Total Persons Persons Age Persons Age Persons Age Persons Age Persons Age Persons Age Persons Age Persons Age Persons Age Housing Tenure Table Housing Tenure for Wrightsville Beach, North Carolina (Source: U.S. Census Bureau). Percent Renter Occupied Percent Owner Occupied Residence in 1985 and 1995 Table Residence in 1985 and 1995 for Wrightsville Beach, North Carolina (Source: U.S. Census Bureau). Different House Same County Same House Employment/Unemployment Table Employment and Unemployment for Wrightsville Beach, North Carolina (Source: U.S. Census Bureau). Persons 16 yrs and over Percent in labor force Percent unemployed
45 Race Table Race for Wrightsville Beach, North Carolina (Source U.S. Census Bureau & MARFIN Sociodemographic Database. Louisiana Population Data Center & National Marine Fisheries Service). Race Black Persons Latino Black Persons Latino Persons White Persons Latino White Persons Education Table Years of Education by Category for those 25 Years and Older for Wrightsville Beach, North Carolina (Source: U.S. Census Bureau & MARFIN Sociodemographic Database. Louisiana Population Data Center & National Marine Fisheries Service). Education w/ 0-8 years education w/ 9-11 years education w/ HS diploma w/ years. education w/ College Degree Drop outs Income and Poverty Table Average Household Wage/Salary and Persons Below the Poverty Level for Wrightsville Beach, North Carolina (Source: U.S. Census Bureau & MARFIN Sociodemographic Database. Louisiana Population Data Center & National Marine Fisheries Service). Wage or Salary Average Household Wage/Salary Income (dollars). $22649 $54474 $55903 Poverty Level Persons Below Poverty Level Age 65+ Below Poverty Level Households with Public Assistance
46 Industry Table Employment by Industry for Wrightsville Beach, North Carolina (Source: U.S. Census Bureau & MARFIN Sociodemographic Database. Louisiana Population Data Center & National Marine Fisheries Service). Industry Agriculture, Fishing, Mining Construction Business Services Communication/Utilities Manufacturing Financial, Insurance & Real Estate Services Wholesale/Retail Trade Transportation Occupation Table Employment by Occupation for Wrightsville Beach, North Carolina (Source: U.S. Census Bureau & MARFIN Sociodemographic Database. Louisiana Population Data Center & National Marine Fisheries Service). Occupation Sales Clerical Craft Exec/Managerial Farm/Fish/Forest Household Services Laborer/Handler Operative/Transport Service, except Household Technical Wrightsville Beach Fishing Demographics Table Number of Federal Permit by Type for Wrightsville Beach, North Carolina (Source: NMFS 2002) Type of Permit Total permitted vessels Commercial King Mackerel Commercial Spanish Mackerel Commercial Spiny Lobster Charter/Headboat for Coastal Pelagics Charter/Headboat for Snapper Grouper Snapper Grouper Class Snapper Grouper Class Swordfish Shark Rock Shrimp Federal Dealers
47 Table Employment in Fishing Related Industry for Wrightsville Beach, North Carolina (Zip code Business Patterns, U.S. Census Bureau 1998) Category NAIC Code Number Employed Fishing Seafood Canning Seafood Processing Boat Building Fish and Seafoods Fish and Seafood Markets Marinas Total Fishing Employment 44 Table Number of State Permit by Type for Wrightsville Beach, North Carolina (Source: NCDMF 2002) Type Permits Commercial Fishing Vessel Registration 12 Dealer License 2 Flounder License 0 Land or Sell License 0 Non-resident Menhaden License 0 Ocean Fishing Pier License 0 Spotter Plane License 0 Retired Standard Commercial Fishing License 2 Standard Commercial Fishing License 10 Shellfish License 0 Recreational Fishing Tournament to Sell License 0 Total 26 40

48 2.6 Surf City/Topsail Beach (28445) & Hampstead (28443) Community Description Surf City is located in Pender County and had at one time as many as seven long fishing piers. But, like Atlantic Beach and other places, hurricanes reduced that number to two. Fishing is still important but does not contribute as much to the economy as it once used to according to several key informants. There are still a few trawlers that dock here, but they are very small, inlet only trawlers. Most fishermen do not live on the island or in town, but live more inland in places like Hampstead and Holly Ridge. Several respondents commented that it is too expensive for anyone but northerners and tourists to live around the beach. Another factor that makes it hard to fish this area is because they are in the middle of the island, and it takes a long time to get out to the sound. It is 13 miles to the inlet from the inter-coastal waterway that they are on. There is only one fish market in the town today. According to one informant around 1940 to 1960 this place was a fisherman s paradise and there was so much business that the one fish house was open 24 hours a day. With the influx of outsiders, property values have increased making it difficult for fishermen to survive in this area. There are few commercial fishermen and few vessels in the 41
49 area today that call this community home. Where it once was a commercial fishing village, it has now become more of a tourist/recreational community according to some. 6 Hampstead is changing from a small fishing village into one of the fastest growing areas in North Carolina. Fishing is still a major piece of the area s identity. There are two wholesale-only fresh fish dealers in the town. One donates approximately 5,000 pounds of fish to the yearly seafood festival which is held in October. The annual Spot Festival celebrates fishing and the fish for which it is named. 7. Of the three communities listed, Topsail Beach is the only recognized Census Designated Place and therefore is the only one with census demographics reported. The population has seen a steady increase but remains relatively small with only 404 in the 2000 census. Housing tenure has remained relatively the same with three quarters of the housing owner occupied (Table ). Residence has changed little with slightly more people living in the same house as they did five years ago. The percentage of people in the labor force has also remained the same, as has the unemployment rate, which is very low at 0.5 percent (Table ). The population is almost entirely White with a few Latinos appearing in the 2000 census as shown in Table While Topsail Beach shows few federal or state permits (Tables and ), Hampstead does have more permits listed. Most federal permits that list Hampstead as homeport are either for coastal pelagics or snapper grouper (Table ). The majority of fishing related employment listed for Hampstead is in fish and seafood while both Topsail and Hampstead each show relatively little employment in fishing (Tables and ). Hampstead does have over 400 state permits issued with 212 being for commercial vessels and another 112 being standard commercial fishing licenses. There were 74 shellfish licenses issued and 23 dealers in the area (Table ) Topsail Beach Census Demographics Population Table Total Persons and Persons by Age category for Topsail Beach, North Carolina (Source U.S. Census Bureau & MARFIN Sociodemographic Database. Louisiana Population Data Center & National Marine Fisheries Service). Total Persons and Age Category Total Persons Persons Age Persons Age Persons Age Persons Age Persons Age Persons Age Persons Age Persons Age Persons Age Interviews conducted by Ana Pitchon, May
50 Housing Tenure Table Housing Tenure for Topsail Beach, North Carolina (Source: U.S. Census Bureau). Percent Renter Occupied Percent Owner Occupied Residence in 1985 and 1995 Table Residence in 1985 and 1995 for Topsail Beach, North Carolina (Source: U.S. Census Bureau). Different House Same County Same House Employment/Unemployment Table Employment and Unemployment for Topsail Beach, North Carolina (Source: U.S. Census Bureau). Persons 16 yrs and over Percent in labor force Percent unemployed Race Table Race for Topsail Beach, North Carolina (Source U.S. Census Bureau & MARFIN Sociodemographic Database. Louisiana Population Data Center & National Marine Fisheries Service). Race Black Persons Latino Black Persons Latino Persons White Persons Latino White Persons
51 Education Table Years of Education by Category for those 25 Years and Older for Topsail Beach, North Carolina (Source: U.S. Census Bureau & MARFIN Sociodemographic Database. Louisiana Population Data Center & National Marine Fisheries Service). Education w/ 0-8 years education w/ 9-11 years education w/ HS diploma w/ years. education w/ College Degree Drop outs Income and Poverty Table Average Household Wage/Salary and Persons Below the Poverty Level for Topsail Beach, North Carolina (Source: U.S. Census Bureau & MARFIN Sociodemographic Database. Louisiana Population Data Center & National Marine Fisheries Service). Wage or Salary Average Household Wage/Salary Income (dollars). $12739 $39762 $55750 Poverty Level Persons Below Poverty Level Age 65+ Below Poverty Level Households with Public Assistance Industry Table Employment by Industry for Topsail Beach, North Carolina (Source: U.S. Census Bureau & MARFIN Sociodemographic Database. Louisiana Population Data Center & National Marine Fisheries Service). Industry Agriculture, Fishing, Mining Construction Business Services Communication/Utilities Manufacturing Financial, Insurance & Real Estate Services Wholesale/Retail Trade Transportation
52 Occupation Table Employment by Occupation for Topsail Beach, North Carolina (Source: U.S. Census Bureau & MARFIN Sociodemographic Database. Louisiana Population Data Center & National Marine Fisheries Service). Occupation Sales Clerical Craft Exec/Managerial Farm/Fish/Forest Household Services Laborer/Handler Operative/Transport Service, except Household Technical Topsail Beach Fishing Demographics Table Number of Federal Permit by Type for Hampstead, North Carolina (Source: NMFS 2002) Type of Permit Total permitted vessels Commercial King Mackerel Commercial Spanish Mackerel Commercial Spiny Lobster Charter/Headboat for Coastal Pelagics Charter/Headboat for Snapper Grouper Snapper Grouper Class Snapper Grouper Class Swordfish Shark Rock Shrimp Federal Dealers 1 Table Employment in Fishing Related Industry for Hampstead, North Carolina (Zip code Business Patterns, U.S. Census Bureau 1998) Category NAIC Code Number Employed Fishing Seafood Canning Seafood Processing Boat Building Fish and Seafoods Fish and Seafood Markets Marinas Total Fishing Employment 64 45
53 Table Number of Federal Permit by Type for Topsail Beach, North Carolina (Source: NMFS 2002) Type of Permit Total permitted vessels Commercial King Mackerel Commercial Spanish Mackerel Commercial Spiny Lobster Charter/Headboat for Coastal Pelagics Charter/Headboat for Snapper Grouper Snapper Grouper Class Snapper Grouper Class Swordfish Shark Rock Shrimp Federal Dealers Table Employment in Fishing Related Industry for Topsail Beach, North Carolina (Zip code Business Patterns, U.S. Census Bureau 1998) Category NAIC Code Number Employed Fishing Seafood Canning Seafood Processing Boat Building Fish and Seafoods Fish and Seafood Markets Marinas Total Fishing Employment 10 Table Number of State Permit by Type for Hampstead, North Carolina (Source: NCDMF 2002) Type Permits Commercial Fishing Vessel Registration 212 Dealer License 23 Flounder License 0 Land or Sell License 0 Non-resident Menhaden License 0 Ocean Fishing Pier License 0 Spotter Plane License 0 Retired Standard Commercial Fishing License 15 Standard Commercial Fishing License 112 Shellfish License 74 Recreational Fishing Tournament to Sell License 0 Total
 Type Permits Commercial Fishing Vessel Registration 6 Dealer License 3 Flounder License 0 Land or Sell")
54 Table Number of State Permit by Type for Topsail Beach, North Carolina (Source: NCDMF 2002) Type Permits Commercial Fishing Vessel Registration 6 Dealer License 3 Flounder License 0 Land or Sell License 0 Non-resident Menhaden License 0 Ocean Fishing Pier License 1 Spotter Plane License 0 Retired Standard Commercial Fishing License 1 Standard Commercial Fishing License 4 Shellfish License 0 Recreational Fishing Tournament to Sell License 1 Total Sneads Ferry (28460) 47
55 2.7.1 Community Description The white rubber boots worn by commercial fishermen in this community and many other parts of North Carolina are commonly referred to as Snead s Ferry Sneakers. With such an icon named after the community it suggests the importance of commercial fishing to the area. Snead s Ferry is a small town with very little of the large-scale development that is evident elsewhere on the North Carolina coast. However, there are apparently more retirees moving here from places like Atlantic Beach because it is more affordable according to some individuals. Many houses in the community have fishing vessels docked in front of the house or on the lawn. Snead s Ferry s location is an advantage for fishermen, because the channel leads directly to the sound without having to travel through many creeks; this offers larger boats more accessibility. One respondent commented that at least half of the people in the community have something to do with the fishing industry. Others living in Surf City supposed that Snead s Ferry is now made up of at least 20% of residents who are either servicemen or who work on the base. Some of these individuals also shrimp at night or on the weekends. This is a source of resentment, because these people are no longer full time fishermen, and have more disposable income with which to purchase better equipment or simply have better standards of living. The community celebrates the Shrimp Festival each second weekend in August. 8 One fish house owner who has been working in Snead s Ferry for 12 years has 15 boats that sell to him and dock at his place of business, These fishermen do everything, including net fishing, crabbing, clamming, and shrimping. He commented that he doesn t see much of a future in fishing because younger people are not getting involved. This same individual commented that a lot of new people are moving in from other places and he considers it only a matter of years before his place sells. The fish house next door is for sale and he is just waiting for the right price, and he will sell, too. Most of the captains and crew live within two miles of his fish house and there does not seem to be a problem finding crew; primarily because they have worked in the industry for so long and most have been with the same captains for quite some time. He also commented that most of the fishermen in town are shrimpers and net fishermen who go out daily which allows them to be home at night and have a more stable life. 9 Snead s Ferry had 25 vessels with federal permits in 2001 and most vessels held snapper grouper class 1 and coastal pelagic permits (Table ). There were over 340 state commercial fishing vessel registrations for Snead s Ferry and among those there were 228 standard commercial fishing license. The community also had 2 recreational sell licenses (Table ). According to Table there was some seafood employment in other areas with 16 persons employed in fish and seafood and 2 in marinas. 8 Interviews conducted by Ana Pitchon, May Interviews conducted by Ana Pitchon, May
56 2.7.2 Sneads Ferry Census Demographics Population Table Total Persons and Persons by Age category for Sneads Ferry, North Carolina (Source U.S. Census Bureau & MARFIN Sociodemographic Database. Louisiana Population Data Center & National Marine Fisheries Service). Total Persons and Age Category Total Persons Persons Age Persons Age Persons Age Persons Age Persons Age Persons Age Persons Age Persons Age Persons Age Housing Tenure Table Housing Tenure for Sneads Ferry, North Carolina (Source: U.S. Census Bureau). Percent Renter Occupied Percent Owner Occupied Residence in 1985 and 1995 Table Residence in 1985 and 1995 for Sneads Ferry, North Carolina (Source: U.S. Census Bureau). Different House Same County Same House Employment/Unemployment Table Employment and Unemployment for Sneads Ferry, North Carolina (Source: U.S. Census Bureau). Persons 16 yrs and over Percent in labor force Percent unemployed
57 Race Table Race for Sneads Ferry, North Carolina (Source U.S. Census Bureau & MARFIN Sociodemographic Database. Louisiana Population Data Center & National Marine Fisheries Service). Race Black Persons Latino Black Persons Latino Persons White Persons Latino White Persons Education Table Years of Education by Category for those 25 Years and Older for Sneads Ferry, North Carolina (Source: U.S. Census Bureau & MARFIN Sociodemographic Database. Louisiana Population Data Center & National Marine Fisheries Service). Education w/ 0-8 years education w/ 9-11 years education w/ HS diploma w/ years. education w/ College Degree Drop outs Income and Poverty Table Average Household Wage/Salary and Persons Below the Poverty Level for Sneads Ferry, North Carolina (Source: U.S. Census Bureau & MARFIN Sociodemographic Database. Louisiana Population Data Center & National Marine Fisheries Service). Wage or Salary Average Household Wage/Salary Income (dollars).. $21901 $34509 Poverty Level Persons Below Poverty Level Age 65+ Below Poverty Level Households with Public Assistance
58 Industry Table Employment by Industry for Sneads Ferry, North Carolina (Source: U.S. Census Bureau & MARFIN Sociodemographic Database. Louisiana Population Data Center & National Marine Fisheries Service). Industry Agriculture, Fishing, Mining Construction Business Services Communication/Utilities Manufacturing Financial, Insurance & Real Estate Services Wholesale/Retail Trade Transportation Occupation Table Employment by Occupation for Sneads Ferry, North Carolina (Source: U.S. Census Bureau & MARFIN Sociodemographic Database. Louisiana Population Data Center & National Marine Fisheries Service). Occupation Sales Clerical Craft Exec/Managerial Farm/Fish/Forest Household Services Laborer/Handler Operative/Transport Service, except Household Technical
59 2.7.3 Sneads Ferry Fishing Demographics Table Number of Federal Permit by Type for Sneads Ferry, North Carolina (Source: NMFS 2002) Type of Permit Total permitted vessels Commercial King Mackerel Commercial Spanish Mackerel Commercial Spiny Lobster Charter/Headboat for Coastal Pelagics Charter/Headboat for Snapper Grouper Snapper Grouper Class Snapper Grouper Class Swordfish Shark Rock Shrimp Federal Dealers Table Employment in Fishing Related Industry for Sneads Ferry, North Carolina (Zip code Business Patterns, U.S. Census Bureau 1998) Category NAIC Code Number Employed Fishing Seafood Canning Seafood Processing Boat Building Fish and Seafoods Fish and Seafood Markets Marinas Total Fishing Employment 16 Table Number of State Permit by Type for Sneads Ferry, North Carolina (Source: NCDMF 2002) Type Permits Commercial Fishing Vessel Registration 347 Dealer License 18 Flounder License 3 Land or Sell License 0 Non-resident Menhaden License 0 Ocean Fishing Pier License 0 Spotter Plane License 0 Retired Standard Commercial Fishing License 28 Standard Commercial Fishing License 228 Shellfish License 169 Recreational Fishing Tournament to Sell License 2 Total

60 2.8 Swansboro Community Description Swansboro is supposedly the second oldest town in North Carolina. Settlement of the surrounding lands by English colonists probably was influenced by its proximity to Bogue Inlet and the White Oak River. Shipbuilding and the export of naval stores were the mainstays of the local economy. The town was a major port in the late eighteenth century, and relied mainly on ship building. The end of the Civil War brought a close to that prosperity and fishing became important socially and economically. 10 The community has a small historic section that has been well preserved with many old buildings still intact and restored, now used mostly for tourist shops. There are two fish houses with some small trawlers docked nearby. There are at least five seafood restaurants and two seafood markets. Though Swansboro has all the trappings of a fishing community, according to some, it is more a tourist community now. According to one fisherman, from Swansboro, the community was much
61 more of a fishing town around ten years ago when there was close to double the fleet. Shrimping has experienced a recent downturn because imports with lower prices have affected the market. Because of the costs involved, local shrimp are more expensive and they are not as big, therefore more and more people are buying imports according to one individual. There are two main docks in the community, one has three trawlers and the other has two. Almost all captains and crew live in town, although crew may come from other places, fishing has always been a family business in Swansboro. There are a few charter businesses in town with one in particular that has a seafood market, a head boat and one charter. 11 Most of the ten federally permitted vessels in Swansboro have coastal pelagic permits and snapper grouper class 1, with about half of those vessels also holding charter permits for those species (Table ). Much of the employment according to census zip code data is in marinas with a few employed in fish and seafood (Table ). There were over 170 state-permitted vessels with 96 standard commercial licenses and over 100 shellfish licenses according to Table , and 2 recreational tournament sell licenses Swansboro Census Demographics Population Table Total Persons and Persons by Age category for Swansboro, North Carolina (Source U.S. Census Bureau & MARFIN Sociodemographic Database. Louisiana Population Data Center & National Marine Fisheries Service). Total Persons and Age Category Total Persons Persons Age Persons Age Persons Age Persons Age Persons Age Persons Age Persons Age Persons Age Persons Age Housing Tenure Table Housing Tenure for Swansboro, North Carolina (Source: U.S. Census Bureau). Percent Renter Occupied Percent Owner Occupied Interviews conducted by Ana Pitchon, May
62 Residence in 1985 and 1995 Table Residence in 1985 and 1995 for Swansboro, North Carolina (Source: U.S. Census Bureau). Different House Same County Same House Employment/Unemployment Table Employment and Unemployment for Swansboro, North Carolina (Source: U.S. Census Bureau). Persons 16 yrs and over Percent in labor force Percent unemployed Race Table Race for Swansboro, North Carolina (Source U.S. Census Bureau & MARFIN Sociodemographic Database. Louisiana Population Data Center & National Marine Fisheries Service). Race Black Persons Latino Black Persons Latino Persons White Persons Latino White Persons Education Table Years of Education by Category for those 25 Years and Older for Swansboro, North Carolina (Source: U.S. Census Bureau & MARFIN Sociodemographic Database. Louisiana Population Data Center & National Marine Fisheries Service). Education w/ 0-8 years education w/ 9-11 years education w/ HS diploma w/ years. education w/ College Degree Drop outs
63 Income and Poverty Table Average Household Wage/Salary and Persons Below the Poverty Level for Swansboro, North Carolina (Source: U.S. Census Bureau & MARFIN Sociodemographic Database. Louisiana Population Data Center & National Marine Fisheries Service). Wage or Salary Average Household Wage/Salary Income (dollars). $17162 $25410 $37740 Poverty Level Persons Below Poverty Level Age 65+ Below Poverty Level Households with Public Assistance Industry Table Employment by Industry for Swansboro, North Carolina (Source: U.S. Census Bureau & MARFIN Sociodemographic Database. Louisiana Population Data Center & National Marine Fisheries Service). Industry Agriculture, Fishing, Mining Construction Business Services Communication/Utilities Manufacturing Financial, Insurance & Real Estate Services Wholesale/Retail Trade Transportation Occupation Table Employment by Occupation for Swansboro, North Carolina (Source: U.S. Census Bureau & MARFIN Sociodemographic Database. Louisiana Population Data Center & National Marine Fisheries Service). Occupation Sales Clerical Craft Exec/Managerial Farm/Fish/Forest Household Services Laborer/Handler Operative/Transport Service, except Household Technical
64 2.8.3 Swansboro Fishing Demographics Table Number of Federal Permit by Type for Swansboro, North Carolina (Source: NMFS 2002) Type of Permit Total permitted vessels Commercial King Mackerel Commercial Spanish Mackerel Commercial Spiny Lobster Charter/Headboat for Coastal Pelagics Charter/Headboat for Snapper Grouper Snapper Grouper Class Snapper Grouper Class Swordfish Shark Rock Shrimp Federal Dealers Table Employment in Fishing Related Industry for Swansboro, North Carolina (Zip code Business Patterns, U.S. Census Bureau 1998) Category NAIC Code Number Employed Fishing Seafood Canning Seafood Processing Boat Building Fish and Seafoods Fish and Seafood Markets Marinas Total Fishing Employment 20 Table Number of State Permit by Type for Swansboro, North Carolina (Source: NCDMF 2002) Type Permits Commercial Fishing Vessel Registration 171 Dealer License 15 Flounder License 0 Land or Sell License 0 Non-resident Menhaden License 0 Ocean Fishing Pier License 0 Spotter Plane License 0 Retired Standard Commercial Fishing License 0 Standard Commercial Fishing License 92 Shellfish License 106 Recreational Fishing Tournament to Sell License 2 Total

65 2.9 Atlantic Beach (28512) Community Description Atlantic Beach has been a popular resort town since the 1870s. The first bathing pavilion was built on Bogue Banks in Other resorts and tourism related development occurred over the next century and the area remains today a popular vacation destination. 12 Today there is a boardwalk with rides, a video arcade, shops, restaurants, etc., along the waterfront. The beach is the primary attraction and there is a defined seasonal tourism during the summer months. There is a small marina in the community, with charter boats, but there is no commercial fishing out of Atlantic Beach. There are about charter boats total, according to one respondent. Some boats that advertise as being from Atlantic Beach actually dock in Morehead. The charter business is also very seasonal, and there seems to be plenty of competition. During the off season, charter fishermen take on other jobs, like carpentry or anything they can find Interviews conducted by Ana Pitchon, May
66 The number of federally permitted vessels in Atlantic Beach has decreased over the years to where today there are only 11. Most of those have coastal pelagic, snapper grouper class 1 and charter permits for both coastal pelagic and snapper grouper (Table ). There are, however, over 50 state commercially registered vessels and 47 standard commercial fishing licenses (Table ). Salter Path/Indian Beach area is south of Atlantic Beach and may have more fishing related businesses than Atlantic Beach. There are five or more seafood restaurants and several fish houses that sell retail and wholesale seafood. The community has many hotels and also a miniature golf course. A small area along the creek is where most of the fish houses and restaurants are located. One individual commented that most people make their living from seafood here, yet most fishermen have other jobs and their wives work because it is difficult to make a living solely from the fishing industry year round. Another commented that Salter Path used to be a fishing community with shrimp boats, net fishing, clam and scallop, but there is no offshore fishing from the area. Overall, this area has become more dependent upon tourism and the associated service economy. 14 Salter Path has 73 state registered commercial vessels and 54 standard commercial licenses issued for the year There were also 9 dealer licenses for the community (Table ) Atlantic Beach Census Demographics Population Table Total Persons and Persons by Age category for Atlantic Beach, North Carolina (Source U.S. Census Bureau & MARFIN Sociodemographic Database. Louisiana Population Data Center & National Marine Fisheries Service). Total Persons and Age Category Total Persons Persons Age Persons Age Persons Age Persons Age Persons Age Persons Age Persons Age Persons Age Persons Age Interviews conducted by Ana Pitchon, May
67 Housing Tenure Table Housing Tenure for Atlantic Beach, North Carolina (Source: U.S. Census Bureau). Percent Rent Percent Own Residence in 1985 and 1995 Table Residence in 1985 and 1995 for Atlantic Beach, North Carolina (Source: U.S. Census Bureau). Different House Same County Same House Employment/Unemployment Table Employment and Unemployment for Atlantic Beach, North Carolina (Source: U.S. Census Bureau). Persons 16 yrs and over Percent in labor force Percent unemployed Race Table Race for Atlantic Beach, North Carolina (Source U.S. Census Bureau & MARFIN Sociodemographic Database. Louisiana Population Data Center & National Marine Fisheries Service). Race Black Persons Latino Black Persons Latino Persons White Persons Latino White Persons
68 Education Table Years of Education by Category for those 25 Years and Older for Atlantic Beach, North Carolina (Source: U.S. Census Bureau & MARFIN Sociodemographic Database. Louisiana Population Data Center & National Marine Fisheries Service). Education w/ 0-8 years education w/ 9-11 years education w/ HS diploma w/ years. education w/ College Degree Drop outs Income and Poverty Table Average Household Wage/Salary and Persons Below the Poverty Level for Atlantic Beach, North Carolina (Source: U.S. Census Bureau & MARFIN Sociodemographic Database. Louisiana Population Data Center & National Marine Fisheries Service). Wage or Salary Average Household Wage/Salary Income (dollars). $15156 $30093 $38313 Poverty Level Persons Below Poverty Level Age 65+ Below Poverty Level Households with Public Assistance Industry Table Employment by Industry for Atlantic Beach, North Carolina (Source: U.S. Census Bureau & MARFIN Sociodemographic Database. Louisiana Population Data Center & National Marine Fisheries Service). Industry Agriculture, Fishing, Mining Construction Business Services Communication/Utilities Manufacturing Financial, Insurance & Real Estate Services Wholesale/Retail Trade Transportation
69 Occupation Table Employment by Occupation for Atlantic Beach, North Carolina (Source: U.S. Census Bureau & MARFIN Sociodemographic Database. Louisiana Population Data Center & National Marine Fisheries Service). Occupation Sales Clerical Craft Exec/Managerial Farm/Fish/Forest Household Services Laborer/Handler Operative/Transport Service, except Household Technical Atlantic Beach Fishing Demographics Table Number of Federal Permit by Type for Atlantic Beach, North Carolina (Source: NMFS 2002) Type of Permit Total permitted vessels Commercial King Mackerel Commercial Spanish Mackerel Commercial Spiny Lobster Charter/Headboat for Coastal Pelagics Charter/Headboat for Snapper Grouper Snapper Grouper Class Snapper Grouper Class Swordfish Shark Rock Shrimp Federal Dealers Table Employment in Fishing Related Industry for Atlantic Beach, North Carolina (Zip code Business Patterns, U.S. Census Bureau 1998) Category NAIC Code Number Employed Fishing Seafood Canning Seafood Processing Boat Building Fish and Seafoods Fish and Seafood Markets Marinas Total Fishing Employment 60 62
70 Table Number of State Permit by Type for Atlantic Beach, North Carolina (Source: NCDMF 2002) Type Permits Commercial Fishing Vessel Registration 56 Dealer License 10 Flounder License 0 Land or Sell License 0 Non-resident Menhaden License 0 Ocean Fishing Pier License 5 Spotter Plane License 0 Retired Standard Commercial Fishing License 5 Standard Commercial Fishing License 42 Shellfish License 6 Recreational Fishing Tournament to Sell License 2 Total 126 Table Number of State Permit by Type for Salter Path, North Carolina (Source: NCDMF 2002) Type Permits Commercial Fishing Vessel Registration 73 Dealer License 9 Flounder License 1 Land or Sell License 0 Non-resident Menhaden License 0 Ocean Fishing Pier License 0 Spotter Plane License 0 Retired Standard Commercial Fishing License 4 Standard Commercial Fishing License 54 Shellfish License 17 Recreational Fishing Tournament to Sell License 0 Total

71 2.10 Morehead City (28557) Community Description Morehead City was founded in the 1840s and soon had a railroad line that connected its deep-water harbor with inland markets. Following several severe hurricanes during the 1880s and 1890s, fishermen who had lived on Shackleford Banks moved their houses by boat onto the mainland in the areas between 10th and 15th Streets. They called this area the Promise Land and it became the nucleus of the fishing industry that continues to be an important part of the economy of Morehead City. In recent years, a large charter-fishing fleet has developed, and Morehead City has become widely known as a center for sport and tournament fishing, drawing fishermen from all over the eastern United States. It is the location of one of the major, annual international Blue Marlin tournaments, as well as other fishing tournaments
72 Today Morehead City has a community college, several strip malls and commercial enterprises. There is a coastal theme to many of the businesses and art galleries, with a focus on tourism. The waterfront is small but crowded with several tourist attractions and numerous charter boats. According to one captain of a charter boat, the best fishing area on the NC coast is miles offshore of here. The Big Rock Marlin tournament held the second week in June is the biggest paying tournament on the East Coast. The tournament brings approximately 200 boats to the area. With an estimated four people per boat plus families, the tournament generates considerable economic benefit to the community. Many of the local charter boats are chartered for this tournament, which has an entry fee of $12,000 per person. There are also several small tournaments held in the community during the mackerel and marlin season. While there are no local fishing clubs, the Raleigh Sport Fishing Alliance is a regional fishing club with many of its members fishing out of Morehead City. One charter crew member said that he commercial fished for 21 years, but tired of weather problems and the feast or famine economy of commercial fishing. He said he had seen some commercial fishermen go out by themselves in any kind of weather because they couldn t find crew members, just to survive. He also mentioned that there are good crew around that migrate up and down the coast according to work. 16 There were 22 federally permitted vessels homeported in Morehead City, most of them with coastal pelagic and snapper grouper class 1 permits (Table ). About half held charter permits for both species groups. There are about 100 people employed in fishing related business according to census business figures in Table About half of those are in marinas and 36 are employed in fish and seafood business. Over 200 state commercial vessel licenses were issued for Morehead City and 150 standard commercial fishing permits. There were 53 shellfish licenses and 14 dealer licenses issued by the state (Table ). 16 Interviews conducted by Ana Pitchon, May
73 Morehead City Census Demographics Population Table Total Persons and Persons by Age category for Morehead City, North Carolina (Source U.S. Census Bureau & MARFIN Sociodemographic Database. Louisiana Population Data Center & National Marine Fisheries Service). Total Persons and Age Category Total Persons Persons Age Persons Age Persons Age Persons Age Persons Age Persons Age Persons Age Persons Age Persons Age Housing Tenure Table Housing Tenure for Morehead City, North Carolina (Source: U.S. Census Bureau). Percent Rent Percent Own Residence in 1985 and 1995 Table Residence in 1985 and 1995 for Morehead City, North Carolina (Source: U.S. Census Bureau). Different House Same County Same House
74 Employment/Unemployment Table Employment and Unemployment for Morehead City, North Carolina (Source: U.S. Census Bureau). Persons 16 yrs and over Percent in labor force Percent unemployed Race Table Race for Morehead City, North Carolina (Source U.S. Census Bureau & MARFIN Sociodemographic Database. Louisiana Population Data Center & National Marine Fisheries Service). Race Black Persons Latino Black Persons Latino Persons White Persons Latino White Persons Education Table Years of Education by Category for those 25 Years and Older for Morehead City, North Carolina (Source: U.S. Census Bureau & MARFIN Sociodemographic Database. Louisiana Population Data Center & National Marine Fisheries Service). Education w/ 0-8 years education w/ 9-11 years education w/ HS diploma w/ years. education w/ College Degree Drop outs
75 Income and Poverty Table Average Household Wage/Salary and Persons Below the Poverty Level for Morehead City, North Carolina (Source: U.S. Census Bureau & MARFIN Sociodemographic Database. Louisiana Population Data Center & National Marine Fisheries Service). Wage or Salary Average Household Wage/Salary Income (dollars) $6676 $13267 $22827 $28737 Poverty Level Persons Below Poverty Level Age 65+ Below Poverty Level Households with Public Assistance Industry Table Employment by Industry for Morehead City, North Carolina (Source: U.S. Census Bureau & MARFIN Sociodemographic Database. Louisiana Population Data Center & National Marine Fisheries Service). Industry Agriculture, Fishing, Mining Construction Business Services Communication/Utilities Manufacturing Financial, Insurance & Real Estate Services Wholesale/Retail Trade Transportation Occupation Table Employment by Occupation for Morehead City, North Carolina (Source: U.S. Census Bureau & MARFIN Sociodemographic Database. Louisiana Population Data Center & National Marine Fisheries Service). Occupation Sales Clerical Craft Exec/Managerial Farm/Fish/Forest Household Services Laborer/Handler Operative/Transport Service, except Household Technical
76 Morehead City Fishing Demographics Table Number of Federal Permit by Type for Morehead City, North Carolina (Source: NMFS 2002) Type of Permit Total permitted vessels Commercial King Mackerel Commercial Spanish Mackerel Commercial Spiny Lobster Charter/Headboat for Coastal Pelagics Charter/Headboat for Snapper Grouper Snapper Grouper Class Snapper Grouper Class Swordfish Shark Rock Shrimp Federal Dealers Table Employment in Fishing Related Industry for Morehead City, North Carolina (Zip code Business Patterns, U.S. Census Bureau 1998) Category NAIC Code Number Employed Fishing Seafood Canning Seafood Processing Boat Building Fish and Seafoods Fish and Seafood Markets Marinas Total Fishing Employment 100 Table Number of State Permit by Type for Morehead City, North Carolina (Source: NCDMF 2002) Type Permits Commercial Fishing Vessel Registration 211 Dealer License 14 Flounder License 0 Land or Sell License 0 Non-resident Menhaden License 0 Ocean Fishing Pier License 0 Spotter Plane License 0 Retired Standard Commercial Fishing License 19 Standard Commercial Fishing License 150 Shellfish License 53 Recreational Fishing Tournament to Sell License 2 Total

77 2.11 Beaufort (28516) Community Description Beaufort was built on a former Native American village, called Warelock which means fish town or fishing village, near Cape Lookout and borders the southern portion of the Outer Banks. Its deep water harbor is home to vessels of all sizes and its marinas are a favorite stop-over for transient boaters. Originally a fishing village and port of safety, it was known as "Fishtowne" until incorporated in A whaling community, Diamond City, was located on Shackleford Banks, six miles to the southeast by boat during the eighteenth and nineteenth centuries. Lumber, barrel staves, rum, and molasses comprised some of Beaufort's main exports. However, when the port declined as a trade center, commercial fishing gained greater importance and became the primary
78 economic activity of the town. Beaufort served as home port for a large menhaden fishing fleet and had numerous processing facilities for menhaden products. 18 Today, tourism, service industries, retail businesses and construction are important mainstays of the area, with many shops and restaurants catering to visitors from outside the area. The community has some exclusive homes along the waterfront but overall most housing is modest. It is home to both the NOAA Center for Coastal Fisheries and Habitat Research and Duke Marine Sciences Center. Directly across the bridge from Morehead city is Radio Island, which is the commercial fishing hub for Beaufort. There are a few private boats along the waterfront in downtown Beaufort, but the commercial enterprises are predominantly located on Radio Island. The waterfront does have two tour/party boats, in addition to private boats, some of which may be smaller charter vessels. There are several marinas in the community and several businesses that provide support services for both the recreational and commercial fishing industries. According to one individual, Beaufort is a commercial fishing community, although less so now, than in the past. This seems to be largely due to fewer young people getting into the fishing business as it does not seem to pay well. This same individual has seven trawlers and four small snapper/grouper boats as part of his business. During the summer three longline vessels travel from New York and dock at his facility. The majority of fish they purchase is marketed in Virginia and farther north. Shrimp is a large part of the seafood industry here, but, imports are having an impact on the domestic market lowering prices. His facility is a full service fish house, with processing, ice, fuel, and its own net repair. There was, at one time, an ice plant across the bridge, which has now become a condominium development. The last shad factory in the state is located on Front St. in Beaufort. At the time, there were only two shad vessels left in the state, and they are there, too. Shad built the fishing industry in Beaufort. He said that people are trying to put them (the Shad company) out of business because their property is valuable. He estimates that on Radio Island there are 20 trawlers that dock there permanently. Another individual said that his fish house used to process year round, but now only operates seven months of the year due to closures. They used to have four employees, but now employ only two. It was in1987 that Beaufort had its best year for shrimp. According to this individual most people involved in the fishery live in Beaufort or Morehead City. There are three fish houses in Beaufort, one of which deals primarily in bait. In 1987 there were about 25 larger commercial vessels (70-90 ) in addition to a lot of smaller boats; now there are approximately 11 large commercial vessels in Beaufort. 19 There were only 10 federally permitted vessels in Beaufort in 2001and those vessels held primarily coastal pelagic permits (Table ). Most of the employment that is fishing related according to census business pattern data is related to boat building with 184 persons employed in that business. Others are employed in fish processing and fish and seafood according to Table There are over 400 commercial vessels registered with the state from Beaufort with almost 300 standard commercial fishing licenses. There are 172 shellfish licenses and 32 dealer license (Table ) Interviews conducted by Ana Pitchon, May
79 Beaufort Census Demographics Population Table Total Persons and Persons by Age category for Beaufort, North Carolina (Source U.S. Census Bureau & MARFIN Sociodemographic Database. Louisiana Population Data Center & National Marine Fisheries Service). Total Persons and Age Category Total Persons Persons Age Persons Age Persons Age Persons Age Persons Age Persons Age Persons Age Persons Age Persons Age Housing Tenure Table Housing Tenure for Beaufort, North Carolina (Source: U.S. Census Bureau). Percent Rent Percent Own Residence in 1985 and 1995 Table Residence in 1985 and 1995 for Beaufort, North Carolina (Source: U.S. Census Bureau). Different House Same County Same House Employment/Unemployment Table Employment and Unemployment for Beaufort, North Carolina (Source: U.S. Census Bureau). Persons 16 yrs and over Percent in labor force Percent unemployed
80 Race Table Race for Beaufort, North Carolina (Source U.S. Census Bureau & MARFIN Sociodemographic Database. Louisiana Population Data Center & National Marine Fisheries Service). Race Black Persons Latino Black Persons Latino Persons White Persons Latino White Persons Education Table Years of Education by Category for those 25 Years and Older for Beaufort, North Carolina (Source: U.S. Census Bureau & MARFIN Sociodemographic Database. Louisiana Population Data Center & National Marine Fisheries Service). Education w/ 0-8 years education w/ 9-11 years education w/ HS diploma w/ years. education w/ College Degree Drop outs Income and Poverty Table Average Household Wage/Salary and Persons Below the Poverty Level for Beaufort, North Carolina (Source: U.S. Census Bureau & MARFIN Sociodemographic Database. Louisiana Population Data Center & National Marine Fisheries Service). Wage or Salary Average Household Wage/Salary Income (dollars) $6803 $13988 $23933 $28763 Poverty Level Persons Below Poverty Level Age 65+ Below Poverty Level Households with Public Assistance
81 Industry Table Employment by Industry for Beaufort, North Carolina (Source: U.S. Census Bureau & MARFIN Sociodemographic Database. Louisiana Population Data Center & National Marine Fisheries Service). Industry Agriculture, Fishing, Mining Construction Business Services Communication/Utilities Manufacturing Financial, Insurance & Real Estate Services Wholesale/Retail Trade Transportation Occupation Table Employment by Occupation for Beaufort, North Carolina (Source: U.S. Census Bureau & MARFIN Sociodemographic Database. Louisiana Population Data Center & National Marine Fisheries Service). Occupation Sales Clerical Craft Exec/Managerial Farm/Fish/Forest Household Services Laborer/Handler Operative/Transport Service, except Household Technical Beaufort Fishing Demographics Table Number of Federal Permit by Type for Beaufort, North Carolina (Source: NMFS 2002) Type of Permit Total permitted vessels Commercial King Mackerel Commercial Spanish Mackerel Commercial Spiny Lobster Charter/Headboat for Coastal Pelagics Charter/Headboat for Snapper Grouper Snapper Grouper Class Snapper Grouper Class Swordfish Shark Rock Shrimp Federal Dealers
82 Table Employment in Fishing Related Industry for Beaufort, North Carolina (Zip code Business Patterns, U.S. Census Bureau 1998) Category NAIC Code Number Employed Fishing Seafood Canning Seafood Processing Boat Building Fish and Seafoods Fish and Seafood Markets Marinas Total Fishing Employment 300 Table Number of State Permit by Type for Beaufort, North Carolina (Source: NCDMF 2002) Type Permits Commercial Fishing Vessel Registration 430 Dealer License 32 Flounder License 21 Land or Sell License 0 Non-resident Menhaden License 0 Ocean Fishing Pier License 0 Spotter Plane License 1 Retired Standard Commercial Fishing License 37 Standard Commercial Fishing License 294 Shellfish License 178 Recreational Fishing Tournament to Sell License 1 Total

83 2.12 Harker s Island (28531) Community Description Harker s Island has a small marina at the entrance to the island where approximately nine small trawlers dock. The island does not seem to have seen the same residential development that many other coastal communities have, although it has reportedly been discovered by outsiders who are using it as a retirement destination. Fishermen on Cedar Island that were interviewed indicated that many of the locals from Harker s Island have moved to Gloucester because of high property taxes. A few individuals consider Harker s Island a fishing community, even though landings are not nearly as high as in the past. Increasingly, there are more part-time fishermen, whereas in the past most were full-time. Accordingly, most have other jobs in order to make a living and fishing is to supplement income or solely more of a recreational endeavor. The hardcore old-timers who were the fishing mainstay on the island are too old and can t fish anymore or have passed away. Approximately one quarter of the island residents are full or part-time commercial fishermen according to several individuals. The island is also known for its boat building. 76
84 Ten years ago the island s economy was split evenly between fishing and tourism according to one individual, but more recently tourism has become the dominant industry. Rising property values have made it difficult for second and third generation islanders to remain. Recently, some undeveloped lots have been priced at or near $125,000; in addition property taxes seem to double every few years according to that individual. Locals are slowly being pushed from their heritage (commercial fishing), because they cannot afford the higher costs of living associated with the demographic shift when those of a higher socioeconomic class move to the area and are willing pay higher prices for land and housing. Imports are also taking a toll on the fishing industry as the domestic seafood has to compete with cheaper imports. The majority of the boats built in the past were commercial and made of wood; today there are more, larger sport and head boats that are often built in Florida or other states. It is estimated that there are approximately 25 trawlers in the area today. There is some long hauling that is also done by some, where two boats pull a net with 5-8 men per boat. 20 There are only 8 vessels homeported in Harker s Island with federal permits (Table ) and most of those hold coastal pelagic permits and snapper grouper class 1. This does not include shrimp vessels unless they have other permits. There are over 170 commercial vessels with state licenses according to Table , with 96 standard commercial licenses and 68 shellfish licenses. Most of the fishing related employment according to census zip code business patterns in Table is in the boat building sector Harker s Island Census Demographics Population Table Total Persons and Persons by Age category for Harker s Island, North Carolina (Source U.S. Census Bureau & MARFIN Sociodemographic Database. Louisiana Population Data Center & National Marine Fisheries Service). Total Persons and Age Category Total Persons Persons Age Persons Age Persons Age Persons Age Persons Age Persons Age Persons Age Persons Age Persons Age Interviews conducted by Ana Pitchon, May
85 Housing Tenure Table Housing Tenure for Harker s Island, North Carolina (Source: U.S. Census Bureau). Percemt Rent Percent Own Residence in 1985 and 1995 Table Residence in 1985 and 1995 for Harker s Island, North Carolina (Source: U.S. Census Bureau). Different House Same County Same House Employment/Unemployment Table Employment and Unemployment for Harker s Island, North Carolina (Source: U.S. Census Bureau). Persons 16 yrs and over Percent in labor force Percent unemployed Race Table Race for Harker s Island, North Carolina (Source U.S. Census Bureau & MARFIN Sociodemographic Database. Louisiana Population Data Center & National Marine Fisheries Service). Race Black Persons Latino Black Persons Latino Persons White Persons Latino White Persons
86 Education Table Years of Education by Category for those 25 Years and Older for Harker s Island, North Carolina (Source: U.S. Census Bureau & MARFIN Sociodemographic Database. Louisiana Population Data Center & National Marine Fisheries Service). Education w/ 0-8 years education w/ 9-11 years education w/ HS diploma w/ years. education w/ College Degree Drop outs Income and Poverty Table Average Household Wage/Salary and Persons Below the Poverty Level for Harker s Island, North Carolina (Source: U.S. Census Bureau & MARFIN Sociodemographic Database. Louisiana Population Data Center & National Marine Fisheries Service). Wage or Salary Average Household Wage/Salary Income (dollars). $13099 $22808 $33125 Poverty Level Persons Below Poverty Level Age 65+ Below Poverty Level Households with Public Assistance Industry Table Employment by Industry for Harker s Island, North Carolina (Source: U.S. Census Bureau & MARFIN Sociodemographic Database. Louisiana Population Data Center & National Marine Fisheries Service). Industry Agriculture, Fishing, Mining Construction Business Services Communication/Utilities Manufacturing Financial, Insurance & Real Estate Services Wholesale/Retail Trade Transportation
87 Occupation Table Employment by Occupation for Harker s Island, North Carolina (Source: U.S. Census Bureau & MARFIN Sociodemographic Database. Louisiana Population Data Center & National Marine Fisheries Service). Occupation Sales Clerical Craft Exec/Managerial Farm/Fish/Forest Household Services Laborer/Handler Operative/Transport Service, except Household Technical Harker s Island Fishing Demographics Table Number of Federal Permit by Type for Harker s Island, North Carolina (Source: NMFS 2002) Type of Permit Total permitted vessels Commercial King Mackerel Commercial Spanish Mackerel Commercial Spiny Lobster Charter/Headboat for Coastal Pelagics Charter/Headboat for Snapper Grouper Snapper Grouper Class Snapper Grouper Class Swordfish Shark Rock Shrimp Federal Dealers Table Employment in Fishing Related Industry for Harker s Island, North Carolina (Zip code Business Patterns, U.S. Census Bureau 1998) Category NAIC Code Number Employed Fishing Seafood Canning Seafood Processing Boat Building Fish and Seafoods Fish and Seafood Markets Marinas Total Fishing Employment 32 80
 Type Permits Commercial Fishing Vessel Registration 179 Dealer License 12 Flounder License 2 Land or Sell")
88 Table Number of State Permit by Type for Harker s Island, North Carolina (Source: NCDMF 2002) Type Permits Commercial Fishing Vessel Registration 179 Dealer License 12 Flounder License 2 Land or Sell License 0 Non-resident Menhaden License 0 Ocean Fishing Pier License 0 Spotter Plane License 1 Retired Standard Commercial Fishing License 31 Standard Commercial Fishing License 93 Shellfish License 68 Recreational Fishing Tournament to Sell License 0 Total Hatteras (27959) 81
89 Community Description Hatteras is located on the southern end of Hatteras Island on North Carolina's Outer Banks. The isolation of the community adds to the local character. Hatteras has historically been a seaport community with whaling an important part of the economy in its early history. Since World War II, the economy of the Hatteras community has depended on charter and commercial fishing. More recently, tourism has become an increasingly important economic activity (McCay and Cieri 2000). The entire north end of Hatteras Island was once known as Chicamacomico, but in 1874, the postal service changed the name to Rodanthe. 21 In earlier times, the Italian explorer Amerigo Vespucci landed in the area in the 16 th Century. Centuries later, in 1858, the island became a popular fishing and shipping village and a post office was established. In 1861, Confederates troops landed on the northern end of the island to re-take Fort Hatteras and Fort Clark, which had fallen to the Union s first naval invasion of the South. After the Civil War, development began to increase on the island and the Durant s lifesaving station was built in By the turn of the century, a US weather station was established on the island and in the mid-1930s the Army Corps of Engineers had dredged a deep channel which allowed for better access from Pamlico Sound to Hatteras Inlet. Soon after, a sizable fishing fleet was established at Hatteras. During World War II, the area was known as Torpedo Junction due to more than 100 ships that were lost due to German submarines. 22 Hatteras Village is a small and quiet town surrounded by coast on either side. It is located next to a state park with a historic lighthouse. Hatteras is host to several prestigious fishing tournaments and is homeport for the island's famous charter fishing fleet. In addition, there are numerous restaurants that offer fresh caught seafood. There were as many as 10 or 12 fish houses once and most recently, the largest fish house was sold for condominium development; there are four working fish houses left now. According to one individual, many fishermen are leaving the fishing business as tourism is dominating the economy for the area. This same individual further commented that water quality has changed and that there used to be more shellfish on the shoreline; now it is all gone due to development. He further suggested that the bridges that have recently been built have changed the currents of the inlet and have affected the local ecosystem. Hatteras has 60 federally permitted vessels and most of those have commercial coastal pelagic permits. Almost half have charter permits for coastal pelagic or snapper grouper (Table ). Most of the fishing related employment is in the marina sector (Table ). There are 81 state registered commercial fishing vessels and 72 standard commercial fishing licenses in Hatteras. There are ten dealer licenses and 21 shellfish licenses in the community (Table ). The census demographic table that follows was compiled using census block data for the area. Long term census data from 1970 and 1980 were not available for Hatteras
90 Hatteras Census Demographics Table Hatteras Census Demographics Factor Total population Gender Ratio M/F (Percent) 51.6/ /49.5 Age (Percent of total population) Under 18 years of age to 64 years of age years and over Ethnicity or Race (Number) White Black or African American 10 0 American Indian and Alaskan Native 0 0 Asian 21 0 Native Hawaiian and other Pacific Islander 0 0 Some other race 0 38 Two or more races - 54 Hispanic or Latino (any race) Educational Attainment ( Population 25 and over) Percent with less than 9th grade Percent high school graduate or higher Percent with a Bachelor s degree or higher Language Spoken at Home (Population 5 years and over) Percent who speak a language other than English at home And Percent who speak English less than very well Household income (Median $) N/A 1 N/A 1 Poverty Status (Percent of population with income below poverty line) Percent female headed household Home Ownership (Percent) Owner occupied Renter occupied Value Owner-occupied Housing (Median $) N/A 2 N/A 2 Monthly Contract Rent (Median $) N/A 3 N/A 3 Employment Status (Population 16 yrs and over) Percent in the labor force Percent of civilian labor force unemployed Occupation (Percent) Management, professional, and related occupations Service occupations Sales and office occupations Farming, fishing, and forestry occupations Construction, extraction, and maintenance occupations Production, transportation, and material moving occupations Industry (Percent) Agriculture, forestry, fishing and hunting Manufacturing Percent government workers Median Household Income is between $16,799-29,900 for 1990; $33,456-40,718 for Median Value Owner-occupied Housing is between $51, ,600 for 1990; $111, ,100 for Median Contract Rent is between $ for 1990; $ for
91 Hatteras Fishing Demographics Table Number of Federal Permit by Type for Hatteras, North Carolina (Source: NMFS 2002) Type of Permit Total permitted vessels Commercial King Mackerel Commercial Spanish Mackerel Commercial Spiny Lobster Charter/Headboat for Coastal Pelagics Charter/Headboat for Snapper Grouper Snapper Grouper Class Snapper Grouper Class Swordfish Shark Rock Shrimp Federal Dealers Table Employment in Fishing Related Industry for Hatteras, North Carolina (Zip code Business Patterns, U.S. Census Bureau 1998) Category NAIC Code Number Employed Fishing Seafood Canning Seafood Processing Boat Building Fish and Seafoods Fish and Seafood Markets Marinas Total Fishing Employment 20 Table Number of State Permit by Type for Hatteras, North Carolina (Source: NCDMF 2002) Type Permits Commercial Fishing Vessel Registration 81 Dealer License 10 Flounder License 0 Land or Sell License 0 Non-resident Menhaden License 0 Ocean Fishing Pier License 0 Spotter Plane License 0 Retired Standard Commercial Fishing License 5 Standard Commercial Fishing License 73 Shellfish License 21 Recreational Fishing Tournament to Sell License 1 Total

92 2.14 Oriental (28571) Community Description Oriental has seen little population growth over the past few decades and relatively little change in other census demographics. There has been a rise in unemployment from 1990 to 2000 but a drop in the number of individuals who are living below the poverty line for the same decade. There was little change in employment in farm, fish and forestry over that same time period. In fact, the number of federally permitted vessels has remained fairly constant at 7 (Table ). There is considerable employment in fish and seafood with 72 people reported in that sector in Table As far as state permits, there were 77 commercial vessels registered in Oriental and 62 standard commercial fishing licenses. There were also 13 dealer licenses issued within the community. 85
93 Oriental Census Demographics Population Table Total Persons and Persons by Age category for Oriental, North Carolina (Source U.S. Census Bureau & MARFIN Sociodemographic Database. Louisiana Population Data Center & National Marine Fisheries Service). Total Persons and Age Category Total Persons Persons Age Persons Age Persons Age Persons Age Persons Age Persons Age Persons Age Persons Age Persons Age Housing Tenure Table Housing Tenure for Oriental, North Carolina (Source: U.S. Census Bureau). Percent Renter Occupied Percent Owner Occupied Residence in 1985 and 1995 Table Residence in 1985 and 1995 for Oriental, North Carolina (Source: U.S. Census Bureau). Different House Same County Same House
94 Employment/Unemployment Table Employment and Unemployment for Oriental, North Carolina (Source: U.S. Census Bureau). Persons 16 yrs and over Percent in labor force Percent unemployed Race Table Race for Oriental, North Carolina (Source U.S. Census Bureau & MARFIN Sociodemographic Database. Louisiana Population Data Center & National Marine Fisheries Service). Race Black Persons Latino Black Persons Latino Persons White Persons Latino White Persons Education Table Years of Education by Category for those 25 Years and Older for Oriental, North Carolina (Source: U.S. Census Bureau & MARFIN Sociodemographic Database. Louisiana Population Data Center & National Marine Fisheries Service). Education w/ 0-8 years education w/ 9-11 years education w/ HS diploma w/ years. education w/ College Degree Drop outs Income and Poverty Table Average Household Wage/Salary and Persons Below the Poverty Level for Oriental, North Carolina (Source: U.S. Census Bureau & MARFIN Sociodemographic Database. Louisiana Population Data Center & National Marine Fisheries Service). Wage or Salary Average Household Wage/Salary Income (dollars). $12303 $27660 $37794 Poverty Level Persons Below Poverty Level Age 65+ Below Poverty Level Households with Public Assistance
95 Industry Table Employment by Industry for Oriental, North Carolina (Source: U.S. Census Bureau & MARFIN Sociodemographic Database. Louisiana Population Data Center & National Marine Fisheries Service). Industry Agriculture, Fishing, Mining Construction Business Services Communication/Utilities Manufacturing Financial, Insurance & Real Estate Services Wholesale/Retail Trade Transportation Occupation Table Employment by Occupation for Oriental, North Carolina (Source: U.S. Census Bureau & MARFIN Sociodemographic Database. Louisiana Population Data Center & National Marine Fisheries Service). Occupation Sales Clerical Craft Exec/Managerial Farm/Fish/Forest Household Services Laborer/Handler Operative/Transport Service, except Household Technical
96 Oriental Fishing Demographics Table Number of Federal Permit by Type for Oriental, North Carolina (Source: NMFS 2002) Type of Permit Total permitted vessels Commercial King Mackerel Commercial Spanish Mackerel Commercial Spiny Lobster Charter/Headboat for Coastal Pelagics Charter/Headboat for Snapper Grouper Snapper Grouper Class Snapper Grouper Class Swordfish Shark Rock Shrimp Federal Dealers Table Employment in Fishing Related Industry for Oriental, North Carolina (Zip code Business Patterns, U.S. Census Bureau 1998) Category NAIC Code Number Employed Fishing Seafood Canning Seafood Processing Boat Building Fish and Seafoods Fish and Seafood Markets Marinas Total Fishing Employment 108 Table Number of State Permit by Type for Oriental, North Carolina (Source: NCDMF 2002) Type Permits Commercial Fishing Vessel Registration 77 Dealer License 13 Flounder License 9 Land or Sell License 0 Non-resident Menhaden License 0 Ocean Fishing Pier License 0 Spotter Plane License 0 Retired Standard Commercial Fishing License 5 Standard Commercial Fishing License 62 Shellfish License 3 Recreational Fishing Tournament to Sell License 0 Total

97 2.15 Vandemere/Mesic (28587) Community Description Vandemere and Mesic have both seen a slight population decline over the past decade. Both communities are predominately African American. Vandemere has about 60% of the population in the labor force while Mesic has 45%. Vandemere has seen a decrease in the percentage of unemployed to 9.4 percent while Mesic has seen an increase to 5.6 percent. Both communities have seen a reduction in the number of people who live below the poverty line and an increase in the average wage or salary. Both communities have also seen a steady decline in the number of people who work in farm, fishing and forestry for both occupation and industry. There are very few federal permits in Vandemere and none listed for Mesic (Table ). There are 36 people employed in seafood processing according to Table and 4 in fishing and fish and seafood. A total of 19 commercial vessels are registered with the state according to Table and 21 standard commercial fishing licenses. 90
98 Vandemere Census Demographics Population Table Total Persons and Persons by Age category for Vandemere, North Carolina (Source U.S. Census Bureau & MARFIN Sociodemographic Database. Louisiana Population Data Center & National Marine Fisheries Service). Total Persons and Age Category Total Persons Persons Age Persons Age Persons Age Persons Age Persons Age Persons Age Persons Age Persons Age Persons Age Housing Tenure Table Housing Tenure for Vandemere, North Carolina (Source: U.S. Census Bureau). Percent Renter Occupied Percent Owner Occupied Residence in 1985 and 1995 Table Residence in 1985 and 1995 for Vandemere, North Carolina (Source: U.S. Census Bureau). Different House Same County Same House
99 Employment/Unemployment Table Employment and Unemployment for Vandemere, North Carolina (Source: U.S. Census Bureau). Persons 16 yrs and over Percent in labor force Percent unemployed Race Table Race for Vandemere, North Carolina (Source U.S. Census Bureau & MARFIN Sociodemographic Database. Louisiana Population Data Center & National Marine Fisheries Service). Race Black Persons Latino Black Persons Latino Persons White Persons Latino White Persons Education Table Years of Education by Category for those 25 Years and Older for Vandemere, North Carolina (Source: U.S. Census Bureau & MARFIN Sociodemographic Database. Louisiana Population Data Center & National Marine Fisheries Service). Education w/ 0-8 years education w/ 9-11 years education w/ HS diploma w/ years. education w/ College Degree Drop outs Income and Poverty Table Average Household Wage/Salary and Persons Below the Poverty Level for Vandemere, North Carolina (Source: U.S. Census Bureau & MARFIN Sociodemographic Database. Louisiana Population Data Center & National Marine Fisheries Service). Wage or Salary Average Household Wage/Salary Income (dollars). $13,243 $19,713 $32,917 Poverty Level Persons Below Poverty Level Age 65+ Below Poverty Level Households with Public Assistance
100 Industry Table Employment by Industry for Vandemere, North Carolina (Source: U.S. Census Bureau & MARFIN Sociodemographic Database. Louisiana Population Data Center & National Marine Fisheries Service). Industry Agriculture, Fishing, Mining Construction Business Services Communication/Utilities Manufacturing Financial, Insurance & Real Estate Services Wholesale/Retail Trade Transportation Occupation Table Employment by Occupation for Vandemere, North Carolina (Source: U.S. Census Bureau & MARFIN Sociodemographic Database. Louisiana Population Data Center & National Marine Fisheries Service). Occupation Sales Clerical Craft Exec/Managerial Farm/Fish/Forest Household Services Laborer/Handler Operative/Transport Service, except Household Technical
101 Mesic Census Demographics Population Table Total Persons and Persons by Age category for Mesic, North Carolina (Source U.S. Census Bureau & MARFIN Sociodemographic Database. Louisiana Population Data Center & National Marine Fisheries Service). Total Persons and Age Category Total Persons Persons Age Persons Age Persons Age Persons Age Persons Age Persons Age Persons Age Persons Age Persons Age Housing Tenure Table Housing Tenure for Mesic, North Carolina (Source: U.S. Census Bureau). Percent Renter Occupied Percent Owner Occupied Residence in 1985 and 1995 Table Residence in 1985 and 1995 for Mesic, North Carolina (Source: U.S. Census Bureau). Different House Same County Same House
102 Employment/Unemployment Table Employment and Unemployment for Mesic, North Carolina (Source: U.S. Census Bureau). Persons 16 yrs and over Percent in labor force Percent unemployed Race Table Race for Mesic, North Carolina (Source U.S. Census Bureau & MARFIN Sociodemographic Database. Louisiana Population Data Center & National Marine Fisheries Service). Race Black Persons Latino Black Persons Latino Persons White Persons Latino White Persons Education Table Years of Education by Category for those 25 Years and Older for Mesic, North Carolina (Source: U.S. Census Bureau & MARFIN Sociodemographic Database. Louisiana Population Data Center & National Marine Fisheries Service). Education w/ 0-8 years education w/ 9-11 years education w/ HS diploma w/ years. education w/ College Degree Drop outs Income and Poverty Table Average Household Wage/Salary and Persons Below the Poverty Level for Mesic, North Carolina (Source: U.S. Census Bureau & MARFIN Sociodemographic Database. Louisiana Population Data Center & National Marine Fisheries Service). Wage or Salary Average Household Wage/Salary Income (dollars) Poverty Level Persons Below Poverty Level Age 65+ Below Poverty Level Households with Public Assistance
103 Industry Table Employment by Industry for Mesic, North Carolina (Source: U.S. Census Bureau & MARFIN Sociodemographic Database. Louisiana Population Data Center & National Marine Fisheries Service). Industry Agriculture, Fishing, Mining Construction Business Services Communication/Utilities Manufacturing Financial, Insurance & Real Estate Services Wholesale/Retail Trade Transportation Occupation Table Employment by Occupation for Mesic, North Carolina (Source: U.S. Census Bureau & MARFIN Sociodemographic Database. Louisiana Population Data Center & National Marine Fisheries Service). Occupation Sales Clerical Craft Exec/Managerial Farm/Fish/Forest Household Services Laborer/Handler Operative/Transport Service, except Household Technical
104 Vandemere Fishing Demographics Table Number of Federal Permit by Type for Vandemere, North Carolina (Source: NMFS 2002) Type of Permit Total permitted vessels Commercial King Mackerel Commercial Spanish Mackerel Commercial Spiny Lobster Charter/Headboat for Coastal Pelagics Charter/Headboat for Snapper Grouper Snapper Grouper Class Snapper Grouper Class Swordfish Shark Rock Shrimp Federal Dealers Table Employment in Fishing Related Industry for Vandemere, North Carolina (Zip code Business Patterns, U.S. Census Bureau 1998) Category NAIC Code Number Employed Fishing Seafood Canning Seafood Processing Boat Building Fish and Seafoods Fish and Seafood Markets Marinas Total Fishing Employment 44 Table Number of State Permit by Type for Vandemere, North Carolina (Source: NCDMF 2002) Type Permits Commercial Fishing Vessel Registration 19 Dealer License 3 Flounder License 3 Land or Sell License 0 Non-resident Menhaden License 0 Ocean Fishing Pier License 0 Spotter Plane License 0 Retired Standard Commercial Fishing License 0 Standard Commercial Fishing License 21 Shellfish License 0 Recreational Fishing Tournament to Sell License 0 Total 46 97

105 2.16 Bath (27808) Community Description There has been a slight population increase for Bath in the past ten years and an increase in the percentage of the population in the labor force. Unemployment is 4.5% with a slight increase in the number of persons living below the poverty level. There were very few people employed in the farm, fish and forestry category for either industry or occupation. According to Table there is only one federally permitted vessel homeported in Bath. Employment in fishing related businesses reported in Table shows only 4 people employed in fish and seafood. There are over 100 commercial vessels registered by the state in Bath and over 100 standard commercial fishing licenses according to Table
106 Bath Census Demographics Population Table Total Persons and Persons by Age category for Bath, North Carolina (Source U.S. Census Bureau & MARFIN Sociodemographic Database. Louisiana Population Data Center & National Marine Fisheries Service). Total Persons and Age Category Total Persons Persons Age Persons Age Persons Age Persons Age Persons Age Persons Age Persons Age Persons Age Persons Age Housing Tenure Table Housing Tenure for Bath, North Carolina (Source: U.S. Census Bureau). Percent Renter Occupied Percent Owner Occupied Residence in 1985 and 1995 Table Residence in 1985 and 1995 for Bath, North Carolina (Source: U.S. Census Bureau). Different House Same County Same House Employment/Unemployment Table Employment and Unemployment for Bath, North Carolina (Source: U.S. Census Bureau). Persons 16 yrs and over Percent in labor force Percent unemployed
107 Race Table Race for Bath, North Carolina (Source U.S. Census Bureau & MARFIN Sociodemographic Database. Louisiana Population Data Center & National Marine Fisheries Service). Race Black Persons Latino Black Persons Latino Persons White Persons Latino White Persons Education Table Years of Education by Category for those 25 Years and Older for Bath, North Carolina (Source: U.S. Census Bureau & MARFIN Sociodemographic Database. Louisiana Population Data Center & National Marine Fisheries Service). Education w/ 0-8 years education w/ 9-11 years education w/ HS diploma w/ years. education w/ College Degree Drop outs Income and Poverty Table Average Household Wage/Salary and Persons Below the Poverty Level for Bath, North Carolina (Source: U.S. Census Bureau & MARFIN Sociodemographic Database. Louisiana Population Data Center & National Marine Fisheries Service). Wage or Salary Average Household Wage/Salary Income (dollars) Poverty Level Persons Below Poverty Level Age 65+ Below Poverty Level Households with Public Assistance
108 Industry Table Employment by Industry for Bath, North Carolina (Source: U.S. Census Bureau & MARFIN Sociodemographic Database. Louisiana Population Data Center & National Marine Fisheries Service). Industry Agriculture, Fishing, Mining Construction Business Services Communication/Utilities Manufacturing Financial, Insurance & Real Estate Services Wholesale/Retail Trade Transportation Occupation Table Employment by Occupation for Bath, North Carolina (Source: U.S. Census Bureau & MARFIN Sociodemographic Database. Louisiana Population Data Center & National Marine Fisheries Service). Occupation Sales Clerical Craft Exec/Managerial Farm/Fish/Forest Household Services Laborer/Handler Operative/Transport Service, except Household Technical
109 Bath Fishing Demographics Table Number of Federal Permit by Type for Bath, North Carolina (Source: NMFS 2002) Type of Permit Total permitted vessels Commercial King Mackerel Commercial Spanish Mackerel Commercial Spiny Lobster Charter/Headboat for Coastal Pelagics Charter/Headboat for Snapper Grouper Snapper Grouper Class Snapper Grouper Class Swordfish Shark Rock Shrimp Federal Dealers Table Employment in Fishing Related Industry for Bath, North Carolina (Zip code Business Patterns, U.S. Census Bureau 1998) Category NAIC Code Number Employed Fishing Seafood Canning Seafood Processing Boat Building Fish and Seafoods Fish and Seafood Markets Marinas Total Fishing Employment 4 Table Number of State Permit by Type for Bath, North Carolina (Source: NCDMF 2002) Type Permits Commercial Fishing Vessel Registration 119 Dealer License 16 Flounder License 0 Land or Sell License 0 Non-resident Menhaden License 0 Ocean Fishing Pier License 0 Spotter Plane License 0 Retired Standard Commercial Fishing License 7 Standard Commercial Fishing License 112 Shellfish License 2 Recreational Fishing Tournament to Sell License 0 Total

110 2.17 Belhaven (27810) Community Description Belhaven is a predominantly African American community which has seen a decline in population over the past decade. The community has also experienced an increase in the unemployment rate and a decrease in the percentage of the population that is in the labor force. Average household wage and salary has decreased while there has been a decline in the number of people who live below the poverty line. There has been a decrease in the number of people who work in farm, fishing and forestry sector for both industry and occupation. While there are very few federally permitted vessels homeported in Belhaven (Table ) there were over 100 people employed in fishing related businesses according to Table There were over 260 commercial fishing vessels registered with the state from Belhaven and 232 standard commercial fishing licenses (Table ). 103
111 Belhaven Census Demographics Population Table Total Persons and Persons by Age category for Belhaven, North Carolina (Source U.S. Census Bureau & MARFIN Sociodemographic Database. Louisiana Population Data Center & National Marine Fisheries Service). Total Persons and Age Category Total Persons Persons Age Persons Age Persons Age Persons Age Persons Age Persons Age Persons Age Persons Age Persons Age Housing Tenure Table Housing Tenure for Belhaven, North Carolina (Source: U.S. Census Bureau). Percent Renter Occupied Percent Owner Occupied Residence in 1985 and 1995 Table Residence in 1985 and 1995 for Belhaven, North Carolina (Source: U.S. Census Bureau). Different House Same County Same House Employment/Unemployment Table Employment and Unemployment for Belhaven, North Carolina (Source: U.S. Census Bureau). Persons 16 yrs and over Percent in labor force Percent unemployed
112 Race Table Race for Belhaven, North Carolina (Source U.S. Census Bureau & MARFIN Sociodemographic Database. Louisiana Population Data Center & National Marine Fisheries Service). Race Black Persons Latino Black Persons Latino Persons White Persons Latino White Persons Education Table Years of Education by Category for those 25 Years and Older for Belhaven, North Carolina (Source: U.S. Census Bureau & MARFIN Sociodemographic Database. Louisiana Population Data Center & National Marine Fisheries Service). Education w/ 0-8 years education w/ 9-11 years education w/ HS diploma w/ years. education w/ College Degree Drop outs Income and Poverty Table Average Household Wage/Salary and Persons Below the Poverty Level for Belhaven, North Carolina (Source: U.S. Census Bureau & MARFIN Sociodemographic Database. Louisiana Population Data Center & National Marine Fisheries Service). Wage or Salary Average Household Wage/Salary Income (dollars) Poverty Level Persons Below Poverty Level Age 65+ Below Poverty Level Households with Public Assistance
113 Industry Table Employment by Industry for Belhaven, North Carolina (Source: U.S. Census Bureau & MARFIN Sociodemographic Database. Louisiana Population Data Center & National Marine Fisheries Service). Industry Agriculture, Fishing, Mining Construction Business Services Communication/Utilities Manufacturing Financial, Insurance & Real Estate Services Wholesale/Retail Trade Transportation Occupation Table Employment by Occupation for Belhaven, North Carolina (Source: U.S. Census Bureau & MARFIN Sociodemographic Database. Louisiana Population Data Center & National Marine Fisheries Service). Occupation Sales Clerical Craft Exec/Managerial Farm/Fish/Forest Household Services Laborer/Handler Operative/Transport Service, except Household Technical Belhaven Fishing Demographics Table Number of Federal Permit by Type for Belhaven, North Carolina (Source: NMFS 2002) Type of Permit Total permitted vessels Commercial King Mackerel Commercial Spanish Mackerel Commercial Spiny Lobster Charter/Headboat for Coastal Pelagics Charter/Headboat for Snapper Grouper Snapper Grouper Class Snapper Grouper Class Swordfish Shark Rock Shrimp Federal Dealers
114 Table Employment in Fishing Related Industry for Belhaven, North Carolina (Zip code Business Patterns, U.S. Census Bureau 1998) Category NAIC Code Number Employed Fishing Seafood Canning Seafood Processing Boat Building Fish and Seafoods Fish and Seafood Markets Marinas Total Fishing Employment 104 Table Number of State Permit by Type for Belhaven, North Carolina (Source: NCDMF 2002) Type Permits Commercial Fishing Vessel Registration 268 Dealer License 16 Flounder License 7 Land or Sell License 0 Non-resident Menhaden License 0 Ocean Fishing Pier License 0 Spotter Plane License 0 Retired Standard Commercial Fishing License 9 Standard Commercial Fishing License 232 Shellfish License 3 Recreational Fishing Tournament to Sell License 0 Total

115 2.18 Wanchese (27981) Community Description Roanoke Island has a mix of tall, green, piney woods and miles of sheltered shoreline on the sound side providing a contrast to the open dunes of the outer islands. Wanchese, one of the island's two villages and is located at the southern end. It is a small, unincorporated fishing community with docks that provide services to many types of local and non-local commercial and recreational fishermen. Throughout the nineteenth century, the commercial industry was able to expanded owing in part to the first local postmaster, who owned or financed most of the commercial fishing boats in Wanchese. That individual established a system of credit for local fishermen at his store where debts were paid off when fishermen brought in their catches. It was said that at that time all residents were commercial fishermen (Wilson and McCay 1998). Wanchese first fish house was established in 1936 by ER (Zeke) Daniels, the grandfather of the current generation of two fish house owners. Zeke s son was the first to fish a trawler in Wanchese in the 1950s. He converted a 65 wooden boat which was primarily used to fish for things like 108
116 flounder during the winter time. As mentioned most of their fishing occurred in the Pamlico and Albemarle Sounds, however there was a certain amount beach fishing that occurred, targeting species such as sea mollusks, trout, croaker, spots, striped bass (rock fish) and blue fish. The sounds provided croakers, butterfish, Spanish mackerel, spots and pig fishes. At that time, sea bass was the primary species targeted in the ocean during the winter months of the year. Later a WWI subchaser was purchased and converted for scalloping (Wilson and McCay 1998). The largest industrial area in Wanchese is centered round the Wanchese Seafood Industrial Park. The Park was built to enhance business opportunities in the seafood and marine trades. It encourages outside as well as local development in an effort to create a new day for seafood and marine commerce. 23 Between 1978 and 1985 it was reported that there were nine fish houses in operation in Wanchese. Today, there are six packing houses all operational and all dealing in many of the same species, with each house having a slightly different specialty. In the past all of the houses packed basically the same fish, with flounder being one of the most prominent species. However, overtime this has changed as each house has had to specialize in order to remain in business. Charter boat fishing has become an increasing popular in Wanchese over the last 10 years. The number of charter boats has increased and facilities have been created to handle the increased presence of the for hire industry. Currently, there are 27 charter boats and 2 head boats working out of Wanchese. Many of these individuals are from outside the Wanchese area; however, there are a few local fishermen who have decided to try the recreational fishing instead of the commercial. Wanchese has seen an increase in its population over the past decade but a reduction in the percentage of people in the labor force. Percent of unemployed has dropped from 8.9 in 1990 to 2.8 in While average wage and salary has increased, number of persons below the poverty level has remained constant. Yet the number of households with public assistance has gone from a high of 35 in 1990 to none in Employment in farm, fishing and forestry rose from 1980 to 1990 but has seen a decline in the year There have remained about 30 vessels with federal permits homeported in the community for the past four years (Table ). Employment in fishing related activities reported in Table indicates 120 people employed in several categories with 56 in fish and seafood, 40 in boatbuilding, 16 in fishing and 8 in seafood processing. There were 228 commercial vessels registered and over 200 standard commercial fishing licenses in the community according to Table There were also 12 dealer licenses and 18 flounder licenses for Wanchese
117 Wanchese Census Demographics Population Table Total Persons and Persons by Age category for Wanchese, North Carolina (Source U.S. Census Bureau & MARFIN Sociodemographic Database. Louisiana Population Data Center & National Marine Fisheries Service). Total Persons and Age Category Total Persons Persons Age Persons Age Persons Age Persons Age Persons Age Persons Age Persons Age Persons Age Persons Age Housing Tenure Table Housing Tenure for Wanchese, North Carolina (Source: U.S. Census Bureau). Percent Renter Occupied Percent Owner Occupied Residence in 1985 and 1995 Table Residence in 1985 and 1995 for Wanchese, North Carolina (Source: U.S. Census Bureau). Different House Same County Same House Employment/Unemployment Table Employment and Unemployment for Wanchese, North Carolina (Source: U.S. Census Bureau). Persons 16 yrs and over Percent in labor force Percent unemployed
118 Race Table Race for Wanchese, North Carolina (Source U.S. Census Bureau & MARFIN Sociodemographic Database. Louisiana Population Data Center & National Marine Fisheries Service). Race Black Persons Latino Black Persons Latino Persons White Persons Latino White Persons Education Table Years of Education by Category for those 25 Years and Older for Wanchese, North Carolina (Source: U.S. Census Bureau & MARFIN Sociodemographic Database. Louisiana Population Data Center & National Marine Fisheries Service). Education w/ 0-8 years education w/ 9-11 years education w/ HS diploma w/ years. education w/ College Degree Drop outs Income and Poverty Table Average Household Wage/Salary and Persons Below the Poverty Level for Wanchese, North Carolina (Source: U.S. Census Bureau & MARFIN Sociodemographic Database. Louisiana Population Data Center & National Marine Fisheries Service). Wage or Salary Average Household Wage/Salary Income (dollars) Poverty Level Persons Below Poverty Level Age 65+ Below Poverty Level Households with Public Assistance
119 Industry Table Employment by Industry for Wanchese, North Carolina (Source: U.S. Census Bureau & MARFIN Sociodemographic Database. Louisiana Population Data Center & National Marine Fisheries Service). Industry Agriculture, Fishing, Mining Construction Business Services Communication/Utilities Manufacturing Financial, Insurance & Real Estate Services Wholesale/Retail Trade Transportation Occupation Table Employment by Occupation for Wanchese, North Carolina (Source: U.S. Census Bureau & MARFIN Sociodemographic Database. Louisiana Population Data Center & National Marine Fisheries Service). Occupation Sales Clerical Craft Exec/Managerial Farm/Fish/Forest Household Services Laborer/Handler Operative/Transport Service, except Household Technical
120 Wanchese Fishing Demographics Table Number of Federal Permit by Type for Wanchese, North Carolina (Source: NMFS 2002) Type of Permit Total permitted vessels Commercial King Mackerel Commercial Spanish Mackerel Commercial Spiny Lobster Charter/Headboat for Coastal Pelagics Charter/Headboat for Snapper Grouper Snapper Grouper Class Snapper Grouper Class Swordfish Shark Rock Shrimp Federal Dealers Table Employment in Fishing Related Industry for Wanchese, North Carolina (Zip code Business Patterns, U.S. Census Bureau 1998) Category NAIC Code Number Employed Fishing Seafood Canning Seafood Processing Boat Building Fish and Seafoods Fish and Seafood Markets Marinas Total Fishing Employment 120 Table Number of State Permit by Type for Wanchese, North Carolina (Source: NCDMF 2002) Type Permits Commercial Fishing Vessel Registration 228 Dealer License 12 Flounder License 18 Land or Sell License 0 Non-resident Menhaden License 0 Ocean Fishing Pier License 0 Spotter Plane License 0 Retired Standard Commercial Fishing License 13 Standard Commercial Fishing License 201 Shellfish License 2 Recreational Fishing Tournament to Sell License 0 Total

121 2.19 Manteo (27954) Community Description Manteo has seen steady population growth with a decline in its African American population. The percent of the population that is unemployed has risen over the past ten years while the percent of people in the labor force has also declined slightly. Average wage and salary has raised some but, the number of persons living below the poverty line has increased. There has been a steady decline in the number of individuals working in the farm, fish and forestry sectors also over the past three decades. There are only 13 vessels with federal permits homeported in Wanchese and most of them have coastal pelagic permits (Table ). Fishing related employment is highest among the fish and seafood sector according to Table with 176 persons employed in that sector and 16 in marinas. The state reports over 170 commercially registered vessels and 142 standard commercial fishing licenses for Wanchese (Table ). 114
122 Manteo Census Demographics Population Table Total Persons and Persons by Age category for Manteo, North Carolina (Source U.S. Census Bureau & MARFIN Sociodemographic Database. Louisiana Population Data Center & National Marine Fisheries Service). Total Persons and Age Category Total Persons Persons Age Persons Age Persons Age Persons Age Persons Age Persons Age Persons Age Persons Age Persons Age Housing Tenure Table Housing Tenure for Manteo, North Carolina (Source: U.S. Census Bureau). Percent Renter Occupied Percent Owner Occupied Residence in 1985 and 1995 Table Residence in 1985 and 1995 for Manteo, North Carolina (Source: U.S. Census Bureau). Different House Same County Same House
123 Employment/Unemployment Table Employment and Unemployment for Manteo, North Carolina (Source: U.S. Census Bureau). Persons 16 yrs and over Percent in labor force Percent unemployed Race Table Race for Manteo, North Carolina (Source U.S. Census Bureau & MARFIN Sociodemographic Database. Louisiana Population Data Center & National Marine Fisheries Service). Race Black Persons Latino Black Persons Latino Persons White Persons Latino White Persons Education Table Years of Education by Category for those 25 Years and Older for Manteo, North Carolina (Source: U.S. Census Bureau & MARFIN Sociodemographic Database. Louisiana Population Data Center & National Marine Fisheries Service). Education w/ 0-8 years education w/ 9-11 years education w/ HS diploma w/ years. education w/ College Degree Drop outs
124 Income and Poverty Table Average Household Wage/Salary and Persons Below the Poverty Level for Manteo, North Carolina (Source: U.S. Census Bureau & MARFIN Sociodemographic Database. Louisiana Population Data Center & National Marine Fisheries Service). Wage or Salary Average Household Wage/Salary Income (dollars). $14919 $25666 $29803 Poverty Level Persons Below Poverty Level Age 65+ Below Poverty Level Households with Public Assistance Industry Table Employment by Industry for Manteo, North Carolina (Source: U.S. Census Bureau & MARFIN Sociodemographic Database. Louisiana Population Data Center & National Marine Fisheries Service). Industry Agriculture, Fishing, Mining Construction Business Services Communication/Utilities Manufacturing Financial, Insurance & Real Estate Services Wholesale/Retail Trade Transportation Occupation Table Employment by Occupation for Manteo, North Carolina (Source: U.S. Census Bureau & MARFIN Sociodemographic Database. Louisiana Population Data Center & National Marine Fisheries Service). Occupation Sales Clerical Craft Exec/Managerial Farm/Fish/Forest Household Services Laborer/Handler Operative/Transport Service, except Household Technical
125 Manteo Fishing Demographics Table Number of Federal Permit by Type for Manteo, North Carolina (Source: NMFS 2002) Type of Permit Total permitted vessels Commercial King Mackerel Commercial Spanish Mackerel Commercial Spiny Lobster Charter/Headboat for Coastal Pelagics Charter/Headboat for Snapper Grouper Snapper Grouper Class Snapper Grouper Class Swordfish Shark Rock Shrimp Federal Dealers Table Employment in Fishing Related Industry for Manteo, North Carolina (Zip code Business Patterns, U.S. Census Bureau 1998) Category NAIC Code Number Employed Fishing Seafood Canning Seafood Processing Boat Building Fish and Seafoods Fish and Seafood Markets Marinas Total Fishing Employment 200 Table Number of State Permit by Type for Manteo, North Carolina (Source: NCDMF 2002) Type Permits Commercial Fishing Vessel Registration 171 Dealer License 9 Flounder License 0 Land or Sell License 0 Non-resident Menhaden License 0 Ocean Fishing Pier License 0 Spotter Plane License 0 Retired Standard Commercial Fishing License 3 Standard Commercial Fishing License 142 Shellfish License 4 Recreational Fishing Tournament to Sell License 0 Total

126 2.20 Ocracoke (27960) Community Description Ocracoke is the first island on the southern part of the outer banks. It is only accessible by ferry. Despite its being so isolated, it is rather progressive according to some, yet mostly undeveloped; much of the island consists of the state park. Most residents are year-round and there seems to be a strong sense of community among the locals. The commercial fishing industry has disappeared, though there is one small fish house with two inshore and one off-shore fisherman working there. Tourism has been growing, as has the charter industry. There are three to four offshore charter boats, four or five inshore charters and one head boat. About three offshore commercial boats homeport there, with about 20 people claiming to be commercial fishermen on the island; although many of the fishermen have two or three different jobs. The major development boom started about six years ago and since then property values have skyrocketed. There are 12 to 15 seafood restaurants in and around the community Interviews by Ana Pitchon, May
127 Many individuals in this region and along the sound fish on the beach with nets or harvest shellfish; there is one shrimp trawler on the island. Ocracoke was never considered a full-fledged commercial fishing community according to some. There was no way to get the harvest off the island other than making the long trip to the mainland. The island has always been mostly tourist oriented. Cedar Island has historically been a fishing community according those interviewed. There are three small fish houses in the community and most vessels are small as most fish inshore primarily for shrimp, crab and flounder. Pound netting is a historic method of fishing that is still practiced here. Territory now leased from the state was once claimed by local families who would fish specific locations. Today, many fishermen also work on the ferry or dredges to supplement their income. Ocracoke was only recently designated a census place so comparison of previous census data can not be made. There are only 4 vessels that claim Ocracoke as homeport with federal permits. Fishing related employment is also very sparse as only 12 persons are reported as working in various sectors of fishing, fish and seafood, and marinas according to Table There were however 107 commercial vessels registered by the state on the island and 74 standard commercial fishing licenses (Table ) Ocracoke Census Demographics Population Table Total Persons and Persons by Age category for Ocracoke, North Carolina (Source U.S. Census Bureau & MARFIN Sociodemographic Database. Louisiana Population Data Center & National Marine Fisheries Service). Total Persons and Age Category Total Persons Persons Age Persons Age Persons Age Persons Age Persons Age Persons Age Persons Age Persons Age Persons Age Housing Tenure Table Housing Tenure for Ocracoke, North Carolina (Source: U.S. Census Bureau). Percent Renter Occupied Percent Owner Occupied
128 Residence in 1985 and 1995 Table Residence in 1985 and 1995 for Ocracoke, North Carolina (Source: U.S. Census Bureau). Different House Same County Same House Employment/Unemployment Table Employment and Unemployment for Ocracoke, North Carolina (Source: U.S. Census Bureau). Persons 16 yrs and over Percent in labor force Percent unemployed Race Table Race for Ocracoke, North Carolina (Source U.S. Census Bureau & MARFIN Sociodemographic Database. Louisiana Population Data Center & National Marine Fisheries Service). Race Black Persons.. 13 Latino Black Persons.. 0 Latino Persons.. 15 White Persons Latino White Persons Education Table Years of Education by Category for those 25 Years and Older for Ocracoke, North Carolina (Source: U.S. Census Bureau & MARFIN Sociodemographic Database. Louisiana Population Data Center & National Marine Fisheries Service). Education w/ 0-8 years education w/ 9-11 years education w/ HS diploma w/ years. education w/ College Degree Drop outs
129 Income and Poverty Table Average Household Wage/Salary and Persons Below the Poverty Level for Ocracoke, North Carolina (Source: U.S. Census Bureau & MARFIN Sociodemographic Database. Louisiana Population Data Center & National Marine Fisheries Service). Wage or Salary Average Household Wage/Salary Income (dollars) Poverty Level Persons Below Poverty Level.. 68 Age 65+ Below Poverty Level.. 14 Households with Public Assistance Industry Table Employment by Industry for Ocracoke, North Carolina (Source: U.S. Census Bureau & MARFIN Sociodemographic Database. Louisiana Population Data Center & National Marine Fisheries Service). Industry Agriculture, Fishing, Mining.. 13 Construction.. 14 Business Services.. 16 Communication/Utilities.. 7 Manufacturing.. 33 Financial, Insurance & Real Estate.. 10 Services Wholesale/Retail Trade Transportation Occupation Table Employment by Occupation for Ocracoke, North Carolina (Source: U.S. Census Bureau & MARFIN Sociodemographic Database. Louisiana Population Data Center & National Marine Fisheries Service). Occupation Sales.. - Clerical.. - Craft.. - Exec/Managerial.. - Farm/Fish/Forest.. 13 Household Services.. - Laborer/Handler.. - Operative/Transport.. - Service, except Household.. - Technical
130 Ocracoke Fishing Demographics Table Number of Federal Permit by Type for Ocracoke, North Carolina (Source: NMFS 2002) Type of Permit Total permitted vessels Commercial King Mackerel Commercial Spanish Mackerel Commercial Spiny Lobster Charter/Headboat for Coastal Pelagics Charter/Headboat for Snapper Grouper Snapper Grouper Class Snapper Grouper Class Swordfish Shark Rock Shrimp Federal Dealers Table Employment in Fishing Related Industry for Ocracoke, North Carolina (Zip code Business Patterns, U.S. Census Bureau 1998) Category NAIC Code Number Employed Fishing Seafood Canning Seafood Processing Boat Building Fish and Seafoods Fish and Seafood Markets Marinas Total Fishing Employment 12 Table Number of State Permit by Type for Ocracoke, North Carolina (Source: NCDMF 2002) Type Permits Commercial Fishing Vessel Registration 107 Dealer License 14 Flounder License 1 Land or Sell License 0 Non-resident Menhaden License 0 Ocean Fishing Pier License 0 Spotter Plane License 0 Retired Standard Commercial Fishing License 3 Standard Commercial Fishing License 74 Shellfish License 12 Recreational Fishing Tournament to Sell License 0 Total

131 2.21 Elizabeth City (27909) Community Description Elizabeth City has seen substantial population growth in the past decade with most of the growth among African Americans, but has also experienced a significant rise in unemployment. The percentage of population in the work force has risen slightly as has the number of people living below the poverty line. There are no federally permitted vessels that claim Elizabeth City as homeport (Table ). However, there are 56 persons employed in the fish and seafood sector of fishing related employment reported in Table There were 135 commercial vessels registered with the state and 114 standard commercial licenses reported in Table
132 Elizabeth City Census Demographics Population Table Total Persons and Persons by Age category for Elizabeth City, North Carolina (Source U.S. Census Bureau & MARFIN Sociodemographic Database. Louisiana Population Data Center & National Marine Fisheries Service). Total Persons and Age Category Total Persons Persons Age Persons Age Persons Age Persons Age Persons Age Persons Age Persons Age Persons Age Persons Age Housing Tenure Table Housing Tenure for Elizabeth City, North Carolina (Source: U.S. Census Bureau). Percent Renter Occupied Percent Owner Occupied Residence in 1985 and 1995 Table Residence in 1985 and 1995 for Elizabeth City, North Carolina (Source: U.S. Census Bureau). Different House Same County Same House
133 Employment/Unemployment Table Employment and Unemployment for Elizabeth City, North Carolina (Source: U.S. Census Bureau). Persons 16 yrs and over Percent in labor force Percent unemployed Race Table Race for Elizabeth City, North Carolina (Source U.S. Census Bureau & MARFIN Sociodemographic Database. Louisiana Population Data Center & National Marine Fisheries Service). Race Black Persons Latino Black Persons Latino Persons White Persons Latino White Persons Education Table Years of Education by Category for those 25 Years and Older for Elizabeth City, North Carolina (Source: U.S. Census Bureau & MARFIN Sociodemographic Database. Louisiana Population Data Center & National Marine Fisheries Service). Education w/ 0-8 years education w/ 9-11 years education w/ HS diploma w/ years. education w/ College Degree Drop outs
134 Income and Poverty Table Average Household Wage/Salary and Persons Below the Poverty Level for Elizabeth City, North Carolina (Source: U.S. Census Bureau & MARFIN Sociodemographic Database. Louisiana Population Data Center & National Marine Fisheries Service). Wage or Salary Average Household Wage/Salary Income (dollars) $6494 $13816 $21638 $24193 Poverty Level Persons Below Poverty Level Age 65+ Below Poverty Level Households with Public Assistance Industry Table Employment by Industry for Elizabeth City, North Carolina (Source: U.S. Census Bureau & MARFIN Sociodemographic Database. Louisiana Population Data Center & National Marine Fisheries Service). Industry Agriculture, Fishing, Mining Construction Business Services Communication/Utilities Manufacturing Financial, Insurance & Real Estate Services Wholesale/Retail Trade Transportation Occupation Table Employment by Occupation for Elizabeth City, North Carolina (Source: U.S. Census Bureau & MARFIN Sociodemographic Database. Louisiana Population Data Center & National Marine Fisheries Service). Occupation Sales Clerical Craft Exec/Managerial Farm/Fish/Forest Household Services Laborer/Handler Operative/Transport Service, except Household Technical
135 Elizabeth City Fishing Demographics Table Number of Federal Permit by Type for Elizabeth City, North Carolina (Source: NMFS 2002) Type of Permit Total permitted vessels Commercial King Mackerel Commercial Spanish Mackerel Commercial Spiny Lobster Charter/Headboat for Coastal Pelagics Charter/Headboat for Snapper Grouper Snapper Grouper Class Snapper Grouper Class Swordfish Shark Rock Shrimp Federal Dealers Table Employment in Fishing Related Industry for Elizabeth City, North Carolina (Zip code Business Patterns, U.S. Census Bureau 1998) Category NAIC Code Number Employed Fishing Seafood Canning Seafood Processing Boat Building Fish and Seafoods Fish and Seafood Markets Marinas Total Fishing Employment 72 Table Number of State Permit by Type for Elizabeth City, North Carolina (Source: NCDMF 2002) Type Permits Commercial Fishing Vessel Registration 135 Dealer License 13 Flounder License 0 Land or Sell License 0 Non-resident Menhaden License 0 Ocean Fishing Pier License 0 Spotter Plane License 0 Retired Standard Commercial Fishing License 6 Standard Commercial Fishing License 114 Shellfish License 3 Recreational Fishing Tournament to Sell License 0 Total
136 2.22 North Carolina Fishing Infrastructure and Community Characterization The following tables provide a general view of the presence or absence of fishing infrastructure located within the coastal communities of North Carolina with substantial fishing activity. It should be noted that there are many other attributes that might have been included in this table, however, because of inconsistency in rapid appraisal for all communities, these items were selected as the most consistently reported or had secondary data available to determine presence or absence. It should also be noted that in some cases certain infrastructure may exist within a community but was not readily apparent or could not be ascertained through secondary data. Table offers an overview of the presence of the selected infrastructure items and provides an overall total score which is merely the total of infrastructure present. Table Fishing Infrastructure Table for North Carolina Potential Fishing Communities Federal Commercial Permits (5+) State Commercial Licenses (10+) Federal Charter Permits (5+) Seafood Landings Seafood retail markets Fish processors, Wholesale fish house Recreational docks / marinas Recreational Fishing Tournaments Community Varnamtown Southport Bald Head Island Carolina Beach Wilmington Wrightsville Beach Topsail Beach/Surf City Sneads Ferry Swansboro Atlantic Beach Morehead City Beaufort Harker s Island Hatteras Oriental Vandemere/Mesic Bath Belhaven Wanchese Manteo Ocracoke Elizabeth City Total In providing a preliminary characterization of potential fishing communities in Table , we have provided a grouping of communities that seem to have more involvement in various fishing enterprises and therefore are classified as primarily involved. These communities seem to have considerable fishing infrastructure, but also appear to have a history and culture surrounding both commercial and recreational fishing that contributes to an appearance and perception of being a fishing community in the mind of residents and others. The communities of Wilmington and 129
137 Wrightsville Beach, which have considerable fishing infrastructure but are listed in secondarily involved are placed in that category largely because these two communities are located in a more metropolitan area that has a very diversified economy and while there seems to be an emphasis upon fishing, it is most likely that fishing has a small role in the overall economy and culture of the area. Others like Elizabeth City has a large processor located in the community, but may lack other components that are considered part of fishing culture or history. Many of these communities are in transition due to various social and demographic changes from coastal development, growing populations, changing regulations, etc. This preliminary characterization is just that and should not be considered a definite designation as fishing community, but a general guide for locating communities that may warrant consideration as a potential fishing community. Furthermore communities are not ranked in any particular order, this is merely a categorization. Table Preliminary Characterization of Potential Fishing Communities in North Carolina Primarily-Involved Secondarily-Involved Southport Varnamtown Carolina Beach Bald Head Island Sneads Ferry Wilmington Swansboro Wrightsville Beach Morehead City Topsail Beach/Surf City Beaufort Atlantic Beach Hatteras Oriental Wanchese Vandemere/Mesic Manteo Bath Harker s Island Belhaven Ocracoke Elizabeth City 130

138 3.0 South Carolina Communities with Substantial Fishing Activity Figure 3.1 Potential Fishing Communities of South Carolina. South Carolina landed over 14 and over 13 million pounds of seafood in 2001 and 2002 respectively. The value of those landings was over 23 million dollars in 2001 and over 20 million dollars in No South Carolina port was listed in the top 50 U.S. ports in terms of pounds landed or in terms of value of landings. According to NMFS (2002) South Carolina recreational fishermen landed over 3 million pounds of finfish in 2001 and in 2002 that number dropped to just less than 2 million pounds. There were three processors in South Carolina for 2001 with a total of 28 employees. The number of wholesale dealers was not listed in the report under South Carolina, but was combined under Inland States. In the years 2001 and 2002, South Carolina did have approximately 520 and 556 registered vessels respectively. Since 1998, South Carolina has had a high of 132 vessels with federal permits, now down to 113 in 2001 (Table 3.1.1). Most vessels with federal permits had either king or Spanish mackerel with snapper grouper class 1 permits being the next most common. 131
139 Table Number of Federal Permit by Type for South Carolina (Source: NMFS 2002) Type of Permit Total permitted vessels Commercial King Mackerel Commercial Spanish Mackerel Commercial Spiny Lobster Charter/Headboat for Coastal Pelagics Charter/Headboat for Snapper Grouper Snapper Grouper Class Snapper Grouper Class Swordfish Shark Rock Shrimp South Carolina requires licenses for both recreational and commercial fishing, including the sale of seafood and other marine products. The table below lists commercial licenses only (Table 3.1.2). The majority of South Carolina state permits are saltwater licenses and trawler licenses. The next most common are crab pots, bait dealer and shellfish licenses. Table Number of State Permits by Type for South Carolina. (Source South Carolina Division of Marine Fisheries, 2003). Type Permits Bait Dealer 42 Channel Net 8 Crab Pots 73 Drag Dredge 5 Gill Net 14 Hand Held Equipment 45 Herring Net 26 Mechanical Equipment 5 Miscellaneous Pots/Traps 5 Other Equipment 17 Peeler Crab Permit 19 Saltwater License 187 Seine Net 6 Shad Net 34 Shellfish Dealer 21 Shellfish License 40 Trawler License 167 Trotlines 15 Wholesale Dealer 58 Total 787 A map for each community is provided which displays federal dealers and a symbol indicating the number of federal permits by zipcode. The zipcode area name is displayed in light blue while the CDP name is in black. The symbol for permits is centered within the zipcode area and does not represent the precise location of any permit holder. Dealer permits are displayed near their physical location. 132
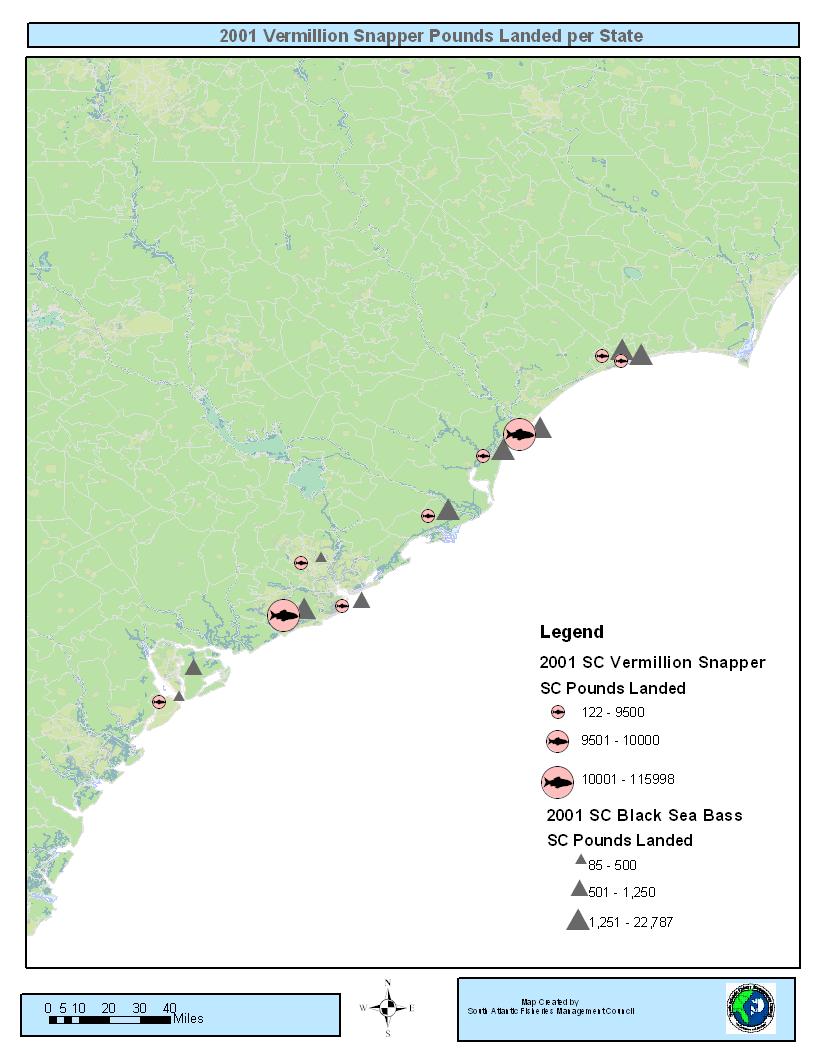
140 133

141 3.1 Hilton Head Island (29926, 29928) Community Description Hilton Head has seen steady population growth since 1980 and has tripled in size in While average wage and salary have also tripled over that time period and unemployment has remained low, the number of people living under the poverty level has also risen noticeably. There were at one time hundreds of persons employed in the farm, fish and forestry categories for occupation and industry. Recently, however, those numbers have dropped significantly. There are relatively few federally permitted vessels homeported at Hilton Head (Table ) and most employment in fishing related business is in marinas sector according to Table There were 46 total state permits for Hilton Head and 22 of those were Saltwater licenses and 12 trawler licenses (Table ). Nearby Bluffton had 68 state permits with 26 of those being saltwater licenses and 20 trawler licenses and 6 wholesale dealers (Table ). 134
142 3.1.2 Hilton Head Census Demographics Population Table Total Persons and Persons by Age category for Hilton Head Island, South Carolina (Source U.S. Census Bureau & MARFIN Sociodemographic Database. Louisiana Population Data Center & National Marine Fisheries Service). Total Persons and Age Category Total Persons ,775 Persons Age Persons Age Persons Age Persons Age Persons Age Persons Age Persons Age Persons Age Persons Age Housing Tenure Table Housing Tenure for Hilton Head, South Carolina (Source: U.S. Census Bureau). Percent Renter Occupied Percent Owner Occupied Residence in 1985 and 1995 Table Residence in 1985 and 1995 for Hilton Head, South Carolina (Source: U.S. Census Bureau). Different House Same County Same House Employment/Unemployment Table Employment and Unemployment for Hilton Head, South Carolina (Source: U.S. Census Bureau). Persons 16 yrs and over Percent in labor force Percent unemployed
143 Race Table Race for Hilton Head Island, South Carolina (Source U.S. Census Bureau & MARFIN Sociodemographic Database. Louisiana Population Data Center & National Marine Fisheries Service). Race Black Persons Latino Black Persons Latino Persons White Persons Latino White Persons Education Table Years of Education by Category for those 25 Years and Older for Hilton Head Island, South Carolina (Source: U.S. Census Bureau & MARFIN Sociodemographic Database. Louisiana Population Data Center & National Marine Fisheries Service). Education w/ 0-8 years education w/ 9-11 years education w/ HS diploma w/ years. education w/ College Degree Drop outs Income and Poverty Table Average Household Wage/Salary and Persons Below the Poverty Level for Hilton Head Island, (Source: U.S. Census Bureau & MARFIN Sociodemographic Database. Louisiana Population Data Center & National Marine Fisheries Service). Wage or Salary Average Household Wage/Salary Income (dollars). $20858 $42896 $60438 Poverty Level Persons Below Poverty Level Age 65+ Below Poverty Level Households with Public Assistance
144 Industry Table Employment by Industry for Hilton Head Island, South Carolina (Source: U.S. Census Bureau & MARFIN Sociodemographic Database. Louisiana Population Data Center & National Marine Fisheries Service). Industry Agriculture, Fishing, Mining Construction Business Services Communication/Utilities Manufacturing Financial, Insurance & Real Estate Services Wholesale/Retail Trade Transportation Occupation Table Employment by Occupation for Hilton Head Island, South Carolina (Source: U.S. Census Bureau & MARFIN Sociodemographic Database. Louisiana Population Data Center & National Marine Fisheries Service). Occupation Sales Clerical Craft Exec/Managerial Farm/Fish/Forest Household Services Laborer/Handler Operative/Transport Service, except Household Technical Hilton Head Fishing Demographics Table Number of Federal Permit by Type for Hilton Head Island, South Carolina (Source: NMFS 2002) Type of Permit Total permitted vessels Commercial King Mackerel Commercial Spanish Mackerel Commercial Spiny Lobster Charter/Headboat for Coastal Pelagics Charter/Headboat for Snapper Grouper Snapper Grouper Class Snapper Grouper Class Swordfish Shark Rock Shrimp Federal Dealers
145 Table Employment in Fishing Related Industry for Hilton Head Island, South Carolina (Zip code Business Patterns, U.S. Census Bureau 1998) Category NAIC Code Number Employed Fishing Seafood Canning Seafood Processing Boat Building Fish and Seafoods Fish and Seafood Markets Marinas Total Fishing Employment 19 Table Number of State Permits by Type for Hilton Head, South Carolina. (Source South Carolina Division of Marine Fisheries, 2003). Type Permits Bait Dealer 0 Channel Net 0 Crab Pots 5 Drag Dredge 0 Gill Net 0 Hand Held Equipment 2 Herring Net 0 Mechanical Equipment 0 Miscellaneous Pots/Traps 0 Other Equipment 0 Peeler Crab Permit 0 Saltwater License 22 Seine Net 0 Shad Net 0 Shellfish Dealer 0 Shellfish License 1 Trawler License 12 Trotlines 0 Wholesale Dealer 4 Total
146 Table Number of State Permits by Type for Bluffton, South Carolina. (Source South Carolina Division of Marine Fisheries, 2003). Type Permits Bait Dealer 0 Channel Net 0 Crab Pots 6 Drag Dredge 0 Gill Net 0 Hand Held Equipment 4 Herring Net 0 Mechanical Equipment 0 Miscellaneous Pots/Traps 0 Other Equipment 0 Peeler Crab Permit 0 Saltwater License 26 Seine Net 0 Shad Net 1 Shellfish Dealer 2 Shellfish License 0 Trawler License 20 Trotlines 0 Wholesale Dealer 6 Total
, who was one of the Lords Proprietors of Carolina.")
147 3.2 Beaufort/Port Royal (29935) Community Description The town of Beaufort was incorporated in 1711 and is the second oldest town in South Carolina. Both Beaufort County and the town of Beaufort were named for Henry Somerset, Duke of Beaufort ( ), who was one of the Lords Proprietors of Carolina. 25 Beaufort County was incorporated in 1785 and about 1800, it began to enter more prosperous times when rice, cotton and indigo plantations were abundant. Beaufort is the county seat and located on Port Royal Island. In 1874, the town of Port Royal was incorporated and is one of the large Sea Islands along the southeast Atlantic coast of the United States. The seaport of Beaufort is located at the head of one of the largest natural harbors on the Atlantic coast. Shrimping, fishing and crabbing are of major importance to these areas. They have been a part of their history since their settlement and the local economies continue to be dependent on them. Today, the entire area of downtown Beaufort is
148 designated as a historic district. 26 Every October in Port Royal there is an annual Shrimp Festival where the local maritime history is intertwined with the tourism industry. Local shrimpers share their history and recipes with tourists. 27 Port Royal has seen its population fluctuate over the past three decades and is at a high of 4022 in The percent of unemployed persons had risen in the last decade to 9.0%. Average wage and salary have also grown but persons below the poverty level has remained about the same. Persons employed in farm, fish and forestry has also fluctuated over the years. Port Royal has no federally permitted vessels claiming it as homeport (Table ). There are a 15 persons employed in the fish and seafood sector according to Table There are only 7 state permits in Port Royal (Table ), while in near by St. Helena there are over 200 with 78 saltwater licenses, 46 trawler licenses and 9 wholesale dealers (Table ). Beaufort which is also nearby had 156 total state licenses with 58 saltwater licenses and 28 trawler licenses (Table ) Port Royal Census Demographics Population Table Total Persons and Persons by Age category for Port Royal, South Carolina (Source U.S. Census Bureau & MARFIN Sociodemographic Database. Louisiana Population Data Center & National Marine Fisheries Service). Total Persons and Age Category Total Persons Persons Age Persons Age Persons Age Persons Age Persons Age Persons Age Persons Age Persons Age Persons Age Housing Tenure Table Housing Tenure for Port Royal, South Carolina (Source: U.S. Census Bureau). Percent Renter Occupied Percent Owner Occupied
149 Residence in 1985 and 1995 Table Residence in 1985 and 1995 for Port Royal, South Carolina (Source: U.S. Census Bureau). Different House Same County Same House , Employment/Unemployment Table Employment and Unemployment for Port Royal, South Carolina (Source: U.S. Census Bureau). Persons 16 yrs and over Percent in labor force Percent unemployed Race Table Race for Port Royal, South Carolina (Source U.S. Census Bureau & MARFIN Sociodemographic Database. Louisiana Population Data Center & National Marine Fisheries Service). Race Black Persons Latino Black Persons Latino Persons White Persons Latino White Persons Education Table Years of Education by Category for those 25 Years and Older for Port Royal, South Carolina (Source: U.S. Census Bureau & MARFIN Sociodemographic Database. Louisiana Population Data Center & National Marine Fisheries Service). Education w/ 0-8 years education w/ 9-11 years education w/ HS diploma w/ years. education w/ College Degree Drop outs
150 Income and Poverty Table Average Household Wage/Salary and Persons Below the Poverty Level for Port Royal, South Carolina (Source: U.S. Census Bureau & MARFIN Sociodemographic Database. Louisiana Population Data Center & National Marine Fisheries Service). Wage or Salary Average Household Wage/Salary Income (dollars) Poverty Level Persons Below Poverty Level Age 65+ Below Poverty Level Households with Public Assistance Industry Table Employment by Industry for Port Royal, South Carolina (Source: U.S. Census Bureau & MARFIN Sociodemographic Database. Louisiana Population Data Center & National Marine Fisheries Service). Industry Agriculture, Fishing, Mining Construction Business Services Communication/Utilities Manufacturing Financial, Insurance & Real Estate Services Wholesale/Retail Trade Transportation Occupation Table Employment by Occupation for Port Royal, South Carolina (Source: U.S. Census Bureau & MARFIN Sociodemographic Database. Louisiana Population Data Center & National Marine Fisheries Service). Occupation Sales Clerical Craft Exec/Managerial Farm/Fish/Forest Household Services Laborer/Handler Operative/Transport Service, except Household Technical
151 3.2.3 Port Royal Fishing Demographics Table Number of Federal Permit by Type for Port Royal, South Carolina (Source: NMFS 2002) Type of Permit Total permitted vessels Commercial King Mackerel Commercial Spanish Mackerel Commercial Spiny Lobster Charter/Headboat for Coastal Pelagics Charter/Headboat for Snapper Grouper Snapper Grouper Class Snapper Grouper Class Swordfish Shark Rock Shrimp Federal Dealers Table Employment in Fishing Related Industry for Port Royal, South Carolina (Zip code Business Patterns, U.S. Census Bureau 1998) Category NAIC Code Number Employed Fishing Seafood Canning Seafood Processing Boat Building Fish and Seafoods Fish and Seafood Markets Marinas Total Fishing Employment 18 Table Number of State Permits by Type for Port Royal, South Carolina. (Source South Carolina Division of Marine Fisheries, 2003). Type Permits Bait Dealer 0 Channel Net 0 Crab Pots 1 Drag Dredge 0 Gill Net 0 Hand Held Equipment 0 Herring Net 0 Mechanical Equipment 0 Misc Pots/Traps 0 Other Equipment 0 Peeler Crab Permit 0 Saltwater License 3 Seine Net 0 Shad Net 0 Shellfish Dealer 0 Shellfish License 0 Trawler License 3 Trotlines 0 Wholesale Dealer 0 Total 7 144
152 Table Number of State Permits by Type for St. Helena Island, South Carolina. (Source South Carolina Division of Marine Fisheries, 2003). Type Permits Bait Dealer 2 Channel Net 0 Crab Pots 33 Drag Dredge 0 Gill Net 3 Hand Held Equipment 18 Herring Net 0 Mechanical Equipment 0 Misc Pots/Traps 0 Other Equipment 1 Peeler Crab Permit 2 Saltwater License 78 Seine Net 0 Shad Net 0 Shellfish Dealer 2 Shellfish License 14 Trawler License 46 Trotlines 0 Wholesale Dealer 9 Total 208 Table Number of State Permits by Type for Beaufort, South Carolina. (Source South Carolina Division of Marine Fisheries, 2003). Type Permits Bait Dealer 4 Channel Net 0 Crab Pots 30 Drag Dredge 0 Gill Net 0 Hand Held Equipment 12 Herring Net 0 Mechanical Equipment 0 Miscellaneous Pots/Traps 0 Other Equipment 6 Peeler Crab Permit 1 Saltwater License 58 Seine Net 0 Shad Net 0 Shellfish Dealer 2 Shellfish License 7 Trawler License 28 Trotlines 2 Wholesale Dealer 6 Total

153 3.3 Edisto Beach (29438) Community Description Edisto Beach is a small beach community that has seen steady population growth over the past thirty years. It has only about half of its population in the work force and unemployment has been and remains low. Average wage and salary have jumped significantly in the last decade and the number of persons below the poverty level has risen only slightly. The number of persons employed in farm, fish and forestry has been few, but fluctuates over time. There are no federally permitted vessels homeported in Edisto Beach (Table ) and only 3 persons employed in fish and seafood according to Table There are 52 state permits in the community with 18 of those being saltwater licenses and 10 trawler licenses (Table ). 146
154 3.3.2 Edisto Beach Census Demographics Population Table Total Persons and Persons by Age category for Edisto Beach, South Carolina (Source U.S. Census Bureau & MARFIN Sociodemographic Database. Louisiana Population Data Center & National Marine Fisheries Service). Total Persons and Age Category Total Persons Persons Age Persons Age Persons Age Persons Age Persons Age Persons Age Persons Age Persons Age Persons Age Housing Tenure Table Housing Tenure for Edisto Beach, South Carolina (Source: U.S. Census Bureau). Percent Renter Occupied Percent Owner Occupied Residence in 1985 and 1995 Table Residence in 1985 and 1995 for Edisto Beach, South Carolina (Source: U.S. Census Bureau). Different House Same County Same House Employment/Unemployment Table Employment and Unemployment for Edisto Beach, North Carolina (Source: U.S. Census Bureau). Persons 16 yrs and over Percent in labor force Percent unemployed
155 Race Table Race for Edisto Beach, South Carolina (Source U.S. Census Bureau & MARFIN Sociodemographic Database. Louisiana Population Data Center & National Marine Fisheries Service). Race Black Persons Latino Black Persons Latino Persons White Persons Latino White Persons Education Table Years of Education by Category for those 25 Years and Older for Edisto Beach, South Carolina (Source: U.S. Census Bureau & MARFIN Sociodemographic Database. Louisiana Population Data Center & National Marine Fisheries Service). Education w/ 0-8 years education w/ 9-11 years education w/ HS diploma w/ years. education w/ College Degree Drop outs Income and Poverty Table Average Household Wage/Salary and Persons Below the Poverty Level for Edisto Beach, South Carolina (Source: U.S. Census Bureau & MARFIN Sociodemographic Database. Louisiana Population Data Center & National Marine Fisheries Service). Wage or Salary Average Household Wage/Salary Income (dollars). $25443 $27617 $54444 Poverty Level Persons Below Poverty Level Age 65+ Below Poverty Level Households with Public Assistance
156 Industry Table Employment by Industry for Edisto Beach, South Carolina (Source: U.S. Census Bureau & MARFIN Sociodemographic Database. Louisiana Population Data Center & National Marine Fisheries Service). Industry Agriculture, Fishing, Mining Construction Business Services Communication/Utilities Manufacturing Financial, Insurance & Real Estate Services Wholesale/Retail Trade Transportation Occupation Table Employment by Occupation for Edisto Island, South Carolina (Source: U.S. Census Bureau & MARFIN Sociodemographic Database. Louisiana Population Data Center & National Marine Fisheries Service). Occupation Sales Clerical Craft Exec/Managerial Farm/Fish/Forest Household Services Laborer/Handler Operative/Transport Service, except Household Technical Edisto Island Fishing Demographics Table Number of Federal Permit by Type for Edisto Island, South Carolina (Source: NMFS 2002) Type of Permit Total permitted vessels Commercial King Mackerel Commercial Spanish Mackerel Commercial Spiny Lobster Charter/Headboat for Coastal Pelagics Charter/Headboat for Snapper Grouper Snapper Grouper Class Snapper Grouper Class Swordfish Shark Rock Shrimp Federal Dealers
157 Table Employment in Fishing Related Industry for Edisto Island, South Carolina (Zip code Business Patterns, U.S. Census Bureau 1998) Category NAIC Code Number Employed Fishing Seafood Canning Seafood Processing Boat Building Fish and Seafoods Fish and Seafood Markets Marinas Total Fishing Employment 3 Table Number of State Permits by Type for Edisto Island, South Carolina. (Source South Carolina Division of Marine Fisheries, 2003). Type Permits Bait Dealer 1 Channel Net 0 Crab Pots 7 Drag Dredge 0 Gill Net 0 Hand Held Equipment 6 Herring Net 0 Mechanical Equipment 0 Misc Pots/Traps 0 Other Equipment 0 Peeler Crab Permit 0 Saltwater License 18 Seine Net 0 Shad Net 0 Shellfish Dealer 2 Shellfish License 2 Trawler License 10 Trotlines 0 Wholesale Dealer 6 Total

158 3.4 Seabrook Island (29455) Community Description Seabrook has seen some population growth since 1990 with a total population of 1203 in Most of households are owner occupied which has increased over the past ten years. Unemployment has decreased to 2.3 percent in 200 while the percent of the population in the labor force has dropped from 46.9 percent in 1990 to 40.6 percent in Average wage and salary has risen slightly while number of persons living under the poverty line has decreased. Employment in farm, fish and forestry occupation and industry has dropped over the past ten years to only 3 persons in the industry category. There is only one federally permitted vessel that claims Seabrook as a homeport (Table ). All of the employment in fishing related sectors is in marinas according to Table There were no state permits for the community of Seabrook, but the nearby community of Wadmalaw Island did have 21 permits with 10 being saltwater licenses and 2 wholesale dealers (Table ). 151
159 3.4.2 Seabrook Census Demographics Population Table Total Persons and Persons by Age category for Seabrook Island, South Carolina (Source U.S. Census Bureau & MARFIN Sociodemographic Database. Louisiana Population Data Center & National Marine Fisheries Service). Total Persons and Age Category Total Persons Persons Age Persons Age Persons Age Persons Age Persons Age Persons Age Persons Age Persons Age Persons Age Housing Tenure Table Housing Tenure for Seabrook Island, South Carolina (Source: U.S. Census Bureau). Percent Renter Occupied Percent Owner Occupied Residence in 1985 and 1995 Table Residence in 1985 and 1995 for Seabrook Island, South Carolina (Source: U.S. Census Bureau). Different House Same County Same House Employment/Unemployment Table Employment and Unemployment for Seabrook Island, South Carolina (Source: U.S. Census Bureau). Persons 16 yrs and over Percent in labor force Percent unemployed
160 Race Table Race for Seabrook Island, South Carolina (Source U.S. Census Bureau & MARFIN Sociodemographic Database. Louisiana Population Data Center & National Marine Fisheries Service). Race Black Persons Latino Black Persons Latino Persons White Persons Latino White Persons Education Table Years of Education by Category for those 25 Years and Older for Seabrook Island, South Carolina (Source: U.S. Census Bureau & MARFIN Sociodemographic Database. Louisiana Population Data Center & National Marine Fisheries Service). Education w/ 0-8 years education w/ 9-11 years education w/ HS diploma w/ years. education w/ College Degree Drop outs Income and Poverty Table Average Household Wage/Salary and Persons Below the Poverty Level for Seabrook Island, South Carolina (Source: U.S. Census Bureau & MARFIN Sociodemographic Database. Louisiana Population Data Center & National Marine Fisheries Service). Wage or Salary Average Household Wage/Salary Income (dollars) Poverty Level Persons Below Poverty Level Age 65+ Below Poverty Level Households with Public Assistance
161 Industry Table Employment by Industry for Seabrook Island, South Carolina (Source: U.S. Census Bureau & MARFIN Sociodemographic Database. Louisiana Population Data Center & National Marine Fisheries Service). Industry Agriculture, Fishing, Mining Construction Business Services Communication/Utilities Manufacturing Financial, Insurance & Real Estate Services Wholesale/Retail Trade Transportation Occupation Table Employment by Occupation for Seabrook Island, South Carolina (Source: U.S. Census Bureau & MARFIN Sociodemographic Database. Louisiana Population Data Center & National Marine Fisheries Service). Occupation Sales Clerical Craft Exec/Managerial Farm/Fish/Forest Household Services Laborer/Handler Operative/Transport Service, except Household Technical Seabrook Fishing Demographics Table Number of Federal Permit by Type for Seabrook Island, South Carolina (Source: NMFS 2002) Type of Permit Total permitted vessels Commercial King Mackerel Commercial Spanish Mackerel Commercial Spiny Lobster Charter/Headboat for Coastal Pelagics Charter/Headboat for Snapper Grouper Snapper Grouper Class Snapper Grouper Class Swordfish Shark Rock Shrimp Federal Dealers
162 Table Employment in Fishing Related Industry for Seabrook Island, South Carolina (Zip code Business Patterns, U.S. Census Bureau 1998) Category NAIC Code Number Employed Fishing Seafood Canning Seafood Processing Boat Building Fish and Seafoods Fish and Seafood Markets Marinas Total Fishing Employment 31 Table Number of State Permits by Type for Wadmalaw Island, South Carolina. (Source South Carolina Division of Marine Fisheries, 2003). Type Permits Bait Dealer 0 Channel Net 0 Crab Pots 4 Drag Dredge 0 Gill Net 0 Hand Held Equipment 0 Herring Net 0 Mechanical Equipment 0 Miscellaneous Pots/Traps 0 Other Equipment 0 Peeler Crab Permit 0 Saltwater License 10 Seine Net 0 Shad Net 0 Shellfish Dealer 0 Shellfish License 0 Trawler License 5 Trotlines 0 Wholesale Dealer 2 Total

163 3.5 Mt. Pleasant (29464) Community Description The first inhabitants of the Mount Pleasant area were the Sewee Indians. The first English settlers arrived around 1680 under the leadership of Captain Florentia O Sullivan. He had been granted 2,340 acres and each time a new family arrived, they were allotted several hundred acres. The first small settlement of the area was the village of Greenwich, which was adjacent to Jacob Motte s Mount Pleasant estate. Motte s estate was purchased in 1803 and divided into 35 large lots. In 1837, the village of Greenwich was merged with Mount Pleasant. Many of the families in this area had timber concerns and some maintained the ferries. Mount Pleasant also played a leading role in the first major military engagement of the Revolutionary War in After the war, the area was known as a resort town with many stores 156
164 and rentals available. The area is still widely known as a vacation area and model town in South Carolina. 28 Mount Pleasant has seen its population double every ten years from 1970 to 1990 and now has reached a high of 47,386 in The number of persons in the labor force has dropped slightly to 69.9 percent while percent unemployed has remained fairly low at 2.2 percent. Average wage and salary has risen substantially but so has the number of persons living below the poverty level. While there was a significant jump in the number of persons working in farm, fish and forestry in 1990, that number dropped significantly in While there are only 6 vessels with federal permits homeported in Mount Pleasant (Table ), there are 12 persons listed as fishing and 28 persons employed in fish and seafood and markets (Table ). There are 170 state permits in Mt. Pleasant with 57 saltwater licenses (Table ). There were 23 trawler licenses and 11 wholesale dealer licenses Mount Pleasant Census Demographics Population Table Total Persons and Persons by Age category for Mount Pleasant, South Carolina (Source U.S. Census Bureau & MARFIN Sociodemographic Database. Louisiana Population Data Center & National Marine Fisheries Service). Total Persons and Age Category Total Persons Persons Age Persons Age Persons Age Persons Age Persons Age Persons Age Persons Age Persons Age Persons Age Housing Tenure Table Housing Tenure for Mount Pleasant, South Carolina (Source: U.S. Census Bureau). Percent Renter Occupied Percent Owner Occupied
165 Residence in 1985 and 1995 Table Residence in 1985 and 1995 for Mount Pleasant, South Carolina (Source: U.S. Census Bureau). Different House Same County Same House Employment/Unemployment Table Employment and Unemployment for Mount Pleasant, South Carolina (Source: U.S. Census Bureau). Persons 16 yrs and over Percent in labor force Percent unemployed Race Table Race for Mount Pleasant, South Carolina (Source U.S. Census Bureau & MARFIN Sociodemographic Database. Louisiana Population Data Center & National Marine Fisheries Service). Race Black Persons Latino Black Persons Latino Persons White Persons Latino White Persons Education Table Years of Education by Category for those 25 Years and Older for Mount Pleasant, South Carolina (Source: U.S. Census Bureau & MARFIN Sociodemographic Database. Louisiana Population Data Center & National Marine Fisheries Service). Education w/ 0-8 years education w/ 9-11 years education w/ HS diploma w/ years. education w/ College Degree Drop outs
166 Income and Poverty Table Average Household Wage/Salary and Persons Below the Poverty Level for Mount Pleasant, South Carolina (Source: U.S. Census Bureau & MARFIN Sociodemographic Database. Louisiana Population Data Center & National Marine Fisheries Service). Wage or Salary Average Household Wage/Salary Income (dollars) $10501 $22344 $41109 $61054 Poverty Level Persons Below Poverty Level Age 65+ Below Poverty Level Households with Public Assistance Industry Table Employment by Industry for Mount Pleasant, South Carolina (Source: U.S. Census Bureau & MARFIN Sociodemographic Database. Louisiana Population Data Center & National Marine Fisheries Service). Industry Agriculture, Fishing, Mining Construction Business Services Communication/Utilities Manufacturing Financial, Insurance & Real Estate Services Wholesale/Retail Trade Transportation Occupation Table Employment by Occupation for Mount Pleasant, South Carolina (Source: U.S. Census Bureau & MARFIN Sociodemographic Database. Louisiana Population Data Center & National Marine Fisheries Service). Occupation Sales Clerical Craft Exec/Managerial Farm/Fish/Forest Household Services Laborer/Handler Operative/Transport Service, except Household Technical
167 3.5.3 Mount Pleasant Fishing Demographics Table Number of Federal Permit by Type for Mount Pleasant, South Carolina (Source: NMFS 2002) Type of Permit Total permitted vessels Commercial King Mackerel Commercial Spanish Mackerel Commercial Spiny Lobster Charter/Headboat for Coastal Pelagics Charter/Headboat for Snapper Grouper Snapper Grouper Class Snapper Grouper Class Swordfish Shark Rock Shrimp Federal Dealers Table Employment in Fishing Related Industry for Mount Pleasant, South Carolina (Zip code Business Patterns, U.S. Census Bureau 1998) Category NAIC Code Number Employed Fishing Seafood Canning Seafood Processing Boat Building Fish and Seafoods Fish and Seafood Markets Marinas Total Fishing Employment
168 Table Number of State Permits by Type for Mount Pleasant, South Carolina. (Source South Carolina Division of Marine Fisheries, 2003). Type Permits Bait Dealer 3 Channel Net 0 Crab Pots 24 Drag Dredge 0 Gill Net 0 Hand Held Equipment 19 Herring Net 1 Mechanical Equipment 2 Miscellaneous Pots/Traps 1 Other Equipment 1 Peeler Crab Permit 1 Saltwater License 57 Seine Net 0 Shad Net 1 Shellfish Dealer 2 Shellfish License 15 Trawler License 23 Trotlines 1 Wholesale Dealer 11 Total

169 3.6 Isle of Palms (29451) Community Description Isle of Palms has seen little population growth over the past several decades. The percent of the population in the labor force has dropped slightly to 63.1 percent and unemployment is down to 1.3 percent in Average wage and salary has almost doubled every ten years since 1970 to a high of $76,170 in The number of persons below the poverty level dropped dramatically in 1990 but has since risen to 156. The number of persons in farm, fish, and forestry occupations and the industry has dropped steadily over the years. There are no vessels with federal permits that call Isle of Palms homeport (Table ) and almost all employment in fishing related businesses is in marinas with 18 and 3 persons in fish and seafood markets. There were a total of 20 state permits according to Table and 7 of those were saltwater licenses and 6 were shellfish. 162
170 3.6.2 Isle of Palms Census Demographics Population Table Total Persons and Persons by Age category for Isle of Palms, South Carolina (Source U.S. Census Bureau & MARFIN Sociodemographic Database. Louisiana Population Data Center & National Marine Fisheries Service). Total Persons and Age Category Total Persons Persons Age Persons Age Persons Age Persons Age Persons Age Persons Age Persons Age Persons Age Persons Age Housing Tenure Table Housing Tenure for Isle of Palms, South Carolina (Source: U.S. Census Bureau). Percent Renter Occupied Percent Owner Occupied Residence in 1985 and 1995 Table Residence in 1985 and 1995 for Isle of Palms, South Carolina (Source: U.S. Census Bureau). Different House Same County Same House Employment/Unemployment Table Employment and Unemployment for Isle of Palms, South Carolina (Source: U.S. Census Bureau). Persons 16 yrs and over Percent in labor force Percent unemployed
171 Race Table Race for Isle of Palms, South Carolina (Source U.S. Census Bureau & MARFIN Sociodemographic Database. Louisiana Population Data Center & National Marine Fisheries Service). Race Black Persons Latino Black Persons Latino Persons White Persons Latino White Persons Education Table Years of Education by Category for those 25 Years and Older for Isle of Palms, South Carolina (Source: U.S. Census Bureau & MARFIN Sociodemographic Database. Louisiana Population Data Center & National Marine Fisheries Service). Education w/ 0-8 years education w/ 9-11 years education w/ HS diploma w/ years. education w/ College Degree Drop outs Income and Poverty Table Average Household Wage/Salary and Persons Below the Poverty Level for Isle of Palms, South Carolina (Source: U.S. Census Bureau & MARFIN Sociodemographic Database. Louisiana Population Data Center & National Marine Fisheries Service). Wage or Salary Average Household Wage/Salary Income (dollars) $10772 $21527 $40083 $76170 Poverty Level Persons Below Poverty Level Age 65+ Below Poverty Level Households with Public Assistance
172 Industry Table Employment by Industry for Isle of Palms, South Carolina (Source: U.S. Census Bureau & MARFIN Sociodemographic Database. Louisiana Population Data Center & National Marine Fisheries Service). Industry Agriculture, Fishing, Mining Construction Business Services Communication/Utilities Manufacturing Financial, Insurance & Real Estate Services Wholesale/Retail Trade Transportation Occupation Table Employment by Occupation for Isle of Palms, South Carolina (Source: U.S. Census Bureau & MARFIN Sociodemographic Database. Louisiana Population Data Center & National Marine Fisheries Service). Occupation Sales Clerical Craft Exec/Managerial Farm/Fish/Forest Household Services Laborer/Handler Operative/Transport Service, except Household Technical
173 3.6.3 Isle of Palms Fishing Demographics Table Number of Federal Permit by Type for Isle of Palms, South Carolina (Source: NMFS 2002) Type of Permit Total permitted vessels Commercial King Mackerel Commercial Spanish Mackerel Commercial Spiny Lobster Charter/Headboat for Coastal Pelagics Charter/Headboat for Snapper Grouper Snapper Grouper Class Snapper Grouper Class Swordfish Shark Rock Shrimp Federal Dealers Table Employment in Fishing Related Industry for Isle of Palms, South Carolina (Zip code Business Patterns, U.S. Census Bureau 1998) Category NAIC Code Number Employed Fishing Seafood Canning Seafood Processing Boat Building Fish and Seafoods Fish and Seafood Markets Marinas Total Fishing Employment 21 Table Number of State Permits by Type for Isle of Palms, South Carolina. (Source South Carolina Division of Marine Fisheries, 2003). Type Permits Bait Dealer 0 Channel Net 0 Crab Pots 0 Drag Dredge 0 Gill Net 0 Hand Held Equipment 6 Herring Net 0 Mechanical Equipment 0 Miscellaneous Pots/Traps 0 Other Equipment 0 Peeler Crab Permit 0 Saltwater License 7 Seine Net 0 Shad Net 0 Shellfish Dealer 0 Shellfish License 6 Trawler License 1 Trotlines 0 Wholesale Dealer 0 Total

174 3.7 McClellanville (29458) Community Description The population of McClellanville dropped in the 1990 census but has since increased again in 2000 to 459. The percent of the population that is unemployed has remained very low while the percent of population in the work force has dropped from 64.3 percent to Average wage and salary have grown, but so has the number of persons living below the poverty level. The number of persons employed in farm, fish, and forestry occupations has remained fairly constant over the past three decades. There are 4 vessels with federal permits homeported in McClellanville and all four have rock shrimp permits (Table ). All employment in fishing related business is in fish and seafood according to Table There are 133 state permits in McClellanville, with 52 of those being saltwater licenses (Table ). There are 27 trawler licenses, 16 handheld equipment licenses and 5 wholesale dealer licenses. 167
175 3.7.2 McClellanville Census Demographics Population Table Total Persons and Persons by Age category for McClellanville, South Carolina (Source U.S. Census Bureau & MARFIN Sociodemographic Database. Louisiana Population Data Center & National Marine Fisheries Service). Total Persons and Age Category Total Persons Persons Age Persons Age Persons Age Persons Age Persons Age Persons Age Persons Age Persons Age Persons Age Housing Tenure Table Housing Tenure for McClellanville, South Carolina (Source: U.S. Census Bureau). Percent Renter Occupied Percent Owner Occupied Residence in 1985 and 1995 Table Residence in 1985 and 1995 for McClellanville, South Carolina (Source: U.S. Census Bureau). Different House Same County Same House Employment/Unemployment Table Employment and Unemployment for McClellanville, South Carolina (Source: U.S. Census Bureau). Persons 16 yrs and over Percent in labor force Percent unemployed
176 Race Table Race for McClellanville, South Carolina (Source U.S. Census Bureau & MARFIN Sociodemographic Database. Louisiana Population Data Center & National Marine Fisheries Service). Race Black Persons Latino Black Persons Latino Persons White Persons Latino White Persons Education Table Years of Education by Category for those 25 Years and Older for McClellanville, South Carolina (Source: U.S. Census Bureau & MARFIN Sociodemographic Database. Louisiana Population Data Center & National Marine Fisheries Service). Education w/ 0-8 years education w/ 9-11 years education w/ HS diploma w/ years. education w/ College Degree Drop outs Income and Poverty Table Average Household Wage/Salary and Persons Below the Poverty Level for McClellanville, South Carolina (Source: U.S. Census Bureau & MARFIN Sociodemographic Database. Louisiana Population Data Center & National Marine Fisheries Service). Wage or Salary Average Household Wage/Salary Income (dollars). $17490 $26388 $42500 Poverty Level Persons Below Poverty Level Age 65+ Below Poverty Level Households with Public Assistance
177 Industry Table Employment by Industry for McClellanville, South Carolina (Source: U.S. Census Bureau & MARFIN Sociodemographic Database. Louisiana Population Data Center & National Marine Fisheries Service). Industry Agriculture, Fishing, Mining Construction Business Services Communication/Utilities Manufacturing Financial, Insurance & Real Estate Services Wholesale/Retail Trade Transportation Occupation Table Employment by Occupation for McClellanville, South Carolina (Source: U.S. Census Bureau & MARFIN Sociodemographic Database. Louisiana Population Data Center & National Marine Fisheries Service). Occupation Sales Clerical Craft Exec/Managerial Farm/Fish/Forest Household Services Laborer/Handler Operative/Transport Service, except Household Technical McClellanville Fishing Demographics Table Number of Federal Permit by Type for McClellanville, South Carolina (Source: NMFS 2002) Type of Permit Total permitted vessels Commercial King Mackerel Commercial Spanish Mackerel Commercial Spiny Lobster Charter/Headboat for Coastal Pelagics Charter/Headboat for Snapper Grouper Snapper Grouper Class Snapper Grouper Class Swordfish Shark Rock Shrimp Federal Dealers
178 Table Employment in Fishing Related Industry for McClellanville, South Carolina (Zip code Business Patterns, U.S. Census Bureau 1998) Category NAIC Code Number Employed Fishing Seafood Canning Seafood Processing Boat Building Fish and Seafoods Fish and Seafood Markets Marinas Total Fishing Employment 50 Table Number of State Permits by Type for McClellanville, South Carolina. (Source South Carolina Division of Marine Fisheries, 2003). Type Permits Bait Dealer 2 Channel Net 0 Crab Pots 5 Drag Dredge 0 Gill Net 0 Hand Held Equipment 16 Herring Net 0 Mechanical Equipment 4 Miscellaneous Pots/Traps 0 Other Equipment 0 Peeler Crab Permit 1 Saltwater License 52 Seine Net 0 Shad Net 0 Shellfish Dealer 3 Shellfish License 7 Trawler License 27 Trotlines 0 Wholesale Dealer 5 Total

179 3.8 Georgetown (29440) Community Description Georgetown is South Carolina s third oldest city, following Charleston and Beaufort. 29 The town became a busy seaport by 1729 as the import and export of cargo created wealth for the town, as well as targets for the pirates who were hiding out in the bays of the barrier islands. Many of the local stores in the area sold naval materials and uniforms. The indigo plant, of which the blue dye was derived from, grew along the coastal plains. An aristocratic society of plantation owners was established and they formed the Winyah Indigo Society. However as the price of the dye fell from overseas markets, local planters began cultivating rice instead. The original rice seeds were brought in from Madagascar to the port of Charleston around Grocers in England were said to praise the Carolina Gold rice above all other rice. Rice even was used as a replacement for money, being accepted as payment for taxes. However with the Emancipation Proclamation and destructive
180 hurricanes, the last commercial rice harvest in Georgetown County was in The area then turned to lumber production. In 1936, the International Paper Company built a plant in Georgetown. By 1942, this plant became the largest craft paper mill in the world. Commercial fishing and tourism are now significant industries in the area that contribute greatly to its economic well-being. 31 Georgetown s population has been declining from 1980 when it was 10,144 until 2000 where it dropped to 8,934. Georgetown s population is predominantly African-American and has approximately 56 percent of its population in the labor force. The unemployment rate has gone down since 1990 to 7.8 percent. Average wage and salary have grown slightly over the past 30 years, but the number of people living below the poverty level has dropped little. As is the case for most communities the number of persons employed in farm, fish and forestry has seen a steady decline. There are five vessels with federal permits homeported in Georgetown (Table ) and most fishing related employment is in boat building (Table ). There are 8 persons reported as working in fish and seafood and markets also. With little fishing employment evident elsewhere, it is surprising to see over 350 state permits issued for Georgetown residents. Over 140 of those permits were for saltwater licenses and 50 were trawler permits. There are 13 wholesale dealer licenses in the community as well as, 64 crab pot permits and 27 channel net (Table ) Georgetown Census Demographics Population Table Total Persons and Persons by Age category for Georgetown, South Carolina (Source U.S. Census Bureau & MARFIN Sociodemographic Database. Louisiana Population Data Center & National Marine Fisheries Service). Total Persons and Age Category Total Persons Persons Age Persons Age Persons Age Persons Age Persons Age Persons Age Persons Age Persons Age Persons Age Housing Tenure Table Housing Tenure for Georgetown, South Carolina (Source: U.S. Census Bureau). Percent Renter Occupied Percent Owner Occupied
181 Residence in 1985 and 1995 Table Residence in 1985 and 1995 for Georgetown, South Carolina (Source: U.S. Census Bureau). Different House Same County ,174 2,129 Same House ,222 4, Employment/Unemployment Table Employment and Unemployment for Georgetown, South Carolina (Source: U.S. Census Bureau). Persons 16 yrs and over Percent in labor force Percent unemployed Race Table Race for Georgetown, South Carolina (Source U.S. Census Bureau & MARFIN Sociodemographic Database. Louisiana Population Data Center & National Marine Fisheries Service). Race Black Persons Latino Black Persons Latino Persons White Persons Latino White Persons Education Table Years of Education by Category for those 25 Years and Older for Georgetown, South Carolina (Source: U.S. Census Bureau & MARFIN Sociodemographic Database. Louisiana Population Data Center & National Marine Fisheries Service). Education w/ 0-8 years education w/ 9-11 years education w/ HS diploma w/ years. education w/ College Degree Drop outs
182 Income and Poverty Table Average Household Wage/Salary and Persons Below the Poverty Level for Georgetown, South Carolina (Source: U.S. Census Bureau & MARFIN Sociodemographic Database. Louisiana Population Data Center & National Marine Fisheries Service). Wage or Salary Average Household Wage/Salary Income (dollars). $14727 $26608 $29424 Poverty Level Persons Below Poverty Level Age 65+ Below Poverty Level Households with Public Assistance Industry Table Employment by Industry for Georgetown, South Carolina (Source: U.S. Census Bureau & MARFIN Sociodemographic Database. Louisiana Population Data Center & National Marine Fisheries Service). Industry Agriculture, Fishing, Mining Construction Business Services Communication/Utilities Manufacturing Financial, Insurance & Real Estate Services Wholesale/Retail Trade Transportation Occupation Table Employment by Occupation for Georgetown, South Carolina (Source: U.S. Census Bureau & MARFIN Sociodemographic Database. Louisiana Population Data Center & National Marine Fisheries Service). Occupation Sales Clerical Craft Exec/Managerial Farm/Fish/Forest Household Services Laborer/Handler Operative/Transport Service, except Household Technical
183 3.8.3 Georgetown Fishing Demographics Table Number of Federal Permit by Type for Georgetown, South Carolina (Source: NMFS 2002) Type of Permit Total permitted vessels Commercial King Mackerel Commercial Spanish Mackerel Commercial Spiny Lobster Charter/Headboat for Coastal Pelagics Charter/Headboat for Snapper Grouper Snapper Grouper Class Snapper Grouper Class Swordfish Shark Rock Shrimp Federal Dealers Table Employment in Fishing Related Industry for Georgetown, South Carolina (Zip code Business Patterns, U.S. Census Bureau 1998) Category NAIC Code Number Employed Fishing Seafood Canning Seafood Processing Boat Building Fish and Seafoods Fish and Seafood Markets Marinas Total Fishing Employment 40 Table Number of State Permits by Type for Georgetown, South Carolina. (Source South Carolina Division of Marine Fisheries, 2003). Type Permits Bait Dealer 2 Channel Net 27 Crab Pots 64 Drag Dredge 0 Gill Net 2 Hand Held Equipment 11 Herring Net 0 Mechanical Equipment 0 Miscellaneous Pots/Traps 0 Other Equipment 0 Peeler Crab Permit 2 Saltwater License 144 Seine Net 0 Shad Net 25 Shellfish Dealer 0 Shellfish License 10 Trawler License 50 Trotlines 2 Wholesale Dealer 13 Total

184 3.9 Murrells Inlet (29576) Community Description Murrells Inlet is known as the Seafood Capital of South Carolina. The origin of its name remains a mystery. However Murrells Inlet was officially named by the post office in The first settlers of the area were Native American Tribes. However beginning in the 16 th and 17 th Centuries, Spanish and English colonists arrived in the area. Pirates also utilized the Inlet s winding creeks for refuge and a hiding place. Large tracts of land were cultivated into successful rice plantations. By 1850, almost 47 million pounds of rice were produced in this area. Murrells Inlet was used a port during the Civil War to sneak cotton and other products to England in exchange for war supplies, such as food and medicine. The Civil War led to the decline of the rice culture and in 1916, the last remaining commercial rice grower was out of business. 177
185 By this time, commercial and recreational fishing became a popular industry. By 1914, captain-led fishing excursions cost $5 per person for a day trip out of the Inlet on a 20-foot skiff. Today, charter, recreational and commercial fishing are still popular in Murrells Inlet. 32 Murrells Inlet has seen its population increase to a high of 5492 in The percentage of owner occupied housing has also increased to 85 percent. The percent of the population in the labor force has remained practically the same while unemployment has risen from 3 percent in 1990 to 5.2 percent in Average wage and salary has risen over the past few decades while the number of persons living below the poverty level has fluctuated and now is 435 in The number of persons working in farm, fish and forestry occupations has seen a decline like most communities. There are a total of 33 vessels with federal permits. The majority has king mackerel and snapper grouper class 1 permits. Almost half of those permitted vessels have charter permits for either coastal pelagics or snapper grouper (Table ). There are four federal dealers in the community. Most of the fishing employment is in fish and seafood markets with 10 persons employed in that sector out of the 16 total (Table ). There are 111 state permits issued to residents of Murrell s Inlet. Forty-four of those permits are for saltwater licenses. Another 14 are for handheld equipment and 12 are for crab pots. There are 10 wholesale dealer licenses held by Murrell s Inlet residents (Table ) Murrell s Inlet Census Demographics Population Table Total Persons and Persons by Age category for Murrell s Inlet, South Carolina (Source U.S. Census Bureau & MARFIN Sociodemographic Database. Louisiana Population Data Center & National Marine Fisheries Service). Total Persons and Age Category Total Persons Persons Age Persons Age Persons Age Persons Age Persons Age Persons Age Persons Age Persons Age Persons Age
186 Housing Tenure Table Housing Tenure for Murrell s Inlet, South Carolina (Source: U.S. Census Bureau). Percent Renter Occupied Percent Owner Occupied Residence in 1985 and 1995 Table Residence in 1985 and 1995 for Murrell s Inlet, South Carolina (Source: U.S. Census Bureau). Different House Same County Same House Employment/Unemployment Table Employment and Unemployment for Murrell s Inlet, South Carolina (Source: U.S. Census Bureau). Persons 16 yrs and over Percent in labor force Percent unemployed Race Table Race for Murrell s Inlet, South Carolina (Source U.S. Census Bureau & MARFIN Sociodemographic Database. Louisiana Population Data Center & National Marine Fisheries Service). Race Black Persons Latino Black Persons Latino Persons White Persons Latino White Persons
187 Education Table Years of Education by Category for those 25 Years and Older for Murrell s Inlet, South Carolina (Source: U.S. Census Bureau & MARFIN Sociodemographic Database. Louisiana Population Data Center & National Marine Fisheries Service). Education w/ 0-8 years education w/ 9-11 years education w/ HS diploma w/ years. education w/ College Degree Drop outs Income and Poverty Table Average Household Wage/Salary and Persons Below the Poverty Level for Murrell s Inlet, South Carolina (Source: U.S. Census Bureau & MARFIN Sociodemographic Database. Louisiana Population Data Center & National Marine Fisheries Service). Wage or Salary Average Household Wage/Salary Income (dollars). $13233 $30776 $39877 Poverty Level Persons Below Poverty Level Age 65+ Below Poverty Level Households with Public Assistance Industry Table Employment by Industry for Murrell s Inlet, South Carolina (Source: U.S. Census Bureau & MARFIN Sociodemographic Database. Louisiana Population Data Center & National Marine Fisheries Service). Industry Agriculture, Fishing, Mining Construction Business Services Communication/Utilities Manufacturing Financial, Insurance & Real Estate Services Wholesale/Retail Trade Transportation
188 Occupation Table Employment by Occupation for Murrell s Inlet, South Carolina (Source: U.S. Census Bureau & MARFIN Sociodemographic Database. Louisiana Population Data Center & National Marine Fisheries Service). Occupation Sales Clerical Craft Exec/Managerial Farm/Fish/Forest Household Services Laborer/Handler Operative/Transport Service, except Household Technical Murrell s Inlet Fishing Demographics Table Number of Federal Permit by Type for Murrell s Inlet, South Carolina (Source: NMFS 2002) Type of Permit Total permitted vessels Commercial King Mackerel Commercial Spanish Mackerel Commercial Spiny Lobster Charter/Headboat for Coastal Pelagics Charter/Headboat for Snapper Grouper Snapper Grouper Class Snapper Grouper Class Swordfish Shark Rock Shrimp Federal Dealers Table Employment in Fishing Related Industry for Murrell s Inlet, South Carolina (Zip code Business Patterns, U.S. Census Bureau 1998) Category NAIC Code Number Employed Fishing Seafood Canning Seafood Processing Boat Building Fish and Seafoods Fish and Seafood Markets Marinas Total Fishing Employment
189 Table Number of State Permits by Type for Murrells Inlet, South Carolina. (Source South Carolina Division of Marine Fisheries, 2003). Type Permits Bait Dealer 4 Channel Net 0 Crab Pots 12 Drag Dredge 0 Gill Net 0 Hand Held Equipment 14 Herring Net 0 Mechanical Equipment 0 Miscellaneous Pots/Traps 0 Other Equipment 0 Peeler Crab Permit 3 Saltwater License 44 Seine Net 0 Shad Net 0 Shellfish Dealer 8 Shellfish License 7 Trawler License 9 Trotlines 0 Wholesale Dealer 10 Total

190 3.10 Little River (29566) Community Description Native American tribes who settled this area called the stream Mineola, which means Little River. Little River is one of the oldest settlements along the South Carolina coast. Fishermen and farmers began settling the area in the late 1600s and 1700s. The small, protected harbor was a refuge for shipwreck survivors and pirates, who needed a place to repair their boats and rest. It is still common to see treasure maps attempting to locate buried treasure on the placemats of the local restaurants. For a time, Little River became known as Yankee Town by the rest of Horry County because of the settlers from New England. The area became a thriving port town in the 1850s. The shipments included fine lumber and navel supplies to Northern markets. The town had a few stores, sawmill, water house, school, churches and a bank. However the Civil War halted much of the town s 183
191 developments. Today, Little River is widely known for its charter boats, deep-sea and commercial fishing. 33 Little River s population has nearly doubled in the last decade. The percent of owner occupied housing has risen from 61 percent in 1990 to over 80 percent in The percent of the population in the labor force has remained unchanged while unemployment has dropped. Average wage and salary have increased and so has the number of person living below the poverty level. The number of person working in the agriculture, fishing and mining sector has grown to 87 over the past ten years, while those in the occupation of farm, fishing and forestry has dropped. There are 17 vessels with federal permits homeported in Little River and the majority of them have either snapper grouper class 1 or snapper grouper charter permits (Table ). Fishing related employment reported in Table is mostly in the marinas sector with 31 persons and 7 more are in fish and seafood.. Of the 24 state permits listed in Table , ten were for saltwater licenses Little River Census Demographics Population Table Total Persons and Persons by Age category for Little River, South Carolina (Source U.S. Census Bureau & MARFIN Sociodemographic Database. Louisiana Population Data Center & National Marine Fisheries Service). Total Persons and Age Category Total Persons Persons Age Persons Age Persons Age Persons Age Persons Age Persons Age Persons Age Persons Age Persons Age Housing Tenure Table Housing Tenure for Little River, South Carolina (Source: U.S. Census Bureau). Percent Renter Occupied Percent Owner Occupied
192 Residence in 1985 and 1995 Table Residence in 1985 and 1995 for Little River, South Carolina (Source: U.S. Census Bureau). Different House Same County Same House Employment/Unemployment Table Employment and Unemployment for Little River, South Carolina (Source: U.S. Census Bureau). Persons 16 yrs and over Percent in labor force Percent unemployed Race Table Race for Little River, South Carolina (Source U.S. Census Bureau & MARFIN Sociodemographic Database. Louisiana Population Data Center & National Marine Fisheries Service). Race Black Persons Latino Black Persons Latino Persons White Persons Latino White Persons Education Table Years of Education by Category for those 25 Years and Older for Little River, South Carolina (Source: U.S. Census Bureau & MARFIN Sociodemographic Database. Louisiana Population Data Center & National Marine Fisheries Service). Education w/ 0-8 years education w/ 9-11 years education w/ HS diploma w/ years. education w/ College Degree Drop outs
193 Income and Poverty Table Average Household Wage/Salary and Persons Below the Poverty Level for Little River, South Carolina (Source: U.S. Census Bureau & MARFIN Sociodemographic Database. Louisiana Population Data Center & National Marine Fisheries Service). Wage or Salary Average Household Wage/Salary Income (dollars).. $30023 $40427 Poverty Level Persons Below Poverty Level Age 65+ Below Poverty Level Households with Public Assistance Industry Table Employment by Industry for Little River, South Carolina (Source: U.S. Census Bureau & MARFIN Sociodemographic Database. Louisiana Population Data Center & National Marine Fisheries Service). Industry Agriculture, Fishing, Mining Construction Business Services Communication/Utilities Manufacturing Financial, Insurance & Real Estate Services Wholesale/Retail Trade Transportation Occupation Table Employment by Occupation for Little River, South Carolina (Source: U.S. Census Bureau & MARFIN Sociodemographic Database. Louisiana Population Data Center & National Marine Fisheries Service). Occupation Sales Clerical Craft Exec/Managerial Farm/Fish/Forest Household Services Laborer/Handler Operative/Transport Service, except Household Technical
194 Little River Fishing Demographics Table Number of Federal Permit by Type for Little River, South Carolina (Source: NMFS 2002) Type of Permit Total permitted vessels Commercial King Mackerel Commercial Spanish Mackerel Commercial Spiny Lobster Charter/Headboat for Coastal Pelagics Charter/Headboat for Snapper Grouper Snapper Grouper Class Snapper Grouper Class Swordfish Shark Rock Shrimp Federal Dealers Table Employment in Fishing Related Industry for Little River, South Carolina (Zip code Business Patterns, U.S. Census Bureau 1998) Category NAIC Code Number Employed Fishing Seafood Canning Seafood Processing Boat Building Fish and Seafoods Fish and Seafood Markets Marinas Total Fishing Employment 38 Table Number of State Permits by Type for Little River, South Carolina. (Source South Carolina Division of Marine Fisheries, 2003). Type Permits Bait Dealer 0 Channel Net 0 Crab Pots 2 Drag Dredge 0 Gill Net 2 Hand Held Equipment 2 Herring Net 0 Mechanical Equipment 0 Miscellaneous Pots/Traps 1 Other Equipment 0 Peeler Crab Permit 0 Saltwater License 8 Seine Net 0 Shad Net 0 Shellfish Dealer 0 Shellfish License 1 Trawler License 5 Trotlines 0 Wholesale Dealer 3 Total
195 3.11 South Carolina Fishing Infrastructure and Community Characterization The following tables provide a general view of the presence or absence of fishing infrastructure located within the coastal communities of South Carolina with substantial fishing activity. It should be noted that there are many other attributes that might have been included in this table, however, because of inconsistency in rapid appraisal for all communities, these items were selected as the most consistently reported or had secondary data available to determine presence or absence. It should also be noted that in some cases certain infrastructure may exist within a community but was not readily apparent or could not be ascertained through secondary data. Table offers an overview of the presence of the selected infrastructure items and provides an overall total score which is merely the total of infrastructure present. Table Fishing Infrastructure Table for South Carolina Potential Fishing Communities Federal Commercial Permits (5+) State Commercial Licenses (10+) Federal Charter Permits (5+) Seafood Landings Fish processors, Wholesale fish house Recreational docks / marinas Recreational Fishing Tournaments Community Hilton Head Island Port Royal Edisto Beach Seabrook Island Mt. Pleasant Isle of Palms McClellanville Georgetown Murrells Inlet Little River In attempting a preliminary characterization of potential fishing communities in Table , we have provided a grouping of communities that appear to have more involvement in various fishing enterprises and therefore are classified as primarily involved. These communities have considerable fishing infrastructure, but also have a history and culture surrounding both commercial and recreational fishing that contributes to an appearance and perception of being a fishing community in the mind of residents and others. The communities are not ranked in any particular order, this is merely a categorization. Total Table Preliminary Characterization of Potential Fishing Communities in South Carolina Primarily-Involved Secondarily-Involved Mt. Pleasant Edisto Beach McClellanville Seabrook Island Georgetown Isle of Palms Murrells Inlet Little River Hilton Head Island 188
196 Charleston, while having many commercial and charter permits is a large enough metropolitan area that fishing is rather small when compared to the larger economy and although historically may have played a role in the community culture is likely not a major focus historically or does it play a large role in the economy at this time. It is likely that the fishing community of Charleston has become ensconced in other parts of the metropolitan area, such as Shem Creek (Mt. Pleasant) and has become a component of that community s history and culture. Many of these communities are in transition due to various social and demographic changes from coastal development, growing populations, increasing tourism, changing regulations, etc. This preliminary characterization is just that and should not be considered a definite designation as fishing community, but a general guide for locating communities that may warrant consideration as a potential fishing community. 189

197 4.0 Georgia Communities with Substantial Fishing Activity Figure 4.1 Potential Fishing Communities of Georgia. Georgia landed over 9 million pounds of seafood in both 2001 and The value of those landings was over 14 million dollars in 2001 and over 15 million dollars in No Georgia port was listed in the top 50 U.S. ports in terms of pounds landed or in terms of value of landings. According to NMFS (2002) Georgia recreational fishermen landed over 2 million pounds of finfish in 2001 and in 2002 that number dropped to just over than 1 million pounds. There were 5 processors in Georgia for 2001 with a total of 1,119 employees and 30 wholesale dealers employing 432 persons. In the years 2001 and 2002, Georgia did have approximately 265 and 226 registered vessels respectively. Georgia has had just over 50 federally permitted vessels since 1998 and through The majority of those vessels carried rock shrimp permits with the next most common being king mackerel and snapper grouper class 1. It must be remembered that there is no shrimp permit in the South Atlantic region; so many vessels in the state are not included in the federal permit list. 190
198 Table 4.1 Number of Federal Permit by Type for Georgia (Source: NMFS 2002) Type of Permit Total permitted vessels Commercial King Mackerel Commercial Spanish Mackerel Commercial Spiny Lobster Charter/Headboat for Coastal Pelagics Charter/Headboat for Snapper Grouper Snapper Grouper Class Snapper Grouper Class Swordfish Shark Rock Shrimp The disparity between federal and state permits is evident in Table 4.2 where 947 licensed commercial fishing vessels are listed and 482 of those have shrimp gear. Overall, Georgia has 759 licensed fishermen and 612 of those are full-time. Table 4.2. Number of State Permit by Type for Georgia (Source: GADNR 2002) Type Number Commercial Fishing Vessel Registration 947 Vessels with shrimp gear 482 Full-time commercial fishermen 612 Part-time commercial fishermen 147 Georgia requires commercial fishermen to be licensed and also requires a license for commercial crabbing and commercial cast netting. A commercial trawling license is required to use power drawn nets in the state waters. In addition, the state requires a dealer license for retail and wholesale fish to be sold, soft-shell crab and bait dealers. 191

199 Figure 4.2. Georgia State Fishing Permits by Zip Code for

200 4.1 Tybee Island ( 31328) Community Description Tybee Island stands at the mouth of the Savannah River. In 1736, a 90 foot lighthouse was built to help aid navigation in the area. At this time in America, this structure was the tallest. This lighthouse had to be rebuilt three times, lastly in 1773, due to storms. 34 It currently stands at 154 feet tall and is Georgia s oldest lighthouse. After the Civil War, Tybee began to grow into a resort area. Before 1870 there were very few full time residents, but by the 1890s, there were over 400 beach cottages and local business for the summer residents. Tybee is still an attractive tourist destination with seven miles of beaches, with many options for both inshore and offshore fishing. The population of Tybee Island has grown steadily over the past 20 years. The percent of the population in the labor force has also remained stable at around 61 percent and the percent of unemployed around 4.5 percent. Average wage and salary has increased to a high of $49,741 in
201 2000 while the number of persons living below the poverty level has remained around 330. The number person employed in the farm, fish, and forestry sectors of industry and occupation has slowly declined to where there were none reported in This is consistent with Table where there are no vessels listed with federal permits for 2000 or Furthermore Table lists 3 persons employed in boat building as the only fishing related employment. There are however, 7 commercial vessels registered with the state from Tybee Island and all seven have full time fishermen as owners (Table ) Tybee Island Census Demographics Population Table Total Persons and Persons by Age category for Tybee Island, Georgia (Source U.S. Census Bureau & MARFIN Sociodemographic Database. Louisiana Population Data Center & National Marine Fisheries Service). Total Persons and Age Category Total Persons Persons Age Persons Age Persons Age Persons Age Persons Age Persons Age Persons Age Persons Age Persons Age Housing Tenure Table Housing Tenure for Tybee Island, Georgia (Source: U.S. Census Bureau). Percent Renter Occupied Percent Owner Occupied Residence in 1985 and 1995 Table Residence in 1985 and 1995 for Tybee Island, Georgia (Source: U.S. Census Bureau). Different House Same County Same House ,134 1,
202 Employment/Unemployment Table Employment and Unemployment for Tybee Island, Georgia (Source: U.S. Census Bureau). Persons 16 yrs and over Percent in labor force Percent unemployed Race Table Race for Tybee Island, Georgia (Source U.S. Census Bureau & MARFIN Sociodemographic Database. Louisiana Population Data Center & National Marine Fisheries Service). Race Black Persons Latino Black Persons Latino Persons White Persons Latino White Persons Education Table Years of Education by Category for those 25 Years and Older for Tybee Island, Georgia (Source: U.S. Census Bureau & MARFIN Sociodemographic Database. Louisiana Population Data Center & National Marine Fisheries Service). Education w/ 0-8 years education w/ 9-11 years education w/ HS diploma w/ years. education w/ College Degree Drop outs Income and Poverty Table Average Household Wage/Salary and Persons Below the Poverty Level for Tybee Island, Georgia (Source: U.S. Census Bureau & MARFIN Sociodemographic Database. Louisiana Population Data Center & National Marine Fisheries Service). Wage or Salary Average Household Wage/Salary Income (dollars). $17558 $33194 $49741 Poverty Level Persons Below Poverty Level Age 65+ Below Poverty Level Households with Public Assistance
203 Industry Table Employment by Industry for Tybee Island, Georgia (Source: U.S. Census Bureau & MARFIN Sociodemographic Database. Louisiana Population Data Center & National Marine Fisheries Service). Industry Agriculture, Fishing, Mining Construction Business Services Communication/Utilities Manufacturing Financial, Insurance & Real Estate Services Wholesale/Retail Trade Transportation Occupation Table Employment by Occupation for Tybee Island, Georgia (Source: U.S. Census Bureau & MARFIN Sociodemographic Database. Louisiana Population Data Center & National Marine Fisheries Service). Occupation Sales Clerical Craft Exec/Managerial Farm/Fish/Forest Household Services Laborer/Handler Operative/Transport Service, except Household Technical Tybee Island Fishing Demographics Table Number of Federal Permit by Type for Tybee Island, Georgia (Source: NMFS 2002) Type of Permit Total permitted vessels Commercial King Mackerel Commercial Spanish Mackerel Commercial Spiny Lobster Charter/Headboat for Coastal Pelagics Charter/Headboat for Snapper Grouper Snapper Grouper Class Snapper Grouper Class Swordfish Shark Rock Shrimp Federal Dealers
204 Table Employment in Fishing Related Industry for Tybee Island, Georgia (Zip code Business Patterns, U.S. Census Bureau 1998). Category NAIC Code Number Employed Fishing Seafood Canning Seafood Processing Boat Building Fish and Seafoods Fish and Seafood Markets Marinas Total Fishing Employment 3 Table Number of State Permit by Type for Tybee Island, Georgia (Source: GADNR 2002). Type Number Commercial Fishing Vessel Registration 7 Vessels with shrimp gear 3 Full-time commercial fishermen 7 Part-time commercial fishermen 0 197

205 4.2 Thunderbolt (31404, 31410) Community Description Thunderbolt s population has fluctuated over the past three decades and most recently declined during 1990 to 2000 where it stands at While the percent of population in the labor force has remained fairly stable, unemployment dropped significantly from a high of 17.2 in 1990 to 4.4 percent in Average wage and salary have risen slowly and the number of persons living below the poverty level has fluctuated some, but remains over 250. The number of persons employed in the farm, fish and forestry sectors under occupation and industry has dropped to zero over the past decade. This is consistent with fishing demographics as there are no vessels with federal permits listing Thunderbolt as homeport. There are at least three vessels registered with the state and three individuals who consider themselves to be full-time commercial fishermen according to Table
206 4.2.2 Thunderbolt Census Demographics Population Table Total Persons and Persons by Age category for Thunderbolt, Georgia (Source U.S. Census Bureau & MARFIN Sociodemographic Database. Louisiana Population Data Center & National Marine Fisheries Service). Total Persons and Age Category Total Persons Persons Age Persons Age Persons Age Persons Age Persons Age Persons Age Persons Age Persons Age Persons Age Housing Tenure Table Housing Tenure for Thunderbolt, Georgia (Source: U.S. Census Bureau). Percent Renter Occupied Percent Owner Occupied Residence in 1985 and 1995 Table Residence in 1985 and 1995 for Thunderbolt, Georgia (Source: U.S. Census Bureau). Different House Same County Same House
207 Employment/Unemployment Table Employment and Unemployment for Thunderbolt, Georgia (Source: U.S. Census Bureau). Persons 16 yrs and over Percent in labor force Percent unemployed Race Table Race for Thunderbolt, Georgia (Source U.S. Census Bureau & MARFIN Sociodemographic Database. Louisiana Population Data Center & National Marine Fisheries Service). Race Black Persons Latino Black Persons Latino Persons White Persons Latino White Persons Education Table Years of Education by Category for those 25 Years and Older for Thunderbolt, Georgia (Source: U.S. Census Bureau & MARFIN Sociodemographic Database. Louisiana Population Data Center & National Marine Fisheries Service). Education w/ 0-8 years education w/ 9-11 years education w/ HS diploma w/ years. education w/ College Degree Drop outs
208 Income and Poverty Table Average Household Wage/Salary and Persons Below the Poverty Level for Thunderbolt, Georgia (Source: U.S. Census Bureau & MARFIN Sociodemographic Database. Louisiana Population Data Center & National Marine Fisheries Service). Wage or Salary Average Household Wage/Salary Income (dollars) $9079 $16017 $33591 $35824 Poverty Level Persons Below Poverty Level Age 65+ Below Poverty Level Households with Public Assistance Industry Table Employment by Industry for Thunderbolt, Georgia (Source: U.S. Census Bureau & MARFIN Sociodemographic Database. Louisiana Population Data Center & National Marine Fisheries Service). Industry Agriculture, Fishing, Mining Construction Business Services Communication/Utilities Manufacturing Financial, Insurance & Real Estate Services Wholesale/Retail Trade Transportation Occupation Table Employment by Occupation for Thunderbolt, Georgia (Source: U.S. Census Bureau & MARFIN Sociodemographic Database. Louisiana Population Data Center & National Marine Fisheries Service). Occupation Sales Clerical Craft Exec/Managerial Farm/Fish/Forest Household Services Laborer/Handler Operative/Transport Service, except Household Technical
209 4.2.3 Thunderbolt Fishing Demographics Table Number of Federal Permit by Type for Thunderbolt, Georgia (Source: NMFS 2002) Type of Permit Total permitted vessels Commercial King Mackerel Commercial Spanish Mackerel Commercial Spiny Lobster Charter/Headboat for Coastal Pelagics Charter/Headboat for Snapper Grouper Snapper Grouper Class Snapper Grouper Class Swordfish Shark Rock Shrimp Federal Dealers Table Employment in Fishing Related Industry for Thunderbolt, Georgia (Zip code Business Patterns, U.S. Census Bureau 1998) Category NAIC Code Number Employed Fishing Seafood Canning Seafood Processing Boat Building Fish and Seafoods Fish and Seafood Markets Marinas Total Fishing Employment 69 Table Number of State Permit by Type for Thunderbolt, Georgia (Source: GADNR 2002) Type Number Commercial Fishing Vessel Registration 3 Vessels with shrimp gear 1 Full-time commercial fishermen 3 Part-time commercial fishermen 0 202

210 4.3 Darien (31305) Community Description Darien was settled by Scottish Highlanders in the mid-1700s. During the 1800s, it was a leading seaport on the east coast. Even today, many shrimp fishing boats dock at the waterfront. 35 Darien was named in honor of the unsuccessful colonization led by Darien Scots, at the Isthmus of Panama. After the American Revolution, Darien became an important port due to its position near the mouth of the Altamaha River. In 1816, the town of Darien was incorporated and it became the county seat in The area became known as an international shipping port which was frequented by ships from Asia, Europe and South America. In 1900, more than 100 million linear board feet of timber and lumber were shipped from Darien. However, these shipments began to decline and in 1916, the last of Darien s sawmills went bankrupt. By the mid 1920s, the area experienced renewed growth with the
211 commercial seafood industry. Many turned to the productive nearshore waters for their livelihood. By the early 1960s, McIntosh County had the largest shrimping fleet on the Georgia coast, with several oyster and shrimp packing houses along the banks of the Altamaha River. Even though today this area is economically dependent on tourism, commercial fishing is still the livelihood for many members of the community. 36 Over the past decade Darien s population has remained almost unchanged. Other demographic variables have also remained fairly stable as average wage and salary have also remained practically the same in 1990 and The number of persons living under the poverty level has also remained stable, while the percent of population in the labor force has gone up slightly; the unemployment percentage has gone down from 9.9 in 1990 to 2.4 in While there has been a decline in the number of persons reported in farm, fish and forestry occupations and industry there remain about 17 persons in those sectors. Darien does have 3 vessels with federal permits according to Table and fishing related employment shows 12 people employed in the sectors of fishing, seafood processing and fish and seafood (Table ). The state has 92 commercial vessels registered in Darien and 44 of those have shrimp gear. Of those vessels registered, 61 consider themselves to be full time commercial fishermen and 3 part time (Table ) Darien Census Demographics Population Table Total Persons and Persons by Age category for Darien, Georgia (Source U.S. Census Bureau & MARFIN Sociodemographic Database. Louisiana Population Data Center & National Marine Fisheries Service). Total Persons and Age Category Total Persons Persons Age Persons Age Persons Age Persons Age Persons Age Persons Age Persons Age Persons Age Persons Age
212 Housing Tenure Table Housing Tenure for Darien, Georgia (Source: U.S. Census Bureau). Percent Renter Occupied Percent Owner Occupied Residence in 1985 and 1995 Table Residence in 1985 and 1995 for Darien, Georgia (Source: U.S. Census Bureau). Different House Same County Same House Employment/Unemployment Table Employment and Unemployment for Darien, Georgia (Source: U.S. Census Bureau). Persons 16 yrs and over Percent in labor force Percent unemployed Race Table Race for Darien, Georgia (Source U.S. Census Bureau & MARFIN Sociodemographic Database. Louisiana Population Data Center & National Marine Fisheries Service). Race Black Persons Latino Black Persons Latino Persons White Persons Latino White Persons
213 Education Table Years of Education by Category for those 25 Years and Older for Darien, Georgia (Source: U.S. Census Bureau & MARFIN Sociodemographic Database. Louisiana Population Data Center & National Marine Fisheries Service). Education w/ 0-8 years education w/ 9-11 years education w/ HS diploma w/ years. education w/ College Degree Drop outs Income and Poverty Table Average Household Wage/Salary and Persons Below the Poverty Level for Darien, Georgia (Source: U.S. Census Bureau & MARFIN Sociodemographic Database. Louisiana Population Data Center & National Marine Fisheries Service). Wage or Salary Average Household Wage/Salary Income (dollars). $13161 $24025 $24135 Poverty Level Persons Below Poverty Level Age 65+ Below Poverty Level Households with Public Assistance Industry Table Employment by Industry for Darien, Georgia (Source: U.S. Census Bureau & MARFIN Sociodemographic Database. Louisiana Population Data Center & National Marine Fisheries Service). Industry Agriculture, Fishing, Mining Construction Business Services Communication/Utilities Manufacturing Financial, Insurance & Real Estate Services Wholesale/Retail Trade Transportation
214 Occupation Table Employment by Occupation for Darien, Georgia (Source: U.S. Census Bureau & MARFIN Sociodemographic Database. Louisiana Population Data Center & National Marine Fisheries Service). Occupation Sales Clerical Craft Exec/Managerial Farm/Fish/Forest Household Services Laborer/Handler Operative/Transport Service, except Household Technical Darien Fishing Demographics Table Number of Federal Permit by Type for Darien, Georgia (Source: NMFS 2002) Type of Permit Total permitted vessels Commercial King Mackerel Commercial Spanish Mackerel Commercial Spiny Lobster Charter/Headboat for Coastal Pelagics Charter/Headboat for Snapper Grouper Snapper Grouper Class Snapper Grouper Class Swordfish Shark Rock Shrimp Federal Dealers Table Employment in Fishing Related Industry for Darien, Georgia (Zip code Business Patterns, U.S. Census Bureau 1998) Category NAIC Code Number Employed Fishing Seafood Canning Seafood Processing Boat Building Fish and Seafoods Fish and Seafood Markets Marinas Total Fishing Employment
 Type Number Commercial Fishing Vessel Registration 92 Vessels with shrimp gear 44 Full-time commercial fishermen 61")
215 Table Number of State Permit by Type for Darien, Georgia (Source: GADNR 2002) Type Number Commercial Fishing Vessel Registration 92 Vessels with shrimp gear 44 Full-time commercial fishermen 61 Part-time commercial fishermen Brunswick (31520, 31523, Community Description Brunswick s population has seen a steady decline over the past three decades in almost every age category. The percent of the population in the labor force has remained the same since 1990 but unemployment has risen to 10.4 percent in Average wage and salary has dropped since 1990 and the number of people living under the poverty level has increased. For those working in the sectors of farm, fish and forestry in occupation and industry there has also been a steady decline. Brunswick has 8 vessels registered with federal permits according to Table There are a substantial number of persons working in fishing related businesses according to Table with 208
216 over 1500 persons working in the seafood processing sector. The state has 88 vessels registered in Brunswick and 56 of them have shrimp gear (Table ). Of those vessel owners registered 66 consider themselves to be full-time commercial fishermen and 11 part-time Brunswick Census Demographics Population Table Total Persons and Persons by Age category for Brunswick, Georgia (Source U.S. Census Bureau & MARFIN Sociodemographic Database. Louisiana Population Data Center & National Marine Fisheries Service). Total Persons and Age Category Total Persons Persons Age Persons Age Persons Age Persons Age Persons Age Persons Age Persons Age Persons Age Persons Age Housing Tenure Table Housing Tenure for Brunswick, Georgia (Source: U.S. Census Bureau). Percent Renter Occupied Percent Owner Occupied Residence in 1985 and 1995 Table Residence in 1985 and 1995 for Brunswick, Georgia (Source: U.S. Census Bureau). Different House Same County Same House
217 Employment/Unemployment Table Employment and Unemployment for Brunswick, Georgia (Source: U.S. Census Bureau). Persons 16 yrs and over Percent in labor force Percent unemployed Race Table Race for Brunswick, Georgia (Source U.S. Census Bureau & MARFIN Sociodemographic Database. Louisiana Population Data Center & National Marine Fisheries Service). Race Black Persons Latino Black Persons Latino Persons White Persons Latino White Persons Education Table Years of Education by Category for those 25 Years and Older for Brunswick, Georgia (Source: U.S. Census Bureau & MARFIN Sociodemographic Database. Louisiana Population Data Center & National Marine Fisheries Service). Education w/ 0-8 years education w/ 9-11 years education w/ HS diploma w/ years. education w/ College Degree Drop outs Income and Poverty Table Average Household Wage/Salary and Persons Below the Poverty Level for Brunswick, Georgia (Source: U.S. Census Bureau & MARFIN Sociodemographic Database. Louisiana Population Data Center & National Marine Fisheries Service). Wage or Salary Average Household Wage/Salary Income (dollars) $6674 $13078 $23510 $22272 Poverty Level Persons Below Poverty Level Age 65+ Below Poverty Level Households with Public Assistance
218 Industry Table Employment by Industry for Brunswick, Georgia (Source: U.S. Census Bureau & MARFIN Sociodemographic Database. Louisiana Population Data Center & National Marine Fisheries Service). Industry Agriculture, Fishing, Mining Construction Business Services Communication/Utilities Manufacturing Financial, Insurance & Real Estate Services Wholesale/Retail Trade Transportation Occupation Table Employment by Occupation for Brunswick, Georgia (Source: U.S. Census Bureau & MARFIN Sociodemographic Database. Louisiana Population Data Center & National Marine Fisheries Service). Occupation Sales Clerical Craft Exec/Managerial Farm/Fish/Forest Household Services Laborer/Handler Operative/Transport Service, except Household Technical Brunswick Fishing Demographics Table Number of Federal Permit by Type for Brunswick, Georgia (Source: NMFS 2002) Type of Permit Total permitted vessels Commercial King Mackerel Commercial Spanish Mackerel Commercial Spiny Lobster Charter/Headboat for Coastal Pelagics Charter/Headboat for Snapper Grouper Snapper Grouper Class Snapper Grouper Class Swordfish Shark Rock Shrimp Federal Dealers
219 Table Employment in Fishing Related Industry for Brunswick, Georgia (Zip code Business Patterns, U.S. Census Bureau 1998) Category NAIC Code Number Employed Fishing Seafood Canning Seafood Processing Boat Building Fish and Seafoods Fish and Seafood Markets Marinas Total Fishing Employment 1663 Table Number of State Permit by Type for Brunswick, Georgia (Source: GADNR 2002) Type Number Commercial Fishing Vessel Registration 88 Vessels with shrimp gear 56 Full-time commercial fishermen 63 Part-time commercial fishermen

220 4.5 St. Simons Island (31522) Community Description St. Simons Island has seen a fairly steady growth in its population. The percent of population in the labor force has remained fairly stable at just above 60 percent and unemployment has remained low at 3.4 percent. Average wage and salary have raised significantly while the number of person living under the poverty level has remained about the same at over 600. As for most coastal communities, the number of persons employed in farm, fish, and forestry sectors under occupation and industry has declined steadily over the past 30 years for this community. St. Simons Island has little commercial fishing employment as there are only 2 vessels registered with federal permits that homeport there (Table ). Most all of the fishing related employment is in the marinas sector according to Table and there are only 4 commercial vessels registered with the state in Table and 7 individuals who consider themselves to be full-time commercial fishermen. 213
221 4.5.2 St. Simons Island Census Demographics Population Table Total Persons and Persons by Age category for St. Simons Island, Georgia (Source U.S. Census Bureau & MARFIN Sociodemographic Database. Louisiana Population Data Center & National Marine Fisheries Service). Total Persons and Age Category Total Persons Persons Age Persons Age Persons Age Persons Age Persons Age Persons Age Persons Age Persons Age Persons Age Housing Tenure Table Housing Tenure for St. Simons Island, Georgia (Source: U.S. Census Bureau). Percent Renter Occupied Percent Owner Occupied Residence in 1985 and 1995 Table Residence in 1985 and 1995 for St. Simons Island, Georgia (Source: U.S. Census Bureau). Different House Same County ,429 2,871 Same House ,425 6, Employment/Unemployment Table Employment and Unemployment for St. Simons Island, Georgia (Source: U.S. Census Bureau). Persons 16 yrs and over Percent in labor force Percent unemployed
222 Race Table Race for St. Simons Island, Georgia (Source U.S. Census Bureau & MARFIN Sociodemographic Database. Louisiana Population Data Center & National Marine Fisheries Service). Race Black Persons Latino Black Persons Latino Persons White Persons Latino White Persons Education Table Years of Education by Category for those 25 Years and Older for St. Simons Island, Georgia (Source: U.S. Census Bureau & MARFIN Sociodemographic Database. Louisiana Population Data Center & National Marine Fisheries Service). Education w/ 0-8 years education w/ 9-11 years education w/ HS diploma w/ years. education w/ College Degree Drop outs Income and Poverty Table Average Household Wage/Salary and Persons Below the Poverty Level for St. Simons Island, Georgia (Source: U.S. Census Bureau & MARFIN Sociodemographic Database. Louisiana Population Data Center & National Marine Fisheries Service). Wage or Salary Average Household Wage/Salary Income (dollars) $8778 $20621 $42677 $58475 Poverty Level Persons Below Poverty Level Age 65+ Below Poverty Level Households with Public Assistance
223 Industry Table Employment by Industry for St. Simons Island, Georgia (Source: U.S. Census Bureau & MARFIN Sociodemographic Database. Louisiana Population Data Center & National Marine Fisheries Service). Industry Agriculture, Fishing, Mining Construction Business Services Communication/Utilities Manufacturing Financial, Insurance & Real Estate Services Wholesale/Retail Trade Transportation Occupation Table Employment by Occupation for St. Simons Island, Georgia (Source: U.S. Census Bureau & MARFIN Sociodemographic Database. Louisiana Population Data Center & National Marine Fisheries Service). Occupation Sales Clerical Craft Exec/Managerial Farm/Fish/Forest Household Services Laborer/Handler Operative/Transport Service, except Household Technical St. Simons Fishing Demographics Table Number of Federal Permit by Type for St. Simons Island, Georgia (Source: NMFS 2002) Type of Permit Total permitted vessels Commercial King Mackerel Commercial Spanish Mackerel Commercial Spiny Lobster Charter/Headboat for Coastal Pelagics Charter/Headboat for Snapper Grouper Snapper Grouper Class Snapper Grouper Class Swordfish Shark Rock Shrimp Federal Dealers
224 Table Employment in Fishing Related Industry for St. Simons Island, Georgia (Zip code Business Patterns, U.S. Census Bureau 1998) Category NAIC Code Number Employed Fishing Seafood Canning Seafood Processing Boat Building Fish and Seafoods Fish and Seafood Markets Marinas Total Fishing Employment 58 Table Number of State Permit by Type for St. Simons, Georgia (Source: GADNR 2002) Type Number Commercial Fishing Vessel Registration 4 Vessels with shrimp gear 4 Full-time commercial fishermen 7 Part-time commercial fishermen 2 217

225 4.6 St. Mary s (31558) Community Description St. Mary s has seen steady population growth since The percent of the population in the labor force has remained fairly constant while unemployment has risen to 6.4 percent. Average wage and salary has risen consistently over the years, but the number of persons living under the poverty level took a significant jump in 2000 to over 1400 persons in 2000 from 975 in Those employed in farm, fish and forestry sector have seen a steady decline in their numbers since 1970 also. There were only 2 vessels registered with federal permits from the community in Table but there were 42 persons listed in the fishing sector in Table The state has 19 vessels registered with 9 of those having shrimp gear and 13 of those owners considered full time fishermen (Table ). 218
226 4.6.2 St. Mary s Census Demographics Table Total Persons and Persons by Age category for St. Mary s, Georgia (Source U.S. Census Bureau & MARFIN Sociodemographic Database. Louisiana Population Data Center & National Marine Fisheries Service). Total Persons and Age Category Total Persons Persons Age Persons Age Persons Age Persons Age Persons Age Persons Age Persons Age Persons Age Persons Age Housing Tenure Table Housing Tenure for St. Mary s, Georgia (Source: U.S. Census Bureau). Percent Renter Occupied Percent Owner Occupied Residence in 1985 and 1995 Table Residence in 1985 and 1995 for St. Mary s, Georgia (Source: U.S. Census Bureau). Different House Same County ,078 5,312 Same House ,161 3,
227 Employment/Unemployment Table Employment and Unemployment for St. Mary s, Georgia (Source: U.S. Census Bureau). Persons 16 yrs and over Percent in labor force Percent unemployed Race Table Race for St. Mary s, Georgia (Source U.S. Census Bureau & MARFIN Sociodemographic Database. Louisiana Population Data Center & National Marine Fisheries Service). Race Black Persons Latino Black Persons Latino Persons White Persons Latino White Persons Education Table Years of Education by Category for those 25 Years and Older for St. Mary s, Georgia (Source: U.S. Census Bureau & MARFIN Sociodemographic Database. Louisiana Population Data Center & National Marine Fisheries Service). Education w/ 0-8 years education w/ 9-11 years education w/ HS diploma w/ years. education w/ College Degree Drop outs
228 Income and Poverty Table Average Household Wage/Salary and Persons Below the Poverty Level for St. Mary s, Georgia (Source: U.S. Census Bureau & MARFIN Sociodemographic Database. Louisiana Population Data Center & National Marine Fisheries Service). Wage or Salary Average Household Wage/Salary Income (dollars) Poverty Level Persons Below Poverty Level Age 65+ Below Poverty Level Households with Public Assistance Industry Table Employment by Industry for St. Mary s, Georgia (Source: U.S. Census Bureau & MARFIN Sociodemographic Database. Louisiana Population Data Center & National Marine Fisheries Service). Industry Agriculture, Fishing, Mining Construction Business Services Communication/Utilities Manufacturing Financial, Insurance & Real Estate Services Wholesale/Retail Trade Transportation Occupation Table Employment by Occupation for St. Mary s, Georgia (Source: U.S. Census Bureau & MARFIN Sociodemographic Database. Louisiana Population Data Center & National Marine Fisheries Service). Occupation Sales Clerical Craft Exec/Managerial Farm/Fish/Forest Household Services Laborer/Handler Operative/Transport Service, except Household Technical
229 4.6.3 St. Marys Fishing Demographics Table Number of Federal Permit by Type for St. Mary s, Georgia (Source: NMFS 2002) Type of Permit Total permitted vessels Commercial King Mackerel Commercial Spanish Mackerel Commercial Spiny Lobster Charter/Headboat for Coastal Pelagics Charter/Headboat for Snapper Grouper Snapper Grouper Class Snapper Grouper Class Swordfish Shark Rock Shrimp Federal Dealers Table Employment in Fishing Related Industry for St. Mary s, Georgia (Zip code Business Patterns, U.S. Census Bureau 1998) Category NAIC Code Number Employed Fishing Seafood Canning Seafood Processing Boat Building Fish and Seafoods Fish and Seafood Markets Marinas Total Fishing Employment 45 Table Number of State Permit by Type for St. Mary s, Georgia (Source: GADNR 2002) Type Number Commercial Fishing Vessel Registration 19 Vessels with shrimp gear 9 Full-time commercial fishermen 13 Part-time commercial fishermen 5 222
230 4.7 Georgia Fishing Infrastructure and Community Characterization The following tables provide a general view of the presence or absence of fishing infrastructure located within the coastal communities of Georgia with substantial fishing activity. It should be noted that there are many other attributes that might have been included in this table, however, because of inconsistency in rapid appraisal for all communities, these items were selected as the most consistently reported or had secondary data available to determine presence or absence. It should also be noted that in some cases certain infrastructure may exist within a community but was not readily apparent or could not be ascertained through secondary data. Table offers an overview of the presence of the selected infrastructure items and provides an overall total score which is merely the total of infrastructure present. Table Fishing Infrastructure Table for Georgia Potential Fishing Communities Federal Commercial Permits (5+) State Commercial Licenses (10+) Federal Charter Permits (5+) Seafood Landings Seafood retail markets Fish processors, Wholesale fish house Recreational docks / marinas Recreational Fishing Tournaments Community Tybee Island Thunderbolt Darien Brunswick St. Simons Island St. Mary s In attempting a preliminary characterization of potential fishing communities in Table 4.7.2, we have provided a grouping of communities that appear to have more involvement in various fishing enterprises and therefore are classified as primarily involved. These communities have considerable fishing infrastructure, but also have a history and culture surrounding both commercial and recreational fishing that contributes to an appearance and perception of being a fishing community in the mind of residents and others. The communities are not ranked in any particular order, this is merely a categorization. Table Preliminary Characterization of Potential Fishing Communities in Georgia Primarily-Involved Secondarily-Involved Darien Tybee Island Brunswick Thunderbolt St. Mary s St. Simons Island Many of these communities are in transition due to various social and demographic changes from coastal development, growing populations, increasing tourism, changing regulations, etc. This preliminary characterization is just that and should not be considered a definite designation as fishing community, but a general guide for locating communities that may warrant consideration as a potential fishing community. Total 223

231 5.0 Florida Communities with Substantial Fishing Activity Figure 5.1. Florida Communities with Substantial Fishing Activity as Identified by South Atlantic Advisory Panels. Figure 5.1 illustrates those communities which were identified originally by the advisory panels as communities that might be considered fishing communities. They are included below with brief profiles and census and fishing demographic tables used to describe the communities. The East coast of Florida landed over 37 million and over 32 million pounds of seafood in 2001 and 2002 respectively. The value of those landings was over 48 million dollars in 2001 and over 38 million dollars in Florida had one port, Key West, listed in the top 50 U.S. ports in terms of pounds landed and in terms of value of landings there were three ports for Florida: Key West, St. Petersburg and Ft. Myers. According to NMFS (2002) Florida recreational fishermen landed over 68 million pounds of finfish in 2001 and in 2002 that number dropped to just over 59 million pounds for the entire state. There were 93 processors in all of Florida for 2001 with a total of 2,654 employees and 284 wholesale dealers employing 2,485. In the years 2001 and 2002, Florida had approximately 2,136 and 1,934 registered vessels respectively. During those same years there were 5,502 boats registered in 2001 and in 2002 that number was 4,
232 Table 2.1 Number of Federal Permit by Type for Florida (Source: NMFS 2002) Type of Permit Total permitted vessels Commercial King Mackerel Commercial Spanish Mackerel Commercial Spiny Lobster Charter/Headboat for Coastal Pelagics Charter/Headboat for Snapper Grouper Snapper Grouper Class Snapper Grouper Class Swordfish Shark Rock Shrimp Florida has seen the number of permitted vessels decline over the past four years with a high of 3,384 vessels in 1998 and in 2001 that number dropped to The majority of those vessels held either of both king mackerel permits or Spanish mackerel permits. The next most commonly held permits were snapper grouper class1 and spiny lobster. 225

233 226
.")
234 5.1 Fernandina Beach (32034) Community Description Fernandina Beach is located in Nassau County, Florida, on the northernmost barrier island (Amelia Island) of the state s east coast. The island extends from the mouth of the St. Mary s River southward to Nassau Sound and is just over thirteen miles long and two miles wide (Jacob et al. 2002). Fishing has had a long history in the community as immigrants in the 1700s were net fishermen seeking mullet, sheepshead, crabs, trout, turtles, drum, oysters and "pogies" (menhaden). Agriculture, forestry, fishing, and tourism were the most prominent industries in the Fernandina Beach area during the early 1900 s. Shrimp fishing was developed in 1902 by a Sicilian immigrant living in Fernandina Beach who fished with a small diesel engine on his boat to pull a shrimp seine net across the ocean floor. Commercial shrimp fishing grew substantially when a New England fisherman, who was searching the Florida peninsula for blue fish, began harvesting large quantities of shrimp. Shrimp processing and shipment facilities were soon developed in Fernandina Beach. That fishing heritage has been preserved in Old Town Fernandina Beach, which has been designated a National Historic District. Today, Fernandina s harbor is filled with commercial and charter 227
235 fishing boats, shrimp boats and private vessels. Seafood restaurants contribute to the fishing village theme which continues to resonate throughout the community although tourism has become the primary source of economic revenue (Jacob et al. 2002) Fernandina Beach Census Demographics Population Table Total Persons and Persons by Age category for Fernandina Beach, Florida (Source U.S. Census Bureau & MARFIN Sociodemographic Database. Louisiana Population Data Center & National Marine Fisheries Service). Total Persons and Age Category Total Persons Persons Age Persons Age Persons Age Persons Age Persons Age Persons Age Persons Age Persons Age Persons Age Housing Tenure Table Housing Tenure for Fernandina Beach, Florida (Source: U.S. Census Bureau). Percent Renter Occupied Percent Owner Occupied Residence in 1985 and 1995 Table Residence in 1985 and 1995 for Fernandina Beach, Florida (Source: U.S. Census Bureau). Different House Same County Same House
236 Employment/Unemployment Table Employment and Unemployment for Fernandina Beach, Florida (Source: U.S. Census Bureau). Persons 16 yrs and over Percent in labor force Percent unemployed Race Table Race for Fernandina Beach, Florida (Source U.S. Census Bureau & MARFIN Sociodemographic Database. Louisiana Population Data Center & National Marine Fisheries Service). Race Black Persons Latino Black Persons Latino Persons White Persons Latino White Persons Education Table Years of Education by Category for those 25 Years and Older for Fernandina Beach, Florida (Source: U.S. Census Bureau & MARFIN Sociodemographic Database. Louisiana Population Data Center & National Marine Fisheries Service). Education w/ 0-8 years education w/ 9-11 years education w/ HS diploma w/ years. education w/ College Degree Drop outs Income and Poverty Table Average Household Wage/Salary and Persons Below the Poverty Level for Fernandina Beach, Florida (Source: U.S. Census Bureau & MARFIN Sociodemographic Database. Louisiana Population Data Center & National Marine Fisheries Service). Wage or Salary Average Household Wage/Salary Income (dollars) $8499 $19526 $35352 $40893 Poverty Level Persons Below Poverty Level Age 65+ Below Poverty Level Households with Public Assistance
237 Industry Table Employment by Industry for Fernandina Beach, Florida (Source: U.S. Census Bureau & MARFIN Sociodemographic Database. Louisiana Population Data Center & National Marine Fisheries Service). Industry Agriculture, Fishing, Mining Construction Business Services Communication/Utilities Manufacturing Financial, Insurance & Real Estate Services Wholesale/Retail Trade Transportation Occupation Table Employment by Occupation for Fernandina Beach, Florida (Source: U.S. Census Bureau & MARFIN Sociodemographic Database. Louisiana Population Data Center & National Marine Fisheries Service). Occupation Sales Clerical Craft Exec/Managerial Farm/Fish/Forest Household Services Laborer/Handler Operative/Transport Service, except Household Technical Fernandina Beach Fishing Demographics Table Number of Federal Permit by Type for Fernandina Beach, Florida (Source: NMFS 2002) Type of Permit Total permitted vessels Commercial King Mackerel Commercial Spanish Mackerel Commercial Spiny Lobster Charter/Headboat for Coastal Pelagics Charter/Headboat for Snapper Grouper Snapper Grouper Class Snapper Grouper Class Swordfish Shark Rock Shrimp Federal Dealers
 Category NAIC Code Number Employed Fishing 114100 3 Seafood Canning 311711 0 Seafood Processing 311712 0 Boat Building 336612 7 Fish and Seafoods 422460 0 Fish and Seafood Markets")
238 Table Employment in Fishing Related Industry for Fernandina Beach, Florida (Zip code Business Patterns, U.S. Census Bureau 1998) Category NAIC Code Number Employed Fishing Seafood Canning Seafood Processing Boat Building Fish and Seafoods Fish and Seafood Markets Marinas Total Fishing Employment Atlantic Beach (32233) 231
239 5.2.1 Community Description The community of Atlantic Beach has remained fairly small throughout its history. The arrival of Henry Flagler s Florida East Coast Railroad in 1900 helped spur development and prominence within this coastal community. However, it was not until the construction of the Mayport Naval Station in the 1940s and the completion of the Matthews Bridge in the 1950s that the area truly became ready for development. Beginning in the 1990s, the Atlantic Beach community embarked on environmental endeavors regarding their aquatic resources. They created the Tideviews Preserve and the Dutton Island Preserve. Among some of the many activities offered in the Dutton Island Preserve, fishing off the pier is a popular activity for park visitors. 37 Atlantic Beach has seen steady growth in its population. There has been a decline in the percent of the population in the labor force and unemployment has dropped to 3.3 percent in Average wage and salary rose significantly between 1980 and 1990, but only slightly in The number of persons living below the poverty level has dropped every decade but still is around 1100 person in Jobs in the sector of farm, fish and forestry have fluctuated over the past three decades, but dropped to low levels in Although there is only one vessel with federal permits in Atlantic Beach (Table ) there are 56 persons employed in the fish and seafood sector according to Table Atlantic Beach Census Demographics Population Table Total Persons and Persons by Age category for Atlantic Beach, Florida (Source U.S. Census Bureau & MARFIN Sociodemographic Database. Louisiana Population Data Center & National Marine Fisheries Service). Total Persons and Age Category Total Persons Persons Age Persons Age Persons Age Persons Age Persons Age Persons Age Persons Age Persons Age Persons Age
240 Housing Tenure Table Housing Tenure for Atlantic Beach, Florida (Source: U.S. Census Bureau). Percent Renter Occupied Percent Owner Occupied Residence in 1985 and 1995 Table Residence in 1985 and 1995 for Atlantic Beach, Florida (Source: U.S. Census Bureau). Different House Same County Same House Employment/Unemployment Table Employment and Unemployment for Atlantic Beach, Florida (Source: U.S. Census Bureau). Persons 16 yrs and over Percent in labor force Percent unemployed Race Table Race for Atlantic Beach, Florida (Source U.S. Census Bureau & MARFIN Sociodemographic Database. Louisiana Population Data Center & National Marine Fisheries Service). Race Black Persons Latino Black Persons Latino Persons White Persons Latino White Persons Education Table Years of Education by Category for those 25 Years and Older for Atlantic Beach, Florida (Source: U.S. Census Bureau & MARFIN Sociodemographic Database. Louisiana Population Data Center & National Marine Fisheries Service). Education w/ 0-8 years education w/ 9-11 years education w/ HS diploma w/ years. education w/ College Degree Drop outs
241 Income and Poverty Table Average Household Wage/Salary and Persons Below the Poverty Level for Atlantic Beach, Florida (Source: U.S. Census Bureau & MARFIN Sociodemographic Database. Louisiana Population Data Center & National Marine Fisheries Service). Wage or Salary Average Household Wage/Salary Income (dollars). $18276 $41525 $48353 Poverty Level Persons Below Poverty Level Age 65+ Below Poverty Level Households with Public Assistance Industry Table Employment by Industry for Atlantic Beach, Florida (Source: U.S. Census Bureau & MARFIN Sociodemographic Database. Louisiana Population Data Center & National Marine Fisheries Service). Industry Agriculture, Fishing, Mining Construction Business Services Communication/Utilities Manufacturing Financial, Insurance & Real Estate Services Wholesale/Retail Trade Transportation Occupation Table Employment by Occupation for Atlantic Beach, Florida (Source: U.S. Census Bureau & MARFIN Sociodemographic Database. Louisiana Population Data Center & National Marine Fisheries Service). Occupation Sales Clerical Craft Exec/Managerial Farm/Fish/Forest Household Services Laborer/Handler Operative/Transport Service, except Household Technical
242 5.2.3 Atlantic Beach Fishing Demographics Table Number of Federal Permit by Type for Atlantic Beach, Florida (Source: NMFS 2002) Type of Permit Total permitted vessels Commercial King Mackerel Commercial Spanish Mackerel Commercial Spiny Lobster Charter/Headboat for Coastal Pelagics Charter/Headboat for Snapper Grouper Snapper Grouper Class Snapper Grouper Class Swordfish Shark Rock Shrimp Federal Dealers Table Employment in Fishing Related Industry for Atlantic Beach, Florida (Zip code Business Patterns, U.S. Census Bureau 1998) Category NAIC Code Number Employed Fishing Seafood Canning Seafood Processing Boat Building Fish and Seafoods Fish and Seafood Markets Marinas Total Fishing Employment

243 5.3 St. Augustine (32084, 32085, 32086, 32092) Community Description St. Augustine has the distinction of being the oldest European city in the United States. First sited by the Spanish explorer Don Juan Ponce de Leon in 1513, it was not settled until 1565 by Don Pedro Menendez de Aviles, a Spanish admiral, in the name of King Phillip II. 38 The town s boom did not occur until the 1880s with the arrival of Henry M. Flagler. His goal was to turn St. Augustine into a winter resort for wealthy Americans. It was this thinking that transformed the town. The construction of the railroad linked the city with much of the east coast. Flagler built three large
244 hotels to help fulfill his dream of a tourist mecca. By the mid-1900s, St. Augustine s local economy was dominated by tourism. 39 The commercial fishing industry began in the St. Augustine/Fernandina area around 1900 with the arrival of a Sicilian immigrant named Sallecito Salvador. He placed an engine on his boat that allowed him to pull a shrimp seine across the ocean floor in 1902, and in 1906, he began his company, S. Salvador & Sons. Salvador moved his business to St. Augustine in 1922, where it thrived until Shrimp catch levels soared from about 1934 to These stories illustrate the longstanding culture of fishing in the St. Augustine area and the importance it holds for many of the fishing families there. Commercial fishing still continues at the port, the oldest continuously active port in the United States. Boat building, tourism, and recreational activities are also important to St. Augustine s port. 41 St. Augustine has seen a steady decline in its population since Both the percent of population in the labor force and unemployment have remained relatively stable over the years. Average wage and salary has grown steadily, while the number of person living below the poverty level has dropped. The number of people employed in farm, fish and forestry has also dropped significantly over the past three decades, with the most pronounced decline from 1990 to St. Augustine hs 28 vessels with federal permits and the majority of them have charter permits for either snapper grouper or coastal pelagics (Table ). There is significant employment in fishing related business as there are over 370 people employed in boat building according to Table and another 75 in the seafood processing sector St. Augustine Census Demographics Population Table Total Persons and Persons by Age category for St. Augustine, Florida (Source U.S. Census Bureau & MARFIN Sociodemographic Database. Louisiana Population Data Center & National Marine Fisheries Service). Total Persons and Age Category Total Persons Persons Age Persons Age Persons Age Persons Age Persons Age Persons Age Persons Age Persons Age Persons Age
245 Housing Tenure Table Housing Tenure for St. Augustine, Florida (Source: U.S. Census Bureau). Percent Renter Occupied Percent Owner Occupied Residence in 1985 and 1995 Table Residence in 1985 and 1995 for St. Augustine, Florida (Source: U.S. Census Bureau). Different House Same County Same House Employment/Unemployment Table Employment and Unemployment for St. Augustine, Florida (Source: U.S. Census Bureau). Persons 16 yrs and over Percent in labor force Percent unemployed Race Table Race for St. Augustine, Florida (Source U.S. Census Bureau & MARFIN Sociodemographic Database. Louisiana Population Data Center & National Marine Fisheries Service). Race Black Persons ,741 Latino Black Persons Latino Persons White Persons ,193 Latino White Persons
246 Education Table Years of Education by Category for those 25 Years and Older for St. Augustine, Florida (Source: U.S. Census Bureau & MARFIN Sociodemographic Database. Louisiana Population Data Center & National Marine Fisheries Service). Education w/ 0-8 years education w/ 9-11 years education w/ HS diploma w/ years. education w/ College Degree Drop outs Income and Poverty Table Average Household Wage/Salary and Persons Below the Poverty Level for St. Augustine, Florida (Source: U.S. Census Bureau & MARFIN Sociodemographic Database. Louisiana Population Data Center & National Marine Fisheries Service). Wage or Salary Average Household Wage/Salary Income (dollars) $6958 $13757 $26572 $32358 Poverty Level Persons Below Poverty Level Age 65+ Below Poverty Level Households with Public Assistance Industry Table Employment by Industry for St. Augustine, Florida (Source: U.S. Census Bureau & MARFIN Sociodemographic Database. Louisiana Population Data Center & National Marine Fisheries Service). Industry Agriculture, Fishing, Mining Construction Business Services Communication/Utilities Manufacturing Financial, Insurance & Real Estate Services Wholesale/Retail Trade Transportation
247 Occupation Table Employment by Occupation for St. Augustine, Florida (Source: U.S. Census Bureau & MARFIN Sociodemographic Database. Louisiana Population Data Center & National Marine Fisheries Service). Occupation Sales Clerical Craft Exec/Managerial Farm/Fish/Forest Household Services Laborer/Handler Operative/Transport Service, except Household Technical St. Augustine Fishing Demographics Table Number of Federal Permit by Type for St. Augustine, Florida (Source: NMFS 2002) Type of Permit Total permitted vessels Commercial King Mackerel Commercial Spanish Mackerel Commercial Spiny Lobster Charter/Headboat for Coastal Pelagics Charter/Headboat for Snapper Grouper Snapper Grouper Class Snapper Grouper Class Swordfish Shark Rock Shrimp Federal Dealers Table Employment in Fishing Related Industry for St. Augustine, Florida (Zip code Business Patterns, U.S. Census Bureau 1998) Category NAIC Code Number Employed Fishing Seafood Canning Seafood Processing Boat Building Fish and Seafoods Fish and Seafood Markets Marinas Total Fishing Employment

248 5.4 Ponce Inlet (32127) Community Description The town of Ponce Inlet was originally referred to as the port of mosquitoes until the early twentieth century and is located at the southern boundary of Ponce de Leon Inlet. There is some controversy as to whom actually first stepped foot on Ponce Inlet; perhaps it was Ponce de Leon in 1513 that went ashore to high ground to search for a lost vessel. Others believe it may have been Frenchman Jean Ribault in 1563 (Davies, 1995). Sport fishing became the mainstay for most residents of the Ponce Inlet area. The industry began to grow in the 1950s; however, many found that it was not very profitable. In the winter the waters were so uncertain that sometimes the boats rocked at the dock for days while the tourist sought other recreation (Davies, 1995:54). However, when charter fishermen in the Florida Keys heard about the good conditions in the summer months in northern Florida, they would work out of the growing number of docks from Daytona to the Inlet (Davies, 1995:55). The arrival of the head boat scared many of the original fishermen because they thought it would ruin the business. Eventually, the 241
249 locals understood the economic opportunities associated with the head boat. By the 1960s, the sport fishing industry was quite successful for the fishermen of Ponce Inlet (Davies, 1995). The population of Ponce Inlet has grown over the years, but most of that growth came within the last decade. The percent of population in the labor force has remained around 45 percent and unemployment has dropped to a low of 1.9 in 2000 from 4.5 in Average wage and salary have risen significantly over the years, but so has the number of persons living below the poverty level. The number of people who work in farm, fish and forestry has dropped to fewer than 3 people according to census measures of occupation and industry. However, Table shows over 25 vessels with federal permits homeported in the community with the majority of those with charter permits for either snapper grouper or coastal pelagics. There is also some fishing related employment according to Table which indicates over 180 people employed in the marinas sector Ponce Inlet Census Demographics Population Table Total Persons and Persons by Age category for Ponce Inlet, Florida (Source U.S. Census Bureau & MARFIN Sociodemographic Database. Louisiana Population Data Center & National Marine Fisheries Service). Total Persons and Age Category Total Persons Persons Age Persons Age Persons Age Persons Age Persons Age Persons Age Persons Age Persons Age Persons Age Housing Tenure Table Housing Tenure for Ponce Inle, Florida (Source: U.S. Census Bureau). Percent Renter Occupied Percent Owner Occupied
250 Residence in 1985 and 1995 Table Residence in 1985 and 1995 for Ponce Inle, Florida (Source: U.S. Census Bureau). Different House Same County Same House Employment/Unemployment Table Employment and Unemployment for Ponce Inle, Florida (Source: U.S. Census Bureau). Persons 16 yrs and over Percent in labor force Percent unemployed Race Table Race for Ponce Inlet, Florida (Source U.S. Census Bureau & MARFIN Sociodemographic Database. Louisiana Population Data Center & National Marine Fisheries Service). Race Black Persons Latino Black Persons Latino Persons White Persons Latino White Persons Education Table Years of Education by Category for those 25 Years and Older for Ponce Inlet, Florida (Source: U.S. Census Bureau & MARFIN Sociodemographic Database. Louisiana Population Data Center & National Marine Fisheries Service). Education w/ 0-8 years education w/ 9-11 years education w/ HS diploma w/ years. education w/ College Degree Drop outs
251 Income and Poverty Table Average Household Wage/Salary and Persons Below the Poverty Level for Ponce Inlet, Florida (Source: U.S. Census Bureau & MARFIN Sociodemographic Database. Louisiana Population Data Center & National Marine Fisheries Service). Wage or Salary Average Household Wage/Salary Income (dollars) Poverty Level Persons Below Poverty Level Age 65+ Below Poverty Level Households with Public Assistance Industry Table Employment by Industry for Ponce Inlet, Florida (Source: U.S. Census Bureau & MARFIN Sociodemographic Database. Louisiana Population Data Center & National Marine Fisheries Service). Industry Agriculture, Fishing, Mining Construction Business Services Communication/Utilities Manufacturing Financial, Insurance & Real Estate Services Wholesale/Retail Trade Transportation Occupation Table Employment by Occupation for Ponce Inlet, Florida (Source: U.S. Census Bureau & MARFIN Sociodemographic Database. Louisiana Population Data Center & National Marine Fisheries Service). Occupation Sales Clerical Craft Exec/Managerial Farm/Fish/Forest Household Services Laborer/Handler Operative/Transport Service, except Household Technical
252 5.4.3 Ponce Inlet Fishing Demographics Table Number of Federal Permit by Type for Ponce Inlet, Florida (Source: NMFS 2002) Type of Permit Total permitted vessels Commercial King Mackerel Commercial Spanish Mackerel Commercial Spiny Lobster Charter/Headboat for Coastal Pelagics Charter/Headboat for Snapper Grouper Snapper Grouper Class Snapper Grouper Class Swordfish Shark Rock Shrimp Federal Dealers Table Employment in Fishing Related Industry for Ponce Inlet, Florida (Zip code Business Patterns, U.S. Census Bureau 1998) Category NAIC Code Number Employed Fishing Seafood Canning Seafood Processing Boat Building Fish and Seafoods Fish and Seafood Markets Marinas Total Fishing Employment

253 5.5 Merritt Island (32952, 32953) Community Description Merritt Island s population has grown slowly over the past three decades. The percent of the population in the labor force has dropped slightly over the past ten years, but unemployment has increased slightly. Average wage and salary have increased to over $40,000 for the year 2000, but the number of persons living under the poverty level has also grown considerably. As for most coastal communities the number of people working in the farm, fish and forestry sector of the economy has dropped significantly over the past decade but has shown a steady decline prior to the 2000 census. Merritt Island has only 8 vessels with federal permits and half of them have charter permits (Table ). There is substantial employment represented in the fishing related sector of boat building with over 1100 persons employed in that sector according to Table
254 5.5.2 Merrit Island Census Demographics Population Table Total Persons and Persons by Age category for Merritt Island, Florida (Source U.S. Census Bureau & MARFIN Sociodemographic Database. Louisiana Population Data Center & National Marine Fisheries Service). Total Persons and Age Category Total Persons Persons Age Persons Age Persons Age Persons Age Persons Age Persons Age Persons Age Persons Age Persons Age Housing Tenure Table Housing Tenure for Merritt Island, Florida (Source: U.S. Census Bureau). Percent Renter Occupied Percent Owner Occupied Residence in 1985 and 1995 Table Residence in 1985 and 1995 for Merritt Island, Florida (Source: U.S. Census Bureau). Different House Same County Same House Employment/Unemployment Table Employment and Unemployment for Merritt Island, Florida (Source: U.S. Census Bureau). Persons 16 yrs and over Percent in labor force Percent unemployed
255 Race Table Race for Merritt Island, Florida (Source U.S. Census Bureau & MARFIN Sociodemographic Database. Louisiana Population Data Center & National Marine Fisheries Service). Race Black Persons Latino Black Persons Latino Persons White Persons Latino White Persons Education Table Years of Education by Category for those 25 Years and Older for Merritt Island, Florida (Source: U.S. Census Bureau & MARFIN Sociodemographic Database. Louisiana Population Data Center & National Marine Fisheries Service). Education w/ 0-8 years education w/ 9-11 years education w/ HS diploma w/ years. education w/ College Degree Drop outs Income and Poverty Table Average Household Wage/Salary and Persons Below the Poverty Level for Merritt Island, Florida (Source: U.S. Census Bureau & MARFIN Sociodemographic Database. Louisiana Population Data Center & National Marine Fisheries Service). Wage or Salary Average Household Wage/Salary Income (dollars) $12011 $20355 $39680 $43532 Poverty Level Persons Below Poverty Level Age 65+ Below Poverty Level Households with Public Assistance
256 Industry Table Employment by Industry for Merritt Island, Florida (Source: U.S. Census Bureau & MARFIN Sociodemographic Database. Louisiana Population Data Center & National Marine Fisheries Service). Industry Agriculture, Fishing, Mining Construction Business Services Communication/Utilities Manufacturing Financial, Insurance & Real Estate Services Wholesale/Retail Trade Transportation Occupation Table Employment by Occupation for Merritt Island, Florida (Source: U.S. Census Bureau & MARFIN Sociodemographic Database. Louisiana Population Data Center & National Marine Fisheries Service). Occupation Sales Clerical Craft Exec/Managerial Farm/Fish/Forest Household Services Laborer/Handler Operative/Transport Service, except Household Technical Merritt Island Fishing Demographics Table Number of Federal Permit by Type for Merritt Island, Florida (Source: NMFS 2002) Type of Permit Total Permitted Vessels Commercial King Mackerel Commercial Spanish Mackerel Commercial Spiny Lobster Charter/Headboat for Coastal Pelagics Charter/Headboat for Snapper Grouper Snapper Grouper Class Snapper Grouper Class Swordfish Shark Rock Shrimp Federal Dealers
 Category NAIC Code Number Employed Fishing 114100 3 Seafood Canning 311711 0 Seafood Processing 311712 0 Boat Building 336612 1125 Fish and Seafoods 422460 18 Fish and Seafood")
257 Table Employment in Fishing Related Industry for Merritt Island, Florida (Zip code Business Patterns, U.S. Census Bureau 1998) Category NAIC Code Number Employed Fishing Seafood Canning Seafood Processing Boat Building Fish and Seafoods Fish and Seafood Markets Marinas Total Fishing Employment Cape Canaveral (32920) Community Description Cape Canaveral received its name from the Spanish explorers who found it in the early 1500s. The word Cape was used to describe the land formation, and the word Canaveral comes from the Spanish word for canebreak. There is much debate over the exact translation and meaning of the 250
258 name. A traveling exhibition for the Smithsonian Institute translates Cape Canaveral as Place of the Cane Bearers, so named by Spanish explorer Francisco Gordillo after he was shot by an Ais Indian arrow made of cane. Others believe it should be translated as Point of Reeds or Point of Canes because the Spanish mistook some of the indigenous plants for sugar cane. Whatever the exact translation of the name may be, all agree that it is of Spanish origin. 42 Even before the area of Cape Canaveral was settled, it was an important landmark for sailors. Once sighted, they would turn northeastward for the journey back to Europe. Douglas D. Dummitt arrived in the area in the 1820s, establishing Dummitt Grove on Merritt Island. He used the Indian River to ship his oranges northward, beginning in However, the actual geographic area known as Cape Canaveral was not settled until the 1840s. Cut off from the mainland, this small community remained self-reliant until the late 1800s. 43 The city of Cape Canaveral really began to expand in the early 1920s when a group of retired Orlando journalists were vacationing in the area and appraising its value. They invested over $150,000 in the surrounding beach areas, calling it Journalista, the area today known as Avon-bythe-Sea. Instead of the area becoming solely a beach resort for wealthy inland residents and northerners, many fishermen moved into the area as well. 44 However, with the establishment and expansion of the space program in the United States in the late 1950s and early 1960s, Cape Canaveral, Titusville, Merritt Island, and the surrounding communities truly began to expand. Today, the residents of Cape Canaveral and the rest of Brevard County rely on the surrounding waters. Port Canaveral, constructed in the 1950s, is the second busiest cruise port in the world and home to many charter fishing companies in the area. 45 The more than three dozen charter fishing boats offer half-day, three-quarter-day, full-day, and gulf stream trips for dolphin, tuna, king and Spanish mackerel, wahoo, redfish, tarpon, snook, snapper, grouper, and many others. Both light tackle flats fishing on the Indian and Banana Rivers and Mosquito Lagoon as well as deep sea fishing are available. Most of the boat captains are second or third generation fishermen. The history of fishing in Brevard County dates back more than 100 years. Cape Canaveral s population has grown steadily over the years while the percent of the population in the labor force has dropped. Unemployment has also dropped but remains above 5 percent. Average wage and salary has grown while the number of persons living below the poverty level has dropped from a high in 1990 of 1282 to 1035 in The number of persons working in the fish, farm and forestry sector has dropped significantly to only 17 persons in 2000 for both occupation and industry. Cape Canaveral has 15 vessels with federal permits homeported there (Table ) with a large portion of the employment in fishing related business in marinas with 125 according to Table with 35 in boat building and 17 in fish and seafood
259 5.6.2 Cape Canaveral Census Demographics Population Table Total Persons and Persons by Age category for Cape Canaveral, Florida (Source U.S. Census Bureau & MARFIN Sociodemographic Database. Louisiana Population Data Center & National Marine Fisheries Service). Total Persons and Age Category Total Persons Persons Age Persons Age Persons Age Persons Age Persons Age Persons Age Persons Age Persons Age Persons Age Housing Tenure Table Housing Tenure for Cape Canaveral, Florida (Source: U.S. Census Bureau). Percent Renter Occupied Percent Owner Occupied Residence in 1985 and 1995 Table Residence in 1985 and 1995 for Cape Canaveral, Florida (Source: U.S. Census Bureau). Different House Same County Same House
260 Employment/Unemployment Table Employment and Unemployment for Cape Canaveral, Florida (Source: U.S. Census Bureau). Persons 16 yrs and over Percent in labor force Percent unemployed Race Table Race for Cape Canaveral, Florida (Source U.S. Census Bureau & MARFIN Sociodemographic Database. Louisiana Population Data Center & National Marine Fisheries Service). Race Black Persons Latino Black Persons Latino Persons White Persons ,114 Latino White Persons Education Table Years of Education by Category for those 25 Years and Older for Cape Canaveral, Florida (Source: U.S. Census Bureau & MARFIN Sociodemographic Database. Louisiana Population Data Center & National Marine Fisheries Service). Education w/ 0-8 years education w/ 9-11 years education w/ HS diploma w/ years. education w/ College Degree Drop outs
261 Income and Poverty Table Average Household Wage/Salary and Persons Below the Poverty Level for Cape Canaveral, Florida (Source: U.S. Census Bureau & MARFIN Sociodemographic Database. Louisiana Population Data Center & National Marine Fisheries Service). Wage or Salary Average Household Wage/Salary Income (dollars) $9357 $14616 $27764 $30858 Poverty Level Persons Below Poverty Level Age 65+ Below Poverty Level Households with Public Assistance Industry Table Employment by Industry for Cape Canaveral, Florida (Source: U.S. Census Bureau & MARFIN Sociodemographic Database. Louisiana Population Data Center & National Marine Fisheries Service). Industry Agriculture, Fishing, Mining Construction Business Services Communication/Utilities Manufacturing Financial, Insurance & Real Estate Services Wholesale/Retail Trade Transportation Occupation Table Employment by Occupation for Cape Canaveral, Florida (Source: U.S. Census Bureau & MARFIN Sociodemographic Database. Louisiana Population Data Center & National Marine Fisheries Service). Occupation Sales Clerical Craft Exec/Managerial Farm/Fish/Forest Household Services Laborer/Handler Operative/Transport Service, except Household Technical
262 5.6.3 Cape Canaveral Fishing Demographics Table Number of Federal Permit by Type for Cape Canaveral, Florida (Source: NMFS 2002) Type of Permit Total permitted vessels Commercial King Mackerel Commercial Spanish Mackerel Commercial Spiny Lobster Charter/Headboat for Coastal Pelagics Charter/Headboat for Snapper Grouper Snapper Grouper Class Snapper Grouper Class Swordfish Shark Rock Shrimp Federal Dealers Table Employment in Fishing Related Industry for Cape Canaveral, Florida (Zip code Business Patterns, U.S. Census Bureau 1998) Category NAIC Code Number Employed Fishing Seafood Canning Seafood Processing Boat Building Fish and Seafoods Fish and Seafood Markets Marinas Total Fishing Employment

263 5.7 Sebastian (32976, 32958) Community Description Sebastian and Vero Beach are two of the five districts that comprise Indian River County. Both communities were first settled in the 1880s. Communication with the rest of the country and even other counties was difficult. Therefore, settlers had to hunt, trap, and fish for everything. The railroad was completed in time for the Spanish American War, bringing troops to Florida (Newman, 1953). The arrival of the railroad also increased the commercial fishing sector of Sebastian and Vero Beach. Icehouses developed to pack and store the fish around 1900, and the trains exported the products north. The original fish house of one of the very first commercial fishing families still operates today on Indian River Drive in Sebastian
264 Today, recreational fishing, along with commercial fishing, is an important part of the Indian River County culture. The Indian River Lagoon is home to more than 700 species of fresh and saltwater fish. 47 Saltwater anglers can fish the Sebastian Inlet and the Sebastian River for snook and red drum in the 20 to 30 pound class. Grouper, snapper, flounder, sheepshead, permit, whiting, blues, and shark can be caught off the Sebastian Inlet pier. 48 Deep sea fishing charters also leave from Sebastian and Vero Beach, offering bottom fishing and blue water trolling for dolphin, sailfish, wahoo, grouper, and cobia. Sebastian has seen moderate population growth since 1990 to 2000 after a large increase from 1980 to The percent of the population in the labor force has remained relatively stable while unemployment has dropped from 5.7 percent in 1990 to 3.2 in Average wage and salary have grown steadily over the past few decades, but the number of persons who live under the poverty level has increased dramatically. The number of persons working in the farm, fish and forestry sectors for occupation and industry has fluctuated since 1980, but has dropped in the most recent census. There are 71 commercial vessels with federal permits according to Table and most of those have coastal pelagic permits. Only 12 of those vessels have charter permits. There is not much employment reported in the fishing related sectors of Table with only15 in the marinas sector, 9 in fish and seafood and 3 in fishing Sebastian Census Demographics Population Table Total Persons and Persons by Age category for Sebastian, Florida (Source U.S. Census Bureau & MARFIN Sociodemographic Database. Louisiana Population Data Center & National Marine Fisheries Service). Total Persons and Age Category Total Persons Persons Age Persons Age Persons Age Persons Age Persons Age Persons Age Persons Age Persons Age Persons Age
265 Housing Tenure Table Housing Tenure for Sebastian, Florida (Source: U.S. Census Bureau). Percent Renter Occupied Percent Owner Occupied Residence in 1985 and 1995 Table Residence in 1985 and 1995 for Sebastian, Florida (Source: U.S. Census Bureau). Different House Same County Same House Employment/Unemployment Table Employment and Unemployment for Sebastian, Florida (Source: U.S. Census Bureau). Persons 16 yrs and over Percent in labor force Percent unemployed Race Table Race for Sebastian, Florida (Source U.S. Census Bureau & MARFIN Sociodemographic Database. Louisiana Population Data Center & National Marine Fisheries Service). Race Black Persons Latino Black Persons Latino Persons White Persons Latino White Persons
266 Education Table Years of Education by Category for those 25 Years and Older for Sebastian, Florida (Source: U.S. Census Bureau & MARFIN Sociodemographic Database. Louisiana Population Data Center & National Marine Fisheries Service). Education w/ 0-8 years education w/ 9-11 years education w/ HS diploma w/ years. education w/ College Degree Drop outs Income and Poverty Table Average Household Wage/Salary and Persons Below the Poverty Level for Sebastian, Florida (Source: U.S. Census Bureau & MARFIN Sociodemographic Database. Louisiana Population Data Center & National Marine Fisheries Service). Wage or Salary Average Household Wage/Salary Income (dollars). $13218 $28122 $39327 Poverty Level Persons Below Poverty Level Age 65+ Below Poverty Level Households with Public Assistance Industry Table Employment by Industry for Sebastian, Florida (Source: U.S. Census Bureau & MARFIN Sociodemographic Database. Louisiana Population Data Center & National Marine Fisheries Service). Industry Agriculture, Fishing, Mining Construction Business Services Communication/Utilities Manufacturing Financial, Insurance & Real Estate Services Wholesale/Retail Trade Transportation
267 Occupation Table Employment by Occupation for Sebastian, Florida (Source: U.S. Census Bureau & MARFIN Sociodemographic Database. Louisiana Population Data Center & National Marine Fisheries Service). Occupation Sales Clerical Craft Exec/Managerial Farm/Fish/Forest Household Services Laborer/Handler Operative/Transport Service, except Household Technical Sebastian Fishing Demographics Table Number of Federal Permit by Type for Sebastian, Florida (Source: NMFS 2002) Type of Permit Total permitted vessels Commercial King Mackerel Commercial Spanish Mackerel Commercial Spiny Lobster Charter/Headboat for Coastal Pelagics Charter/Headboat for Snapper Grouper Snapper Grouper Class Snapper Grouper Class Swordfish Shark Rock Shrimp Federal Dealers Table Employment in Fishing Related Industry for Sebastian, Florida (Zip code Business Patterns, U.S. Census Bureau 1998) Category NAIC Code Number Employed Fishing Seafood Canning Seafood Processing Boat Building Fish and Seafoods Fish and Seafood Markets Marinas Total Fishing Employment

268 5.8 Fort Pierce (34950) Community Description The Spanish built Fort Santa Lucia on the Jupiter Inlet in 1565 from which the county now draws its name St. Lucie County. 49 Permanent US inhabitance of Ft. Pierce dates back to the Seminole Indian War. US Army Lt. Col. Benjamin Kendrick Pierce, for whom the town is named, built a fort in 1837 to use as the army s headquarters. The war ended in the early 1840s, making way for settlement and development: Water transportation, fishing and canning fish were key to the area s early economy. 50 The arrival of Henry Flagler s railroad in the early 1900s opened Ft. Pierce s economy to the rest of the east coast. Ft. Pierce beach was used as a naval base during World War II
269 The culture of fishing has been in the area since its inception. Anecdotes passed down from one generation to the next of Ft. Pierce residents describe the abundance of fish in the area in the late 1800s and early 1900s. One such story, told by Newman (1953) in her book, Early Life Along the Beautiful Indian River, tells of a man who bound his shirt at the sleeves and waist and cut a plunging neckline. He would then stand in the water until the shirt was full of fish and then empty it out into a bucket on the shore. In the late 1800s, a man from the nearby town of Titusville helped to create the commercial fishing sector in Ft. Pierce. He would bring the fish to Titusville for shipping to the rest of the east coast. The first icehouse for packaging fish was built in 1900 (Newman, 1953). Recreational fishing has also become a popular pastime in Ft. Pierce and the rest of St. Lucie County. This is due in large part to the fleet of Spanish galleons that sunk off the St. Lucie and Martin Counties coastline. These artificial reefs have created excellent fishing and diving spots for locals and tourists. The reefs attract spiny lobsters, marlin, snook, flounder, and grouper. 52 Some of the more popular fish in the St. Lucie River include channel bass, snook, ladyfish, jack crevalle, and trout. Black bass is another famous catch in the area. 53 Most charter fishing boats in the area offer half, three-quarter, and full-day trips for dolphin, sailfish, wahoo, amberjack, tuna, kingfish, snapper, and grouper. Fort Pierce has seen moderate population growth over the past three decades while the percent of the population in the labor force has remained around 55 percent while unemployment has dropped from 12.4 percent in 1990 to 8.8 percent in Average wage and salary has grown slowly over the past ten years while the number of persons living under the poverty level has risen significantly. The number of people working in farm, fish and forestry has remained relatively high for both occupation and industry over the years with both categories having over 1000 persons in each. There are over 100 vessels with federal permits homeported in Ft. Pierce and most of those have coastal pelagic permits (Table ). There are over 260 persons employed in the boat building sector of fishing related employment according to Table
270 5.8.2 Fort Pierce Census Demographics Population Table Total Persons and Persons by Age category for Fort Pierce, Florida (Source U.S. Census Bureau & MARFIN Sociodemographic Database. Louisiana Population Data Center & National Marine Fisheries Service). Total Persons and Age Category Total Persons Persons Age Persons Age Persons Age Persons Age Persons Age Persons Age Persons Age Persons Age Persons Age Housing Tenure Table Housing Tenure for Fort Pierce, Florida (Source: U.S. Census Bureau). Percent Renter Occupied Percent Owner Occupied Residence in 1985 and 1995 Table Residence in 1985 and 1995 for Fort Pierce, Florida (Source: U.S. Census Bureau). Different House Same County Same House Employment/Unemployment Table Employment and Unemployment for Fort Pierce, Florida (Source: U.S. Census Bureau). Persons 16 yrs and over Percent in labor force Percent unemployed
271 Race Table Race for Fort Pierce, Florida (Source U.S. Census Bureau & MARFIN Sociodemographic Database. Louisiana Population Data Center & National Marine Fisheries Service). Race Black Persons Latino Black Persons Latino Persons White Persons Latino White Persons Education Table Years of Education by Category for those 25 Years and Older for Fort Pierce, Florida (Source: U.S. Census Bureau & MARFIN Sociodemographic Database. Louisiana Population Data Center & National Marine Fisheries Service). Education w/ 0-8 years education w/ 9-11 years education w/ HS diploma w/ years. education w/ College Degree Drop outs Income and Poverty Table Average Household Wage/Salary and Persons Below the Poverty Level for Fort Pierce, Florida (Source: U.S. Census Bureau & MARFIN Sociodemographic Database. Louisiana Population Data Center & National Marine Fisheries Service). Wage or Salary Average Household Wage/Salary Income (dollars) $6273 $13564 $23595 $25121 Poverty Level Persons Below Poverty Level Age 65+ Below Poverty Level Households with Public Assistance
272 Industry Table Employment by Industry for Fort Pierce, Florida (Source: U.S. Census Bureau & MARFIN Sociodemographic Database. Louisiana Population Data Center & National Marine Fisheries Service). Industry Agriculture, Fishing, Mining Construction Business Services Communication/Utilities Manufacturing Financial, Insurance & Real Estate Services Wholesale/Retail Trade Transportation Occupation Table Employment by Occupation for Fort Pierce, Florida (Source: U.S. Census Bureau & MARFIN Sociodemographic Database. Louisiana Population Data Center & National Marine Fisheries Service). Occupation Sales Clerical Craft Exec/Managerial Farm/Fish/Forest Household Services Laborer/Handler Operative/Transport Service, except Household Technical
273 5.8.3 Fort Pierce Fishing Demographics Table Number of Federal Permit by Type for Fort Pierce, Florida (Source: NMFS 2002) Type of Permit Total permitted vessels Commercial King Mackerel Commercial Spanish Mackerel Commercial Spiny Lobster Charter/Headboat for Coastal Pelagics Charter/Headboat for Snapper Grouper Snapper Grouper Class Snapper Grouper Class Swordfish Shark Rock Shrimp Federal Dealers Table Employment in Fishing Related Industry for Fort Pierce, Florida (Zip code Business Patterns, U.S. Census Bureau 1998) Category NAIC Code Number Employed Fishing Seafood Canning Seafood Processing Boat Building Fish and Seafoods Fish and Seafood Markets Marinas Total Fishing Employment

274 5.9 Jupiter (33458,33468,33469,33477,33478) Community Description The name Jupiter derives from the original inhabitants of the area, the Jeaga Indians. The Native Americans called themselves Jobe, so the Spanish explorers called the inlet the Jobe River. The English settlers who arrived in the 1760s thought the name was Jove, a mythological god also known as Jupiter. 54 Jupiter first became famous when Jonathan Dickinson s boat the Reformation was shipwrecked along the coast in However, it was not until 1821 that real development of the area began. Eusebio Gomez was given 12,000 acres in a land grant in In 1821, he started the real estate business on Jupiter Island by selling 8,000 of his acres for $8,000 (Reed, 1955:12). Sport fishermen have been present in the Jupiter Island region since the 1800s. Stanley (1988) lists numerous species of fish that were and still are popular in Jupiter Island. Snook, tarpon, mangrove snapper, and jack crevalle were some of the most desired fish. Later, with the advancement of boat
275 technology, species in the Gulf Stream, such as sailfish, dolphin, wahoo, and King mackerel became popular catches of the local fishermen. Two events of the late 1920s decreased some of the fishing in the area. A hurricane struck Lake Okeechobee in The devastation it caused led to the Okeechobee Flood Control Project. The project created high levels of silt and mud around Jupiter Island, causing a severe decline in the snapper and grouper populations, two of the most sought after food fish (Stanley, 1988:20). However, this did not diminish the appeal of sport fishing. J.D. Bassett moved from Virginia to Palm Beach in He was one of the most avid fishermen in Jupiter. He made the trip to and from Palm Beach so often that the captain of his boat said, Mr. Bassett, you come up here almost every day. Why don t you just move up here (Stanley, 1988:28). Bassett was not the only person drawn to Jupiter s waters. Many of the fishermen in Jupiter practice catch and release. In February 1986, three Palm Beachbased sportfishing boats caught and released 72 sailfish in a span of five hours five miles east of the Jupiter Island Beach Club (Stanley, 1988:21). Many of those who enjoy fishing Jupiter Island today are said to be descended from those families that have been fishing the area for decades. Jupiter has seen fairly steady population growth with its 2000 population reaching 39,314. The labor force has remained fairly constant with just over 60 percent of the population participating. Unemployment has also remained low at 3.3 percent for both 1990 and Average wage and salary have risen to a high of $54, 945 and the number of persons living under the poverty level has also climbed to a high of 1885 in The number of people working in farm, fish and forestry occupations and industry reached a peak in 1990 but has since declined dramatically in Jupiter has 77 vessels homeported with federal permits as shown in Table and most of them have coastal pelagic permits with 20 holding snapper grouper class 1 permits. There is some fishing related employment according to Table with 40 persons employed in the marinas sector and 16 in fish and seafood Jupiter Census Demographics Population Table Total Persons and Persons by Age category for Jupiter, Florida (Source U.S. Census Bureau & MARFIN Sociodemographic Database. Louisiana Population Data Center & National Marine Fisheries Service). Total Persons and Age Category Total Persons Persons Age Persons Age Persons Age Persons Age Persons Age Persons Age Persons Age Persons Age Persons Age
276 Housing Tenure Table Housing Tenure for Jupiter, Florida (Source: U.S. Census Bureau). Percent Renter Occupied Percent Owner Occupied Residence in 1985 and 1995 Table Residence in 1985 and 1995 for Jupiter, Florida (Source: U.S. Census Bureau). Different House Same County Same House Employment/Unemployment Table Employment and Unemployment for Jupiter, Florida (Source: U.S. Census Bureau). Persons 16 yrs and over Percent in labor force Percent unemployed Race Table Race for Jupiter, Florida (Source U.S. Census Bureau & MARFIN Sociodemographic Database. Louisiana Population Data Center & National Marine Fisheries Service). Race Black Persons Latino Black Persons Latino Persons White Persons Latino White Persons
277 Education Table Years of Education by Category for those 25 Years and Older for Jupiter, Florida (Source: U.S. Census Bureau & MARFIN Sociodemographic Database. Louisiana Population Data Center & National Marine Fisheries Service). Education w/ 0-8 years education w/ 9-11 years education w/ HS diploma w/ years. education w/ College Degree Drop outs Income and Poverty Table Average Household Wage/Salary and Persons Below the Poverty Level for Jupiter, Florida (Source: U.S. Census Bureau & MARFIN Sociodemographic Database. Louisiana Population Data Center & National Marine Fisheries Service). Wage or Salary Average Household Wage/Salary Income (dollars). $19706 $45280 $54945 Poverty Level Persons Below Poverty Level Age 65+ Below Poverty Level Households with Public Assistance Industry Table Employment by Industry for Jupiter, Florida (Source: U.S. Census Bureau & MARFIN Sociodemographic Database. Louisiana Population Data Center & National Marine Fisheries Service). Industry Agriculture, Fishing, Mining Construction Business Services Communication/Utilities Manufacturing Financial, Insurance & Real Estate Services Wholesale/Retail Trade Transportation
278 Occupation Table Employment by Occupation for Jupiter, Florida (Source: U.S. Census Bureau & MARFIN Sociodemographic Database. Louisiana Population Data Center & National Marine Fisheries Service). Occupation Sales Clerical Craft Exec/Managerial Farm/Fish/Forest Household Services Laborer/Handler Operative/Transport Service, except Household Technical Jupiter Fishing Demographics Table Number of Federal Permit by Type for Jupiter, Florida (Source: NMFS 2002) Type of Permit Total permitted vessels Commercial King Mackerel Commercial Spanish Mackerel Commercial Spiny Lobster Charter/Headboat for Coastal Pelagics Charter/Headboat for Snapper Grouper Snapper Grouper Class Snapper Grouper Class Swordfish Shark Rock Shrimp Federal Dealers Table Employment in Fishing Related Industry for Jupiter, Florida (Zip code Business Patterns, U.S. Census Bureau 1998) Category NAIC Code Number Employed Fishing Seafood Canning Seafood Processing Boat Building Fish and Seafoods Fish and Seafood Markets Marinas Total Fishing Employment

279 5.10 Palm Beach (33480) Community Description Palm Beach was originally known as Lake Worth. The name was changed to Palm Beach in the 1900s, when a man from Philadelphia noticed the coconut palm trees growing near the lake. In 1878, a ship named the Providencia was sailing from South America back to Barcelona with a shipment of coconuts. The ship wrecked on the beach and hundreds of the coconuts washed ashore, embedded themselves in the sandy beaches, and sprouted into young trees (Spencer, 1975:19). Life for the early settlers was difficult. The only lumber available to build their homes was from wood washed ashore from shipwrecks. Residents of Palm Beach had to sail north to Titusville for supplies, such as flour, meal, and other staples (Spencer, 1975). Most of the original settlers, prior to 1900, were from Michigan, Illinois, Ohio, Iowa, and Wisconsin. A.O. Lang, a German horticulturist and one of the first residents of Palm Beach, planted numerous citrus fruit trees, such as limes, lemons, oranges, and pineapples (First Federal Savings and Loan Association of Lake Worth, 1967). 272
280 Citrus groves were not the only source of food and income for the residents of Palm Beach. Fish were plentiful for the early settlers. The importance of fish dates back to the Native Americans who once inhabited the land. They partook in shark-fishing, using the teeth for cutting, the vertebrae as ornaments, and the rest for meat. Shellfish were an important part of the Indians diet as well (McGoun, 1998). The western part of Palm Beach County was known for its catfish industry. The arrival of Henry Flagler s Florida East Coast Railroad assisted in increasing the profitability of the catfish industry in Palm Beach, making it easier to ship the fish northward (McGoun, 1998). However, during WWII, fishermen were not only retrieving fish from the waters. West Palm Beach was an embarkation point for the Air Force bomber crews. German submarines would sit offshore and sink US military vessels. In the early days of the war, local fishermen would go out and pick up survivors from these ill-fated ships (First Federal Savings and Loan Association of Lake Worth, 1967). The Frontier days of 1873 to 1893, pioneers called the area from Jupiter to Hypoluxo the Lake Worth Region and traveled by boat from one homestead to another. H.F. Hammon was the first to claim a homestead in the area that is now Palm Beach. E.N. Cap Dimick was the most influential settler by being the first hotelier in Palm Beach and the first Mayor! Most of his family had settled in the area by 1876 and his descendants still remain. Palm Beach has seen relatively slight population growth over the past two decades. It has a low percentage of its population in the labor force with only 31 percent and Unemployment is low at 3.3 percent. Average wage and salary is extremely high at $94,562 and the number of people living below the poverty line has remained fairly constant at 551. The number of persons working in farm, fish, and forestry occupation and industry has dropped considerably since 1990 as is the case for most coastal communities. Table indicates there are 23 vessels with federal permits and about half of them are holding coastal pelagic permits. There is relatively little fishing related employment according to Table with only 3 in the fishing sector and 3 in marinas. 273
281 Palm Beach Census Demographics Population Table Total Persons and Persons by Age category for Palm Beach, Florida (Source U.S. Census Bureau & MARFIN Sociodemographic Database. Louisiana Population Data Center & National Marine Fisheries Service). Total Persons and Age Category Total Persons Persons Age Persons Age Persons Age Persons Age Persons Age Persons Age Persons Age Persons Age Persons Age Housing Tenure Table Housing Tenure for Palm Beach, Florida (Source: U.S. Census Bureau). Percent Renter Occupied Percent Owner Occupied Residence in 1985 and 1995 Table Residence in 1985 and 1995 for Palm Beach, Florida (Source: U.S. Census Bureau). Different House Same County Same House Employment/Unemployment Table Employment and Unemployment for Palm Beach, Florida (Source: U.S. Census Bureau). Persons 16 yrs and over Percent in labor force Percent unemployed
282 Race Table Race for Palm Beach, Florida (Source U.S. Census Bureau & MARFIN Sociodemographic Database. Louisiana Population Data Center & National Marine Fisheries Service). Race Black Persons Latino Black Persons Latino Persons White Persons Latino White Persons Education Table Years of Education by Category for those 25 Years and Older for Palm Beach, Florida (Source: U.S. Census Bureau & MARFIN Sociodemographic Database. Louisiana Population Data Center & National Marine Fisheries Service). Education w/ 0-8 years education w/ 9-11 years education w/ HS diploma w/ years. education w/ College Degree Drop outs Income and Poverty Table Average Household Wage/Salary and Persons Below the Poverty Level for Palm Beach, Florida (Source: U.S. Census Bureau & MARFIN Sociodemographic Database. Louisiana Population Data Center & National Marine Fisheries Service). Wage or Salary Average Household Wage/Salary Income (dollars). $29092 $78972 $94562 Poverty Level Persons Below Poverty Level Age 65+ Below Poverty Level Households with Public Assistance
283 Industry Table Employment by Industry for Palm Beach, Florida (Source: U.S. Census Bureau & MARFIN Sociodemographic Database. Louisiana Population Data Center & National Marine Fisheries Service). Industry Agriculture, Fishing, Mining Construction Business Services Communication/Utilities Manufacturing Financial, Insurance & Real Estate Services Wholesale/Retail Trade Transportation Occupation Table Employment by Occupation for Palm Beach, Florida (Source: U.S. Census Bureau & MARFIN Sociodemographic Database. Louisiana Population Data Center & National Marine Fisheries Service). Occupation Sales Clerical Craft Exec/Managerial Farm/Fish/Forest Household Services Laborer/Handler Operative/Transport Service, except Household Technical
284 Palm Beach Fishing Demographics Table Number of Federal Permit by Type for Palm Beach, Florida (Source: NMFS 2002) Type of Permit Total permitted vessels Commercial King Mackerel Commercial Spanish Mackerel Commercial Spiny Lobster Charter/Headboat for Coastal Pelagics Charter/Headboat for Snapper Grouper Snapper Grouper Class Snapper Grouper Class Swordfish Shark Rock Shrimp Federal Dealers Table Employment in Fishing Related Industry for Palm Beach, Florida (Zip code Business Patterns, U.S. Census Bureau 1998) Category NAIC Code Number Employed Fishing Seafood Canning Seafood Processing Boat Building Fish and Seafoods Fish and Seafood Markets Marinas Total Fishing Employment 6 277

285 5.11 Boca Raton (33487, 33431, 33486, 33496, 33432, 33434) Community Description The area of current day Boca Raton was inhabited by Native Americans for nearly 1,000 years before the arrival of the Spanish. The original name given to the area by the Spanish explorers was Boca de Ratones. In nautical terms, boca denotes an inlet. Some of the translations include, haulage inlet, inlet of mice, inlet of sharp-pointed rocks, and inlet of cowardly thieves. Rata, not raton is the Spanish word for rat (Ashton, 1984). Captain Thomas Moore Rickards, Sr. of Missouri was one of the first people who wanted to settle the area of Boca Raton. He arrived in Florida in 1876 and became a citrus farmer in Candler. The freeze of forced him farther south to Lake Boca Raton. A year later, the tracks for Henry Flagler s East Coast Railroad were laid in Boca Raton, allowing for easier, faster shipping and more convenient modes of transportation. By the beginning of the 1900s, Boca Raton came into existence as a little agricultural center of orchards and farms (Ashton, 1984:3). 278
286 In 1904, a Japanese immigrant, Joseph Sakai, established a Japanese farming community of pineapple farmers in Boca Raton. He named the area Yamato. 55 The land boom of the 1920s and the arrival of famous architect Addison Mizner helped Boca Raton gain the image it still retains today as that of a luxurious resort town. He had already helped build up Palm Beach and was now aiding in the development of the areas to its south (Ashton, 1984). Boca Raton has experienced fairly steady population growth reaching 75,594 in Unemployment has risen slightly in 2000 from 1990 but the percentage of the population in the labor force has remained around 59 percent. The average wage and salary is high being above $60,000 yet the number of persons living below the poverty level has grown steadily since The number of persons employed in farm, fish and forestry occupations and industry dropped dramatically in 2000 from a high in There are 8 vessels with federal permits listed in Table but there are no federal dealers in Boca Raton. As far as fishing related employment there are 21 people listed in the fish and seafood sector according to Table Boca Raton Census Demographics Population Table Total Persons and Persons by Age category for Boca Raton, Florida (Source U.S. Census Bureau & MARFIN Sociodemographic Database. Louisiana Population Data Center & National Marine Fisheries Service). Total Persons and Age Category Total Persons Persons Age Persons Age Persons Age Persons Age Persons Age Persons Age Persons Age Persons Age Persons Age Housing Tenure Table Housing Tenure for Boca Raton, Florida (Source: U.S. Census Bureau). Percent Renter Occupied Percent Owner Occupied
287 Residence in 1985 and 1995 Table Residence in 1985 and 1995 for Boca Raton, Florida (Source: U.S. Census Bureau). Different House Same County Same House Employment/Unemployment Table Employment and Unemployment for Boca Raton, Florida (Source: U.S. Census Bureau). Persons 16 yrs and over Percent in labor force Percent unemployed Race Table Race for Boca Raton, Florida (Source U.S. Census Bureau & MARFIN Sociodemographic Database. Louisiana Population Data Center & National Marine Fisheries Service). Race Black Persons Latino Black Persons Latino Persons White Persons Latino White Persons Education Table Years of Education by Category for those 25 Years and Older for Boca Raton, Florida (Source: U.S. Census Bureau & MARFIN Sociodemographic Database. Louisiana Population Data Center & National Marine Fisheries Service). Education w/ 0-8 years education w/ 9-11 years education w/ HS diploma w/ years. education w/ College Degree Drop outs
288 Income and Poverty Table Average Household Wage/Salary and Persons Below the Poverty Level for Boca Raton, Florida (Source: U.S. Census Bureau & MARFIN Sociodemographic Database. Louisiana Population Data Center & National Marine Fisheries Service). Wage or Salary Average Household Wage/Salary Income (dollars) $11409 $24986 $54959 $60248 Poverty Level Persons Below Poverty Level Age 65+ Below Poverty Level Households with Public Assistance Industry Table Employment by Industry for Boca Raton, Florida (Source: U.S. Census Bureau & MARFIN Sociodemographic Database. Louisiana Population Data Center & National Marine Fisheries Service). Industry Agriculture, Fishing, Mining Construction Business Services Communication/Utilities Manufacturing Financial, Insurance & Real Estate Services Wholesale/Retail Trade Transportation Occupation Table Employment by Occupation for Boca Raton, Florida (Source: U.S. Census Bureau & MARFIN Sociodemographic Database. Louisiana Population Data Center & National Marine Fisheries Service). Occupation Sales Clerical Craft Exec/Managerial Farm/Fish/Forest Household Services Laborer/Handler Operative/Transport Service, except Household Technical
289 Boca Raton Fishing Demographics Table Number of Federal Permit by Type for Boca Raton, Florida (Source: NMFS 2002) Type of Permit Total permitted vessels Commercial King Mackerel Commercial Spanish Mackerel Commercial Spiny Lobster Charter/Headboat for Coastal Pelagics Charter/Headboat for Snapper Grouper Snapper Grouper Class Snapper Grouper Class Swordfish Shark Rock Shrimp Federal Dealers Table Employment in Fishing Related Industry for Boca Raton, Florida (Zip code Business Patterns, U.S. Census Bureau 1998) Category NAIC Code Number Employed Fishing Seafood Canning Seafood Processing Boat Building Fish and Seafoods Fish and Seafood Markets Marinas Total Fishing Employment
.")
290 5.12 Key Largo (33037) Community Description The Florida Keys were first discovered by Juan Ponce de Leon in He named them Los Martires, the martyrs, because they seemed twisted and tortured (Williams, 1991:3). The first permanent European settlement did not occur until the mid-1800s; however, the Keys were inhabited by the Calusa Indians for thousands of years. Williams notes (1991:3), the first people to establish permanent homes in the Upper Keys Key Largo and Islamorada were Methodist fishermen and farmers. Ben Baker established pineapple farming in Key Largo, the longest Key and oldest named site in Florida, in He shipped his fruit on small boats to Key West, where the produce was loaded onto larger vessels for shipment to the northern states
291 Key Largo Census Demographics Population Table Total Persons and Persons by Age category for Key Largo, Florida (Source U.S. Census Bureau & MARFIN Sociodemographic Database. Louisiana Population Data Center & National Marine Fisheries Service). Total Persons and Age Category Total Persons Persons Age Persons Age Persons Age Persons Age Persons Age Persons Age Persons Age Persons Age Persons Age Housing Tenure Table Housing Tenure for Key Largo, Florida (Source: U.S. Census Bureau). Percent Renter Occupied Percent Owner Occupied Residence in 1985 and 1995 Table Residence in 1985 and 1995 for Key Largo, Florida (Source: U.S. Census Bureau). Different House Same County Same House Employment/Unemployment Table Employment and Unemployment for Key Largo, Florida (Source: U.S. Census Bureau). Persons 16 yrs and over Percent in labor force Percent unemployed
292 Race Table Race for Key Largo, Florida (Source U.S. Census Bureau & MARFIN Sociodemographic Database. Louisiana Population Data Center & National Marine Fisheries Service). Race Black Persons Latino Black Persons Latino Persons White Persons ,446 Latino White Persons Education Table Years of Education by Category for those 25 Years and Older for Key Largo, Florida (Source: U.S. Census Bureau & MARFIN Sociodemographic Database. Louisiana Population Data Center & National Marine Fisheries Service). Education w/ 0-8 years education w/ 9-11 years education w/ HS diploma w/ years. education w/ College Degree Drop outs Income and Poverty Table Average Household Wage/Salary and Persons Below the Poverty Level for Key Largo, Florida (Source: U.S. Census Bureau & MARFIN Sociodemographic Database. Louisiana Population Data Center & National Marine Fisheries Service). Wage or Salary Average Household Wage/Salary Income (dollars) $6860 $14893 $38138 $42577 Poverty Level Persons Below Poverty Level Age 65+ Below Poverty Level Households with Public Assistance
293 Industry Table Employment by Industry for Key Largo, Florida (Source: U.S. Census Bureau & MARFIN Sociodemographic Database. Louisiana Population Data Center & National Marine Fisheries Service). Industry Agriculture, Fishing, Mining Construction Business Services Communication/Utilities Manufacturing Financial, Insurance & Real Estate Services Wholesale/Retail Trade Transportation Occupation Table Employment by Occupation for Key Largo, Florida (Source: U.S. Census Bureau & MARFIN Sociodemographic Database. Louisiana Population Data Center & National Marine Fisheries Service). Occupation Sales Clerical Craft Exec/Managerial Farm/Fish/Forest Household Services Laborer/Handler Operative/Transport Service, except Household Technical Key Largo Fishing Demographics Table Number of Federal Permit by Type for Key Largo, Florida (Source: NMFS 2002) Type of Permit Total permitted vessels Commercial King Mackerel Commercial Spanish Mackerel Commercial Spiny Lobster Charter/Headboat for Coastal Pelagics Charter/Headboat for Snapper Grouper Snapper Grouper Class Snapper Grouper Class Swordfish Shark Rock Shrimp Federal Dealers
 Category NAIC Code Number Employed Fishing 114100 6 Seafood Canning 311711 0 Seafood Processing 311712 0 Boat Building 336612 6 Fish and Seafoods 422460 0 Fish and Seafood Markets")
294 Table Employment in Fishing Related Industry for Key Largo, Florida (Zip code Business Patterns, U.S. Census Bureau 1998) Category NAIC Code Number Employed Fishing Seafood Canning Seafood Processing Boat Building Fish and Seafoods Fish and Seafood Markets Marinas Total Fishing Employment Islamorada (33070, 33036) Community Description Incorporated in 1997 and officially named Islamorada, Village of Islands, the community includes the islands of Upper and Lower Matecumba Keys, Plantation Key and Windley Key. The first 287
295 settlers were Conchs who were of British descent by way of the Bahamas. They fished and raised fruits and vegetables to survive. In the early 1930 s wealthy Americans began to vacation in this area, particularly for the sport fishing. It has remained an important sport fishing center and self proclaimed Sportfishing Capital of the World. It has been estimated that there are over 100 charter fishing vessels in Islamorada. In addition to offshore charters there are probably just as many guide boats that fish the nearshore and inshore waters. The community supports a large tourist economy that is centered on the charter fishing industry and has at least 24 marinas and approximately 45 hotels/motels to cater to fishermen. There are at least 6 air fill stations where divers can fill their tanks and several marinas offer dive trips. There are a few commercial operations in the community but not many with most supporting a retail wholesale operation with a restaurant. The community has seen substantial population growth because of its recent incorporation. Employment and unemployment have not changed dramatically. Average wage and salary have increased and so has the number of persons living below the poverty level. Both may be artifacts of the incorporation. This community is one of the few that has seen an increase in the number of persons working in farm, fish and forestry according to Table and fishing related employment is spread out among marinas, fish and seafood and boat building (Table ) Islamorada Census Demographics Population Table Total Persons and Persons by Age category for Islamorada, Florida (Source U.S. Census Bureau & MARFIN Sociodemographic Database. Louisiana Population Data Center & National Marine Fisheries Service). Total Persons and Age Category Total Persons Persons Age Persons Age Persons Age Persons Age Persons Age Persons Age Persons Age Persons Age Persons Age Housing Tenure Table Housing Tenure for Islamorada, Florida (Source: U.S. Census Bureau). Percent Renter Occupied Percent Owner Occupied
296 Residence in 1985 and 1995 Table Residence in 1985 and 1995 for Islamorada, Florida (Source: U.S. Census Bureau). Different House Same County Same House Employment/Unemployment Table Employment and Unemployment for Islamorada, Florida (Source: U.S. Census Bureau). Persons 16 yrs and over Percent in labor force Percent unemployed Race Table Race for Islamorada, Florida (Source U.S. Census Bureau & MARFIN Sociodemographic Database. Louisiana Population Data Center & National Marine Fisheries Service). Race Black Persons Latino Black Persons Latino Persons White Persons Latino White Persons Education Table Years of Education by Category for those 25 Years and Older for Islamorada, Florida (Source: U.S. Census Bureau & MARFIN Sociodemographic Database. Louisiana Population Data Center & National Marine Fisheries Service). Education w/ 0-8 years education w/ 9-11 years education w/ HS diploma w/ years. education w/ College Degree Drop outs
297 Income and Poverty Table Average Household Wage/Salary and Persons Below the Poverty Level for Islamorada, Florida (Source: U.S. Census Bureau & MARFIN Sociodemographic Database. Louisiana Population Data Center & National Marine Fisheries Service). Wage or Salary Average Household Wage/Salary Income (dollars). $17848 $35041 $41522 Poverty Level Persons Below Poverty Level Age 65+ Below Poverty Level Households with Public Assistance Industry Table Employment by Industry for Islamorada, Florida (Source: U.S. Census Bureau & MARFIN Sociodemographic Database. Louisiana Population Data Center & National Marine Fisheries Service). Industry Agriculture, Fishing, Mining Construction Business Services Communication/Utilities Manufacturing Financial, Insurance & Real Estate Services Wholesale/Retail Trade Transportation Occupation Table Employment by Occupation for Islamorada, Florida (Source: U.S. Census Bureau & MARFIN Sociodemographic Database. Louisiana Population Data Center & National Marine Fisheries Service). Occupation Sales Clerical Craft Exec/Managerial Farm/Fish/Forest Household Services Laborer/Handler Operative/Transport Service, except Household Technical
298 Islamorada Fishing Demographics Table Number of Federal Permit by Type for Islamorada, Florida (Source: NMFS 2002) Type of Permit Total permits Commercial King Mackerel Commercial Spanish Mackerel Commercial Spiny Lobster Charter/Headboat for Coastal Pelagics Charter/Headboat for Snapper Grouper Snapper Grouper Class Snapper Grouper Class Swordfish Shark Rock Shrimp Federal Dealers Table Employment in Fishing Related Industry for Islamorada, Florida (Zip code Business Patterns, U.S. Census Bureau 1998) Category NAIC Code Number Employed Fishing Seafood Canning Seafood Processing Boat Building Fish and Seafoods Fish and Seafood Markets Marinas Total Fishing Employment

299 5.14 Marathon (33050) Community Description Marathon, or Key Vaca as it was called by the Spanish, was originally settled in the early 1800s by a group of Bahamians and numerous families from Mystic, Connecticut involved in fishing. Salvaging cargo from the Spanish Galleons in the area was also steeped in this key s history as well. 57 Marathon has seen steady growth in its population since The percentage of the population employed in the labor force along with unemployment has remained constant over the past ten years. Average wage and salary have also slowly increased over the years, but the number of individuals living under the poverty level has also climbed to over 1400 persons. The number of persons working in occupations or industry sector of farm, fish and forestry has dropped since 1990 but still remains high at over 200 persons. There are over 180 vessels with federal permits and the majority of those have coastal pelagic permits (Table ). Over 50 of those vessels have charter permits for either coastal pelagics or snapper grouper. Other permits that are held by over 40 vessels include spiny lobster, snapper grouper class 1 and 2. There are also 7 federal dealers in
300 Marathon. According to Table there are 92 persons employed in the fish and seafood sector of fishing related employment. There are 39 in the fishing sector and 47 in marinas Marathon Census Demographics Population Table Total Persons and Persons by Age category for Marathon, Florida (Source U.S. Census Bureau & MARFIN Sociodemographic Database. Louisiana Population Data Center & National Marine Fisheries Service). Total Persons and Age Category Total Persons Persons Age Persons Age Persons Age Persons Age Persons Age Persons Age Persons Age Persons Age Persons Age Housing Tenure Table Housing Tenure for Marathon, Florida (Source: U.S. Census Bureau). Percent Renter Occupied Percent Owner Occupied Residence in 1985 and 1995 Table Residence in 1985 and 1995 for Marathon, Florida (Source: U.S. Census Bureau). Different House Same County Same House Employment/Unemployment Table Employment and Unemployment for Marathon, Florida (Source: U.S. Census Bureau). Persons 16 yrs and over Percent in labor force Percent unemployed
301 Race Table Race for Marathon, Florida (Source U.S. Census Bureau & MARFIN Sociodemographic Database. Louisiana Population Data Center & National Marine Fisheries Service). Race Black Persons Latino Black Persons Latino Persons White Persons ,513 Latino White Persons Education Table Years of Education by Category for those 25 Years and Older for Marathon, Florida (Source: U.S. Census Bureau & MARFIN Sociodemographic Database. Louisiana Population Data Center & National Marine Fisheries Service). Education w/ 0-8 years education w/ 9-11 years education w/ HS diploma w/ years. education w/ College Degree Drop outs Income and Poverty Table Average Household Wage/Salary and Persons Below the Poverty Level for Marathon, Florida (Source: U.S. Census Bureau & MARFIN Sociodemographic Database. Louisiana Population Data Center & National Marine Fisheries Service). Wage or Salary Average Household Wage/Salary Income (dollars) $6745 $15495 $28609 $36010 Poverty Level Persons Below Poverty Level Age 65+ Below Poverty Level Households with Public Assistance
302 Industry Table Employment by Industry for Marathon, Florida (Source: U.S. Census Bureau & MARFIN Sociodemographic Database. Louisiana Population Data Center & National Marine Fisheries Service). Industry Agriculture, Fishing, Mining Construction Business Services Communication/Utilities Manufacturing Financial, Insurance & Real Estate Services Wholesale/Retail Trade Transportation Occupation Table Employment by Occupation for Marathon, Florida (Source: U.S. Census Bureau & MARFIN Sociodemographic Database. Louisiana Population Data Center & National Marine Fisheries Service). Occupation Sales Clerical Craft Exec/Managerial Farm/Fish/Forest Household Services Laborer/Handler Operative/Transport Service, except Household Technical Marathon Fishing Demographics Table Number of Federal Permit by Type for Marathon, Florida (Source: NMFS 2002) Type of Permit Total permits Commercial King Mackerel Commercial Spanish Mackerel Commercial Spiny Lobster Charter/Headboat for Coastal Pelagics Charter/Headboat for Snapper Grouper Snapper Grouper Class Snapper Grouper Class Swordfish Shark Rock Shrimp Federal Dealers
 Category NAIC Code Number Employed Fishing 114100 39 Seafood Canning 311711 0 Seafood Processing 311712 0 Boat Building 336612 0 Fish and Seafoods 422460 92 Fish and Seafood")
303 Table Employment in Fishing Related Industry for Marathon, Florida. (Zip code Business Patterns, U.S. Census Bureau 1998) Category NAIC Code Number Employed Fishing Seafood Canning Seafood Processing Boat Building Fish and Seafoods Fish and Seafood Markets Marinas Total Fishing Employment Big Pine Key (33042, 33043) 296
304 Community Description Big Pine Key, located in the Lower Keys, does not have a true history of its own. Settlement was sparse well into the twentieth century. The 1870 census for Big Pine Key lists only one inhabitant, George Wilson. 58 Wilson was a charcoal burner, providing his product for residents of Key West before the days of electricity. 59 A shark processing plant was established on Big Pine in 1923 by Hydenoil Products. The sharks were harvested for their leather and liver oil. The company averaged 100 sharks a day in The fishermen caught mostly hammerhead, sand, nurse, dusky, leopard, sawfish sharks. Even with this seeming success, the plant was shutdown in 1931 because of possible financial difficulty. 60 Big Pine Key and Cudjoe Key are included in tables for fishing demographics but the census demographics include only Big Pine Key. The population for this area has seen steady growth, while the percent of the population in the labor force and unemployment have remained fairly constant over the years with unemployment fairly low at 2.1 percent. Average wage and salary have increased steadily along with the number of persons living under the poverty level. The number of person working in the farm, fish and forestry occupation has dropped since 1990 but still remains high compared to other coastal communities. There are over 100 vessels with federal permits and they are spread out among the different types with most holding coastal pelagic permits but many with snapper grouper also (Table ). According to Table there are 50 people employed in the fishing sector and another 27 in the marinas sector Big Pine Key Census Demographics Population Table Total Persons and Persons by Age category for Big Pine Key, Florida (Source U.S. Census Bureau & MARFIN Sociodemographic Database. Louisiana Population Data Center & National Marine Fisheries Service). Total Persons and Age Category Total Persons Persons Age Persons Age Persons Age Persons Age Persons Age Persons Age Persons Age Persons Age Persons Age
305 Housing Tenure Table Housing Tenure for Big Pine Key, Florida (Source: U.S. Census Bureau). Percent Renter Occupied Percent Owner Occupied Residence in 1985 and 1995 Table Residence in 1985 and 1995 for Big Pine Key, Florida (Source: U.S. Census Bureau). Different House Same County Same House Employment/Unemployment Table Employment and Unemployment for Big Pine Key, Florida (Source: U.S. Census Bureau). Persons 16 yrs and over Percent in labor force Percent unemployed Race Table Race for Big Pine Key, Florida (Source U.S. Census Bureau & MARFIN Sociodemographic Database. Louisiana Population Data Center & National Marine Fisheries Service). Race Black Persons Latino Black Persons Latino Persons White Persons ,496 Latino White Persons
306 Education Table Years of Education by Category for those 25 Years and Older for Big Pine Key, Florida (Source: U.S. Census Bureau & MARFIN Sociodemographic Database. Louisiana Population Data Center & National Marine Fisheries Service). Education w/ 0-8 years education w/ 9-11 years education w/ HS diploma w/ years. education w/ College Degree Drop outs Income and Poverty Table Average Household Wage/Salary and Persons Below the Poverty Level for Big Pine Key, Florida (Source: U.S. Census Bureau & MARFIN Sociodemographic Database. Louisiana Population Data Center & National Marine Fisheries Service). Wage or Salary Average Household Wage/Salary Income (dollars). $16176 $29418 $44514 Poverty Level Persons Below Poverty Level Age 65+ Below Poverty Level Households with Public Assistance Industry Table Employment by Industry for Big Pine Key, Florida (Source: U.S. Census Bureau & MARFIN Sociodemographic Database. Louisiana Population Data Center & National Marine Fisheries Service). Industry Agriculture, Fishing, Mining Construction Business Services Communication/Utilities Manufacturing Financial, Insurance & Real Estate Services Wholesale/Retail Trade Transportation
307 Occupation Table Employment by Occupation for Big Pine Key, Florida (Source: U.S. Census Bureau & MARFIN Sociodemographic Database. Louisiana Population Data Center & National Marine Fisheries Service). Occupation Sales Clerical Craft Exec/Managerial Farm/Fish/Forest Household Services Laborer/Handler Operative/Transport Service, except Household Technical Big Pine Key Fishing Demographics Table Number of Federal Permit by Type for Big Pine Key, Florida (Source: NMFS 2002) Type of Permit Total permitted vessels Commercial King Mackerel Commercial Spanish Mackerel Commercial Spiny Lobster Charter/Headboat for Coastal Pelagics Charter/Headboat for Snapper Grouper Snapper Grouper Class Snapper Grouper Class Swordfish Shark Rock Shrimp Federal Dealers Table Employment in Fishing Related Industry for Big Pine Key, Florida (Zip code Business Patterns, U.S. Census Bureau 1998) Category NAIC Code Number Employed Fishing Seafood Canning Seafood Processing Boat Building Fish and Seafoods Fish and Seafood Markets Marinas Total Fishing Employment
.")
308 5.16 Key West (33040, 33041, 33045) Community Description Spanish explorer Juan Ponce de Leon and chronicler Antonio de Herrera were the first Europeans to set eyes upon Key West on May 15, It has the distinction of being the oldest city in south Florida (Williams, 1991:125). They called the island Cayo Hueso (Isle of Bones) because of the numerous bones they found on what was either a Calusa Indian burial ground or battlefield. It is believed that the English thought the Spanish meant oeste (west) and changed the name to Key West. However, the first permanent occupancy of Key West did not occur until In 1822, Spaniard Juan Salas sold the city of Key West to a Mobile, Alabama businessman named John Simonton for $2, Naval Commodore David Porter was sent to establish a naval post to help rid the area of pirates in that same year. They also established a port in order to open the shipping lanes from the Gulf of Mexico, the Caribbean, and the Atlantic. A Customs House was established later that year. 63 By 1830, the pirates were gone; however, hurricanes and the fear of running
The Economic Impacts of Carolina Beach Inlet Navigability
 The Economic s of Carolina Beach Inlet Navigability June 27, 2014 By: Chris Dumas, Ph.D. Department of Economics and Finance Cameron School of Business UNC-Wilmington 601 South College Road Wilmington,
Final Environmental Impact Statement. for the
 Final Environmental Impact Statement for the Generic Essential Fish Habitat Amendment to the following fishery management plans of the Gulf of Mexico (GOM): SHRIMP FISHERY OF THE GULF OF MEXICO RED DRUM
Economic Contribution of the 2018 Recreational Red Snapper Season in the South Atlantic
 Economic Contribution of the 2018 Recreational Red Snapper Season in the South Atlantic Produced for the: American Sportfishing Association (ASA) PO Box 6435 Fernandina Beach, FL 32035 Office (904) 277-9765
OR DUNGENESS CRAB FISHERY:
 E 55 OR DUNGENESS CRAB FISHERY: an economic analysis of productivity and profitability David S. Liao Joe B. Stevens OREGON STATE UNIVERSITY SEA GRANT COLLEGE PROGRAM Publication no. ORESU-T-75-005 AGRICULTURAL
15A NCAC 03O.0101, 15A NCAC 03O.0106,
 1 Fiscal Impacts of Proposed Rule Changes to the Ocean Fishing Pier License and Ocean Fishing Pier Blanket Coastal Recreational Fishing License to Reflect Statutory Changes Implemented in Session Law 2013-360
The Economics of Atlantic Highly Migratory Species For-Hire Fishing Trips July - November 2013 Clifford Hutt and George Silva
 The Economics of Atlantic Highly Migratory Species For-Hire Fishing Trips July - November 2013 Clifford Hutt and George Silva U.S. Department of Commerce National Oceanic and Atmospheric Administration
August 3, Prepared by Rob Cheshire 1 & Joe O Hop 2. Center for Coastal Fisheries and Habitat Research Beaufort, NC
 SEDAR 19-DW05 Evaluation of the 1960, 1965, and 1970 U.S. Fish and Wildlife Service salt-water angling survey data for use in the stock assessment of red grouper (Southeast US Atlantic) and black grouper
A Threatened Bay: Challenges to the Future of the Penobscot Bay Region and its Communities
 A Threatened Bay: Challenges to the Future of the Penobscot Bay Region and its Communities 1 A A Threatened Bay: Challenges to the Future of the Penobscot Bay Region and its Communities In 1996 the Island
Appendix G Coastal Demographic and Economic Trends Additional Figures
 Appendix G Coastal Demographic and Economic Trends Additional Figures Figure 1. Unemployment Rate in 1970-2004 18.0 16.0 14.0 12.0 10.0 8.0 6.0 4.0 1970 1972 1974 1976 1978 1980 1982 1984 1986 1988 1990
FISCAL NOTE FOR PROPOSED AMENDMENTS TO RULE 15A NCAC 03O A NCAC 03O.0503 PERMIT CONDITIONS; SPECIFIC
 FISCAL NOTE FOR PROPOSED AMENDMENTS TO RULE 15A NCAC 03O.0503 SPINY DOGFISH DEALER PERMIT Rule Amendments: Name of Commission: Agency Contact: Impact Summary: 15A NCAC 03O.0503 PERMIT CONDITIONS; SPECIFIC
Public Hearing Document
 Regulatory Amendment 1 to the Fishery Management Plan for the Dolphin and Wahoo Fishery of the Atlantic Modify commercial trip limits for dolphin Environmental Assessment Regulatory Impact Review Regulatory
Governor Roy Cooper Office of the Governor Mail Service Center Raleigh, NC April 25, Dear Governor Cooper,
 Governor Roy Cooper Office of the Governor 20301 Mail Service Center Raleigh, NC 27699-0301 April 25, 2018 Dear Governor Cooper, The North Carolina Watermen United (NCWU) requests that some of the seats
Hooray for Barnegat Bay!
 Hooray for Barnegat Bay! Subject Areas: Science, Social Studies Setting: Classroom Duration: One class period Skills: critical thinking, discussing, listing, comparing, listening, interviewing Vocabulary:
NOAA Fisheries Recrea.onal Fisheries Economics & Human Dimensions Program
 NOAA Fisheries Recrea.onal Fisheries Economics & Human Dimensions Program Rita Curtis, Ph.D., Office of Science & Technology The Fisheries Forum May 4-7, 2014 Beaufort, NC Overview Key Questions / Mandates
California s North Coast Fishing Communities Historical Perspective and Recent Trends
 California s North Coast Fishing Communities Historical Perspective and Recent Trends Appendix C: Methodological Detail Customization of PacFIN Landings Receipt Data to Characterize Commercial Fisheries
ESSENTIAL FISH HABITAT HABITAT AREAS OF PARTICULAR CONCERN (EFH-HAPC) AND CORAL HABITAT AREAS OF PARTICULAR CONCERN (C-HAPC)
 AND CORAL HABITAT AREAS OF PARTICULAR CONCERN (C-HAPC)") ESSENTIAL FISH HABITAT HABITAT AREAS OF PARTICULAR CONCERN () AND CORAL HABITAT AREAS OF PARTICULAR CONCERN (C-HAPC) Shrimp Sargassum All coastal inlets, all statedesignated habitats of particular importance
ESSENTIAL FISH HABITAT HABITAT AREAS OF PARTICULAR CONCERN () AND CORAL HABITAT AREAS OF PARTICULAR CONCERN (C-HAPC) Shrimp Sargassum All coastal inlets, all statedesignated habitats of particular importance
Marine Recreational and Commercial Industries and Activities in Lee and Charlotte Counties: Economic Consequences and Impacts
 Marine Recreational and Commercial Industries and Activities in Lee and Charlotte Counties: Economic Consequences and Impacts Betty Staugler Florida Sea Grant Extension Marine Agent & Chuck Adams Florida
Economic Analysis of Marine Recreational Fishing at NOAA Fisheries
 Economic Analysis of Marine Recreational Fishing at NOAA Fisheries Office of Science & Technology Sabrina Lovell Recreational Fisheries Economist March 8, 2017 Presented at EAA Seminar: Sustainable fisheries
Independent Economic Analysis Board. Review of the Estimated Economic Impacts of Salmon Fishing in Idaho. Task Number 99
 IEAB Independent Economic Analysis Board Roger Mann, Chair Noelwah R. Netusil, Vice-Chair Kenneth L. Casavant Daniel D. Huppert Joel R. Hamilton Lon L. Peters Susan S. Hanna Hans Radtke Review of the Estimated
The University of Georgia
 The University of Georgia Center for Agribusiness and Economic Development College of Agricultural and Environmental Sciences Economic Impacts of Alabama Quail Hunting Prepared by: Archie Flanders and
CORPS ON THE COAST. North Carolina Coastal Conference Coastal Infrastructure Raleigh, NC April 14, Jim Medlock Chief, Programs Management Branch
 CORPS ON THE COAST North Carolina Coastal Conference Coastal Infrastructure Raleigh, NC April 14, 2015 Jim Medlock Chief, Programs Management Branch US Army Corps of Engineers OVERVIEW What Are The Corps
Socioeconomic Profile and Spatial Analysis of Fisheries in the three central California National Marine Sanctuaries
 Socioeconomic Profile and Spatial Analysis of Fisheries in the three central California National Marine Sanctuaries Overview and Assessment of CDFG Fisheries Data for use in the Joint Management Plan Review
The Economic Impacts of Recreational Fishing in the Matagorda Bay System
 The Economic Impacts of Recreational Fishing in the Matagorda Bay System Prepared by Andrew Ropicki 1 Daniel Hanselka 2 Rebekka Dudensing 3 Rhonda Cummins 4 Bill Balboa 5 December 12, 2016 1 Assistant
Office of Science & Technology
 NOAA Fisheries Highlights of FEUS 2015 Highlights from the Annual Report Fisheries Economics of the United States, 2015 Office of Science & Technology Fisheries and the Economy U.S. fisheries provide jobs,
Keeping Gulf Red Snapper on the Road to Recovery
 A brief from July 2016 Keeping Gulf Red Snapper on the Road to Recovery Overview In 2007, the Gulf of Mexico Fishery Management Council implemented a rebuilding plan for red snapper that included scientifically
The Economic Impacts of Recreational Fishing in the San Antonio Bay System
 The Economic Impacts of Recreational Fishing in the San Antonio Bay System Prepared by Andrew Ropicki 1 Daniel Hanselka 2 Rebekka Dudensing 3 Rhonda Cummins 4 December 12, 2016 1 Assistant Professor and
Discussion Paper: Consideration of a Registration for Self-Guided Halibut Rental Boats
 Discussion Paper: Consideration of a Registration for Self-Guided Halibut Rental Boats December 2017 1 1 Introduction... 1 2 Description of the Problem... 1 2.1 Definition of self-guided halibut rental
Gulf of Mexico Oil Spill
 Bulletin 1204 May 2013 Estimation of the Baseline for Assessment of Economic Impacts of the Gulf of Mexico Oil Spill on Mississippi s Commercial Fishing Sector Discrimination based upon race, color, religion,
Texas Housing Markets: Metropolitan vs. Border Communities. September 22, 2014
 Texas Housing Markets: Metropolitan vs. Border Communities Luis Bernardo Torres Ruiz, Ph.D. Research Economist El Paso Branch Dallas Federal Rio Grande Economic Association September 22, 2014 Contents
Habitat Omnibus Amendment DEIS draft sections relative to recreational fishery DRAFT. Omnibus Essential Fish Habitat Amendment 2
 DRAFT Omnibus Essential Fish Habitat Amendment 2 Amendment 14 to the Northeast Multispecies FMP Amendment 14 to the Atlantic Sea Scallop FMP Amendment 4 to the Monkfish FMP Amendment 3 to the Atlantic
Coastal and marine recreation in New England is ingrained in the region s economic and
 RECREATION Coastal and marine recreation in New England is ingrained in the region s economic and social fabric. Recreation on the ocean and coast includes many of New Englanders most time-honored and
Coastal Harbors and Waterways, NC (Shallow Draft Navigation) (O&M)
 (O&M)") Coastal Harbors and Waterways, NC (Shallow Draft Navigation) (O&M) Shallow draft coastal harbors include a subsistence harbor at Silver Lake CONGRESSIONAL DISTRICT: NC 3, 7 DATE: 23 April 2018 1. AUTHORIZATION:
Coastal Harbors and Waterways, NC (Shallow Draft Navigation) (O&M) Shallow draft coastal harbors include a subsistence harbor at Silver Lake CONGRESSIONAL DISTRICT: NC 3, 7 DATE: 23 April 2018 1. AUTHORIZATION:
Golfers in Colorado: The Role of Golf in Recreational and Tourism Lifestyles and Expenditures
 Golfers in Colorado: The Role of Golf in Recreational and Tourism Lifestyles and Expenditures by Josh Wilson, Phil Watson, Dawn Thilmany and Steve Davies Graduate Research Assistants, Associate Professor
SOUTH ATLANTIC FISHERY MANAGEMENT COUNCIL ADVISORY PANEL SELECTION QUESTIONNAIRE CITY STATE ZIP. TELEPHONE (*Required) FAX
 FAX") SOUTH ATLANTIC FISHERY MANAGEMENT COUNCIL 4055 Faber Place Drive, Suite 201, North Charleston SC 29405 Call: (843) 571-4366 Toll-Free: (866) SAFMC-10 Fax: (843) 769-4520 Connect: www.safmc.net Dr. Michelle
SOUTH ATLANTIC FISHERY MANAGEMENT COUNCIL 4055 Faber Place Drive, Suite 201, North Charleston SC 29405 Call: (843) 571-4366 Toll-Free: (866) SAFMC-10 Fax: (843) 769-4520 Connect: www.safmc.net Dr. Michelle
The Economic Impact of Golf In South Carolina
 The Economic Impact of Golf In South Carolina By Dudley Jackson Research Director South Carolina Department of Parks, Recreation and Tourism For South Carolina Golf Course Owners Association April 2016
University Of Maryland
 2000 Census Census Data 200 Census Change 2000 to 200 SUBJECT Number Percent SUBJECT Number Percent Number Percent TOTAL POPULATION 437 TOTAL POPULATION 246-9 -43.7 White 283 64.8 White 65 67. -8-4.7 Black
SACO RIVER AND CAMP ELLIS BEACH SACO, MAINE SECTION 111 SHORE DAMAGE MITIGATION PROJECT APPENDIX F ECONOMIC ASSESSMENT
 SACO RIVER AND CAMP ELLIS BEACH SACO, MAINE SECTION 111 SHORE DAMAGE MITIGATION PROJECT APPENDIX F ECONOMIC ASSESSMENT Department of the Army New England District, Corps of Engineers 696 Virginia Road
RESEARCH Massachusetts Recreational Boater Survey. Project Summary
 Coastal and Marine Spatial Planning RESEARCH Project Summary 2010 Massachusetts Recreational Boater Survey The 2010 Massachusetts Recreational Boater Survey gathered spatial and economic data relating
The Economic Gains from Reallocating Specific Saltwater Fisheries
 The Economic Gains from Reallocating Specific Saltwater Fisheries Produced for the: American Sportfishing Association By: Southwick Associates May 12, 2015 Executive Summary Allocation arrangements between
BLACK SEA BASS NORTH OF CAPE HATTERAS DEALER PERMIT ISSUE PAPER. June 12, 2008 (REVISED) (NOTE: proposed rule under construction, eff.
 (NOTE: proposed rule under construction, eff.") BLACK SEA BASS NORTH OF CAPE HATTERAS DEALER PERMIT ISSUE PAPER June 12, 2008 (REVISED) (NOTE: proposed rule under construction, eff. July 1, 2008) I. ISSUE The requirement for licensed dealers to have
BLACK SEA BASS NORTH OF CAPE HATTERAS DEALER PERMIT ISSUE PAPER June 12, 2008 (REVISED) (NOTE: proposed rule under construction, eff. July 1, 2008) I. ISSUE The requirement for licensed dealers to have
Coastal Harbors and Waterways, NC (Shallow Draft Navigation) (O&M)
 (O&M)") Coastal Harbors and Waterways, NC (Shallow Draft Navigation) (O&M) Shallow draft coastal harbors include a subsistence harbor at Silver Lake CONGRESSIONAL DISTRICT: NC 3 and 7 DATE: 23 February 2015 1.
Coastal Harbors and Waterways, NC (Shallow Draft Navigation) (O&M) Shallow draft coastal harbors include a subsistence harbor at Silver Lake CONGRESSIONAL DISTRICT: NC 3 and 7 DATE: 23 February 2015 1.
The 2006 Economic Benefits of Hunting, Fishing and Wildlife Watching in TEXAS. Prepared by:
 The 2006 Economic Benefits of Hunting, Fishing and Wildlife Watching in TEXAS Prepared by: Southwick Associates, Inc. P.O. Box 6435 Fernandina Beach, FL 32035 Ph (904) 277-9765 Fax (904) 261-1145 Email:
. OREGON COMMERCIAL DUNGENESS CRAB FISHERY
 . OREGON COMMERCIAL DUNGENESS CRAB FISHERY 1999-00 FISHING SEASON REVIEW and ISSUES UPDATE Presented to OREGON DUNGENESS CRAB COMMISSION at Newport, Oregon September 1, 2000 By Rod Kaiser John Schaefer
Public Hearing Summary for Coastal Migratory Pelagics Framework Amendment 4
 for Coastal Migratory Pelagics Framework Amendment 4 (Management Measures for ) (revised) July 15, 2016 A publication of the South Atlantic Fishery Management Council pursuant to National Oceanic and Atmospheric
Economic Impact of Hunting Expenditures on Southern U.S
 Economic Impact of Hunting Expenditures on Southern U.S Jagdish Poudel (Corresponding author) Graduate Research Assistant Forest and Wildlife Research Center College of Forest Resource Mississippi State
COOPERATIVE EXTENSION Bringing the University to You
 COOPERATIVE EXTENSION Bringing the University to You Special Publication - 06-16 ECONOMIC IMPACT OF TOURISM ON COLORADO RIVER COMMUNITIES INCLUDING: LAUGHLIN BULLHEAD CITY FORT MOHAVE MOHAVE VALLEY GOLDEN
Phase II Florida s Ocean and Coastal Economies Report
 Center for the Blue Economy Digital Commons @ Center for the Blue Economy Publications National Ocean Economics Program Summer 6-15-2008 Phase II Florida s Ocean and Coastal Economies Report Judith T.
Nevada County Population Projections 2013 to 2032 Based On The Last Estimate Year of 2012
 Nevada County Population Projections 2013 to 2032 Based On The Last Estimate Year of 2012 Prepared By: The Nevada State Demographer s Office Jeff Hardcastle, AICP NV State Demographer University of NV
The 2001 Economic Benefits of Hunting, Fishing and Wildlife Watching in MISSOURI. Prepared by:
 The 2001 Economic Benefits of Hunting, Fishing and Wildlife Watching in MISSOURI Prepared by: Southwick Associates, Inc. PO Box 6435 Fernandina Beach, FL 32035 Ph (904) 277-9765 Fax (904) 261-1145 Email:
DIRECT EMPLOYMENT IMPACTS OF COMMERCIAL FISHING IN COASTAL MISSISSIPPI COUNTIES,
 Introduction DIRECT EMPLOYMENT IMPACTS OF COMMERCIAL FISHING IN COASTAL MISSISSIPPI COUNTIES, 2001-2013 Benedict C. Posadas Mississippi State University Coastal Research and Extension Center Mississippi-Alabama
The Transformation Status of Marine Commercial Fisheries. and Marine Aquaculture in South Africa
 The Transformation Status of Marine Commercial Fisheries and Marine Aquaculture in South Africa Introduction Fishing rights have always been a contentious issue. In Offshore fisheries such as the demersal
South King County High-Capacity Transit Corridor Study
 HIGH-CAPACITY TRANSIT CORRIDOR STUDY South King County Corridor South King County High-Capacity Transit Corridor Study Corridor Report August 2014 South King County High Capacity Transit Corridor Report
Cost-Earnings Data Collection for the Hawaii Small Boat Fishery
 Cost-Earnings Data Collection for the Hawaii Small Boat Fishery Dr. Hing Ling (Michel) Chan JIMAR, University of Hawaii Dr. Minling Pan Pacific Islands Fisheries Science Center Mar 29, 2017 2017 NAAFE
Final Report, October 19, Socioeconomic characteristics of reef users
 Socioeconomic Study of Reefs in Southeast Florida - Executive Summary By Hazen and Sawyer in association with Florida State University and National Oceanic and Atmospheric Administration, October 19, 2001
ECONOMIC DEVELOPMENT ELEMENT
 ECONOMIC DEVELOPMENT ELEMENT Background The Economic Development Element considers labor force and labor force characteristics, employment by place of work and residence, and analysis of the community
Sheepshead Fishery Overview South Atlantic State/Federal Management Board May 2014 Introduction Life History Landings
 Sheepshead Fishery Overview South Atlantic State/Federal Management Board May 2014 Introduction The Atlantic States Marine Fisheries Commission (ASMFC) does not currently manage sheepshead (Archosargus
Student Population Projections By Residence. School Year 2016/2017 Report Projections 2017/ /27. Prepared by:
 Student Population Projections By Residence School Year 2016/2017 Report Projections 2017/18 2026/27 Prepared by: Revised October 31, 2016 Los Gatos Union School District TABLE OF CONTENTS Introduction
National Oceanic and Atmospheric Administration. Fisheries of the Caribbean, Gulf of Mexico, and South
 This document is scheduled to be published in the Federal Register on 07/13/2016 and available online at http://federalregister.gov/a/2016-16510, and on FDsys.gov Billing Code: 3510-22-P DEPARTMENT OF
THE I-79 CORRIDOR. I-79 provides motorists with connections to the following major highways: I-80, PA 358, PA 965 and PA 208.
 The I-79 Corridor Pittsburgh to Erie Regional Thruway I-79 was constructed through Mercer County in the early 1960s. The portion north of PA 965 opened in 1961 and the segment south of PA 965 the following
Recreational Saltwater Fishing Industry Trends and Economic Impact January 2007
 Document was created exclusively for RISAA and the information contained herein is not to be disclosed without their expressed permission Recreational Saltwater Fishing Industry Trends and Economic Impact
2005 NORTH CAROLINA SALTWATER FISHING TOURNAMENTS
 2005 NORTH CAROLINA SALTWATER FISHING TOURNAMENTS March 1, 2005 DATES TOURNAMENTS WEIGH-IN LOCATION FOR MORE INFORMATION: January 1 - December 31 NC Saltwater Fishing Official Weigh Stations NC DMF PO
PFRP Principal Investigators Workshop From Foodwebs to Ecosystem Models
 Descriptive Assessment of Small-Scale and Traditional Fisheries in the Western Pacific Introduction to a New PFRP Socio-cultural Research Project Prepared for the PFRP Principal Investigators Workshop
The 2006 Economic Benefits of Hunting, Fishing and Wildlife Watching in NORTH CAROLINA. Prepared by:
 The 2006 Economic Benefits of Hunting, Fishing and Wildlife Watching in NORTH CAROLINA Prepared by: Southwick Associates, Inc. P.O. Box 6435 Fernandina Beach, FL 32035 Ph (904) 277-9765 Fax (904) 261-1145
Sport Fishing Expenditures and Economic Impacts on Public Lands in Oregon
 Sport Fishing Expenditures and Economic Impacts on Public Lands in Oregon For: Northwest Sportfishing Industry Association By: Southwick Associates October 2013 PO Box 6435 Fernandina Beach, FL32035 Tel
The Operations and Economics of the For-Hire Fishing Fleets of the South Atlantic States and the Atlantic Coast of Florida
 The Operations and Economics of the For-Hire Fishing Fleets of the South Atlantic States and the Atlantic Coast of Florida Stephen M. Holland, Ph.D. Department of Tourism, Recreation & Sport Management
Report to the Monterey County Office of Economic Development. Caroline Pomeroy, Ph.D. 1. and. Michael Dalton, Ph.D. 2. June 2003
 SOCIO-ECONOMICS OF THE MOSS LANDING COMMERCIAL FISHING INDUSTRY Report to the Monterey County Office of Economic Development Caroline Pomeroy, Ph.D. 1 and Michael Dalton, Ph.D. 2 June 2003 1 Institute
Walkable Retail: When Old Becomes New Again Part 1
 Walkable Retail: When Old Becomes New Again Part 1 By Erin Talkington, Vice President, and Jacob Ross, Associate You have probably read the following headline thousands of times, perhaps this year alone:
A Comparison of Highway Construction Costs in the Midwest and Nationally
 A Comparison of Highway Construction Costs in the Midwest and Nationally March 20, 2018 Mary Craighead, AICP 1 INTRODUCTION State Departments of Transportation play a significant role in the construction
Economic Impact Analysis BOONE DOCKS RESORT AND MARINA, LLC
 Economic Impact Analysis BOONE DOCKS RESORT AND MARINA, LLC Analysis conducted using the on-line Boating Economic Impact Model developed by Drs. Ed Mahoney (mahoneye@msu.edu), Dan Stynes (stynes@msu.edu)
National Oceanic and Atmospheric Administration. Fisheries of the Caribbean, Gulf of Mexico, and South Atlantic;
 This document is scheduled to be published in the Federal Register on 02/05/2019 and available online at https://federalregister.gov/d/2019-01117, and on govinfo.gov BILLING CODE 3510-22-P DEPARTMENT OF
Characteristics of the Labor Force - Poteau Area
 Not Not Number of respondents 275 42 614 71 543 391 55 Estimated Adults 21,257 2,956 47,302 5,554 41,747 29,188 3,881 Males 54.5 30.2 54.1 51.6 54.4 38.8 29.4 Females 45.5 69.8 45.9 48.4 45.6 61.2 70.6
The Power of Outdoor Recreation Spending in Pennsylvania:
 The Power of Outdoor Recreation Spending in Pennsylvania: How hunting, fishing, and outdoor activities help support a healthy state economy November, 2018 Prepared for the Theodore Roosevelt Conservation
Implan Modeling for Fisheries on Florida s East Coast: Alternative Approaches
 Implan Modeling for Fisheries on Florida s East Coast: Alternative Approaches Tom Stevens, David Mulkey, and Alan W. Hodges Food & Resource Economics Dept. Institute of Food and Agricultural Sciences University
Coastal Harbors and Waterways, NC (Shallow Draft Navigation) (O&M)
 (O&M)") Coastal Harbors and Waterways, NC (Shallow Draft Navigation) (O&M) Shallow draft coastal harbors include a subsistence harbor at Silver Lake CONGRESSIONAL DISTRICT: NC 3 and 7 DATE: 23 February 2015 1.
Coastal Harbors and Waterways, NC (Shallow Draft Navigation) (O&M) Shallow draft coastal harbors include a subsistence harbor at Silver Lake CONGRESSIONAL DISTRICT: NC 3 and 7 DATE: 23 February 2015 1.
Commercial Red Grouper Fishing in the Gulf of Mexico States
 Commercial Red Grouper Fishing in the Gulf of Mexico States According to NOAA Fisheries (https://www.fisheries.noaa.gov/species/red-grouper), the red grouper (Epinephelus morio) fishery in the Gulf of
Seafood Industry. The 2012 Juneau and Southeast Alaska Economic Indicators 11/1/12 Page 60
 Seafood Industry In 2011, fishermen in Southeast landed 395,628,268 pounds of fish with an ex vessel value of $391,091,684. This harvest resulted in 272.6 million pounds of product, with a wholesale value
1. A Report to the Attorney General of the State of Alaska I TO THE EXXON VALDEZ OIL SPILL. December 18, 1992 OF RECREATIONAL FISHING LOSSES RELATED
 A PRELIMINARY ECONOMIC ANALYSIS OF RECREATIONAL FISHING LOSSES RELATED TO THE EXXON VALDEZ OIL SPILL Richard T. Carson W. Michael Hanemann December 18, 1992 1. A Report to the Attorney General of the State
Labour Market Segmentation in Poland. Artur Gajdos Department of Spatial Econometrics University of Lodz
 Labour Market Segmentation in Poland Artur Gajdos Department of Spatial Econometrics University of Lodz gajdos@uni.lodz.pl Lisbon, 24 November 2016 Agenda Introduction Labour market facts Policy reforms
Sport Fishing Expenditures and Economic Impacts on Public Lands in Washington
 Sport Fishing Expenditures and Economic Impacts on Public Lands in Washington For: Northwest Sportfishing Industry Association By: Southwick Associates Released June 2015 PO Box 6435 Fernandina Beach,
Oakmont: Who are we?
 Oakmont: Who are we? A Snapshot of our community from the April 2010 US Census Contents Age and Gender... 1 Marital Status... 2 Home Ownership and Tenure... 3 Past Demographic Characteristics... 5 Income
Standardized catch rates of U.S. blueline tilefish (Caulolatilus microps) from commercial logbook longline data
 from commercial logbook longline data") Standardized catch rates of U.S. blueline tilefish (Caulolatilus microps) from commercial logbook longline data Sustainable Fisheries Branch, National Marine Fisheries Service, Southeast Fisheries Science
Standardized catch rates of U.S. blueline tilefish (Caulolatilus microps) from commercial logbook longline data Sustainable Fisheries Branch, National Marine Fisheries Service, Southeast Fisheries Science
Guidelines for Providing Access to Public Transportation Stations APPENDIX C TRANSIT STATION ACCESS PLANNING TOOL INSTRUCTIONS
 APPENDIX C TRANSIT STATION ACCESS PLANNING TOOL INSTRUCTIONS Transit Station Access Planning Tool Instructions Page C-1 Revised Final Report September 2011 TRANSIT STATION ACCESS PLANNING TOOL INSTRUCTIONS
Summary Report of the North Carolina Division of Marine Fisheries Cobia (Rachycentron canadum) Acoustic Tagging. Stephen J. Poland SEDAR58-SID-06
 Acoustic Tagging. Stephen J. Poland SEDAR58-SID-06") Summary Report of the North Carolina Division of Marine Fisheries Cobia (Rachycentron canadum) Acoustic Tagging Stephen J. Poland SEDAR58-SID-06 Submitted: 29 March 2018 This information is distributed
Summary Report of the North Carolina Division of Marine Fisheries Cobia (Rachycentron canadum) Acoustic Tagging Stephen J. Poland SEDAR58-SID-06 Submitted: 29 March 2018 This information is distributed
Addressing Overcapacity in the Small-Scale Marine Fisheries of Vietnam. Robert Pomeroy Principal Scientist WorldFish Center Penang, Malaysia
 Addressing Overcapacity in the Small-Scale Marine Fisheries of Vietnam Robert Pomeroy Principal Scientist WorldFish Center Penang, Malaysia Presentation Overview Government policy towards the small-scale
For each benefit category listed above, several measures of economic benefits were calculated:
 EXECUTIVE SUMMARY The objective of this study was to examine the economic benefits of Oregon Inlet navigability to Dare County, North Carolina and the surrounding region, including northeastern North Carolina
The Nevada 1st Congressional District
 The Nevada st Area (square miles) Navigable Waterbody (square miles) Population (007) Population Density (per square mile) (007) Persons 8+ (007) Households (007) Table. Owned by Residents Residing in
Florida Keys National Marine Sanctuary
 Florida Keys National Marine Sanctuary Review of the Marine Zones and Regulations [insert your name here] [insert your email here] Florida Keys National Marine Sanctuary 2900 nm 2 / 10,000 km 2 Jurisdiction
Prepared by: McDowell Group, Inc. Andy Wink CAP Meeting
 Prepared by: McDowell Group, Inc. Andy Wink CAP Meeting 7.28.15 Alaska Seafood Overview Fishery & Market Update Key Issues Ketchikan Seafood Industry Who and What is Alaska Seafood? About 60,000 fishermen,
Regulatory Amendment 16 to the Fishery Management Plan for the Snapper Grouper Fishery of the South Atlantic Region SUMMARY DOCUMENT
 Regulatory Amendment 16 to the Fishery Management Plan for the Snapper Grouper Fishery of the South Atlantic Region SUMMARY DOCUMENT March 2015 Background In 2013, a stock assessment concluded that the
SOUTH ATLANTIC FISHERY MANAGEMENT COUNCIL
 1 SOUTH ATLANTIC FISHERY MANAGEMENT COUNCIL ONE SOUTHPARK CIRCLE, SUITE 306 CHARLESTON, SOUTH CAROLINA 29407-4699 TEL 843/571-4366 or FAX 843/769-4520 Toll Free 1-866/SAFMC-10 E-mail: safmc@safmc.net Web
Evaluating the Influence of R3 Treatments on Fishing License Sales in Pennsylvania
 Evaluating the Influence of R3 Treatments on Fishing License Sales in Pennsylvania Prepared for the: Pennsylvania Fish and Boat Commission Produced by: PO Box 6435 Fernandina Beach, FL 32035 Tel (904)
Preliminary Draft of. SEDAR 17 Data Workshop Vermilion Snapper Report. Commercial Fishery (Section 3)
") SEDAR 17-DW-05 Preliminary Draft of SEDAR 17 Data Workshop Vermilion Snapper Report Commercial Fishery (Section 3) Prepared by: Douglas Vaughan Sustainable Fisheries Branch Southeast Fisheries Science
SEDAR 17-DW-05 Preliminary Draft of SEDAR 17 Data Workshop Vermilion Snapper Report Commercial Fishery (Section 3) Prepared by: Douglas Vaughan Sustainable Fisheries Branch Southeast Fisheries Science
Atlantic States Marine Fisheries Commission
 Atlantic States Marine Fisheries Commission 1050 N. Highland Street Suite 200A-N Arlington, VA 22201 703.842.0740 703.842.0741 (fax) www.asmfc.org MEMORANDUM May 15, 2013 To: Atlantic Menhaden Management
Updated landings information for the commercial fisheries in Puerto Rico with emphasis on silk and queen snapper and parrotfish fisheries
 Updated landings information for the commercial fisheries in Puerto Rico with emphasis on silk and queen snapper and parrotfish fisheries Nancie J. Cummings and Daniel Matos-Caraballo SEDAR 26-DW-03 Date
Webinar: The Association Between Light Rail Transit, Streetcars and Bus Rapid Transit on Jobs, People and Rents
 Portland State University PDXScholar TREC Webinar Series Transportation Research and Education Center (TREC) 11-15-2016 Webinar: The Association Between Light Rail Transit, Streetcars and Bus Rapid Transit
Fixed Guideway Transit Outcomes on Rents, Jobs, and People and Housing
 Fixed Guideway Transit Outcomes on Rents, Jobs, and People and Housing Arthur C. Nelson, Ph.D., ASCE, FAICP Professor of Planning and Real Estate Development University of Arizona 1 Changing Transportation
From Reality to Concept to Reality Territorial Approaches in Rural Development
 From Reality to Concept to Reality Territorial Approaches in Rural Development Julio A. Berdegué Bonn, Federal Ministry for Economic Cooperation and Development (BMZ) 28 April 2014 Spatially uneven development
The 2010 Economic Contribution of Tourism to the Meadowlands Liberty Region
 The 2010 Economic Contribution of Tourism to the Meadowlands Liberty Region Key Metrics & Evaluation 93 MAIN STREET :: ANNAPOLIS, MD 21401 WWW.VANTAGESTRATEGY.COM :: 202-449- 9708 1 Vantage Strategy ::.
Final Supplemental Environmental Impact Statement/Environmental Assessment
 Final Supplemental Environmental Impact Statement/Environmental Assessment FINAL SUPPLEMENTAL ENVIRONMENTAL IMPACT STATEMENT/ ENVIRONMENTAL ASSESSMENT This integrated document contains all elements of
Angling in Manitoba (2000)
") Angling in Manitoba (2000) TABLE OF CONTENTS Page Introduction 1 Angler Profile 2 Angling Effort 7 Catch and Harvest 10 Angling Expenditures 13 Bait Use 16 Nonresident Trip Characteristics 18 Angling in
Angling in Manitoba (2000) TABLE OF CONTENTS Page Introduction 1 Angler Profile 2 Angling Effort 7 Catch and Harvest 10 Angling Expenditures 13 Bait Use 16 Nonresident Trip Characteristics 18 Angling in