The Economic Value of Alaska s Seafood Industry
|
|
|
- Ethelbert Farmer
- 6 years ago
- Views:
Transcription


1 The Economic Value of Alaska s Seafood Industry Prepared for: Prepared by: September 20171

2 2 The Alaska Seafood Marketing Institute (ASMI) is a public-private partnership between the State of Alaska and the Alaska seafood industry established to foster economic development of Alaska s most valuable renewable natural resource. ASMI s mission is to increase the economic value of the Alaska seafood resource, benefitting thousands of Alaskans in communities across the state. ASMI activities include Alaska seafood branding campaigns, collaborative marketing programs, technical support, education, advocacy, and research. ASMI is funded by an industry-directed 0.5% marketing tax based on the exvessel value of Alaska seafood, USDA funding supporting American export industries, and matching funds from the State of Alaska. ASMI employs 19 full-time staff and a number of contractors to fulfill its mission. Table of Contents Introduction and Methods...3 Executive Summary...4 Seafood Industry Overview...6 Commercial Fishing Sector...7 Seafood Processing Sector...8 Fishery Management & Regulation...9 Economic Impacts of Alaska Seafood...10 Impacts by Species...11 Statewide Impacts & Economic Role...12 Arctic, Yukon, Kuskokwim...16 Bristol Bay...18 Bering Sea and Aleutian Islands...20 Kodiaki...22 Southcentral Alaska...24 Southeast Alaska...26 National Impacts...28 Alaska s Commercial Fishermen...27 Value of Alaska Seafood...30 Seafood & Alaska s Economic Future...32 Industry Tax Revenues...34 Lowering the Cost of Living in Alaska...35 Feeding the World...36 Industry Investment...37
3 Introduction This report updates and builds on prior studies published in 2013 and ASMI contracted with McDowell Group to update the economic impact of Alaska s commercial seafood industry. The analysis quantifies the regional, statewide, and national economic impacts of Alaska s seafood industry. This report summarizes overall industry participation, value, and exports. It also highlights the significant impact the industry has on tax revenues, investment and charitable giving by the industry, and the value of industry assets. As the brand manager for Alaska seafood, ASMI recognizes the need to inform the general public and consumers about the important economic benefits of the industry. Alaska s seafood industry covers vast areas of the state but is not always well represented in traditional employment data sources. Due to biological and environmental factors, harvest of wild seafood is inherently volatile. For example, total odd-year harvests of Alaska pink salmon can be double or triple even-years. In order to reduce this volatility, most figures have been averaged or otherwise combined from the two most recent years ( ) where appropriate. This report considers only the commercial seafood industry and does not address economic impacts stemming from recreational, charter, or subsistence uses of Alaska s seafood resources. Data Sources & Methods McDowell Group worked with the Alaska Fisheries Information Network (AKFIN), Alaska Department of Fish & Game, and Alaska Department of Labor & Workforce Development to compile customized data sets for this project. The assistance of these agencies was crucial in providing a wide array of primary data sets which McDowell Group used to model direct and secondary impacts. Customized economic models were developed using IMPLAN, industry interviews, and other public data sources. All photos are courtesy of ASMI, except where noted. Glossary Direct Impacts: The impacts occuring in the seafood industry itself, including commercial fishing, seafood processing, and direct support sectors. Direct Support Sectors: Critical support positions are counted as direct impacts in this analysis, such as fishery managers, hatchery workers, and safety personnel. Secondary Impacts: Additional economic impacts resulting from business and household spending related to the Alaska seafood industry (i.e. multiplier effects). FTE (full-time equivalent): Many seafood industry workers are employed in seasonal jobs or earn a year s worth of income in less than a year. FTE employment figures in this report represent an annualized estimate of jobs created in each study area, allowing comparison to other industries. Labor Income: Wages, salaries, bonuses, and benefit payments to seafood industry participants. Economic Output: The value added to Alaska s seafood in total, and at various stages of the production and supply chain. Ex-Vessel (EV) Value: The dollar amount received by fishermen for their catch when delivered to a processor. This includes both initial payments and any bonuses or year-end adjustments paid by processors. First Wholesale (FW) Value: The value of seafood products when sold to buyers outside a processor s affiliate network. This is the value of the raw fish delivered to the processor (ex-vessel value) plus the value added by the first processor. Worker Counts: The total number of people directly earning income in the industry. Processing worker counts reflect people who earned the majority of their earnings as processing workers, while commercial fishing worker counts include all adult participants. 3
 jobs in Alaska during 2015/2016, and a total of 36,800 FTE jobs in Alaska including multipliers, or about 8 percent of total")

4 Executive Summary The Seafood Industry: A Cornerstone of Alaska s Economy Approximately 56,800 workers are directly employed by Alaska s seafood industry, including 26,500 Alaska residents. Seafood directly created an estimated 26,800 full-time equivalent (FTE) jobs in Alaska during 2015/2016, and a total of 36,800 FTE jobs in Alaska including multipliers, or about 8 percent of total statewide employment. Alaska fisheries employed an average of 29,200 commercial fishermen in 2015/2016, including 16,500 Alaska residents. Alaska s commercial fleet includes approximately 9,400 vessels, which would span just over 70 miles if lined up from bow to stern. Lower resource value has contributed to a downward trend in fishing employment since Total FTE Jobs by Region BSAI 10,400 Southeast 8,200 Southcentral 6,700 Kodiak 5,900 4,400 Bristol Bay 900 Arctic-Yukon-Kuskokwim Alaska s 2016 seafood harvest of 5.6 billion pounds had a total ex-vessel value of $1.7 billion. Processors produced 2.7 billion pounds of Alaska seafood products in 2016, worth a first wholesale value of $4.2 billion. The processing sector employed an average of 24,500 workers in 2015/2016, including an estimated 7,200 Alaska residents. The industry includes 169 shore-based plants, 73 catcher-processors, and more than a dozen floating processors in Seafood Industry Impact on Alaska s Economy, 2015/2016 Avg. Direct Impacts Number of Labor Income ($Millions) Total Impacts Commercial Fishing 29,200 $824 Processing 24,500 $467 Management/ Hatcheries/Others 3,200 $228 Total 56,800 $1,518 FTE (Full-Time Equivalent) Jobs Labor Income Economic Output 36,800 $2.0 Billion $5.2 Billion 4 Note: Figures may not sum due to rounding.


5 The Significant National Economic Impact of Alaska s Seafood Industry Nationally, the Alaska seafood industry creates an estimated 99,000 FTE jobs, $5.2 billion in annual labor income, $12.8 billion in economic output. The national economic impacts of Alaska s seafood industry includes $5.4 billion in direct output associated with fishing, processing, distribution, and retail. It also includes $7.3 billion in multiplier effects generated as industry income circulates throughout the U.S. economy. The Alaska seafood industry employed a total of 29,600 residents from other U.S. states who came north to work in Alaska during Alaska exports more than one million metric tons of seafood each year, bringing over $3 billion of new money into the U.S. economy. Feeding the World and Alaska s Economy with Sustainable Fisheries Alaska s abundant commercial fisheries have produced over 169 billion pounds since statehood in The largest harvest ever occurred in 2015 (6.1 billion pounds). A commitment to sustainable management has allowed the state s fisheries to produce large, diversified harvests for many decades. The scale of Alaska s commercial fisheries are truly extraordinary. The industry catches and processes enough seafood each year to feed everybody in the world at least one serving of Alaska seafood, or one serving for every American for more than a month (12.9 billion servings in 2015). Alaska seafood was sold in 105 countries around the world in Export markets typically account for approximately two-thirds of sales value, while the U.S. market buys the remaining one-third. Seafood directly employs more workers than any other industry in Alaska, and is the second-largest overall job creator in the state next to the oil/gas industry (including multiplier effects). Seafood is the economic foundation of many rural communities. Over 21,200 rural Alaska residents were direclty employed by the industry in 2015, accounting for 15% of all rural working age adults. 5

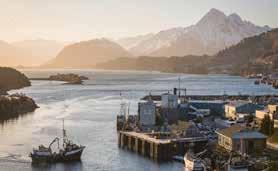
6 6 Seafood Industry Overview
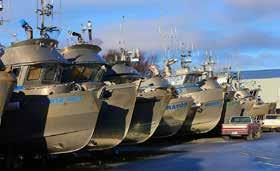
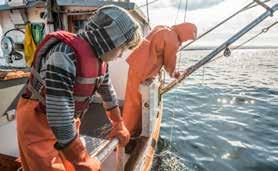
7 Commercial Fishing Sector Alaska has the most prolific commercial fishing industry in the United States, producing more harvest volume than all other states combined. Commercial fishing in Alaska creates substantial benefits for Alaska s economy and provides consumers around the world with a wild, sustainable product. Alaska s commercial fishing industry is very diverse. Crews range from one or two fishermen working from skiffs and small boats to large catcher-processors in excess of 300 feet with 100 workers or more. Fishermen involvement in the industry also spans a wide spectrum. Many skippers and crew participate in multiple fisheries as a full-time career, while others fish to supplement income from other jobs, earn money during a summer school break, or work as crew members for friends and family to be part of a uniquely Alaskan cultural tradition. Regardless of vessel size or involvement, each fishing operation represents a business generating new income from a renewable resource. These businesses spend money throughout the economy, and provide the raw materials on which the rest of the seafood economy is based. Key Figures 2016 Skippers & Crew 27,738 Skippers 9,125 Crew 18,613 Alaska Residents 15,592 Fishing & Related Vessels 9,423 Total Length of All Vessels 70.6 mi. Ex-Vessel Value ($Millions)* $1,671 Percent to AK Residents* 38% Harvest Volume (Millions lbs.)* 5,643 *Figures are preliminary Figures Count Avg. $EV Total $EV Skiffs & Small Craft ,049 $18,500 $56 M 2,688 $61,800 $166 M 1,965 $91,850 $180 M 668 $407,200 $272 M 142 $1,130,000 $160 M 188 $3,230,000 $607 M 22 $14,620,000 $322 M Note: Vessel figures by size only include those which made landings in 2015, and therefore do not include other support or processing vessels. Skiffs and small craft may be understated in the data above, as setnet boats are not required to be registered with the State and vessel identification numbers are not always recorded on setnet fish tickets. 7
8 Seafood Processing Sector Seafood processing is the largest manufacturing sector in Alaska, accounting for 72% of the state s manufacturing employment. Nearly all of Alaska s seafood products go through the hands of seafood processors, which add value by turning raw fish and shellfish into a myriad of products for markets around the world. The seasonality of many Alaska fisheries, especially salmon, result in a reliance on nonresident workers to fully staff production jobs at remote sites across the state. Though nonresidents comprise approximately 70% of the workforce, residents earn a higher share of the sector s income as they are more likely to be employed in management and maintenance positions and work in areas with longer operating seasons. Approximately 1-in-10 resident workers earned over $50,000 in The sector includes 169 shore-based plants, 73 catcher-processors, and more than a dozen floating processors. First Wholesale Value by Product Type, 2015/2016 Workforce 2016 Peak Monthly Employment 20,224 Avg. Monthly Employment 9,750 in Alaska (2015) 24,863 Alaska Resident Estimate 7,409 Total Workforce Earnings $438 Million Alaska Resident Estimate $154 Million Value Added 2016 Ex-Vessel Value $1,671 Million First Wholesale Value $4,186 Million Value Added by Processors $2,515 Million H/G & Wholefish 39% Surimi 12% Crab 9% Meal & Oil 4% FW Value by Type 2016 Shoreside Plants $2,577 Million 8 Fillets 21% First Wholesale Value by Species, 2015/2016 Canned 6% Roe 7% Other 3% Catcher-Processors Floating Processors $1,289 Million $323 Million 33% 33% 11% 5% 9% 8% 1% Pollock Salmon Cod Halibut & Black Cod Crab A80 Species* Other *Includes flatfish (sole/flounder), rockfish, and Atka Mackerel.

 and the National Marine Fisheries Service (NMFS), a division of NOAA.")
9 Commercial Fisheries Management Alaska s fisheries are known worldwide as a model for sustainable management. The efforts of the region s biologists, managers, and policy makers ensure healthy stocks and productive fisheries for Alaska s harvesters and the businesses that rely on their catches. A key aspect of Alaska s successful model is the separation of entities that set policy (Alaska Board of Fisheries and North Pacific Fishery Management Council) and those that enforce and study allocations and harvest limits. Alaska s commercial fisheries are managed by the Alaska Department of Fish and Game (ADF&G) and the National Marine Fisheries Service (NMFS), a division of NOAA. With some exceptions, fisheries managed by ADF&G occur within three miles of Alaska s coast while NMFS manages offshore fisheries. Both agencies work in coordination to conserve and develop Alaska s fishery resources. Some Alaska fisheries have an international component. Pacific halibut fisheries are jointly managed with Canada via the International Pacific Halibut Commission. Transboundary salmon harvests in Southeast Alaska and the Yukon River are subject to the Pacific Salmon Treaty. The State of Alaska has several agencies that further support the seafood industry in Alaska: The Commercial Fisheries Entry Commission implements Alaska s limited entry law by issuing the fishing permits for state fisheries whereas NMFS issues permits for the federal fisheries. The Department of Environmental Conservation issues discharge permits for seafood processing facilities. The Department of Commerce, Community, and Economic Development is charged with promoting economic development in Alaska, including the seafood industry. The Alaska Seafood Marketing Institute is a publicprivate partnership between the state and the seafood industry with the mission to increase the economic value of Alaska seafood. The State also provides training opportunities and extension services through the University of Alaska system, Alaska Sea Grant, and Alaska s Institute of Technology (AVTEC). 9


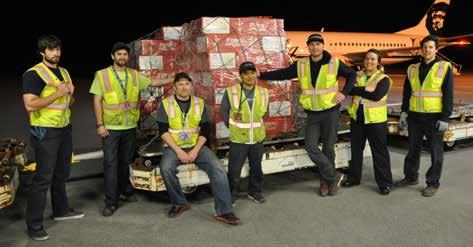
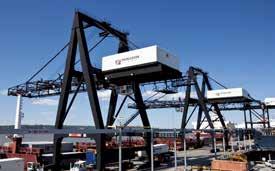
10 Economic Impacts of Alaska Seafood 10 Photo credits: NMFS (top-left), Vigor Alaska (bottom-left), & Alaska Airlines (bottom-right).
11 Salmon Direct Total FTE Jobs 16,400 Labor Income $M $735 Value Added $M $1,803 Secondary Total FTE Jobs 16,600 Labor Income $M $977 Value Added $M $2,422 Total Contribution FTE Jobs 32,900 Labor Income $M $1,712 Value Added $M $4,225 Halibut & Black Cod Direct Total FTE Jobs 3,800 Labor Income $M $157 Value Added $M $381 Secondary Total FTE Jobs 3,500 Labor Income $M $206 Value Added $M $512 Total Contribution FTE Jobs 7,300 Labor Income $M $363 Value Added $M $893 Crab Direct Total FTE Jobs 5,900 Labor Income $M $244 Value Added $M $591 Secondary Total FTE Jobs 5,400 Labor Income $M $320 Value Added $M $795 Total Contribution FTE Jobs 11,300 Labor Income $M $564 Value Added $M $1,386 Economic Impacts By Species Estimated Contributions to the National Economy ( Averages) Salmon is still king in Alaska. By all measures, salmon are responsible for the greatest economic impact (jobs, income, and total value) among all species in the Alaska seafood industry. Salmon s total contribution to the national economy included approximately 32,900 FTE jobs and $1.7 billion in annual labor income in 2015/2016. Alaska Pollock Direct Total FTE Jobs 13,800 Labor Income $M $655 Value Added $M $1,616 Secondary Total FTE Jobs 14,900 Labor Income $M $875 Value Added $M $2,171 Total Contribution FTE Jobs 28,700 Labor Income $M $1,530 Value Added $M $3,787 Pacific Cod Direct Total FTE Jobs 5,700 Labor Income $M $256 Value Added $M $627 Secondary Total FTE Jobs 5,800 Labor Income $M $340 Value Added $M $843 Total Contribution FTE Jobs 10,900 Labor Income $M $580 Value Added $M $1,470 Other Groundfish Direct Total FTE Jobs 2,700 Labor Income $M $136 Value Added $M $339 Secondary Total FTE Jobs 3,100 Labor Income $M $184 Value Added $M $456 Total Contribution FTE Jobs 5,800 Labor Income $M $320 Value Added $M $796 As the largest single species U.S. fishery, by volume, Alaska pollock is a close second. Much of pollock s value is added through processing, which occurs both shoreside and at-sea. Pollock s national economic impact includes an estimated 28,700 FTE jobs and $1.5 billion in labor income. Halibut, black cod, and crab are highvalue species. Despite only accounting for 2 percent of harvest volume, these three species account for 19 percent of the labor income and economic output (including multiplier effects) produced by the Alaska seafood industry. 11
12 Alaska Statewide Impacts 12 Seafood Industry Impact on Alaska s Economy, 2015/2016 Avg. Number of FTE Jobs Labor Income ($Millions) Output ($Millions) Commercial Fishing 29,200 13,700 $824 $1,738 Processing 24,500 10,800 $467 $2,446 Mgmt./Other 3,200 2,300 $228 - Direct Total 56,900 26,800 $1,518 $4,184 Secondary Total - 10,000 $441 $979 Total Impacts - 36,800 $1,959 $5,163 In total, seafood contributed 31,900 FTE jobs and $1.8 billion of labor income annually to the state s economy during 2015 and It is estimated that the commercial seafood industry accounted for 7.2 percent of statewide employment during this period. The seafood industry directly employs nearly 60,000 workers in Alaska each year. Through business and household spending, it is estimated the industry created an additional 8,800 jobs and $385 million of secondary labor income, on average, in 2015 and Seafood contributed an annual average of $5.0 billion in economic output to the Alaska economy in 2015 and The seafood industry directly employs more workers than any other private sector industry. Including multiplier effects, it is the thirdlargest basic sector job creator in Alaska after the oil-and-gas and visitor industries. The seafood industry directly employed an estimated 26,000 Alaska residents per year in 2015/2016. The economic benefits of the seafood industry are broadly distributed across Alaska, from Kotzebue to Ketchikan. Top Ports: by First Wholesale Value* 1) Dutch Harbor $474 Million 2) Naknek $292 Million 3) Kodiak $262 Million 4) Cordova $134 Million 5) Sitka $121 Million *2015/2016 Avg. Total Jobs & Income Created by Basic Sector Industries in Alaska Oil & Gas Seafood Pie chart or graphic of jobs by basic sector 103,900 jobs $6.0 Billion Visitor 39,700 jobs $1.4 Billion 36,800 jobs $2.0 Billion Mining 8,600 jobs $675 Million Basic sectors bring new income into the economy. The industries above drive Alaska s economy, collectively accounting for approximately 40% of total employment in Alaska. Note: Figures shown above include multiplier effects. Source: McDowell Group economic impact studies ( ).

13 Harvesting 2016 Figures Processing 6,548 Resident Owned Fishing Vessels 15,592 Resident Fishermen 169 Shore-based Processing Facilities 24,863 Processing (2015) Bristol Bay setnetters Ryan Hanley, Neil Gotschall, and Lauren Stanford. Photo credit: Neil Gotschall. $1,671Million Harvest Value 5,643 Million Pounds of Seafood Harvested $4,186Million Wholesale Value 2,667 Million Pounds of Seafood Produced Economic Trends in Seafood Industry Resident Commercial Fishermen 17,147 17,682 17,817 17,809 17,701 17,339 15,486 Gross Earnings ($Millions)** $721 $876 $806 $834 $741 $677 $632 Average Processing Employment* 9,162 10,130 10,198 10,477 10,596 10,147 9,750 Peak Processing Employment* 18,871 20,328 19,472 20,367 20,788 20,534 20,224 Wages/Salaries ($Millions)* $316 $349 $364 $392 $399 $439 $437 Harvest Value ($Millions)** $1,713 $2,186 $2,147 $2,050 $1,957 $1,805 $1,671 First Wholesale Value ($Millions)** $3,856 $4,609 $4,508 $4,559 $4,304 $4,277 $4,186 *Figures may not include processing activity from catcher/processor vessels. **2016 is preliminary. 13

14 Value & Volume of Key Species, 2015/2016 Avg. Pollock Salmon Crab Cod $448 EV Value $Millions 3.31 Harvest #Billions $1.41 FW Value $Billions $0.43 FW Value per Round lb. $418 EV Value $Millions 792 Harvest #Millions $1.36 FW Value $Billions $1.72 FW Value per Round lb. $249 EV Value $Millions 83 Harvest #Millions $370 FW Value $Millions $4.46 FW Value per Round lb. $178 EV Value $Millions 702 Harvest #Millions $473 FW Value $Millions $0.67 FW Value per Round lb. 14 Halibut & Black Cod $204 EV Value $Millions 46 Harvest #Millions $231 FW Value $Millions $5.02 FW Value per Round lb. A80 Species (Flatfish, Rockfish, & Atka Mackerel) $131 EV Value $Millions 780 Harvest #Millions $328 FW Value $Millions $0.42 FW Value per Round lb. Percent of Ex-Vessel Value & Volume, 2015/2016 Species Pollock Salmon Crab Cod Halibut & Black Cod A80 Species Other Species Ex-Vessel Value & Volume by Fishery Region, 2015/2016 Value 27% 25% 15% 11% 12% 8% 2% Volume 57% 14% 1% 12% 1% 13% 2% 20% 17% 6% 35% 17% 1% Value Value Value Value Value Value 4% 4% 9% 77% 4% <1% Volume Volume Volume Volume Volume Volume Southeast Southcentral Kodiak BSAI Bristol Bay AYK
.")

15 Regional Employment Impacts Economic benefits created by the seafood industry are widely distributed across Alaska. The species to the left drive these benefits. High volume whitefish account for roughly 80% of Alaska s harvest volume and nearly half of the industry s ex-vessel value (the amount paid to fishermen by processors). Salmon and high-value species such as halibut, black cod, and crab account for less than 20% of the harvest volume, but comprise over half of the industry s ex-vessel value. Arctic-Yukon-Kuskokwim 3, Seafood Total FTE Jobs BSAI 13,500 10,400 Seafood Total FTE Jobs Bristol Bay 12,400 4,400 Seafood Total FTE Jobs Kodiak 6,400 5,900 Seafood Total FTE Jobs Southcentral 11,000 6,700 Seafood Total FTE Jobs Southeast 11,300 8,200 Seafood Total FTE Jobs Note: The number of seafood workers shown above represents the estimated number of direct seafood workers employed in each region on average during 2015/2016, while the total FTE jobs represents the number of full-time equivalent jobs supported by seafood in each region including multiplier effects. 15
 $7 $9 $5 $21 $14 $36 Key Ports: Output EligiblE CommuNiTiEs Emmonak Savoonga")
16 Arctic-Yukon-Kuskokwim Region Seafood Industry Impact on Regional Economy, 2015/2016 Avg. Number of Commercial Fishing 2,300 Processing 800 Mgmt./Other 100 Direct Total 3,300 Secondary Total Total Impacts - FTE Jobs Labor Income ($Millions) $7 $9 $5 $21 $14 $36 Key Ports: Output EligiblE CommuNiTiEs Emmonak Savoonga ($Millions) ENTiTiEs Nome Quinhagak $11 AND CDQ Unalakleet $10 Western Alaska Community Development Quota Program $20 $29 Norton Sound Economic $49 Development Corporation (NSEDC) Total annual seafood industry-related labor income in the AYK region is estimated at approximately $36 million and the total regional economic impact is measured at $49 million. Commercial fisheries are an important source of cash income in remote Western Alaska communities. Seasonal income from seafood supports subsistence lifestyles for many AYK families. Lower salmon prices have hit AYK especially hard. Commercial salmon fishing on the Kuskokwim river has been effectively closed for the past two years (2016/2017) due to lack of buyers, putting nearly 400 boats out of business. AYK has a unique collection of fisheries that reflect the resourcefulness of its residents. Virtually all salmon are caught with setnets or fishwheels, king crab pots in Norton Sound are hauled up through ice holes, and it is the only region in the state where lamprey are harvested. Yukon Delta Fisheries Development Association (YDFDA) Coastal Villages Region Fund (CVRF) Central Bering Sea Fisherman s Association (CBSFA) Bristol Bay Economic Development Corporation (BBEDC) Aleutian Pribilof Island Community Development Association (APICDA) AYK is home to three (of the six) CDQ entities. CDQ groups, which own several processing plants, shares of many vessels, and fund community development/assistance programs, are among the largest 2 Western alaska Community development Quota program private sector employers in the region. Map courtesy of the Western Alaska Community Development Association. 16 AYK Region includes: Bethel Census Area, Denali Borough, Fairbanks Northstar Borough, Kusilvak Census Area, Nome Census Area, North Slope Borough, Northwest Arctic Borough, Southeast Fairbanks Census Area, and Yukon-Koyukuk Census Area.
 7.2 Million Pounds of Seafood Produced 0.7% of Alaska Total 0.")
17 Harvesting 2016 Figures Processing 623 Resident-owned Fishing Vessels $12Million Harvest Value 2,240 Resident Fishermen 14.0 Million Pounds of Seafood Harvested 6 Shore-based Processing Facilities $22Million Wholesale Value 1,055 Shoreside Processing (2015) 7.2 Million Pounds of Seafood Produced 0.7% of Alaska Total 0.5% of Alaska Total AYK setnet fishermen display their catch (above). Salmon account for most of the region s ex-vessel value, but there are also fisheries for red king crab, halibut, Bering cisco, and lamprey. AYK Region CDQ Group Communities (Residents) Net Assets (2015) NSEDC 15 (9,300) $207 million YDFDA 6 (3,400) $87 million CVRF 20 (9,400) $257million Regional Economic Trends in Seafood Industry Resident Commercial Fishermen 3,274 3,351 3,406 3,526 3,364 3,177 2,240 Gross Earnings ($Millions)* $18 $21 $19 $18 $21 $16 $18 Average Processing Employment Peak Processing Employment ,089 1,203 1,132 1,138 1,097 Wages/Salaries ($Millions) $5.6 $4.6 $10.4 $10.9 $11.6 $21.7 $22.5 Regional Harvest Value ($Millions)* $10 $12 $11 $12 $13 $9 $12 First Wholesale Value ($Millions)* $18 $20 $19 $21 $21 $19 $22 *2016 data is preliminary. 17
 Output ($Millions) Commercial Fishing 8,000 2,300 $105 $159 Processing 4,200 1,200 $52 $316 Mgmt.")
18 Bristol Bay Region Seafood Industry Impact on Regional Economy, 2015/2016 Avg. Number of FTE Jobs Labor Income ($Millions) Output ($Millions) Commercial Fishing 8,000 2,300 $105 $159 Processing 4,200 1,200 $52 $316 Mgmt./Other $5 - Direct Total 12,400 3,500 $162 $475 Secondary Total $35 $71 Total Impacts - 4,400 $197 $547 Top Port: Naknek $292M* Other Key Ports: Dillingham Egegik $35M* Togiak Port Moller Ekuk *Avg. 2015/2016 FW Value. Commercial fisheries in the Bristol Bay region directly employ 12,400 people and generate $162 million in labor income. Bristol Bay is a unique region when it comes to seafood. While other regions rely on a diverse portfolio of species, virtually all of Bristol Bay s value comes from sockeye and production is generally limited to June-July. The region accounted for 44 percent of the world s sockeye harvest over the past 25 years. The 134-year old fishery produced its 2 billionth salmon in Over 1,440 Alaska residents own Bristol Bay commercial salmon fishing permits. Resident permit ownership is split almost evenly between regional residents and other Alaskans. 18 Crew of the F/V Maggie, a Bristol Bay gilnetter owned by Lyle Wilder of Port Alsworth, Alaska. Bristol Bay sockeye has successfully reinvented itself over the past couple decades. Historically, most fish was either canned or sold to Japan as a frozen H&G product. Now, the fishery s products and markets are much more diversified. Bristol Bay Region includes: Bristol Bay Borough, Dillingham Census Area, and Lake and Peninsula Borough (less Chignik area communities).
19 Share of Regional Ex-Vessel Value, 2015/2016 Harvesting 2016 Figures Processing 97% Sockeye Salmon 3% All Other Species 80% 70% 60% 50% Bristol Bay fishermen have invested millions of dollars to improve fish quality through on-board chilling systems. These investments create jobs for refrigeration equipment manufacturers, supply companies, installation technicians, and others. Percent of Bristol Bay Driftnet Fleet Chilling Fish, % 512 Resident-owned Fishing Vessels $191Million Harvest Value 1,576 Resident Fishermen 242 Million Pounds of Seafood Harvested 26 Shore-based Processing Facilities $525Million Wholesale Value 4,157 Shoreside Processing (2015) 180 Million Pounds of Seafood Produced 11% of Alaska Total 13% of Alaska Total 40% 30% 24% 20% Source: 2016 BBRSDA Processor Survey. Bristol Bay Salmon Fisheries Regional Economic Trends in Seafood Industry Gear Type* Harvest Value Permits Fished Driftnet $115 Million 1,542 Setnet $25 Million 872 * 2015/2016 Avg Resident Commercial Fishermen 1,506 1,598 1,654 1,609 1,663 1,607 1,576 Gross Earnings ($Millions)* $18 $28 $24 $26 $36 $20 $33 Average Processing Employment 1,401 1,535 1,514 1,514 1,542 1,095 1,263 Peak Processing Employment 5,257 5,460 5,037 5,312 5,374 4,309 5,116 Wages/Salaries ($Millions) $46 $53 $47 $51 $54 $49 $55 Regional Harvest Value ($Millions)* $171 $170 $151 $157 $224 $127 $191 First Wholesale Value ($Millions) $459 $404 $329 $359 $449 $426 $525 *2016 data is preliminary. 19
 Output ($Millions) Commercial Fishing 4,600 4,600 $441 $991 Processing 8,600 4,700 $227 $1,494 Mgmt.")
20 Bering Sea & Aleutian Islands Region Seafood Industry Impact on Regional Economy, 2015/2016 Avg. Number of FTE Jobs Labor Income ($Millions) Output ($Millions) Commercial Fishing 4,600 4,600 $441 $991 Processing 8,600 4,700 $227 $1,494 Mgmt./Other $21 - Direct Total 13,500 9,500 $689 $2,485 Secondary Total $36 $74 Total Impacts - 10,400 $725 $2,559 Top Port: Dutch Harbor $474M* Other Key Ports: Akutan King Cove St. Paul Island $74M* Sand Point False Pass Adak Atka *Avg. 2015/2016 FW Value. The BSAI region accounts for 59 percent of the industry s first wholesale value (2015/2016). BSAI commercial fisheries created 10,400 FTE jobs and $725 million of labor income in 2015/2016. The resident population in the BSAI region is approximately 8,500, far too small to catch, cut, and ship the region s vast seafood resources. As a result, most seafood workers come from the lower 48 or elsewhere in Alaska to work in the industry. Dutch Harbor is consistently the nation s top seafood port by volume, and second-largest in terms of ex-vessel value. In 2015, the port took in 787 million pounds of seafood - an average of 15.2 million pounds per week. Western Alaska residents also benefit from the Community Development Quota (CDQ) program, which allocates approximately 10 percent of groundfish and crab quotas to six regional entities. These groups collectively held nearly a billion dollars in net assets as of The C/P Starbound is one of 17 AFA Catcher Processors vessels operating in the Bering Sea. AFA CPs primarily target pollock and can have crews of 100 or more. The Starbound was lengthened 60 in 2015 to accommodate a fish meal plant and other upgrades. 20 BSAI Region includes: Aleutians East Borough and Aleutians West Census Area.
21 Share of Regional Ex-Vessel Value, 2015/2016* Harvesting 2016 Figures Processing 42% Pollock 16% Pacific Cod 6% Flatfish (Sole & Flounder) 4% All Salmon 23% King, Snow, & Tanner Crab 3% Halibut & Black Cod 3% Atka Mackerel & Other Species *Common property fisheries only. 240 Resident-owned Fishing Vessels $943Million Harvest Value 538 Resident Fishermen 4,523 Million Pounds of Seafood Harvested 21 Shore-based Processing Facilities $2,538Million Wholesale Value 6,411 1,994 Million Pounds of Seafood Produced 56% of Alaska Total 61% of Alaska Total Regional Shoreside vs. At-Sea Round Processed lbs. (Millions) FW Value ($Millions) Shoreside 658 $1,067 Shoreside Processing (2015) At-Sea 1,336 $1,471 Regional Economic Trends in Seafood Industry Resident Commercial Fishermen Gross Earnings ($Millions)** $40 $58 $45 $47 $42 $50 $47 Average Processing Employment* 3,360 3,698 3,606 3,712 3,834 3,813 3,949 Peak Processing Employment* 5,121 5,535 5,576 5,557 5,860 5,216 5,842 Wages/Salaries ($Millions)* $113 $128 $130 $137 $146 $171 $213 Regional Harvest Value ($Millions)** $800 $1,137 $1,198 $1,029 $1,052 $1,039 $943 First Wholesale Value ($Millions) $2,020 $2,667 $2,712 $2,371 $2,435 $2,432 $2,538 *Figures may not include processing activity from catcher/processor vessels. **2016 data is preliminary. 21
 Output ($Millions) Commercial Fishing 2,500 1,600 $67 $140 Processing 2,900 1,700 $65 $161 Direct Support 1,000 800 $87 - Direct Total 6,400 4,100 $219")
22 Kodiak Region Top Port: Kodiak $262M* Seafood Industry Impact on Regional Economy, 2015/2016 Avg. Number of FTE Jobs Labor Income ($Millions) Output ($Millions) Commercial Fishing 2,500 1,600 $67 $140 Processing 2,900 1,700 $65 $161 Direct Support 1, $87 - Direct Total 6,400 4,100 $219 $301 Secondary Total - 1,900 $79 $174 Total Impacts - 5,900 $297 $475 Other Key Ports: Larsen Bay Alitak Bay Old Harbor Chignik *Avg. 2015/2016 FW Value. Kodiak was the second largest commercial fishing port in the U.S. by volume landed in 2015, and third in terms of ex-vessel value. The industry drives the regional economy and is responsible for much of the region s economic activity and population base. Seafood accounts for approximately 40 percent of the region s employment. Kodiak s seafood processors employ the highest percentage of local residents of any major production region in Alaska. On average during , 48 percent of processing workers were year-round residents of Kodiak. The region tends to have higher rates of resident employment because Kodiak waters produce several commercial species leading to more consistent production throughout the year. As a result, resident processing workers earn a higher share of income and are more likely to work in senior positions. Kodiak jig fisherman Darius Kasprzak of the FV Marona. The U.S. Coast Guard maintains a large presence in Kodiak, using the community as a staging area for safety and rescue missions in both the Gulf of Alaska and Bering Sea. 22 Kodiak Region includes: Kodiak Island Borough and the communities of Chignik, Chignik Lake, Chignik Lagoon, and Perryville.
23 Share of Regional Ex-Vessel Value, 2015/2016* Harvesting 2016 Figures Processing 24% Pollock 16% Sockeye Salmon 9% Pink Salmon 13% Halibut 11% Black Cod 14% Pacific Cod 469 Resident-owned Fishing Vessels $128Million Harvest Value 1,291 Resident Fishermen 427 Million Pounds of Seafood Harvested 15 Shore-based Processing Facilities $243Million Wholesale Value 2,586 Shoreside Processing (2015) 208 Million Pounds of Seafood Produced 8% of Alaska Total 6% of Alaska Total 4% Rockfish *Common property fisheries only. 9% Flatfish & Other Species Regional Salmon Fisheries Regional Economic Trends in Seafood Industry Gear Type* Harvest Value Permits Fished Seine $30 Million 243 Setnet $4.0 Million 146 * 2015/2016 Avg., includes Chignik seine fishery Resident Commercial Fishermen 1,408 1,529 1,463 1,432 1,342 1,424 1,291 Gross Earnings ($Millions)** $140 $185 $166 $164 $154 $134 $118 Average Processing Employment* 1,724 1,816 1,821 1,799 1,598 1,803 1,571 Peak Processing Employment* 2,094 2,339 2,254 2,480 2,088 2,397 1,980 Wages/Salaries ($Millions)* $70 $74 $77 $73 $68 $77 $53 Regional Harvest Value ($Millions)** $140 $206 $192 $194 $135 $153 $128 First Wholesale Value ($Millions) $322 $383 $401 $436 $331 $359 $243 *Figures may not include processing activity from catcher/processor vessels. **2016 is preliminary. 23
 Output ($Millions) Commercial Fishing 6,700 1,900 $101 $184 Processing 3,800 1,200 $51 $257 Mgmt.")
24 Southcentral Alaska Seafood Industry Impact on Regional Economy, 2015/2016 Avg. Number of FTE Jobs Labor Income ($Millions) Output ($Millions) Commercial Fishing 6,700 1,900 $101 $184 Processing 3,800 1,200 $51 $257 Mgmt./Hatcheries $29 - Direct Total 11,000 3,500 $180 $441 Secondary Total - 3,300 $161 $374 Total Impacts - 6,700 $342 $814 Regional Ports (2015/16 Avg. FW Value) Cordova $134M Kenai $84M Seward $83M Anchorage $50M Valdez $50M Homer $15M Whittier Kasilof Nikiski Anchor Pt. Resident Seafood by Borough or Census Area Kenai Peninsula Borough Anchorage Municipality Valdez-Cordova CA Mat-Su Borough 3,796 2,232 1, The seafood industry directly employs 11,000 workers and creates approximately 6,700 FTE jobs including multiplier effects (as a result of seafood caught and processed within the region, not including impacts from Southcentral residents bringing home earnings from other Alaska fisheries in other regions). 36 percent of Alaska s resident commercial fishermen live in Southcentral, more than any other region. Southcentral featured 17 communities with gross resident fishing earnings greater than $1 million in 2016, and 6 communities with more than $5 million. Limited entry fishing permits and IFQ shares for halibut and black cod owned by Southcentral residents were worth an estimated $343 million in Regional fishing employment and gross fishing earnings fell sharply in 2016, due to poor salmon runs. Southcentral residents earn nearly half of their gross fishing income from fisheries outside the region. Bristol Bay and Kodiak salmon fisheries include many Southcentral residents. 24 Three generations of Cook Inlet setnetters. Anchorage is a critical hub for fresh seafood shipments, seafood workers, and fishery management meetings; all of which benefit the regional economy. Southcentral Region includes: Anchorage Municipality, Kenai Peninsula Borough, Matanuska-Susitna Borough, and Valdez-Cordova Census Area.
25 Share of Regional Ex-Vessel Value, 2015/2016* Harvesting 2016 Figures Processing 30% Sockeye Salmon 24% Pink Salmon 9% Other Salmon *Common property fisheries only. Regional Salmon Fisheries Gear Type* Harvest Value Permits Fished 2,021 Resident-owned Fishing Vessels $150Million Harvest Value Driftnet $47 Million 999 Regional Economic Trends in Seafood Industry 5,557 Resident Fishermen 136 Million Pounds of Seafood Harvested Seine $42 Million Shore-based Processing Facilities $375Million Wholesale Value Setnet $14 Million 558 4,482 Shoreside Processing (2015) 101 Million Pounds of Seafood Produced 9% of Alaska Total 9% of Alaska Total Total $103 Million 1, Resident Commercial Fishermen 5,592 5,890 5,882 5,808 5,980 5,909 5,557 Gross Earnings ($Millions)* $264 $306 $290 $321 $274 $259 $218 Average Processing Employment 959 1,268 1,320 1,341 1,415 1,238 1,206 Peak Processing Employment 2,873 3,632 3,258 3,167 3,300 3,241 3,557 Wages/Salaries ($Millions) $33 $32 $46 $54 $51 $48 $41 Regional Harvest Value ($Millions)* $296 $272 $246 $283 $209 $218 $150 First Wholesale Value ($Millions)* $511 $429 $470 $687 $488 $507 $375 *2016 data is preliminary. 20% Halibut 14% Black Cod 2% Crab, Rockfish & Other Species * 2015/2016 Avg. 25
 Output ($Millions) Commercial Fishing 6,100 2,900 $121 $221 Processing 4,100 1,600 $62 $228 Direct Support FN 1,100 800 $80 - Direct Total 11,300 5,300")
26 26 Southeast Alaska Seafood Industry Impact on Regional Economy, 2015/2016 Avg. Number of FTE Jobs Labor Income ($Millions) Output ($Millions) Commercial Fishing 6,100 2,900 $121 $221 Processing 4,100 1,600 $62 $228 Direct Support FN 1, $80 - Direct Total 11,300 5,300 $264 $449 Secondary Total - 2,900 $116 $257 Total Impacts - 8,200 $379 $706 Seafood is the largest private sector industry in Southeast Alaska, in terms of workforce size and labor income. Seafood accounted for 15 percent of the regional employment in 2015/2016, including multiplier impacts. Southeast residents own more commercial fishing boats and IFQ (individual fishing quota) shares than any other region. Seafood is an important part of most local economies in Southeast, but provides an economic foundation for Sitka, Petersburg, Wrangell, Prince of Wales Island, Hoonah, Haines, and Yakutat. Marsh & Nora Skeele, Sitka Salmon Shares fishermen. Regional Ports (2015/2016 Avg. FW Value) Sitka $121M Ketchikan $93M Petersburg $83M Juneau $53M Wrangell Excursion Inlet Craig $14M Yakutat $13M Hoonah Metlakatla Haines Pelican Gustavus Hyder Klawock Resident Seafood by Community Sitka Petersburg Ketchikan Borough Juneau Prince of Wales Is. Wrangell Hoonah/Angoon/Skagway Yakutat Haines 1, Resident IFQ Quota & Limited Entry Permit Value by Community ($Millions) Petersburg Sitka Juneau Ketchikan Borough Wrangell Prince of Wales Is. Hoonah/Angoon/Skagway Haines Yakutat Southeast Total Southeast Region includes: Haines Borough, Hoonah-Angoon Census Area, Juneau Borough, Ketchikan Gateway Borough, Petersburg Borough, POW-Hyder Census Area, Sitka Borough, Skagway Borough, Wrangell Borough, and Yakutat Borough. $ $583
27 Share of Regional Ex-Vessel Value, 2015/2016* 19% Keta (Chum) Salmon 17% Coho+Chinook 12% Pink Salmon 5% Sockeye Salmon *Common property fisheries only. Regional Salmon Fisheries 18% Halibut 16% Black Cod 14% Crab, Herring, & Other Species Gear Type* Harvest Value Permits Fished Harvesting 2,683 Resident-owned Fishing Vessels $218Million Harvest Value Regional Economic Trends in Seafood Industry 4,283 Resident Fishermen Processing Resident Commercial Fishermen 4,641 4,586 4,685 4,733 4,686 4,545 4,283 Gross Earnings ($Millions)* $228 $278 $262 $258 $233 $198 $198 Average Processing Employment 1,443 1,610 1,595 1,747 1,840 1,747 1,369 Peak Processing Employment 3,972 4,324 3,974 4,551 4,775 4,615 3,256 Wages/Salaries ($Millions) $49 $57 $54 $66 $68 $72 $53 Regional Harvest Value ($Millions)* $265 $346 $309 $345 $266 $224 $218 First Wholesale Value ($Millions)* $473 $628 $516 $641 $511 $466 $432 *2016 data is preliminary. 221 Million Pounds of Seafood Harvested 50 Shore-based Processing Facilities $432Million Wholesale Value 4, Million Pounds of Seafood Produced 13% of Alaska Total 10% of Alaska Total Seine $46 Million Figures Troll $29 Million 1,036 Driftnet $21 Million 423 Shoreside Processing (2015) Total $96 Million 1,727 * 2015/2016 Avg. 27
 Output ($Millions) Commercial Fishing 29,200 13,700 $824 $1,738 Processing 28,700 14,400 $563 $2,446 Mgmt.")
28 National Impact of Alaska Seafood National Impacts of Alaska Seafood Industry, 2015/2016 Avg. Alaska s seafood industry accounts for 99,000 Number of FTE Jobs Labor Income ($Millions) Output ($Millions) Commercial Fishing 29,200 13,700 $824 $1,738 Processing 28,700 14,400 $563 $2,446 Mgmt./Other 4,100 2,900 $287 - Distributors $64 $131 Grocers 4,400 4,400 $133 $237 Restaurants 12,700 12,700 $349 $892 Direct Total 79,900 48,900 $2,218 $5,444 Secondary Total - 50,100 $2,949 $7,315 Total Impacts - 99,000 $5,167 $12,758 FTE jobs in the U.S., including jobs throughout the entire production, distribution, and retail chain. in these jobs earned an estimated $5.2 billion in total annual labor income. The national economic impact of Alaska s seafood industry includes an estimated 48,900 FTE jobs in fishing, processing, fisheries management, transportation and distribution, and in stores and restaurants. It also includes 50,100 secondary jobs throughout the economy created as a result of spending by businesses in the supply chain and their employees. Among all the participants in the national seafood supply chain, fishermen earn the largest share of labor income at $824 million, or 37 percent of all direct labor income generated by Alaska s seafood industry. 28 Alaska seafood is sold at thousands of restaurants and grocery stores around the U.S., creating tens of thousands of American jobs. U.S. economic output related to Alaska s seafood industry totals $12.8 billion including all direct and multiplier impacts. Total output is defined as the value of Alaska s seafood resource, as it moves from the fishing vessel to the consumer s plate, plus output arising from secondary impacts.


29 Alaska s Commercial Fishermen Alaska Skippers and Crew, by State of Residence, ,592 People from every U.S. state participate in Alaska s commercial fisheries. The maps on this page indicate the concentration of Alaska skippers, permit owners, and crew by state of residence. In 2016, 62 percent of the industry s skippers, active permit owners, and crew were Alaska residents, totaling 15,592 fishermen. Thousands more come to Alaska each year to work in processing plants or aboard processing vessels. Similar data for processing workers is not available. Nonresident fishermen and processors play a key role in Alaska s seafood industry. Without their contributions, it is unlikely the state could provide enough workers to capitalize on available fishery resources. Residents of every U.S. state participate in Alaska fisheries. Regardless of where fishermen live, their earnings contribute to local economies in Alaska and around the country. 12,146 5,000+ 1,000-5, , Photo courtesy of Garrett Evridge 29


30 Value of Alaska Seafood The first wholesale value of Alaska seafood was $4.19 billion in Of this total, fishermen earned $1.67 billion in ex-vessel value while processors, both shoreside and at-sea, added $2.52 billion in value. The industry typically harvests between five and six billion pounds of seafood each year. $3.7 $3.9 $3.2 $3.9 $4.6 $4.5 $4.6 $4.3 $4.3 $4.2 ASMI s mission is to enhance the value of Alaska seafood, a natural resource that supports thousands of Alaskans in communities all across the state. -Alexa Tonkovich, Executive Director, ASMI 30 *Data is preliminary. The value of Alaska seafood has declined in recent years, primarily due to a stronger U.S. dollar and lower halibut, black cod, crab, and sole harvests. A strong dollar is bad for Alaska s seafood industry because it makes domestic products relatively more expensive than competing foreign products. Since 2011, the U.S. dollar index has strengthened by 27 percent and ex-vessel value has declined by 22 percent. U.S. Dollar Index & Ex-Vessel Value of Alaska Seafood U.S. Dollar Index (Low = Good for AK) Ex-Vessel Value ($Billions, nominal) $1.65 $1.89 $1.44 $1.69 $2.13 $2.11 $2.01 $1.92 $1.77 $1.67 Sources: OANDA.com and McDowell Group estimates.
.")

31 Competing in a Global Seafood Market Alaska is a major seafood producer on a global scale. The state produces more wild seafood than all other U.S. states combined. If it were a country, Alaska would rank #7 among seafood exporting nations (in 2015). However, Alaska seafood is a small part of a global supply chain that encompasses large volumes of competing wild and farmed species. Supply and demand for competing species impacts prices for Alaska seafood products. The species below account for 80% of Alaska s ex-vessel value but each faces significant competition from other global producers. Although Alaska seafood is essentially a commodity, Alaska is a high-cost environment. It is virtually impossible to compete on price alone. Luckily for Alaska, it is the largest seafood producing state in America with sustainable management practices and pristine marine waters - attributes no foreign or domestic competitor can match. Therefore, maximizing the resource value will require market differentiation, product development, and consumer awareness. Alaska and the seafood industry must continue to invest in these endeavors in order to maximize the economic benefits. Rest of U.S. Harvest Alaska Harvest 62% Global Wild Harvest & Aquaculture Production Alaska 1.9% POLLOCK SALMON COD CRAB AK Pct. of Global Supply: 44% Pct. of AK Ex-Vessel Value: 27% Pct. of AK Harvest: 54% Pollock is the most abundant wild whitefish species on the planet. Alaskan pollock competes with Russian pollock, as well as tilapia and pangasius - farmed species whose combined production is nearly twice that of pollock. AK Pct. of Global Supply: 14% Pct. of AK Ex-Vessel Value: 27% Pct. of AK Harvest: 18% Despite a record harvest, Alaska accounted for just 14% of global salmon supply in Farmed salmon production outnumbers wild harvests 2.5-to-1. Farmed production increased 43% (1.06 MMT) from 2010 to AK Pct. of Global Supply: 16% Pct. of AK Ex-Vessel Value: 11% Pct. of AK Harvest: 12% Alaska s Pacific cod harvests pale in comparison to the more valuable Atlantic cod species. Global cod harvests increased 31 percent (417,500 MT) from 2010 to AK Pct. of Global Supply: 29% Pct. of AK Ex-Vessel Value: 15% Pct. of AK Harvest: 1.5% Figures Alaska is known for worldclass king and snow crab harvests, but Canada produces more snow crab while Russia produces more king crab. Pacific Northwest states also produce more Dungeness than Alaska. 31

32 Seafood & Alaska s Economic Future Seafood is Alaska s most valuable renewable natural resource. With a continued commitment to careful resource management, Alaska will continue to produce large volumes of high-value seafood in perpetuity. Though already a cornerstone of Alaska s economy, seafood holds great potential for additional economic benefit for the state. The resource is highly regarded by consumers around the world, with demand for tasty, sustainable seafood generally increasing faster than production from wild fisheries and aquatic farms. A stronger U.S. dollar has led to lower prices over the past few years, but with continued market development and promotion, the prospects are excellent in the long-term. While the seafood industry and other industries cannot fill the hole in State General Fund revenues left by declining oil prices, seafood can play an increasingly important role in Alaska s economy by creating employment and income opportunities for Alaskans. 32 The seafood industry represents a unique opportunity for young Alaskans, in particular. The Alaska Maritime Workforce Development Plan, vocational training programs, revolving loan programs, and other economic development projects/programs will be critical in attracting Alaskans to the industry and developing the industry s next-generation workforce. In general, expanding employment and resource value in the seafood industry will require the following: Local or in-state training programs that help fisheries and processing companies replace an aging workforce. A stable tax/fee structure that considers fishery management, marketing, administrative, and other management costs, and preserves incentives for fishermen and processors to continue investing in the industry. Continued commitment to market development in order to maximize the value of Alaska seafood products. Mariculture in Alaska Mariculture, the practice of farming aquatic shellfish and plants, holds significant promise in Alaska. The Alaska Mariculture Task Force was established by Gov. Walker in 2016 to develop a comprehensive plan to expand the mariculture industry in Alaska. Growing oysters, kelp, and other species could play a key role in expanding the value of Alaska seafood.


33 - Seafood Value since Alaska Statehood - Double-ender sailboats were used to haul gillnets in Bristol Bay until the 1950s. Nets are now reeled in using hydraulics, but the fish are still picked by hand in gillnet fisheries. Photo Credit: Ward Wells Collection, Anchorage Museum. Seafood has been a commercial enterprise in Alaska since the 1860 s, making the industry more than twice as old as the state itself. The abundance of Alaska seafood is truly astounding. Through salmon traps, foreign offshore drift nets, and the crab frenzy, Alaska waters continue to produce billions of pounds of seafood each year. Since statehood in 1959, Alaska s seafood industry has harvested an estimated cumulative total of 169 billion pounds of fish and shellfish, with a first wholesale value of $170 billion, in 2016 dollars. Cumulative ex-vessel earnings since statehood total $84 billion (adjusted for inflation) through Adjusted for inflation, the highest annual first wholesale value was produced in 1992 ($5.5 billion). The largest harvest occurred in 2015, when fishermen hauled in 6.1 billion pounds. $Billions (in 2016 dollars) Estimated Cumulative First Wholesale Value of Alaska Seafood (in $Billions) $250 $200 $170 Billion $150 $100 $50 $
34 Industry Tax Revenues 34 Commercial fishing and processing businesses incur substantial costs to operate in Alaska, including taxes, fees, and self-assessments of more than $146.2 milion in These revenue sources include: Unencumbered taxes are used to fund local, state, and federal government. The Fisheries Business Tax is the largest of these taxes and is especially important as half of the receipts are distributed to local governments, many of which have few other sources of revenue. Taxes not included due to a lack of data include property taxes and federal income taxes, among many others. Agency fees and cost recovery collections are designed to pay for specific services provided by state/federal government, and non-profit salmon hatchery operators. State fees on permits, leases, and vessels, as well as test fishery receipts, are generally used to pay for administrative costs associated with commercial fishery management. Federal cost recovery fees are collected for halibut, black cod, crab, and other fisheries. Salmon hatcheries, which benefit many user groups, are funded almost entirely through cost recovery harvests and enhancement taxes derived from the commercial fishing industry. Data were not available for a number of other agency fees, including those related to business licensing, port and harbor fees, federal vessel documentation fees, and federal fishery endorsements, among others. Industry self-assessments are collected to fund industry-supported projects, such as seafood marketing efforts through the Alaska Seafood Marketing Institute and Regional Seafood Development Associations. Overall, of the taxes and fees collected on the Alaska seafood industry and for which data are available, 40% goes to state government ($58.0 million), 31% goes to local governments ($45.8 million), 20% to salmon hatcheries ($29.8 million), and 9% to the federal government ($12.6 million). 2016, $Millions Taxes $74.5 Fisheries Business Tax $39.9 Fisheries Resources Landing Tax $9.8 Marine Motor Fuel Tax $3.0 Corporate Income Tax $3.2 Local Raw Fish and Other Taxes $18.7 Agency Fees & Cost Recovery $53.2 CFEC Permit and Vessel Fees $8.2 Crew License Sales $3.4 Test Fishery Reciepts $3.0 Processing/Mariculture/Other Fees $1.0 Salmon Hatchery Cost Recovery* $23.0 Federal Cost Recovery Fees** $10.8 Federal Observer Program $3.9 Industry Self-Assessments $18.4 Seafood Marketing (ASMI) $9.7 Salmon Enhancement $6.8 Seafood Development (RSDAs) $1.4 Dive Fishery Management $0.5 Common Property Assessment <$0.1 Total $146.2 Note: Data are for FY Totals may not sum due to rounding. *Earnings are retained by salmon hatcheries, and account for the majority of hatchery operating revenues. **Roughly $2M goes to state government. Sources: ADOR, CFEC, DCCED, ADF&G, NMFS, OMB, & McDowell Group estimates.


35 Lowering the Cost of Living in Alaska The seafood industry provides economies of scale and economic activity which lowers the cost of utilities, shipping, fuel, and local taxes for residents in many Alaska communities. Fishing communities also benefit from marine infrastructure and support services, which are more expansive due to the presence of the commercial seafood industry. The majority of Alaska s consumer freight is a one-way, northbound haul. Shipping seafood on southbound routes provides backhaul revenue for shippers, allowing for more competitive rates on northbound freight. Alaska s seafood industry ships approximately 1 billion lbs. of finished product southbound each year, or the equivalent of roughly 23,000 containers (at 20 mt/container). Everyone benefits from the seafood industry, especially smaller communities in Western Alaska, says Kevin Anderson, president of Alaska Marine Lines, a barge transportation company that provides service between Seattle and nearly 100 ports and villages throughout Alaska. Our ability to serve smaller communities, like those in Bristol Bay, would be drastically reduced without the prospect of southbound seafood shipments. Instead of six or seven sailings per year there might only be enough freight to support one or two. Photo credit: Alaska Marine Lines. Southbound Seafood Shipments ~465,000 mt/yr. 35


36 Feeding the World Marine resources like fish and shellfish are public goods that belong to all Alaskans and other Americans. Alaska s seafood industry allows all consumers to efficiently access the resource, not just those who live nearby or have the means to access them with private boats. Commercial fishermen and processing companies are the conduit through which hundreds of millions of Americans can enjoy Alaska seafood. The commercial seafood industry also converts this public marine resource into economic benefits for Americans, such as jobs, tax revenue, and exports (which help offset the U.S. trade deficit). Public Marine Resources Commercial Fishermen Seafood Processors Global Consumers & U.S. Economic Benefits Alaska s marine resources are so prolific, they could feed the entire world at least one serving of delicious, healthy seafood each year, or to all American consumers every day for more than a month. There s Plenty of Fish in the Sea When it Comes to Alaska Seafood Number of Servings by Product Type in 2015 Fillets & Fish Meat 8.7 Billion Surimi 2.4 Billion Roe 1.6 Billion Crab 296 Million Other Products 12 Million TOTAL: 12.9 BILLION SERVINGS 36
.")
37 Fishermen & Processors Invest in Alaska Fishermen and processors have made significant investments in the future of Alaska seafood. A survey of processors found that seven of the 10 largest shoreside processors invested a total of over $100 million per year in capital expenditures over the past five years ( ). The massive investment by this limited sample of Alaska processors underscores the commitment the processing sector has made to the industry s future - in addition to supporting its present through buying over $1 billion of fish and shellfish per year. Processors investment and multiplier impacts are closely tied to resource value. Expanding value provides processing companies capital to modernize plants, expand production lines, and pay higher fish prices. All of these benefit local communities in Alaska and provide growth elsewhere in the U.S. economy. Kodiak, shown above, is home to several large fish processing plants. Construction of a new Trident Seafoods plant (large blue building, closest to the harbor) is an example of seafood processors investment in Alaska. Alaska s commercial fishing fleet has expanded over the past five years. An average of 96 newly-built boats were added to the fleet during , representing an average investment of more than $60 million per year. These new fishing assets will pay dividends to owners and their local economies for decades to come. Some Alaska fishing fleets are aging and must continue to retire/replace old vessels. Modernizing the fleet is a critical part of sustaining the industry and creates many secondary jobs for American workers. However, investment in new vessels requires a healthy resource value. Today s ex-vessel value becomes tomorrow s capital investment. Unfortunately, investment in new vessels declined significantly in 2016 with lower seafood values. Raising the value of Alaska seafood is an excellent economic driver as it stimulates investment, brings new money into the economy through exports, and creates more jobs both, directly and indirectly, in Alaska and the Lower 48. New Commercial Fishing Boats Added to Alaska Fleet AVG. 246 AVG. 301 AVG. 160 AVG s 1990s s 2000s Note: Only includes vessels active in Source: CFEC 2016 Vessel File, compiled by McDowell Group

38 Fishermen from Juneau-based direct marketing firm Taku River Reds take a break on the bow of F/V Heather Anne. Pictured from left to right: Bottom row: Winston Warr, Athena Rose, Renee Warr, Heather Hardcastle, Kirk Hardcastle; Top row: Shelia and Len Peterson. Prepared for: Prepared by: 38
Prepared by: McDowell Group, Inc. Andy Wink CAP Meeting
 Prepared by: McDowell Group, Inc. Andy Wink CAP Meeting 7.28.15 Alaska Seafood Overview Fishery & Market Update Key Issues Ketchikan Seafood Industry Who and What is Alaska Seafood? About 60,000 fishermen,
Seafood Industry. The 2012 Juneau and Southeast Alaska Economic Indicators 11/1/12 Page 60
 Seafood Industry In 2011, fishermen in Southeast landed 395,628,268 pounds of fish with an ex vessel value of $391,091,684. This harvest resulted in 272.6 million pounds of product, with a wholesale value
North Pacific Fishery Management Council. Community considerations in Federally-managed fisheries. April 2005
 North Pacific Fishery Management Council Community considerations in Federally-managed fisheries April 2005 Why are Fisheries Off Alaska so important to communities? Would rank in the top 10 producing
Winter 2015/ Halibut & Blackcod Market Bulletin
 Winter 215/216 - Halibut & Blackcod Market Bulletin The Seafood Market Information Service is funded by a portion of the seafood marketing assessment paid by Alaska seafood producers. McDowell Group provides
Prince William Sound Aquaculture Corporation Economic Impact Update for 2010
 Prince William Sound Aquaculture Corporation Economic Impact Update for 2010 PWSAC has a Significant Impact on Alaska Salmon Fisheries During the past four seasons, salmon reared and released by the Prince
Spring 2016 Alaska Salmon Industry Analysis
 Spring 2016 Alaska Salmon Industry Analysis The Seafood Market Information Service is funded by a portion of the seafood marketing assessment paid by Alaska seafood producers. McDowell Group provides the
STOCK ASSESSMENT AND FISHERY EVALUATION REPORT FOR THE GROUNDFISH FISHERIES OF THE GULF OF ALASKA AND BERING SEA/ALEUTIAN ISLAND AREA:
 STOCK ASSESSMENT AND FISHERY EVALUATION REPORT FOR THE GROUNDFISH FISHERIES OF THE GULF OF ALASKA AND BERING SEA/ALEUTIAN ISLAND AREA: ECONOMIC STATUS OF THE GROUNDFISH FISHERIES OFF ALASKA, 1998 by Terry
Socioeconomic Impacts of Crab Rationalization on the Aleutian East Borough Communities of False Pass, Akutan, and King Cove
 Socioeconomic Impacts of Crab Rationalization on the Aleutian East Borough Communities of False Pass, Akutan, and King Cove Dr. Marie Lowe Dr. Gunnar Knapp Assistant Professor of Anthropology Professor
BERING SEA ALEUTIAN ISLANDS CRAB RATIONALIZATION: A LOOK AT EFFECTIVENESS IN TERMS OF SOCIAL AND ECONOMIC IMPACTS. Alexandra Bateman May 5, 2014
 BERING SEA ALEUTIAN ISLANDS CRAB RATIONALIZATION: A LOOK AT EFFECTIVENESS IN TERMS OF SOCIAL AND ECONOMIC IMPACTS Alexandra Bateman May 5, 2014 THE AREA http://www.alaskaberingseacrabbers.org/images/aboutusmap.jpg
Alaska s Economy: Then and Now
 Alaska s Economy: Then and Now, PhD Institute of Social and Economic Research University of Alaska Anchorage 10/11/2017 Outline General Overview 1 General Overview Alaska s Economy and Demographics:Then
Economic Values of Sport, Personal Use, and Commercial Salmon Fishing in Upper Cook Inlet. (Executive Summary)
") Economic Values of Sport, Personal Use, and Commercial Salmon Fishing in Upper Cook Inlet (Executive Summary) Kenai river sportfishing association p.o. box 1228 Soldotna, alaska 99669 January 2008 Kenai
Economic Values of Sport, Personal Use, and Commercial Salmon Fishing in Upper Cook Inlet (Executive Summary) Kenai river sportfishing association p.o. box 1228 Soldotna, alaska 99669 January 2008 Kenai
Bering Sea Salmon Bycatch Update North Pacific Fishery Management Council, July 2017
 Bering Sea Salmon Bycatch Update North Pacific Fishery Management Council, July 2017 Salmon are caught incidentally in the Bering Sea and Aleutian Islands (BSAI) offshore trawl fisheries, especially in
Executive Administrator
 March 3, 2017 Representative Louise Stutes, Chairman House Special Committee on Fisheries Alaska State Legislature State Capitol Juneau, AK 99801-1182 RE: Support for HB128 Shellfish Enhancement Dear Chairman
City of Ketchikan and Other Places Within the Ketchikan Gateway Borough:
 City of Ketchikan and Other Places Within the Ketchikan Gateway Borough: Holdings of Limited Entry Permits, Sablefish Quota Shares, and Halibut Quota Shares Through 1997 and Data On Fishery CFEC Report
Ketchikan and Other Nearby Places:
 Ketchikan and Other Nearby Places: Holdings of Limited Entry Permits, Sablefish Quota Shares, and Halibut Quota Shares Through 1998 and Data On Fishery Earnings CFEC Report 99-Ketchikan area-sn Alaska
Economic and Social Impacts of BSAI Crab Rationalization on the Communities of King Cove, Akutan and False Pass
 Economic and Social Impacts of BSAI Crab Rationalization on the Communities of King Cove, Akutan and False Pass Prepared by Gunnar Knapp Professor of Economics and Marie Lowe Assistant Professor of Anthropology
March 29, Senator Chris Birch, Chair Senate Resources Committee State Capitol Room 125 Juneau AK,
 March 29, 2019 Senator Chris Birch, Chair Senate Resources Committee State Capitol Room 125 Juneau AK, 99801 SenateResources@akleg.gov RE: OPPOSE SB 99, PERSONAL USE PRIORITY Dear Chair Birch and Committee
Early in the century the annual halibut catch
 PAGE 6 THE PACIFIC HALIBUT FISHERY OVER TIME Early in the century the annual halibut catch ranged above 70 million pounds, but by the early 1930s it had dropped below 50 million pounds. After that it began
Salmon bycatch patterns in the Bering Sea pollock fishery
 Salmon bycatch patterns in the Bering Sea pollock fishery James Ianelli Seattle, WA Data from the North Pacific Observer Program (Fisheries Monitoring and Assessment) were analyzed for seasonal, temporal,
Fishery. Fishing vessels (Dept. of Finance)
") Fishery Fishing vessels (Dept. of Finance) The Newfoundland and Labrador fishery recorded a difficult year in 29 due to low market prices, continued pressure from low-cost producers, and an appreciating
Fishery Fishing vessels (Dept. of Finance) The Newfoundland and Labrador fishery recorded a difficult year in 29 due to low market prices, continued pressure from low-cost producers, and an appreciating
Wild flatfish (Alaska Sole and Flounder), living in the clear remote waters of Alaska, are managed to provide a sustainable food source while
, living in the clear remote waters of Alaska, are managed to provide a sustainable food source while") Wild flatfish (Alaska Sole and Flounder), living in the clear remote waters of Alaska, are managed to provide a sustainable food source while protecting against habitat damage. Flatfish fishermen are dedicated
Wild flatfish (Alaska Sole and Flounder), living in the clear remote waters of Alaska, are managed to provide a sustainable food source while protecting against habitat damage. Flatfish fishermen are dedicated
Cook Inlet Habitat Conservation Strategy
 Cook Inlet Habitat Conservation Strategy What is the Cook Inlet Habitat Conservation Strategy? It s a new effort to tie together all of NOAA Fisheries habitat-related science and management activities
DEPARTMENT OF FISH AND GAME
 Sean Parnell, GOVERNOR DEPARTMENT OF FISH AND GAME November 4, 2011 DIVISION OF SPORT FISH 3298 Douglas Place Homer, AA 99603-8027 PHONE: (907) 235-8191 FAX: (907) 235-2448 and Douglas Island Center Bldg
Port Graham: Holdings of Limited Entry Permits, Sablefish Quota Shares, and Halibut Quota Shares Through 1998 and Data On Fishery Gross Earnings
 Port Graham: Holdings of Limited Entry Permits, Sablefish Quota Shares, and Halibut Quota Shares Through 1998 and Data On Fishery Earnings CFEC Report 99-Port Graham-SN Alaska Commercial Fisheries Entry
Economic Impacts of BSAI Crab Rationalization on Kodiak Fishing Employment and Earnings and Kodiak Businesses. A Preliminary Analysis
 Economic Impacts of BSAI Crab Rationalization on Kodiak Fishing Employment and Earnings and Kodiak Businesses A Preliminary Analysis Prepared by Gunnar Knapp Professor of Economics Institute of Social
Economic Contributions and Impacts of Salmonid Resources in Southeast Alaska
 Economic Contributions and Impacts of Salmonid Resources in Southeast Alaska FINAL REPORT Prepared for: Trout Unlimited Alaska Program 419 Sixth Street, Suite 200 Juneau, Alaska 99801 Contact: Mark Kaelke
ECONOMIC IMPACTS AND CONTRIBUTIONS OF SPORTFISHING IN ALASKA
 ECONOMIC IMPACTS AND CONTRIBUTIONS OF SPORTFISHING IN ALASKA 2 0 0 7 R E P O R T A Message from the Director CHARLIE SWANTON, DIRECTOR ADF&G, DIVISION OF SPORT FISH Alaska supports arguably some of the
Impacts of Halibut IFQs and Changing Kodiak Communities. Courtney Carothers University of Washington
 Impacts of Halibut IFQs and Changing Kodiak Communities Courtney Carothers University of Washington Alaska Fishing Communities Conference Anchorage, AK September 2006 Dissertation Research 12 months of
2011 SECOND QUARTER REPORT April 1 June 30, 2011
 FOR DISTRIBUTION 2011 SECOND QUARTER REPORT April 1 June 30, 2011 NORTON SOUND ECONOMIC DEVELOPMENT CORPORATION 420 L Street, Suite 310 Anchorage, AK 99501 Phone: (907) 274-2248 Fax: (907) 274-2249 Table
November 2016 Modernization of the North Pacific Fishing Fleet. Economic Opportunity Analysis
 November 2016 Modernization of the North Pacific Fishing Fleet Economic Opportunity Analysis Prepared for Prepared by November 2016 Modernization of the North Pacific Fishing Fleet Economic Opportunity
Sockeye Market Analysis
 Sockeye Market Analysis PREPARED FOR PREPARED BY November 2017 Table of Contents Executive Summary... 1 Glossary of Terms and Abbreviations... 2 Introduction and Data Sources... 3 2017 Bristol Bay Season
Report to the Monterey County Office of Economic Development. Caroline Pomeroy, Ph.D. 1. and. Michael Dalton, Ph.D. 2. June 2003
 SOCIO-ECONOMICS OF THE MOSS LANDING COMMERCIAL FISHING INDUSTRY Report to the Monterey County Office of Economic Development Caroline Pomeroy, Ph.D. 1 and Michael Dalton, Ph.D. 2 June 2003 1 Institute
Arctic / Yukon / Kuskokwim Salmon Fisheries: Permits Issued, Permits Fished, Pounds Landed, and Estimated Gross Earnings,
 Arctic / Yukon / Kuskokwim Salmon Fisheries: Permits Issued, Permits Fished, Pounds Landed, and Estimated Gross Earnings, 1987-1997 Prepared by: Kurt Iverson CFEC Report Number 98-9N December, 1998 Alaska
From the Ocean To the Plate
 From the Ocean To the Plate 0 About American Seafoods Company founded in 1988 25 th anniversary celebrated in 2013 Largest Catcher/Processor operator in the U.S. (6 active vessels) Largest CP quota holder
DESCRIPTION OF THE AFFECTED ENVIRONMENT (KEY SOCIO-ECONOMIC TRENDS) AND SUPPLEMENTAL ANALYSIS OF THE ALTERNATIVES
 AND SUPPLEMENTAL ANALYSIS OF THE ALTERNATIVES") Agenda Item D..a Supplemental Attachment June 01 DESCRIPTION OF THE AFFECTED ENVIRONMENT (KEY SOCIO-ECONOMIC TRENDS) AND SUPPLEMENTAL ANALYSIS OF THE ALTERNATIVES The following discussion provides information
Agenda Item D..a Supplemental Attachment June 01 DESCRIPTION OF THE AFFECTED ENVIRONMENT (KEY SOCIO-ECONOMIC TRENDS) AND SUPPLEMENTAL ANALYSIS OF THE ALTERNATIVES The following discussion provides information
Yukon River Drainage Fisheries Association (YRDFA)
") Yukon River Drainage Fisheries Association (YRDFA) Alaska s Fishing Communities ~ Harvesting the Future September 21, 2006, Anchorage, Alaska Presented by Jill Klein, Executive Director The Yukon River
Yukon River Drainage Fisheries Association (YRDFA) Alaska s Fishing Communities ~ Harvesting the Future September 21, 2006, Anchorage, Alaska Presented by Jill Klein, Executive Director The Yukon River
Hunter and Angler Expenditures, Characteristics, and Economic Effects, North Dakota,
 Agribusiness and Applied Economics Report No. 507-S January 2003 Hunter and Angler Expenditures, Characteristics, and Economic Effects, North Dakota, 2001-2002 Dean A. Bangsund and F. Larry Leistritz*
BRITISH COLUMBIA SEAFOOD INDUSTRY YEAR IN REVIEW
 BRITISH COLUMBIA SEAFOOD INDUSTRY YEAR IN REVIEW ii British Columbia Seafood Industry 2012 YEAR IN REVIEW TABLE of CONTENTS A MESSAGE from The B.C. MINISTER of AGRICULTURE....1 British Columbia SEAFOOD
Impacts of Nonresident Sportfishing on the Ketchikan Economy. Prepared for: Ketchikan Visitors Bureau
 Impacts of Nonresident Sportfishing on the Ketchikan Economy Prepared for: Ketchikan Visitors Bureau February 2010 Impacts of Nonresident Sportfishing on the Ketchikan Economy Prepared for: Ketchikan Visitors
Fishing Industry in Prince Edward Island January 2009
 Fishing Industry in Prince Edward Island January 2009 INDUSTRY HIGHLIGHTS Did you know??? There are two lobster seasons in PEI: the Spring season and the Fall fishery. There were 22.9 million pounds of
Discussion Paper on BSAI Fixed Gear Parallel Waters Fishery North Pacific Fishery Management Council October 2008
 Discussion Paper on BSAI Fixed Gear Parallel Waters Fishery North Pacific Fishery Management Council October 2008 Item D-2(b) At its April 2008 meeting, the Council initiated a staff discussion paper on
Herein are two reports provided to the Government of Newfoundland and Labrador by The McDowell Group of Alaska. This company was contracted by the
 Herein are two reports provided to the Government of Newfoundland and Labrador by The McDowell Group of Alaska. This company was contracted by the Provincial Government in November 2011 to provide a market
Aleutian Islands Pacific Cod CV Allocation with a Regionalized Delivery Requirement
 Aleutian Islands Pacific Cod CV Allocation with a Regionalized Delivery Requirement Discussion Paper October 2013 At its April 2013 meeting, the Council requested that staff provide a discussion paper
Fishery. Harvesting. Snow Crab Professional Fish Harvesters Certification Board
 Fishery T he Newfoundland and Labrador fishery faced several challenges in 8, including continued competition from low-cost producers, as well as high fuel costs and unfavourable exchange rates for most
Bristol Bay and World Salmon Markets in 2016
 Bristol Bay and World Salmon Markets in 2016 Gunnar Knapp Professor Emeritus of Economics Institute of Social and Economic Research University of Alaska Anchorage Gunnar.Knapp@gmail.com January 24, 2017
Commercial Net Pen Salmon Farming in Washington State
 Commercial Net Pen Salmon Farming in Washington State Icicle SeafoodsOverivew at a glance Icicle Seafoods Icicle is a leading harvester, producer and processor of diversified seafood products in North
Analyzing indicators for small northern places
 ReSDA Workshop No 1 Resources and Sustainable Development in the Arctic Yellowknife NWT, September 18 19 2011 Analyzing indicators for small northern places Larry Hamilton Department of Sociology University
Economic Contribution of the 2018 Recreational Red Snapper Season in the South Atlantic
 Economic Contribution of the 2018 Recreational Red Snapper Season in the South Atlantic Produced for the: American Sportfishing Association (ASA) PO Box 6435 Fernandina Beach, FL 32035 Office (904) 277-9765
Commercial Red Grouper Fishing in the Gulf of Mexico States
 Commercial Red Grouper Fishing in the Gulf of Mexico States According to NOAA Fisheries (https://www.fisheries.noaa.gov/species/red-grouper), the red grouper (Epinephelus morio) fishery in the Gulf of
Run Forecasts and Harvest Projections for 1997 Alaska Salmon Fisheries and Review of the 1996 Season
 State of Alaska Tony Knowles, Governor Regional Information Report No. 5J97-10 Run Forecasts and Harvest Projections for 1997 Alaska Salmon Fisheries and Review of the 1996 Season Edited by Harold J. Geiger
OR DUNGENESS CRAB FISHERY:
 E 55 OR DUNGENESS CRAB FISHERY: an economic analysis of productivity and profitability David S. Liao Joe B. Stevens OREGON STATE UNIVERSITY SEA GRANT COLLEGE PROGRAM Publication no. ORESU-T-75-005 AGRICULTURAL
Chinook Salmon. The Yukon River Panel
 Chinook Salmon and The Yukon River Panel Jan Conitz, ADF&G UAF FISH 493 Discussion January 26, 2016 Discussion Outline I. Yukon River context Salmon and Yukon River basics Fishing and history on the Yukon
The Salmon Industry: Twenty-Five Predictions for the Future
 The Salmon Industry: Twenty-Five Predictions for the Future by Gunnar Knapp Professor of Economics Institute of Social and Economic Research University of Alaska Anchorage 3211 Providence Drive Anchorage,
Yukon Delta Fisheries Development Association
 Yukon Delta Fisheries Development Association Community Development Through Fisheries Development 2 0 0 6 A n n u a l R e p o r t Alakanuk Emmonak Grayling Yukon Delta Fisheries Development Association
A Threatened Bay: Challenges to the Future of the Penobscot Bay Region and its Communities
 A Threatened Bay: Challenges to the Future of the Penobscot Bay Region and its Communities 1 A A Threatened Bay: Challenges to the Future of the Penobscot Bay Region and its Communities In 1996 the Island
Appendix G Coastal Demographic and Economic Trends Additional Figures
 Appendix G Coastal Demographic and Economic Trends Additional Figures Figure 1. Unemployment Rate in 1970-2004 18.0 16.0 14.0 12.0 10.0 8.0 6.0 4.0 1970 1972 1974 1976 1978 1980 1982 1984 1986 1988 1990
WEST COAST FISHERIES AND MANAGEMENT
 WEST COAST FISHERIES AND MANAGEMENT Olympic Coast National Marine Sanctuary Advisory Council May 20, 2016 Heather Reed - WDFW Jessi Doerpinghaus - WDFW FISHING IS KEY TO WASHINGTON S ECONOMY Washington
The Economic Gains from Reallocating Specific Saltwater Fisheries
 The Economic Gains from Reallocating Specific Saltwater Fisheries Produced for the: American Sportfishing Association By: Southwick Associates May 12, 2015 Executive Summary Allocation arrangements between
Economic and Social Effects of Changes in Wild Salmon Markets
 CHAPTER XIV Economic and Social Effects of Changes in Wild Salmon Markets Key Points Commercial salmon fishing, tendering and processing contribute to the economic livelihoods of tens of thousands of people
Turning Tough Times into Opportunity. Photo courtesy of Louisiana Seafood Promotion Board
 Turning Tough Times into Opportunity Photo courtesy of Louisiana Seafood Promotion Board The Industry Is in Tough Shape Shrimp prices are half of what they were 10 years ago* 3 major hurricanes have devastated
The 2006 Economic Benefits of Hunting, Fishing and Wildlife Watching in TEXAS. Prepared by:
 The 2006 Economic Benefits of Hunting, Fishing and Wildlife Watching in TEXAS Prepared by: Southwick Associates, Inc. P.O. Box 6435 Fernandina Beach, FL 32035 Ph (904) 277-9765 Fax (904) 261-1145 Email:
Testing a Methodology for Estimating the Economic Significance of Saltwater Charter Fishing in Southeast Alaska
 Testing a Methodology for Estimating the Economic Significance of Saltwater Charter Fishing in Southeast Alaska by Ginny Fay 2 Darcy Dugan 1 Ian Fay-Hiltner 2 Meghan Wilson 1 Steve Colt 1 Institute of
British Columbia's Fisheries & Aquaculture Sector May 2001
 British Columbia's Fisheries & Aquaculture Sector May 2001 Ministry of Finance and Corporate Relations Table of Contents Introduction... 1 What s new in this report?... 1 Highlights... 3 1. Defining the
The Role of the NPAFC in Conservation and Protection of Pacific Salmon
 The Role of the NPAFC in Conservation and Protection of Pacific Salmon Vladimir Fedorenko Executive Director and Shigehiko Urawa Deputy Director North Pacific Anadromous Fish Commission Vancouver, Canada
The 2001 Economic Benefits of Hunting, Fishing and Wildlife Watching in MISSOURI. Prepared by:
 The 2001 Economic Benefits of Hunting, Fishing and Wildlife Watching in MISSOURI Prepared by: Southwick Associates, Inc. PO Box 6435 Fernandina Beach, FL 32035 Ph (904) 277-9765 Fax (904) 261-1145 Email:
Provide a brief introduction to the U.S. seafood industry
 Provide a brief introduction to the U.S. seafood industry Participants will gain a better understanding of the large variety of seafood products available. 3 Increase knowledge of the following: What is
The Coast Guard has 145 Years of Arctic Service UNCLASSIFIED
 The Coast Guard has 145 Years of Arctic Service 1 Operational Challenges Maritime Boundary Line Nome Barrow Great Distances Kodiak-Barrow = 825 NM Dutch Harbor - Barrow = 1167 NM Barrow-North Pole= 1,140
Establishing a Transit Corridor through the Round Island Walrus Habitat Protection Area Scope, Purpose and Need of the Action
 Establishing a Transit Corridor through the Round Island Walrus Habitat Protection Area Scope, Purpose and Need of the Action Prepared by Steve A. MacLean North Pacific Fishery Management Council November,
Chinook Salmon Bycatch in Gulf of Alaska Groundfish Fisheries
 Chinook Salmon Bycatch in Gulf of Alaska Groundfish Fisheries March 2009 Staff Discussion Paper Table of Contents 1 INTRODUCTION...1 2 CHANGES TO THE DISCUSSION PAPER SINCE THE PREVIOUS DRAFT...1 3 DATA
THE BORNSTEIN REPORT March 2017
 Dungeness Crab: Cancer Magister The Oregon Dungeness Crab season officially opened January 1 and the South West Washington season opened January 7 th. Boats did not drop gear until price negotiations were
Marine Recreational and Commercial Industries and Activities in Lee and Charlotte Counties: Economic Consequences and Impacts
 Marine Recreational and Commercial Industries and Activities in Lee and Charlotte Counties: Economic Consequences and Impacts Betty Staugler Florida Sea Grant Extension Marine Agent & Chuck Adams Florida
THE ECONOMIC CONTRIBUTION FROM HORSES
 THE ECONOMIC CONTRIBUTION FROM HORSES ECONOMIC CONTRIBUTION FROM HORSES HIGHLIGHTS The horse industry contributes more than $19 billion annually to the Canadian economy On-farm activities with horses generate
Kodiak and Alaska Peninsula Commercial Dungeness Crab Fisheries, Report to the Alaska Board of Fisheries. Michael P. Ruccio.
 Kodiak and Alaska Peninsula Commercial Dungeness Crab Fisheries, 1999 Report to the Alaska Board of Fisheries By Michael P. Ruccio and David R. Jackson Regional Information Report 1 No. 4K00-3 Alaska Department
Demand for Harbors, Dockage, and Other Navigational Needs for Small Boats and Commercial Fishing Vessels in Alaska
 Demand for s, Dockage, and Other Navigational Needs for Small Boats and Commercial Fishing Vessels in Alaska May 2006 HDRU Series No 06-2 Prepared by: Nancy A. Connelly and Tommy L. Brown Human Dimensions
Economic Analysis of Marine Recreational Fishing at NOAA Fisheries
 Economic Analysis of Marine Recreational Fishing at NOAA Fisheries Office of Science & Technology Sabrina Lovell Recreational Fisheries Economist March 8, 2017 Presented at EAA Seminar: Sustainable fisheries
Department of Fish and Game
 MEMORANDUM TO: THRU: Kevin Duffy Deputy Commissioner Juneau Rob Bentz Deputy Director Division of Sport Fish Juneau State Of Alaska Department of Fish and Game DATE: September 21, 21 TELEPHONE NO: 465-6187
There are two types of selective commercial fisheries conducted by Talok Fisheries:
 Lake Babine Nation Inland Fishery The inland commercial fishery on Lake Babine is operated by a private fishing company named Talok that is owned by the Lake Babine Nation (LBN). This company is governed
the greatest amount delivered within the range of qualifying years the average annual amount delivered within the range of qualifying years
 Measures to support community protections for Eastern Aleutian Islands communities: Pacific ocean perch and Atka mackerel processing sideboards December 2008 At its June 2008 meeting, the Council requested
Southeast Alaska Transboundary Watersheds
 OCTOBER 2016 Economic Impact Analysis Southeast Alaska Transboundary Watersheds PREPARED FOR SalmonState PREPARED BY Southeast Alaska Transboundary Watersheds: Economic Impact Analysis Prepared for: SalmonState
Pacific Coast Groundfish Fishery Social Study: An Overview of Initial Theme Based Results
 Pacific Coast Groundfish Fishery Social Study: An Overview of Initial Theme Based Results Suzanne M. Russell Social Scientist Ecosystem Management Program Human Dimensions Team October 30, 2014 Agenda
Overview of herring related findings of NCEAS Portfolio Effects Working Group
 Overview of herring related findings of NCEAS Portfolio Effects Working Group Northwest Eric Ward, Rich Brenner eric.ward@noaa.gov richard.brenner@alaska.gov September 8, 2017 Acknowledgments Thanks to
Atlantic Canada lobster industry: structure & markets
 Atlantic Canada lobster industry: structure & markets Lobster summit October 2007 Gardner Pinfold 1 The lobster industry - vital to communities in Canada & U.S. Canada Landings 40-50,000 t $550-650 million
S U S T A I N A B I L I T Y
 S U S T A I N A B I L I T Y It s a catchphrase that s everywhere. In the case of seafood, it means the fisheries can exist long-term without compromising the survival of the species or the health of the
National Standard 10 Advanced Notice of Proposed Rulemaking New England Fishery Management Council
 National Standard 10 Advanced Notice of Proposed Rulemaking New England Fishery Management Council Portland, ME June 21, 2011 Presentation Outline Information on Fishing Safety National Standard 10 and
The Next Generation of Fishermen in the Kodiak Archipelago:
 The Next Generation of Fishermen in the Kodiak Archipelago: Exploring Dynamics Contributing to the Graying o the Fleet in Alaska s Commercial Fishing Industry Danielle Ringer Kodiak Team: Courtney Carothers,
To Revise the Maximum Retainable Amounts of Groundfish in the Arrowtooth Flounder Fishery
 INITIAL REVIEW DRAFT ENVIRONMENTAL ASSESSMENT/REGULATORY IMPACT REVIEW/ INITIAL REGULATORY FLEXIBILITY ANALYSIS For a proposed Regulatory Amendment to the Fishery Management Plan for the Groundfish Fishery
Run Forecasts and Harvest Projections for 1998 Alaska Salmon Fisheries and Review of the 1997 Season
 State of Alaska Tony Knowles, Governor Regional Information Report No. 5J98-04 Run Forecasts and Harvest Projections for 1998 Alaska Salmon Fisheries and Review of the 1997 Season Edited by Deborah Hart
ALASKA DEPARTMENT OF FISH AND GAME DIVISION OF COMMERCIAL FISHERIES NEWS RELEASE
 ALASKA DEPARTMENT OF FISH AND GAME DIVISION OF COMMERCIAL FISHERIES NEWS RELEASE Sam Cotten, Commissioner Scott Kelley, Director Contact: Pat Shields, Area Management Biologist or Phone: (907) 262-9368
Effects of a Salmon Shark Fishery in Prince William Sound. Team Captain: Kelly King Sheila Oelrich Tyler Roesch Keegan Birchfield Heather Sinclair
 Effects of a Salmon Shark Fishery in Prince William Sound Team Captain: Kelly King Sheila Oelrich Tyler Roesch Keegan Birchfield Heather Sinclair Team Sharks vs. Jets Geography of Prince William Sound
Figure 1. Structure of Estonian commercial fishing and fish farming in 2011 (% of the total volume)
") Estonia FISHERIES Estonia is a sea and coastal country on the Eastern shore of the Baltic Sea. The territory of Estonia is small 45 227 km 2 ; the length of our coastline, however, is 3794 km. Good location
Estonia FISHERIES Estonia is a sea and coastal country on the Eastern shore of the Baltic Sea. The territory of Estonia is small 45 227 km 2 ; the length of our coastline, however, is 3794 km. Good location
THE ECONOMIC GEOGRAPHY OF SALMON
 THE ECONOMIC GEOGRAPHY OF SALMON A conceptual framework and preliminary characterization of the spatial distribution of economic values associated with salmon in the Mat-Su Basin, Alaska Davin Holen, Principal,
Gulf of Mexico Oil Spill
 Bulletin 1204 May 2013 Estimation of the Baseline for Assessment of Economic Impacts of the Gulf of Mexico Oil Spill on Mississippi s Commercial Fishing Sector Discrimination based upon race, color, religion,
NOAA Fisheries Recrea.onal Fisheries Economics & Human Dimensions Program
 NOAA Fisheries Recrea.onal Fisheries Economics & Human Dimensions Program Rita Curtis, Ph.D., Office of Science & Technology The Fisheries Forum May 4-7, 2014 Beaufort, NC Overview Key Questions / Mandates
Selected Economic Impacts of Crab Rationalization on Kodiak: Preliminary Results
 Selected Economic Impacts of Crab Rationalization on Kodiak: Preliminary Results Gunnar Knapp University of Alaska Anchorage ComFish Alaska 2006, Kodiak, Alaska March 17, 2006 Presentation Outline 1. What
Oregon Department of Fish and Wildlife: Inland Fisheries - Hatchery Management
 Oregon Department of Fish and Wildlife: Inland Fisheries - Hatchery Management Primary Outcome Area: Economy & Jobs Secondary Outcome Area: Healthy Environments Program Contact: Ed Bowles, 503-947-6206
The University of Georgia
 The University of Georgia Center for Agribusiness and Economic Development College of Agricultural and Environmental Sciences Economic Impacts of Alabama Quail Hunting Prepared by: Archie Flanders and
The 2006 Economic Benefits of Hunting, Fishing and Wildlife Watching in NORTH CAROLINA. Prepared by:
 The 2006 Economic Benefits of Hunting, Fishing and Wildlife Watching in NORTH CAROLINA Prepared by: Southwick Associates, Inc. P.O. Box 6435 Fernandina Beach, FL 32035 Ph (904) 277-9765 Fax (904) 261-1145
ALASKA DEPARTMENT OF FISH AND GAME DIVISION OF COMMERCIAL FISHERIES NEWS RELEASE
 ALASKA DEPARTMENT OF FISH AND GAME DIVISION OF COMMERCIAL FISHERIES NEWS RELEASE Cora Campbell, Commissioner Jeff Regnart, Director Contact: P.O. Box 37 King Salmon, AK 99613 Area Management Staff P.O.
Figure 1. Structure of Estonian commercial fishing and fish farming in 2010 (% of the total volume)
") Estonia FISHERIES Estonia is a sea and coastal country on the Eastern shore of the Baltic Sea. The territory of Estonia is small 45 227 km 2 the length of our coastline, however, is 3794 km. Good location
Estonia FISHERIES Estonia is a sea and coastal country on the Eastern shore of the Baltic Sea. The territory of Estonia is small 45 227 km 2 the length of our coastline, however, is 3794 km. Good location
Fisheries Closures. Too many vacancies at the salmon hotels. Deborah Lyons Chinook Futures Coalition
 Fisheries Closures Too many vacancies at the salmon hotels Deborah Lyons Chinook Futures Coalition Chilkat Salmon Hotel 47% Occupancy June 12 Aug 9th 2017 Taku Salmon Hotel 28% Occupancy April August 9th