Atmospheric Circulations
|
|
|
- Cecilia Leonard
- 6 years ago
- Views:
Transcription


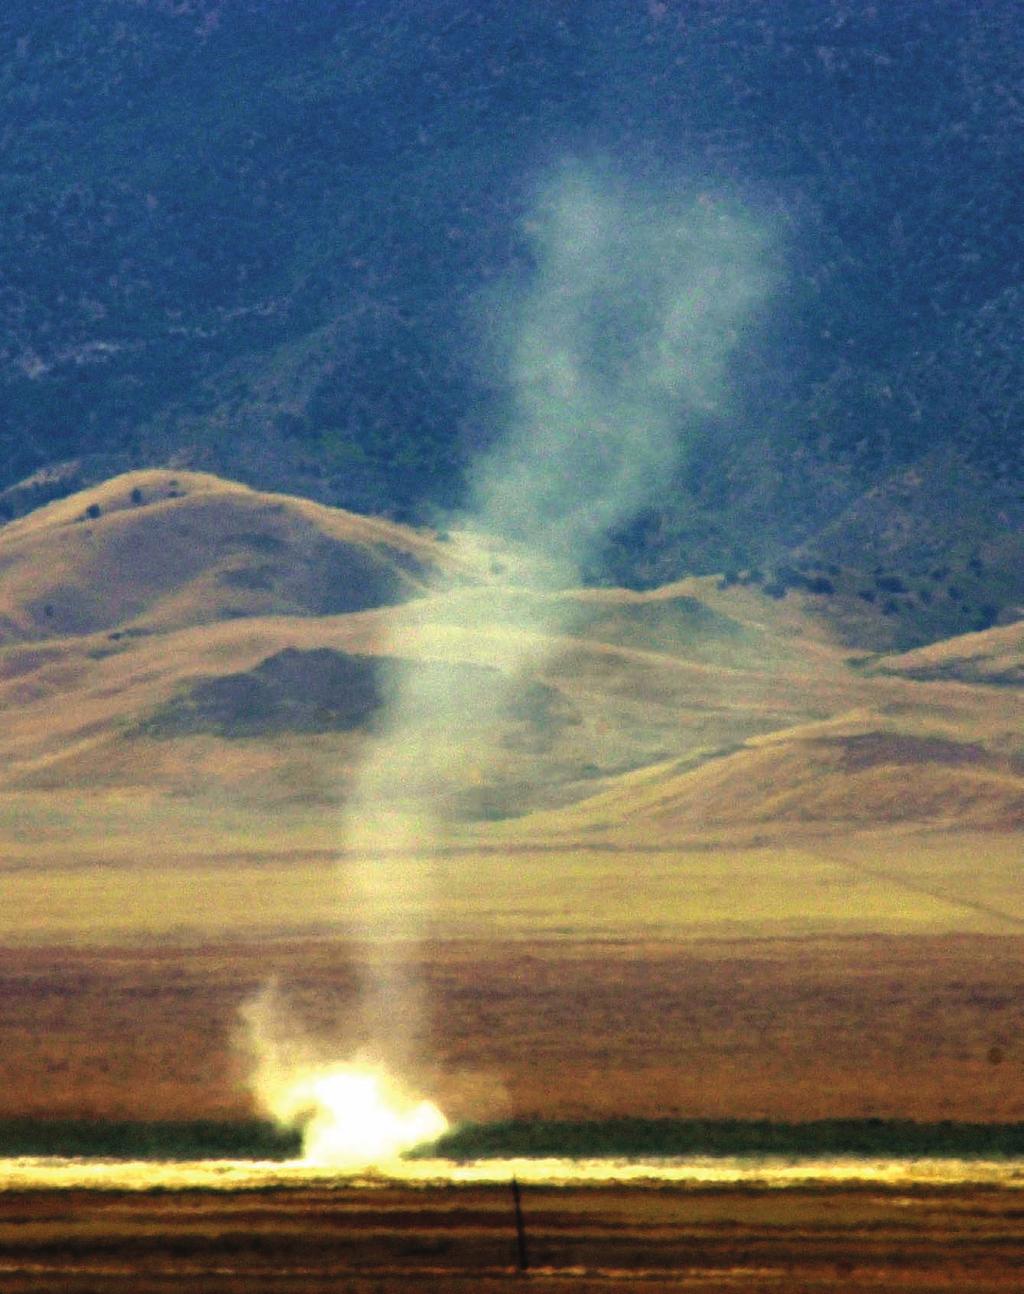
1 Contents Scales of Atmospheric Motion Eddies Big and Small Local Wind Systems Global Winds Global Wind Patterns and the Oceans Summary Key Terms Questions for Review Questions for Thought and Exploration A small circulation of swirling air a dust devil lifts small particles high above the dry surface. David McNew/Getty Images News 176
2 Atmospheric Circulations
3 178 Chapter 7 Atmospheric Circulations On December 30, 1997, a United Airlines Boeing 747 carrying 374 passengers was en route to Hawaii from Japan. Dinner had just been served, and the aircraft had reached a cruising altitude of 33,000 feet. Suddenly, east of Tokyo and over the Pacific Ocean, this routine, uneventful flight turned tragic. Without warning, the aircraft entered a region of severe air turbulence, and a vibration ran through the aircraft. The plane nosed upward, then plunged toward the earth for about 1000 feet before stabilizing. Screaming, terrified passengers not fastened to their seats were flung against the walls of the aircraft, then dropped. Bags, serving trays, and luggage that slipped out from under the seats were flying about inside the plane. Within seconds, the entire ordeal was over. At least 110 people were injured, 12 seriously. Tragically, there was one fatality a 32-year-old woman, who had been hurled against the ceiling of the plane, died of severe head injuries. What sort of atmospheric phenomenon could cause such turbulence? The aircraft in our opener encountered a turbulent eddy an air pocket in perfectly clear weather. Such eddies are not uncommon, especially in the vicinity of jet streams. In this chapter, we will examine a variety of eddy circulations. First, we will look at the formation of small-scale winds. Then, we will examine slightly larger circulations local wind such as the sea breeze and the chinook, describing how they form and the type of weather they generally bring. Finally, we will look at the general wind-flow pattern around the world. Scales of Atmospheric Motion The air in motion what we commonly call wind is invisible, yet we see evidence of it nearly everywhere we look. It sculptures rocks, moves leaves, blows smoke, and lifts water vapor upward to where it can condense into clouds. The wind is with us wherever we go. On a hot day, it can cool us off; on a cold day, it can make us shiver. A breeze can sharpen our appetite when it blows the aroma from the local bakery in our direction. The wind is a powerful element. The workhorse of weather, it moves storms and large fair-weather systems around the globe. It transports heat, moisture, dust, insects, bacteria, and pollens from one area to another. Circulations of all sizes exist within the atmosphere. Little whirls form inside bigger whirls, which encompass even larger whirls one huge mass of turbulent, twisting eddies.* For clarity, meteorologists arrange circulations according to their size. This hierarchy of motion from tiny gusts to giant storms is called the scales of motion. Consider smoke rising into the otherwise clean air from a chimney in the industrial section of a large city (see Fig. 7.1a). Within the smoke, small chaotic motions tiny eddies cause it to tumble and turn. These eddies constitute the smallest scale of motion the microscale. At the microscale, eddies with diameters of a few meters or less not only disperse smoke, they also sway branches and swirl dust and papers into the air. They form by convection or by the wind blowing past obstructions and are usually short-lived, lasting only a few minutes at best. In Fig. 7.1b, observe that, as the smoke rises, it drifts many kilometers downwind. This circulation of city air constitutes the next larger scale the mesoscale (meaning middle scale). Typical mesoscale winds range from a few kilometers to about a hundred kilometers in diameter. Generally, they last longer than microscale motions, often many minutes, hours, or in some cases as long as a day. Mesoscale circulations include local winds (which form along shorelines and mountains), as well as thunderstorms, tornadoes, and small tropical storms. When we look for the smokestack on a surface weather map (Fig. 7.1c), neither the smokestack nor the circulation of city air shows up. All that we see are the circulations around high- and low-pressure areas the cyclones and anticyclones of the middle latitude. We are now looking at the macroscale, or weather map scale, which is also called the synoptic scale. Circulations of this magnitude dominate regions of hundreds to even thousands of square kilometers and, although the life spans of these features vary, they typically last for days and sometimes weeks. When we look at wind patterns over the entire earth, we are looking at the planetary or global scale. Figure.7.2 summarizes the various scales of motion and their average life span. *Eddies are spinning globs of air that have a life history of their own.


4 Scales of Atmospheric Motion 179 FIGURE 7.1 Scales of atmospheric motion. The tiny microscale motions constitute a part of the larger mesoscale motions, which, in turn, are part of the much larger macroscale. Notice that as the scale becomes larger, motions observed at the smaller scale are no longer visible. FIGURE 7.2 The scales of atmospheric motion with the phenomenon s average size and life span. (Because the actual size of certain features may vary, some of the features fall into more than one category.)

5 180 Chapter 7 Atmospheric Circulations DID YOU KNOW? On a blustery night, the howling of the wind can be caused by eddies. As the wind blows past chimneys and roof corners, small eddies form. These tiny swirls act like pulses of compressed air that ultimately reach your eardrum and produce the sound of howling winds. Eddies Big and Small When the wind encounters a solid object, a whirl of air or eddy forms on the object s downwind side.* The size and shape of the eddy often depend upon the size and shape of the obstacle and on the speed of the wind. Light winds produce small stationary eddies. Wind moving past trees, shrubs, and even your body produces small eddies. (You may have had the experience of dropping a piece of paper on a windy day only to have it carried away by a swirling eddy as you bend down to pick it up.) Air flowing over a building produces larger eddies that will, at best, be about the size of the building. Strong winds blowing past an open sports stadium can produce eddies that may rotate in such a way as to create surface winds on the playing field that move in a direction opposite to the wind flow above the stadium. Wind blowing over a fairly smooth surface produces few eddies, but when the surface is rough, many eddies form. The eddies that form downwind from obstacles can produce a variety of interesting effects. For instance, wind moving over a mountain range in stable air with a speed greater than 40 knots usually produces waves and eddies, such as those shown in Fig We can see that eddies form both close to the mountain and beneath each wave crest. These so-called rotors have violent vertical motions that produce extreme turbulence and hazardous flying conditions. Strong winds blowing *The irregular, disturbed flow of gusty winds and eddies is called turbulence. FIGURE 7.3 Under stable conditions, air flowing past a mountain range can create eddies many kilometers downwind from the mountain itself. over a mountain in stable air may produce a mountain wave eddy on the downwind side, with a reverse flow near the ground. On a much smaller scale, the howling of wind on a blustery night is believed to be caused by eddies that are constantly being shed around obstructions, such as chimneys and roof corners. Turbulent eddies form aloft as well as near the surface. Turbulence aloft can occur suddenly and unexpectedly, especially where the wind changes its speed or direction (or both) abruptly. Such a change is called wind shear. The shearing creates forces that produce eddies along a mixing zone. If the eddies form in clear air, this form of turbulence is called clear air turbulence, or CAT. When flying in an airplane through such turbulence, the bumpiness may range from small vibrations to violent up and down motions that force passengers against their seats and toss objects throughout the cabin. (Additional information on this topic is given in the Focus section on p. 181.) Local Wind Systems Every summer, millions of people flock to the New Jersey shore, hoping to escape the oppressive heat and humidity of the inland region. On hot, humid afternoons, these travelers often encounter thunderstorms about twenty miles or so from the ocean, thunderstorms that invariably last for only a few minutes. In fact, by the time the vacationers arrive at the beach, skies are generally clear and air temperatures are much lower, as cool ocean breezes greet them. If the travelers return home in the afternoon, these mysterious showers often occur at just about the same location as before. The showers are not really mysterious. Actually, they are caused by a local wind system the sea breeze. As cooler ocean air pours inland, it forces the warmer, unstable humid air to rise and condense, producing majestic clouds and rain showers along a line where the air of contrasting temperatures meets. The sea breeze forms as part of a thermally driven circulation. Consequently, we will begin our study of local winds by examining the formation of thermal circulations. THERMAL CIRCULATIONS Consider the vertical distribution of pressure shown in Fig. 7.4a. The isobars* all lie parallel to the earth s surface; thus, there is no horizontal variation in pressure (or temperature), *The isobars depicted here actually represent a surface of constant pressure (an isobaric surface), rather than a line, or isobar. Information on isobaric surfaces is given in the Focus section in Chapter 6 on p. 157.
 as depicted in Fig. 1a.")

6 Local Wind Systems 181 FOCUS ON AN OBSERVATION Eddies and Air Pockets To better understand how eddies form along a zone of wind shear, imagine that, high in the atmosphere, there is a stable layer of air having vertical wind speed shear (changing wind speed with height) as depicted in Fig. 1a. The top half of the layer slowly slides over the bottom half, and the relative speed of both halves is low. As long as the wind shear between the top and bottom of the layer is small, few if any eddies form. However, if the shear and the corresponding relative speed of these layers increases (Figs. 1b and 1c), wavelike undulations may form. When the shearing exceeds a certain value, the waves break into large swirls, with significant vertical movement (Fig. 1d). Eddies such as these often form in the upper troposphere near jet streams, where large wind speed shears exist. If wavelike clouds form in the region of wind shear, they are often called billow clouds (see Fig. 2). Turbulent eddies also occur in conjunction with mountain waves, which may extend upward into the stratosphere. As we learned earlier, when these huge eddies develop in clear air, this form of turbulence is referred to as clear air turbulence, or CAT. The eddies that form in clear air may have diameters ranging from a couple of meters to several hundred meters. An unsuspecting aircraft entering such a region may be in for more than just a bumpy ride. If the aircraft flies into a zone of descending air, it may drop suddenly, producing the sensation that there is no air to support the wings. Consequently, these regions have come to be known as air pockets. Commercial aircraft entering an air pocket have dropped hundreds of meters, injuring passengers and flight attendants not strapped into their seats. For example, a DC-10 jetliner flying at 11,300 m (37,000 ft) over central Illinois during April, 1981, encountered a region of severe clear air turbulence and reportedly plunged about 600 m (2000 ft) toward the earth before stabilizing. Twenty-one of the 154 people aboard were injured; one person sustained a fractured hip and another person, after hitting the ceiling, jabbed himself in the nose with a fork, then landed in the seat in front of him.* Clear air turbulence has occasionally caused structural damage to aircraft by breaking off vertical stabilizers and tail structures. Fortunately, the effects are usually not this dramatic. *Another example of an aircraft that experienced severe turbulence as it flew into an air pocket is given in the opening vignette on p FIGURE 1 The formation of clear air turbulence (CAT) along a boundary of increasing wind speed shear. The wind in the top layer increases in speed from (a) through (d) as it flows over the bottom layer. FIGURE 2 Billow clouds forming in a region of rapidly changing wind speed, called wind shear. C. Donald Ahrens

7 182 Chapter 7 Atmospheric Circulations surface. At this level, the air flows horizontally northward toward lower pressure, where it completes the circulation by slowly sinking and flowing out the bottom of the surface high. Circulations brought on by changes in air temperature, in which warmer air rises and colder air sinks, are termed thermal circulations. The regions of surface high and low atmospheric pressure created as the atmosphere either cools or warms are called thermal (cold core) highs and thermal (warm core) lows. In general, they are shallow systems, usually extending no more than a few kilometers above the ground. FIGURE 7.4 A thermal circulation produced by the heating and cooling of the atmosphere near the ground. The H s and L s refer to atmospheric pressure. The lines represent surfaces of constant pressure (isobaric surfaces), where 1000 is 1000 millibars. and there is no pressure gradient and no wind. Suppose in Fig. 7.4b the atmosphere is cooled to the north and warmed to the south. In the cold, dense air above the surface, the isobars bunch closer together, while in the warm, less-dense air, they spread farther apart. This dipping of the isobars produces a horizontal pressure gradient force (PGF) aloft that causes the air to move from higher pressure toward lower pressure. At the surface, the air pressure remains unchanged until the air aloft begins to move. As the air aloft moves from south to north, air leaves the southern area and piles up above the northern area. This redistribution of air reduces the surface air pressure to the south and raises it to the north. Consequently, a pressure gradient force is established at the earth s surface from north to south and, hence, surface winds begin to blow from north to south. We now have a distribution of pressure and temperature and a circulation of air, as shown in Fig. 7.4c. As the cool surface air flows southward, it warms and becomes less dense. In the region of surface low pressure, the warm air slowly rises, expands, cools, and flows out the top at an elevation of about 1 km (3300 ft) above the SEA AND LAND BREEZES The sea breeze is a type of thermal circulation. The uneven heating rates of land and water (described in Chapter 3) cause these mesoscale coastal winds. During the day, the land heats more quickly than the adjacent water, and the intensive heating of the air above produces a shallow thermal low. The air over the water remains cooler than the air over the land; hence, a shallow thermal high exists above the water. The overall effect of this pressure distribution is a sea breeze that blows from the sea toward the land as illustrated in Fig Since the strongest gradients of temperature and pressure occur near the land-water boundary, the strongest winds typically occur right near the beach and diminish inland. Further, since the greatest contrast in temperature between land and water usually occurs in the afternoon, sea breezes are strongest at this time. (The same type of breeze that develops along the shore of a large lake is called a lake breeze.) At night, the land cools more quickly than the water, and the air above the land becomes cooler than the air over the water, producing a distribution of pressure, such as the one shown in Fig. 7.5b. With higher surface pressure now over the land, the wind reverses itself and becomes a land breeze a breeze that flows from the land toward the water. Temperature contrasts between land and water are generally much smaller at night; hence, land breezes are usually weaker than their daytime counterpart, the sea breeze. In regions where greater nighttime temperature contrasts exist, stronger land breezes occur over the water, off the coast. They are not usually noticed much on shore, but are frequently observed by ships in coastal waters. Look at Fig. 7.5 again and observe that the rising air is over the land during the day and over the water during the night. Therefore, along the humid east coast of the United States, daytime clouds tend to form over land and nighttime clouds over water. This explains why, at night, distant lightning flashes are sometimes seen over the ocean. The leading edge of the sea breeze is called the sea breeze front. As the front moves inland, a rapid drop in
 At the surface, a sea breeze blows from the water onto the land, whereas (b) the land breeze blows from the land out over the water.")
8 Local Wind Systems 183 FIGURE 7.5 Development of a sea breeze and a land breeze. (a) At the surface, a sea breeze blows from the water onto the land, whereas (b) the land breeze blows from the land out over the water. Notice that the pressure at the surface changes more rapidly with the sea breeze. This situation indicates a stronger pressure gradient force and higher winds with a sea breeze. temperature usually occurs just behind it. In some locations, this temperature change may be 5 C (9 F) or more during the first hours a refreshing experience on a hot, sultry day. In regions where the water temperature is warm, the cooling effect of the sea breeze is hardly evident. Since cities near the ocean usually experience the sea breeze by noon, their highest temperature usually occurs much earlier than in inland cities. Along the east coast of North America, the passage of the sea breeze front is marked by a wind shift, usually from west to east. In the cool ocean air, the relative humidity rises as the temperature drops. If the relative humidity increases to above 70 percent, water vapor begins to condense upon particles of sea salt or industrial smoke, producing haze. When the ocean air is highly concentrated with pollutants, the sea breeze front may meet relatively clear air and thus appear as a smoke front, or a smog front. If the ocean air becomes saturated, a mass of low clouds and fog will mark the leading edge of the marine air. When there is a sharp contrast in air temperature across the frontal boundary, the warmer, lighter air will converge and rise. In many regions, this makes for good sea breeze glider soaring. If this rising air is sufficiently moist, a line of cumulus clouds will form along the sea breeze front, and, if the air is also conditionally unstable, thunderstorms may form. As previously mentioned, on a hot, humid day one can drive toward the shore, encounter heavy showers several miles from the ocean, and arrive at the beach to find it sunny with a steady onshore breeze. When cool, dense, stable marine air encounters an obstacle, such as a row of hills, the heavy air tends to flow around them rather than over them. When the opposing breezes meet on the opposite side of the obstruction, they form what is called a sea breeze convergence zone. Such conditions are common along the Pacific coast of North America. Sea breezes in Florida help produce that state s abundant summertime rainfall. On the Atlantic side of the state, the sea breeze blows in from the east; on the Gulf shore, it moves in from the west (see Fig. 7.6). The convergence of these two moist wind systems, coupled with daytime convection, produces cloudy conditions and


9 184 Chapter 7 Atmospheric Circulations homeless and burned many thousands of acres of grass and woodlands. A weakened sea breeze and dry conditions produced wild fires on numerous other occasions, including the spring of Convergence of coastal breezes is not restricted to ocean areas. Both Lake Michigan and Lake Superior are capable of producing well-defined lake breezes. In upper Michigan, where these large bodies of water are separated by a narrow strip of land, the two breezes push inland and converge near the center of the peninsula, creating afternoon clouds and showers, while the lakeshore area remains sunny, pleasantly cool, and dry. FIGURE 7.6 Typically, during the summer over Florida, converging sea breezes in the afternoon produce uplift that enhances thunderstorm development and rainfall. However, when westerly surface winds dominate and a ridge of high pressure forms over the area, thunderstorm activity diminishes, and dry conditions prevail. showery weather over the land (see Fig. 7.7). Over the water (where cooler, more stable air lies close to the surface), skies often remain cloud-free. On many days during June and July of 1998, however, Florida s converging wind system did not materialize. The lack of converging surface air and its accompanying showers left much of the state parched. Huge fires broke out over northern and central Florida, which left hundreds of people SEASONALLY CHANGING WINDS THE MON- SOON The word monsoon derives from the Arabic mausim, which means seasons. A monsoon wind system is one that changes direction seasonally, blowing from one direction in summer and from the opposite direction in winter. This seasonal reversal of winds is especially well developed in eastern and southern Asia. In some ways, the monsoon is similar to a large-scale sea breeze. During the winter, the air over the continent becomes much colder than the air over the ocean. A large, shallow high-pressure area develops over continental Siberia, producing a clockwise circulation of air that flows out over the Indian Ocean and South China Sea (see Fig. 7.8a). Subsiding air of the anticyclone and the downslope movement of northeasterly winds from the inland plateau provide eastern and southern Asia T. Ansel Toney FIGURE 7.7 Surface heating and lifting of air along converging sea breezes combine to form thunderstorms almost daily during the summer in southern Florida.


10 Local Wind Systems 185 FIGURE 7.8 Changing annual surface wind-flow patterns associated with the winter and summer Asian monsoon. with generally fair weather and the dry season. Hence, the winter monsoon means clear skies, with surface winds that blow from land to sea. In summer, the wind-flow pattern reverses itself as air over the continents becomes warmer than air above the water. A shallow thermal low develops over the continental interior. The heated air within the low rises, and the surrounding air responds by flowing counterclockwise into the low center. This condition results in moisture-bearing winds sweeping into the continent from the ocean. The humid air converges with a drier westerly flow, causing it to rise; further lifting is provided by hills and mountains. Lifting cools the air to its saturation point, resulting in heavy showers and thunderstorms. Thus, the summer monsoon of southeastern Asia, which lasts from about June through September, means wet, rainy weather (wet season) with surface winds that blow from sea to land (see Fig. 7.8b). Although the majority of rain falls during the wet season, it does not rain all the time. In fact, rainy periods of between 15 to 40 days are often followed by several weeks of hot, sunny weather. The strength of the Indian monsoon appears to be related to the reversal of surface air pressure that occurs at irregular intervals about every two to seven years at opposite ends of the tropical South Pacific Ocean. As we will see later in this chapter, this reversal of pressure (which is known as the Southern Oscillation) is linked to an ocean warming phenomenon known as El Niño. During a major El Niño event, surface water near the equator becomes much warmer over the central and eastern Pacific. Over the region of warm water we find rising air, huge convective clouds, and heavy rain. Meanwhile, to the west of the warm water (over the region influenced by the summer monsoon), sinking air inhibits cloud formation and convection. Hence, during El Niño years, monsoon rainfall is likely to be deficient. Summer monsoon rains over southern Asia can reach record amounts. Located about 200 miles inland on the southern slopes of the Khasi Hills in northeastern India, Cherrapunji receives an average of 1080 cm (425 in.) of rainfall each year, most of it during the summer monsoon between April and October (see Fig. 7.9). The summer monsoon rains are essential to the agriculture of that FIGURE 7.9 Average annual precipitation for Cherrapunji, India. Note the abundant rainfall during the summer monsoon (April through October) and the lack of rainfall during the winter monsoon (November through March).


11 186 Chapter 7 Atmospheric Circulations it is no wonder that meteorologists have investigated it extensively. They have tried to develop methods of accurately forecasting the intensity and duration of the monsoon. With the aid of current research projects and the latest climate models (which tie in the interaction of ocean and atmosphere), there is hope that monsoon forecasts will begin to improve in accuracy. Monsoon wind systems exist in other regions of the world, such as in Australia, Africa, and North and South America, where large contrasts in temperature develop between oceans and continents. (Usually, however, these systems are not as pronounced as in southeast Asia.) For example, a monsoonlike circulation exists in the southwestern United States, especially in Arizona, New Mexico, Nevada, and the southern part of California, where spring and early summer are normally dry, as warm westerly winds sweep over the region. By mid- July, however, southerly or southeasterly winds are more common, and so are afternoon showers and thunderstorms (see Fig and Fig. 7.11). NOAA FIGURE 7.10 Enhanced infrared satellite image with heavy arrow showing strong monsoonal circulation. Moist, southerly winds are causing showers and thunderstorms (yellow and red areas) to form over the southwestern section of the United States during July, part of the world. With a population of over 900 million people, India depends heavily on the summer rains so that food crops will grow. The people also depend on the rains for drinking water. Unfortunately, the monsoon can be unreliable in both duration and intensity. Since the monsoon is vital to the survival of so many people, MOUNTAIN AND VALLEY BREEZES Mountain and valley breezes develop along mountain slopes. Observe in Fig that, during the day, sunlight warms the valley walls, which in turn warm the air in contact with them. The heated air, being less dense than the air of the same altitude above the valley, rises as a gentle upslope wind known as a valley breeze. At night, the flow reverses. The mountain slopes cool quickly, chilling the air in contact with them. The cooler, more-dense air glides downslope into the valley, providing a mountain breeze. (Because gravity is the force that directs these winds downhill, they are also referred to as gravity winds, or nocturnal drainage winds.) This daily cycle of FIGURE 7.11 Clouds and thunderstorms forming over Arizona, as humid monsoonal air flows northward over the region during July, C. Donald Ahrens
 wind flow is best developed in clear, summer weather when prevailing winds are light.")

12 Local Wind Systems 187 FIGURE 7.12 Valley breezes blow uphill during the day; mountain breezes blow downhill at night. (The L s and H s represent pressure, whereas the purple lines represent surfaces of constant pressure.) wind flow is best developed in clear, summer weather when prevailing winds are light. When the upslope valley winds are well developed and have sufficient moisture, they can reveal themselves as building cumulus clouds above mountain summits (see Fig. 7.13). Since valley breezes usually reach their maximum strength in the early afternoon, cloudiness, showers, and even thunderstorms are common over mountains during the warmest part of the day a fact well known to climbers, hikers, and seasoned mountain picnickers. KATABATIC WINDS Although any downslope wind is technically a katabatic wind, the name is usually reserved for downslope winds that are much stronger than mountain breezes. Katabatic (or fall) winds can rush down elevated slopes at hurricane speeds, but most are not that intense and many are on the order of 10 knots or less. The ideal setting for a katabatic wind is an elevated plateau surrounded by mountains, with an opening that slopes rapidly downhill (see Fig. 7.14). When winter snows accumulate on the plateau, the overlying C. Donald Ahrens FIGURE 7.13 As mountain slopes warm during the day, air rises and often condenses into cumuliform clouds, such as these.


13 188 Chapter 7 Atmospheric Circulations Strong downslope katabatic-type winds funneled through a mountain canyon can do extensive damage. During January, 1984, a ferocious down slope wind blew through Yosemite National Park in California at speeds estimated at 100 knots. The wind toppled trees and, unfortunately, caused a fatality when a tree fell on a park employee sleeping in a tent. FIGURE 7.14 Strong katabatic winds can form where cold winds rush downhill from an elevated plateau covered with snow. air grows extremely cold. Along the edge of the plateau the cold, dense air begins to descend through gaps and saddles in the hills, usually as a gentle or moderate cold breeze. If the breeze, however, is confined to a narrow canyon or channel, the flow of air can increase, often destructively, as cold air rushes downslope like water flowing over a fall. Katabatic winds are observed in various regions of the world. For example, along the northern Adriatic coast in the former Yugoslavia, a polar invasion of cold air from Russia descends the slopes from a high plateau and reaches the lowlands as the bora a cold, gusty, northeasterly wind with speeds sometimes in excess of 100 knots. A similar, but often less violent, cold wind known as the mistral descends the western mountains into the Rhone Valley of France, and then out over the Mediterranean Sea. It frequently causes frost damage to exposed vineyards and makes people bundle up in the otherwise mild climate along the Riviera. Strong, cold katabatic winds also blow downslope off the icecaps in Greenland and Antarctica, occasionally with speeds greater than 100 knots. In North America, when cold air accumulates over the Columbia plateau,* it may flow westward through the Columbia River Gorge as a strong, gusty, and sometimes violent wind. Even though the sinking air warms by compression, it is so cold to begin with that it reaches the ocean side of the Cascade Mountains much colder than the marine air it replaces. The Columbia Gorge wind (called the coho) is often the harbinger of a prolonged cold spell. *Information on geographic features and their location in North America is provided at the back of the book. CHINOOK (FOEHN) WINDS The chinook wind is a warm, dry wind that descends the eastern slope of the Rocky Mountains. The region of the chinook is rather narrow and extends from northeastern New Mexico northward into Canada. Similar winds occur along the leeward slopes of mountains in other regions of the world. In the European Alps, for example, such a wind is called a foehn. When these winds move through an area, the temperature rises sharply, sometimes 20 C (36 F) or more in one hour, and a corresponding sharp drop in the relative humidity occurs, occasionally to less than 5 percent. (More information on temperature changes associated with chinooks is given in the Focus section on p. 189.) Chinooks occur when strong westerly winds aloft flow over a north-south trending mountain range, such as the Rockies and Cascades. Such conditions can produce a trough of low pressure on the mountain s eastern side, a trough that tends to force the air downslope. As the air descends, it is compressed and warms. So the main source of warmth for a chinook is compressional heating, as potentially warmer (and drier) air is brought down from aloft. When clouds and precipitation occur on the mountain s windward side, they can enhance the chinook. For example, as the cloud forms on the upwind side of the mountain in Fig. 7.15, the release of latent heat inside the cloud supplements the compressional heating on the downwind side. This phenomenon makes the descend- Active FIGURE 7.15 A chinook wind can be enhanced when clouds form on the mountain s windward side. Heat added and moisture lost on the upwind side produce warmer and drier air on the downwind side.

14 Local Wind Systems 189 FOCUS ON A SPECIAL TOPIC Snow Eaters and Rapid Temperature Changes Chinooks are thirsty winds. As they move over a heavy snow cover, they can melt and evaporate a foot of snow in less than a day. This situation has led to some tall tales about these so-called "snow eaters." Canadian folklore has it that a sled-driving traveler once tried to outrun a chinook. During the entire ordeal his front runners were in snow while his back runners were on bare soil. Actually, the chinook is important economically. It not only brings relief from the winter cold, but it uncovers prairie grass, so that livestock can graze on the open range. Also, these warm winds have kept railroad tracks clear of snow, so that trains can keep running. On the other hand, the drying effect of a chinook can create an extreme fire hazard. And when a chinook follows spring planting, the seeds may die in the parched soil. Along with the dry air comes a buildup of static electricity, making a simple handshake a shocking experience. These warm, dry winds have sometimes adversely affected human behavior. During periods of chinook winds some people feel irritable and depressed and others become ill. The exact reason for this phenomenon is not clearly understood. Chinook winds have been associated with rapid temperature changes. In fact, on January 11, 1980, due to a chinook wind, the air temperature in Great Falls, Montana, rose from 32 F to 17 F (a 49 F rise in temperature) in just seven minutes. How such rapid changes in temperature can occur is illustrated in Fig. 3. Notice that a shallow layer of extremely cold air has moved out of Canada and is now resting against the Rocky Mountains. The cold air behaves just as any fluid, and, in some cases, atmospheric conditions may cause the air to move up and down much like water does when a bowl is rocked back and forth. This rocking motion can cause extreme temperature variations for cities located at the base of the hills along the periphery of the cold air warm air boundary, as they are alternately in and then out of the cold air. Such a situation is held to be responsible for the extremely rapid twominute temperature change of 49 F recorded at Spearfish, South Dakota, during the morning of January 22, On the same morning, in nearby Rapid City, the temperature fluctuated from 4 F at 5:30 a.m. to 54 F at 9:40 a.m., then down to 11 F at 10:30 a.m. and up to 55 F just 15 minutes later. At nearby cities, the undulating cold air produced similar temperature variations that lasted for several hours. FIGURE 3 Cities near the warm air cold air boundary can experience sharp temperature changes if cold air should rock up and down like water in a bowl. ing air at the base of the mountain on the downwind side warmer than it was before it started its upward journey on the windward side. The air is also drier, since much of its moisture was removed as precipitation on the windward side. View this concept in action at the CourseMate website at Along the front range of the Rockies, a bank of clouds forming over the mountains is a telltale sign of an impending chinook. This chinook wall cloud (which looks like a wall of clouds) usually remains stationary as air rises, condenses, and then rapidly descends the leeward slopes, often causing strong winds in foothill communities. In fact, these strong winds are especially notorious in winter in Boulder, Colorado, where the average yearly windstorm damage is about $1 million. Figure 7.16 shows how a chinook wall cloud appears as one looks west toward the Rockies from the Colorado plains. The photograph was taken on a winter afternoon with the air temperature about 7 C (20 F). That evening, the chi-
.")

15 190 Chapter 7 Atmospheric Circulations C. Donald Ahrens FIGURE 7.16 A chinook wall cloud forming over the Colorado Rockies (viewed from the plains). nook moved downslope at high speeds through foothill valleys, picking up sand and pebbles (which dented cars and cracked windshields). The chinook spread out over the plains like a warm blanket, raising the air temperature the following day to a mild 15 C (59 F). The chinook and its wall of clouds remained for several days, bringing with it a welcomed break from the cold grasp of winter. SANTA ANA WINDS A warm, dry wind that blows from the east or northeast into southern California is the Santa Ana wind. As the air descends from the elevated desert plateau, it funnels through mountain canyons in the San Gabriel and San Bernardino Mountains, finally spreading over the Los Angeles Basin and San Fernando Valley and out over the Pacific Ocean (see Fig. 7.17). The wind often blows with exceptional speed occasionally over 90 knots in the Santa Ana Canyon (the canyon from which it derives its name). These warm, dry winds develop as a region of high pressure builds over the Great Basin. The clockwise circulation around the anticyclone forces air downslope from the high plateau. Thus, compressional heating provides the primary source of warming. The air is dry, since it originated in the desert, and it dries out even more as it is heated. Figure 7.18 shows a typical wintertime Santa Ana situation. As the wind rushes through canyon passes, it lifts dust and sand and dries out vegetation, which sets the stage for serious brush fires, especially in autumn, when chaparral-covered hills are already parched from the dry summer.* One such fire in November of 1961 the infamous Bel Air fire burned for three days, destroying 484 homes and causing over $25 million in *Chaparral denotes a shrubby environment, in which many of the plant species contain highly flammable oils. FIGURE 7.17 Warm, dry Santa Ana winds sweep downhill through mountain canyons into Southern California. The large H represents higher air pressure over the elevated desert.


16 Local Wind Systems 191 DID YOU KNOW? The huge wildfires during October, 2007, caused the largest evacuation in California history, forcing more than 500,000 people to flee their homes. The fires charred over 800 square miles, an area about three-fourths the size of Rhode Island. damage. During October, 2003, massive wildfires driven by strong Santa Ana winds swept through Southern California. The fires charred more than 740,000 acres, destroyed over 2800 homes, took 20 lives, and caused over $1 billion in property damage. Only four years later (and after one of the driest years on record) in October, 2007, wildfires broke out again in Southern California. Pushed on by hellacious Santa Ana winds that gusted to over 80 knots, the fires raced through dry vegetation, scorching everything in their paths. The fires, which extended from north of Los Angeles to the Mexican border (see Fig. 7.19), burned over 500,000 acres, destroyed more than 1800 homes, and took 8 lives. The total costs of the fires exceeded $1.5 billion. Four hundred miles to the north in Oakland, California, a ferocious Santa Ana type wind was responsible for the disastrous Oakland hills fire during October, 1991, that damaged or destroyed over 3000 dwellings, caused almost $5 billion in damage, and took 25 lives. With the protective vegetation cover removed, the land is ripe for erosion, as winter rains may wash away topsoil and, in some areas, create serious mudslides. The adverse effects of a wind-driven Santa Ana fire may be felt long after the fire itself has been put out. DESERT WINDS Winds of all sizes develop over the desert. Huge duststorms form in dry regions, where strong winds are able to lift and fill the air with particles of fine dust. An exceptionally large duststorm (about the size of Spain) during February, 2001, formed over the African Sahara, then swept westward off the African coast, then northeastward for thousands of miles. During the drought years of the 1930s, large duststorms formed over the Great Plains of the United States. Some individual storms lasted for three days and spread dust for hundreds of miles over the Atlantic Ocean. In desert areas where loose sand is more prevalent, sandstorms develop, as high winds enhanced by surface heating rapidly carry sand particles close to the ground. A spectacular example of a storm composed of dust or sand is the haboob (from Arabic hebbe: blown). The haboob forms as cold downdrafts along the leading edge of a thunderstorm lift dust or sand into a huge, tumbling dark cloud that may extend horizontally for over a hundred kilometers and rise vertically to the base of the FIGURE 7.18 Surface weather map showing Santa Ana conditions in January. Maximum temperatures for this particular day are given in F. Observe that the downslope winds blowing into southern California raised temperatures into the upper 80s, while elsewhere temperature readings were much lower. FIGURE 7.19 Strong northeasterly Santa Ana winds on October 23, 2007, blew the smoke from massive wild fires (red dots) across southern California out over the Pacific Ocean. thunderstorm (see Fig. 7.20). Haboobs are most common in the African Sudan (where about twenty-four occur each year) and in the desert southwest of the United States, especially in southern Arizona. On a smaller scale, in dry areas, the wind may also produce rising, spinning columns of air that pick up dust


17 192 Chapter 7 Atmospheric Circulations FIGURE 7.20 An haboob approaching Phoenix, Arizona. The dust cloud is rising to a height of about 450 m (1475 ft) above the valley floor. NOAA or sand from the ground. Called dust devils or whirlwinds,* these rotating vortices generally form on clear, hot days over a dry surface where most of the sunlight goes into heating the surface, rather than evaporating water from vegetation. The atmosphere directly above the hot surface becomes unstable, convection sets in, and the heated air rises. Wind, often deflected by small topographic barriers, flows into this region, rotating the rising *In Australia, the Aboriginal word willy-willy refers to a dust devil. air as depicted in Fig Depending on the nature of the topographic feature, the spin of a dust devil around its central core may be cyclonic or anticyclonic, and both directions occur with about equal frequency. Having diameters of usually less than 10 feet and heights of less than 300 feet (see Fig. 7.22), most dust devils are small and last only a short time. There are, however, some dust devils of sizable dimension, extending upward from the surface for many hundreds of feet. Such whirlwinds are capable of considerable damage; Active FIGURE 7.21 The formation of a dust devil. On a hot, dry day, the atmosphere next to the ground becomes unstable. As the heated air rises, wind blowing past an obstruction twists the rising air, forming a rotating column, or dust devil. Air from the sides rushes into the rising column, lifting sand, dust, leaves, or any other loose material from the surface.

18 Global Winds 193 winds exceeding 75 knots may overturn mobile homes and tear the roofs off buildings. Fortunately, the majority of dust devils are small. Also keep in mind that dust devils are not tornadoes. The circulation of many tornadoes (as we will see in Chapter 10) usually descends downward from the base of a thunderstorm, whereas the circulation of a dust devil begins at the surface, normally in sunny weather, although some form beneath convective-type clouds. Desert winds are not confined to planet Earth; they form on the planet Mars as well. Most of the Martian duststorms are small, and only cover a relatively small portion of that planet. However, during 2001 an enormous duststorm developed that actually wrapped itself around the entire planet. Dust devils also form on Mars when high winds sweep over uneven terrain. Global Winds Up to now, we have seen that local winds vary considerably from day to day and from season to season. As you may suspect, these winds are part of a much larger circulation the little whirls within larger whirls that we spoke of earlier in this chapter. Indeed, if the rotating high- and low-pressure areas in our atmosphere are like spinning eddies in a huge river, then the flow of air around the globe is like the meandering river itself. When winds throughout the world are averaged over a long period of time, the local wind patterns vanish, and what we see is a picture of the winds on a global scale what is commonly called the general circulation of the atmosphere. GENERAL CIRCULATION OF THE ATMOSPHERE Before we study the general circulation, we must remember that it only represents the average air flow around the world. Actual winds at any one place and at any given time may vary considerably from this average. Nevertheless, the average can answer why and how the winds blow around the world the way they do why, for example, prevailing surface winds are northeasterly in Honolulu, Hawaii, and westerly in New York City. The average can also give a picture of the driving mechanism behind these winds, as well as a model of how heat is transported from equatorial regions poleward, keeping the climate in middle latitudes tolerable. The underlying cause of the general circulation is the unequal heating of the earth s surface. We learned in Chapter 2 that, averaged over the entire earth, incoming solar radiation is roughly equal to outgoing earth radiation. However, we also know that this energy balance is Nilton Renno FIGURE 7.22 A well-developed dust devil forms over a hot desert landscape on a clear summer day. not maintained for each latitude, since the tropics experience a net gain in energy, while polar regions suffer a net loss. To balance these inequities, the atmosphere transports warm air poleward and cool air equatorward. Although seemingly simple, the actual flow of air is complex; certainly not everything is known about it. In order to better understand it, we will first look at some models (that is, artificially constructed analogies) that eliminate some of the complexities of the general circulation. SINGLE-CELL MODEL The first model is the singlecell model, in which we assume that: 1. The earth s surface is uniformly covered with water (so that differential heating between land and water does not come into play). 2. The sun is always directly over the equator (so that the winds will not shift seasonally). 3. The earth does not rotate (so that the only force we need deal with is the pressure gradient force). With these assumptions, the general circulation of the atmosphere on the side of the earth facing the sun would look much like the representation in
 shows the general circulation of air on the side of the earth facing the sun on a nonrotating earth uniformly covered with water and with the sun directly above the equator.")
19 194 Chapter 7 Atmospheric Circulations FIGURE 7.23 Diagram (a) shows the general circulation of air on the side of the earth facing the sun on a nonrotating earth uniformly covered with water and with the sun directly above the equator. (Vertical air motions are highly exaggerated in the vertical.) Diagram (b) shows the names that apply to the different regions of the world and their approximate latitudes. Fig. 7.23a a huge thermally driven convection cell in each hemisphere. (For reference, the names of the different regions of the world and their approximate latitudes are given in Figure 7.23b.) The circulation of air described in Fig. 7.23a is the Hadley cell (named after the eighteenth-century English meteorologist George Hadley, who first proposed the idea). It is driven by energy from the sun. Excessive heating of the equatorial area produces a broad region of surface low pressure, while at the poles excessive cooling creates a region of surface high pressure. In response to the horizontal pressure gradient, cold surface polar air flows equatorward, while at higher levels air flows toward the poles. The entire circulation consists of a closed loop with rising air near the equator, sinking air over the poles, an equatorward flow of air near the surface, and a return flow aloft. In this manner, some of the excess energy of the tropics is transported as sensible and latent heat to the regions of energy deficit at the poles. Such a simple cellular circulation as this does not actually exist on the earth. For one thing, the earth rotates, so the Coriolis force would deflect the southwardmoving surface air in the Northern Hemisphere to the right, producing easterly surface winds at practically all latitudes. These winds would be moving in a direction opposite to that of the earth s rotation and, due to friction with the surface, would slow down the earth s spin. We know that this does not happen and that prevailing winds in middle latitudes actually blow from the west. Therefore, observations alone tell us that a closed circulation of air between the equator and the poles is not the proper model for a rotating earth. But this model does show us how a non-rotating planet would balance an excess of energy at the equator and a deficit at the poles. How, then, does the wind blow on a rotating planet? To answer, we will keep our model simple by retaining our first two assumptions that is, that the earth is covered with water and that the sun is always directly above the equator. THREE-CELL MODEL If we allow the earth to spin, the simple convection system breaks into a series of cells as shown in Fig Although this model is considerably more complex than the single-cell model, there are some similarities. The tropical regions still receive an excess of heat and the poles a deficit. In each hemisphere, three cells instead of one have the task of energy redistribution. A surface high-pressure area is located at the poles, and a broad trough of surface low pressure still exists at the equator. From the equator to latitude 30, the circulation is the Hadley cell. Let s look at this model more closely by examining what happens to the air above the equator. (Refer to Fig as you read the following section.) Over equatorial waters, the air is warm, horizontal pressure gradients are weak, and winds are light. This region is referred to as the doldrums. (The monotony of the weather in this area has given rise to the expression down in the doldrums. ) Here, warm air rises, often condensing

20 Global Winds 195 into huge cumulus clouds and thunderstorms that liberate an enormous amount of latent heat. This heat makes the air more buoyant and provides energy to drive the Hadley cell. The rising air reaches the tropopause, which acts like a barrier, causing the air to move laterally toward the poles. The Coriolis force deflects this poleward flow toward the right in the Northern Hemisphere and to the left in the Southern Hemisphere, providing westerly winds aloft in both hemispheres. (We will see later that these westerly winds reach maximum velocity and produce jet streams near 30 latitude and 60 latitude.) Air aloft moving poleward from the tropics constantly cools by giving up infrared radiation, and at the same time it also begins to converge, especially as it approaches the middle latitudes.* This convergence (piling up) of air aloft increases the mass of air above the surface, which in turn causes the air pressure at the surface to increase. Hence, at latitudes near 30, the convergence of air aloft produces belts of high pressure called subtropical highs (or anticyclones). As the converging, relatively dry air above the highs slowly descends, it warms by compression. This subsiding air produces generally clear skies and warm surface temperatures; hence, on earth it is here that we find the major deserts of the world, such as the *You can see why the air converges if you have a globe of the world. Put your fingers on meridian lines at the equator and then follow the meridians poleward. Notice how the lines and your fingers bunch together in the middle latitudes. Sahara of Africa and the Sonoran of North America (see Fig. 7.25). Over the ocean, the weak pressure gradients in the center of the high produce only weak winds. According to legend, sailing ships traveling to the New World were frequently becalmed in this region; and, as food and supplies dwindled, horses were either thrown overboard or eaten. As a consequence, this region is sometimes called the horse latitudes. From the horse latitudes near latitude 30, some of the surface air moves back toward the equator. It does not flow straight back, however, because the Coriolis force deflects the air, causing it to blow from the northeast in the Northern Hemisphere and from the southeast in the Southern Hemisphere. These steady winds provided sailing ships with an ocean route to the New World; hence, these winds are called the trade winds. Near the equator, the northeast trades converge with the southeast trades along a boundary called the intertropical convergence zone (ITCZ). In this region of surface convergence, air rises and continues its cellular journey. Along the ITCZ, it is usually very wet as the rising air develops into huge thunderstorms that drop copious amounts of rain in the form of heavy showers (see Fig. 7.26). Meanwhile, at latitude 30, not all of the surface air moves equatorward. Some air moves toward the poles and deflects toward the east, resulting in a more or less westerly air flow called the prevailing westerlies, or, Active FIGURE 7.24 The idealized wind and surfacepressure distribution over a uniformly water-covered rotating earth.


21 196 Chapter 7 Atmospheric Circulations FIGURE 7.25 Subtropical deserts, such as the one shown here, are mainly the result of sinking air associated with subtropical high-pressure areas. Image copyright Harris Shiffman, Used under license from Shutterstock.com FIGURE 7.26 The solid red line in this visible satellite image marks the position of the ITCZ in the eastern Pacific. The bright white clouds are huge thunderstorms forming along the ITCZ. NASA simply, westerlies in both hemispheres. Consequently, from Texas northward into Canada, it is much more common to experience winds blowing out of the west than from the east. The westerly flow in the real world is not constant as migrating areas of high and low pressure break up the surface flow pattern from time to time. In the middle latitudes of the Southern Hemisphere, where the surface is mostly water, winds blow more steadily from the west. As this mild air travels poleward, it encounters cold air moving down from the poles. These two air masses of contrasting temperature do not readily mix. They are separated by a boundary called the polar front, a zone of low pressure the subpolar low where surface air converges and rises, and storms and clouds develop. In our model in Fig. 7.24, some of the rising air returns at high levels to the horse latitudes, where it sinks back to the surface in the vicinity of the subtropical high. This middle cell (called the Ferrel cell, after the American meteorologist William Ferrel) is completed when surface air from the horse latitudes flows poleward toward the polar front. Notice in Fig that, in the Northern Hemisphere, behind the polar front the cold air from the poles is
22 deflected by the Coriolis force, so that the general flow of air is from the northeast. Hence, this is the region of the polar easterlies. In winter, the polar front, with its cold air, can move into middle and subtropical latitudes, producing a cold polar outbreak. Along the front, a portion of the rising air moves poleward, and the Coriolis force deflects the air into a westerly wind at high levels. Air aloft eventually reaches the poles, slowly sinks to the surface, and flows back toward the polar front, completing the weak polar cell. We can summarize all of this by referring back to Fig on p. 195 and noting that, at the surface, there are two major areas of high pressure and two major areas of low pressure. Areas of high pressure exist near latitude 30 and the poles; areas of low pressure exist over the equator and near 60 latitude in the vicinity of the polar front. Knowing the way the surface winds blow around these pressure systems on the three-cell model, gives us a generalized picture of how surface winds blow throughout the world. The trade winds extend from the subtropical high to the equator, the westerlies from the subtropical high to the polar front, and the polar easterlies from the poles to the polar front. How does this three-cell model compare with actual observations of winds and pressure in the real world? We know, for example, that upper-level winds at middle latitudes generally blow from the west. The middle cell in our model, however, suggests an east wind aloft as air flows equatorward. Hence, discrepancies exist between this model and atmospheric observations. This model does, however, agree closely with the winds and pressure distribution at the surface, and so we will examine this next. AVERAGE SURFACE WINDS AND PRESSURE: THE REAL WORLD When we examine the real world with its continents and oceans, mountains and ice fields, we obtain an average distribution of sea-level pressure and winds for January and July, as shown in Figs. 7.27a and 7.27b. Look closely at both maps and observe that there are regions where pressure systems appear to persist throughout the year. These systems are referred to as semipermanent highs and lows because they move only slightly during the course of a year. In Fig. 7.27a, we can see that there are four semipermanent pressure systems in the Northern Hemisphere during January. In the eastern Atlantic, between latitudes 25 and 35 N is the Bermuda-Azores high, often called the Bermuda high, and, in the Pacific Ocean, its counterpart, the Pacific high. These are the subtropical anticyclones that develop in response to the convergence of air aloft. Since surface winds blow clockwise DID YOU KNOW? Global Winds 197 Christopher Columbus was a lucky man. The year he set sail for the New World, the trade winds had edged unusually far north, and a steady northeast wind glided his ships along. Only for about ten days did he encounter the light and variable wind, more typical of this notorious region (30 N) the horse latitudes. around these systems, we find the trade winds to the south and the prevailing westerlies to the north. In the Southern Hemisphere, where there is relatively less land area, there is less contrast between land and water, and the subtropical highs show up as well-developed systems with a clearly defined circulation. Where we would expect to observe the polar front (between latitudes 40 and 65 ), there are two semipermanent subpolar lows. In the North Atlantic, there is the Greenland-Icelandic low, or simply Icelandic low, which covers Iceland and southern Greenland, while the Aleutian low sits over the Gulf of Alaska and the Bering Sea near the Aleutian Islands in the North Pacific. These zones of cyclonic activity actually represent regions where numerous storms, having traveled eastward, tend to converge, especially in winter. In the Southern Hemisphere, the subpolar low forms a continuous trough that completely encircles the globe. On the January map (Fig. 7.27a), there are other pressure systems, which are not semipermanent in nature. Over Asia, for example, there is a huge (but shallow) thermal anticyclone called the Siberian high, which forms because of the intense cooling of the land. South of this system, the winter monsoon shows up clearly, as air flows away from the high across Asia and out over the ocean. A similar (but less intense) anticyclone (called the Canadian high) is evident over North America. As summer approaches, the land warms and the cold, shallow highs disappear. In some regions, areas of surface low pressure replace areas of high pressure. The lows that form over the warm land are shallow thermal lows. On the July map (Fig. 7.27b), warm thermal lows are found over the desert southwest of the United States, over the plateau of Iran, and north of India. As the thermal low over India intensifies, warm, moist air from the ocean is drawn into it, producing the wet summer monsoon so characteristic of India and Southeast Asia. When we compare the January and July maps, we can see several changes in the semipermanent pressure systems. The strong subpolar lows so well developed in January over the Northern Hemisphere are hardly discernible on the July map. The subtropical highs,

.")
23 198 Chapter 7 Atmospheric Circulations FIGURE 7.27 Average sea-level pressure distribution and surface wind-flow patterns for January (a) and for July (b). The solid red line represents the position of the ITCZ.

")
24 Global Winds 199 however, remain dominant in both seasons. Because the sun is overhead in the Northern Hemisphere in July and overhead in the Southern Hemisphere in January, the zone of maximum surface heating shifts seasonally. In response to this shift, the major pressure systems, wind belts, and ITCZ (heavy red line in Fig. 7.27) shift toward the north in July and toward the south in January.* THE GENERAL CIRCULATION AND PRECIPITA- TION PATTERNS The position of the major features of the general circulation and their latitudinal displacement (which annually averages about 10 to 15 ) strongly influence the climate of many areas. For example, on the global scale, we would expect abundant rainfall where the air rises and very little where the air sinks. Consequently, areas of high rainfall exist in the tropics, where humid air rises in conjunction with the ITCZ, and between 40 and 55 latitude, where middle-latitude storms and the polar front force air upward. Areas of low rainfall are found near 30 latitude in the vicinity of the subtropical highs and in polar regions where the air is cold and dry (see Fig. 7.28). During the summer, the Pacific high drifts northward to a position off the California coast (see Fig. 7.29). Sinking air on its eastern side produces a strong upper-level subsidence inversion, which tends to keep summer weather along the West Coast relatively dry. The rainy season typically occurs in winter when the high moves south and storms are able to penetrate the region. Observe in Fig that along the East Coast, the clockwise circulation of winds around the Bermuda high brings warm, tropical air northward into the United States and southern Canada from the Gulf of Mexico and the Atlantic Ocean. Because sinking air is not as well developed on this side of the high, the humid *An easy way to remember the seasonal shift of surface pressure systems is to think of birds in the Northern Hemisphere, they migrate south in the winter and north in the summer. FIGURE 7.28 Rising and sinking air associated with the major pressure systems of the earth s general circulation. Where the air rises, precipitation tends to be abundant (blue shade); where the air sinks, drier regions prevail (tan shade). Note that the sinking air of the subtropical highs produces the major desert regions of the world. air can rise and condense into towering cumulus clouds and thunderstorms. So, in part, it is the air motions associated with the subtropical highs that keep summer weather dry in California and moist in Georgia. (Compare the rainfall patterns for Los Angeles, California, and Atlanta, Georgia, in Fig ) WESTERLY WINDS AND THE JET STREAM In Chapter 6, we learned that the winds above the middle latitudes in both hemispheres blow in a wavy west-toeast direction. The reason for these westerly winds is that, aloft, we generally find higher pressure over equatorial regions and lower pressures over polar regions. Where these upper-level winds tend to concentrate into FIGURE 7.29 During the summer, the Pacific high moves northward. Sinking air along its eastern margin (over California) produces a strong subsidence inversion, which causes relatively dry weather to prevail. Along the western margin of the Bermuda high, southerly winds bring in humid air, which rises, condenses, and produces abundant rainfall.


25 200 Chapter 7 Atmospheric Circulations FIGURE 7.30 Average annual precipitation for Los Angeles, California, and Atlanta, Georgia. narrow bands, we find rivers of fast-flowing air what we call jet streams. Atmospheric jet streams are swiftly flowing air currents hundreds of miles long, normally less than several hundred miles wide, and typically less than a mile thick. Wind speeds in the central core of a jet stream often exceed 100 knots and occasionally 200 knots. Jet streams are usually found at the tropopause at elevations between 10 and 14 km (33,000 and 46,000 ft) although they may occur at both higher and lower altitudes. Jet streams were first encountered by high-flying military aircraft during World War II, but their existence was suspected before that time. Ground-based observations of fast-moving cirrus clouds had revealed that westerly winds aloft must be moving rapidly indeed. Figure 7.31 illustrates the average position of the jet streams and general circulation of air for the Northern Hemisphere in winter. From this diagram, we can see that there are two jet streams, both located in tropopause gaps, where mixing between tropospheric and stratospheric air takes place. The jet stream situated near 30 latitude at about 13 km (43,000 ft) above the subtropical high is the subtropical jet stream.* To the north, the jet stream situated at about 10 km (33,000 ft) near the polar front is known as the polar front jet stream or, simply, the polar jet stream. In Fig. 7.31, the wind in the center of the jet stream would be flowing as a westerly wind away from the viewer. This direction, of course, is only an average, as jet streams often flow in a wavy west-to-east pattern. When the polar jet stream flows in broad loops that sweep north and south, it may even merge with the subtropical jet. Occasionally, the polar jet splits into two jet streams. The jet stream to the north is often called the northern branch of the polar jet, whereas the one to the south is called the southern branch. Since jet streams are bands of strong winds, they form in the same manner as all winds do from horizontal differences in air pressure. In Fig. 7.31, notice that the polar jet stream forms along the polar front where sharp contrasts in temperature produce rapid horizontal pressure changes and strong winds. Due to the fact that the north-to-south temperature contrasts along the front are greater in winter than they are in summer, the polar jet stream shows seasonal variations. In winter, the polar jet stream winds are stronger and the jet moves farther south, sometimes as far south as Florida and Southern California. In summer, the polar jet stream is weaker and forms over higher latitudes. Observe in Fig that the subtropical jet stream forms on the poleward (north) side of the Hadley cell, at a higher altitude than the polar jet stream. Here, warm *The subtropical jet stream is normally found between 20 and 30 latitude. FIGURE 7.31 Average position of the polar jet stream and the subtropical jet stream, with respect to a model of the general circulation in winter. Both jet streams are flowing from west to east.


26 Global Winds 201 DID YOU KNOW? Strong upper-level winds during April, 2010, blew tons of dust and ash from an Icelandic volcano over much of western Europe. The ash cloud closed most of the continent s airports for a week, which in turn affected more than a million passengers a day, and cost the airline industry more than $1.7 billion in lost revenues. Active FIGURE 7.32 Jet streams are swiftly flowing currents of air that move in a wavy west-to-east direction. The figure shows the position of the polar jet stream and subtropical jet stream in winter. Although jet streams are shown as one continuous river of air, in reality they are discontinuous, with their position varying from one day to the next. air aloft carried poleward by the Hadley cell produces sharp temperature differences, strong pressure gradients, and high winds. Figure 7.32 illustrates how the polar jet stream and the subtropical jet stream might appear as they sweep around the earth in winter. We can better see the looping pattern of the jet by studying Fig. 7.33a, which shows the position of the polar jet stream and the subtropical jet stream at the 300-mb level (near 9 km or 30,000 ft) on March 9, The fastest flowing air, or jet core, is represented by the heavy dark arrows. The map shows a strong polar jet stream sweeping south over the Great Plains with an equally strong subtropical jet over the Gulf states. Notice that the polar jet has a number of loops, with one off the west coast of North America and another over eastern Canada. Observe in the satellite image (Fig. 7.33b) that the polar jet stream (blue arrow) is directing cold, polar air into the Plains States, while the subtropical jet stream (orange arrow) is sweeping subtropical moisture, in the form of a dense cloud cover, over the southeastern states. The looping pattern of the polar jet stream has an important function. In the Northern Hemisphere, where the air flows southward, swiftly moving air directs cold air equatorward; where the air flows northward, warm air is carried toward the poles. Jet streams, therefore, play a major role in the global transfer of heat. Moreover, since jet streams tend to meander around the world, we can easily understand how pollutants or volcanic ash injected into the atmosphere in one part of the globe could eventually settle to the ground many thousands of kilometers downwind. And, as we will see in FIGURE 7.33 (a) Position of the polar jet stream (blue arrows) and the subtropical jet stream (orange arrows) at the 300-mb level (about 9 km or 30,000 ft above sea level) on March 9, Solid lines are lines of equal wind speed (isotachs) in knots. (b) Satellite image showing clouds and positions of the jet streams for the same day.
27 202 Chapter 7 Atmospheric Circulations DID YOU KNOW? The jet stream is in part responsible for the only American casualties by enemy attack on the continental United States in World War II. During the war, when the existence of the jet stream was first confirmed, the Japanese attempted to drop bombs on the United States mainland by launching balloons that carried explosives and incendiary devices. The hydrogen-filled balloons drifted from Japan for thousands of miles across the Pacific Ocean at an altitude above 30,000 feet. Unfortunately, a group of six picnickers in Oregon found a balloon bomb in the woods and attempted to move it, which caused it to explode, killing all six people. Estimates are that as many as 300 balloon bombs may still be scattered throughout regions of the western United States. In the Northern Hemisphere, the major global pressure systems and wind belts shift northward in summer and southward in winter. The northward movement of the Pacific high in summer tends to keep summer weather along the west coast of North America relatively dry. Jet streams exist where strong winds become concentrated in narrow bands. The polar-front jet stream is associated with the polar front. The polar jet meanders in a wavy westto-east pattern, becoming strongest in winter when the contrast in temperature along the front is greatest. The subtropical jet stream is found on the poleward side of the Hadley cell, between 20 and 30 latitude. It is normally observed at a higher altitude than the polar jet stream. Chapter 8, the looping nature of the polar jet stream has an important role in the development of mid-latitude cyclonic storms. Although the polar and subtropical jets are the two most frequently in the news, there are other jet streams that deserve mentioning. For example, there is a lowlevel jet stream that forms just above the Central Plains of the United States. During the summer, this jet (which usually has peak winds of less than 60 knots) often contributes to the formation of nighttime thunderstorms by transporting moisture and warm air northward. Higher up in the atmosphere, over the subtropics, a summertime easterly jet called the tropical easterly jet forms at the base of the tropopause. And during the dark polar winter, a strato spheric polar jet forms near the top of the stratosphere. BRIEF REVIEW Before going on to the next section, which describes the many interactions between the atmosphere and the ocean, here is a review of some of the important concepts presented so far: The two major semipermanent subtropical highs that influence the weather of North America are the Pacific high situated off the west coast and the Bermuda high situated off the southeast coast. The polar front is a zone of low pressure where cyclonic storms often form. It separates the mild westerlies of the middle latitudes from the cold, polar easterlies of the high latitudes. In equatorial regions, the intertropical convergence zone (ITCZ) is a boundary where air rises in response to the convergence of the northeast trades and the southeast trades. Along the ITCZ huge thunderstorms produce heavy rain showers. Global Wind Patterns and the Oceans Although scientific understanding of all the interactions between the oceans and the atmosphere is far from complete, there are some relationships that deserve mentioning here. As the wind blows over the oceans, it causes the surface water to drift along with it. The moving water gradually piles up, creating pressure differences within the water itself. This leads to further motion several hundreds of meters down into the water. In this manner, the general wind flow around the globe starts the major surface ocean currents moving. The relationship between the general circulation and ocean currents can be seen by comparing Figs. 7.27a and b (p. 198) and Fig (p. 203). Because of the larger frictional drag in water, ocean currents move more slowly than the prevailing winds above. Typically, they range in speed from several kilometers per day to several kilometers per hour. In Fig. 7.34, we can see that ocean currents tend to spiral in semi-closed whirls. On the eastern edge of continents there is usually a warm current that flows from the equator to the pole. For example, in the North Atlantic, flowing northward along the east coast of the United States, is a tremendous warm water current called the Gulf Stream, which carries vast quantities of warm, tropical water into higher latitudes. Off the coast of North Carolina, the Gulf Stream provides warmth and moisture for developing mid- latitude cyclonic storms. Notice in Fig that as the Gulf Stream moves northward, the prevailing westerlies steer it away from the coast of North America and eastward toward Eu-

28 Global Wind Patterns and the Oceans 203 FIGURE 7.34 Average position and extent of the major surface ocean currents. Cold currents are shown in blue; warm currents are shown in red. rope. Generally, it widens and slows as it merges into the broader North Atlantic Drift. As this current approaches Europe, part of it flows northward along the coasts of Great Britain and Norway, bringing with it warm water (which helps keep winter temperatures much warmer than one would expect this far north). The other part flows southward as the Canary Current, which transports cool, northern water equatorward. In the Pacific Ocean, the counterpart to the Canary Current is the California Current that carries cool water southward along the coastline of the western United States. Hence, on the western edge of major continents, there is usually a cool current that flows from the pole toward the equator. Up to now, we have seen that atmospheric circulations and ocean circulations are closely linked; wind blowing over the oceans produces surface ocean currents. The currents, along with the wind, transfer heat from tropical areas, where there is a surplus of energy, to polar regions, where there is a deficit. This helps to equalize the latitudinal energy imbalance with about 40 percent of the total heat transport in the Northern Hemisphere coming from surface ocean currents. The environmental implications of this heat transfer are tremendous. If the energy imbalance were to go unchecked, yearly temperature differences between low and high latitudes would increase greatly, and the climate would gradually change. WINDS AND UPWELLING Earlier, we saw that the cool California Current flows roughly parallel to the west coast of North America. From this, we might conclude that summer surface water temperatures would be cool along the coast of Washington and gradually warm as we move south. A quick glance at the water temperatures along the west coast of the United States during August (see Fig. 7.35) quickly alters that notion. The coldest water is observed along the northern California coast near Cape Mendocino. The reason for the cold, coastal water is upwelling the rising of cold water from below.

 The water beneath the surface also moves, and it too bends slightly to its right.")
29 204 Chapter 7 Atmospheric Circulations FIGURE 7.35 Average sea surface temperatures ( F) along the west coast of North America during August. For upwelling to occur, the wind must flow more or less parallel to the coastline. Notice in Fig that summer winds tend to parallel the coastline of California. As the wind blows over the ocean, the surface water beneath it is set in motion. As the surface water moves, it bends slightly to its right due to the Coriolis effect. (Remember, it would bend to the left in the Southern Hemisphere.) The water beneath the surface also moves, and it too bends slightly to its right. The net effect of this phenomenon is that a rather shallow layer of surface water moves at right angles to the surface wind and heads seaward. As the surface water drifts away from the coast, cold, nutrient-rich water from below rises (upwells) to replace it. Upwelling is strongest and surface water is coolest where the wind parallels the coast, such as it does in summer along the coast of northern California. Because of the cold coastal water, summertime weather along the West Coast often consists of low clouds and fog, as the air over the water is chilled to its saturation point. On the brighter side, upwelling produces good fishing, as higher concentrations of nutrients are brought to the surface. But swimming is only for the hardiest of souls as the average surface water temperature along the coast of northern California in summer is nearly 10 C (18 F) colder than the average coastal water temperature found at the same latitude along the Atlantic coast. Between the ocean surface and the atmosphere, there is an exchange of heat and moisture that depends, in part, on temperature differences between water and air. In winter, when air-water temperature contrasts are greatest, there is a substantial transfer of sensible and latent heat from the ocean surface into the atmosphere. This energy helps to maintain the global airflow. Consequently, even a relatively small change in surface ocean temperatures could modify atmospheric circulations and have far-reaching effects on global weather patterns. The next section describes how weather events can be linked to surface ocean temperature changes in the tropical Pacific. EL NIÑO AND THE SOUTHERN OSCILLATION Along the west coast of South America, where the cool Peru Current sweeps northward, southerly winds promote upwelling of cold, nutrient-rich water that gives rise to large fish populations, especially anchovies. The abundance of fish supports a large population of sea birds whose droppings (called guano) produce huge phosphate-rich deposits, which support the fertilizer industry. Near the end of the calendar year, a warm current of nutrient-poor tropical water often moves southward, replacing the cold, nutrient-rich surface water. Because FIGURE 7.36 As winds blow parallel to the west coast of North America, surface water is transported to the right (out to sea). Cold water moves up from below (upwells) to replace the surface water. The large H represents the position of the Pacific High in summer. Blue arrows show the movement of water.
, under ordinary conditions higher pressure over the southeastern Pacific and lower pressure near Indonesia produce easterly trade winds along the equator.")
30 Global Wind Patterns and the Oceans 205 Active FIGURE 7.37 In diagram (a), under ordinary conditions higher pressure over the southeastern Pacific and lower pressure near Indonesia produce easterly trade winds along the equator. These winds promote upwelling and cooler ocean water in the eastern Pacific, while warmer water prevails in the western Pacific. The trades are part of a circulation (called the Walker circulation) that typically finds rising air and heavy rain over the western Pacific and sinking air and generally dry weather over the eastern Pacific. When the trades are exceptionally strong, water along the equator in the eastern Pacific becomes quite cool. This cool event is called La Niña. During El Niño conditions diagram (b) atmospheric pressure decreases over the eastern Pacific and rises over the western Pacific. This change in pressure causes the trades to weaken or reverse direction. This situation enhances the countercurrent that carries warm water from the west over a vast region of the eastern tropical Pacific. The thermocline, which separates the warm water of the upper ocean from the cold water below, changes as the ocean conditions change from non-el Niño to El Niño. this condition frequently occurs around Christmas, local residents call it El Niño (Spanish for boy child), referring to the Christ child. In most years, the warming lasts for only a few weeks to a month or more, after which weather patterns usually return to normal and fishing improves. However, when El Niño conditions last for many months, and a more extensive ocean warming occurs, the economic results can be catastrophic. This extremely warm episode, which occurs at irregular intervals of two to seven years and covers a large area of the tropical Pacific Ocean, is now referred to as a major El Niño event, or simply El Niño.* During a major El Niño event, large numbers of fish and marine plants may die. Dead fish and birds may litter the water and beaches of Peru; their decomposing carcasses deplete the water s oxygen supply, which leads to the bacterial production of huge amounts of smelly hydrogen sulfide. The El Niño of reduced *It was thought that El Niño was a local event that occurs along the west coast of Peru and Ecuador. It is now known that the ocean-warming associated with a major El Niño can cover an area of the tropical Pacific much larger than the continental United States. the annual Peruvian anchovy catch from 10.3 million metric tons in 1971 to 4.6 million metric tons in Since much of the harvest of this fish is converted into fish meal and exported for use in feeding livestock and poultry, the world s fish meal production in 1972 was greatly reduced. Countries such as the United States that rely on fish meal for animal feed had to use soybeans as an alternative. This raised poultry prices in the United States by more than 40 percent. Why does the ocean become so warm over the eastern tropical Pacific? Normally, in the tropical Pacific Ocean, the trades are persistent winds that blow westward from a region of higher pressure over the eastern Pacific toward a region of lower pressure centered near Indonesia (see Fig. 7.37). The trades create upwelling that brings cold water to the surface. As this water moves westward, it is heated by sunlight and the atmosphere. Consequently, in the Pacific Ocean, surface water along the equator usually is cool in the east and warm in the west. In addition, the dragging of surface water by the trades raises sea level in the western Pacific and lowers it in the eastern Pacific, which produces a thick layer of
 extends from the coast of South America westward, across the Pacific.")
31 206 Chapter 7 Atmospheric Circulations FIGURE 7.38 (a) Average sea surface temperature departures from normal as measured by satellite. During El Niño conditions, upwelling is greatly diminished and warmer than normal water (deep red color) extends from the coast of South America westward, across the Pacific. (b) During La Niña conditions, strong trade winds promote upwelling, and cooler than normal water (dark blue color) extends over the eastern and central Pacific. (NOAA/PHEL/TAO) warm water over the tropical western Pacific Ocean and a weak ocean current (called the countercurrent) that flows slowly eastward toward South America. Every few years, the surface atmospheric pressure patterns break down, as air pressure rises over the region of the western Pacific and falls over the eastern Pacific (see Fig. 7.37b). This change in pressure weakens the trades, and, during strong pressure reversals, east winds are replaced by west winds. The west winds strengthen the countercurrent, causing warm water to head eastward toward South America over broad areas of the tropical Pacific. Toward the end of the warming period, which may last between one and two years, atmospheric pressure over the eastern Pacific reverses and begins to rise, whereas, over the western Pacific, it falls. This seesaw pattern of reversing surface air pressure at opposite ends of the Pacific Ocean is called the Southern Oscillation. Because the pressure reversals and ocean warming are more or less simultaneous, scientists call this phenomenon the El Niño/Southern Oscillation or ENSO for short. Although most ENSO episodes follow a similar evolution, each event has its own personality, differing in both strength and behavior. During especially strong ENSO events (such as in and ) the easterly trades may actually become westerly winds, as illustrated in Fig. 7.37b. As these winds push eastward, they drag surface water with them. This dragging raises sea level in the eastern Pacific and lowers sea level in the western Pacific. The eastward-moving water gradually warms under the tropical sun, becoming as much as 6 C (11 F) warmer than normal in the eastern equatorial Pacific. Gradually, a thick layer of warm water pushes into coastal areas of Ecuador and Peru, choking off the upwelling that supplies cold, nutrient-rich water to South America s coastal region. The unusually warm water may extend from South America s coastal region for many thousands of kilometers westward along the equator (see Fig. 7.38). Such a large area of abnormally warm water can have an effect on global wind patterns. The warm tropical water fuels the atmosphere with additional warmth and moisture, which the atmosphere turns into additional storminess and rainfall. The added warmth from the oceans and the release of latent heat during condensation apparently influence the westerly winds aloft in such a way that certain regions of the world experience too much rainfall, whereas others have too little. Meanwhile, over the warm tropical central Pacific, the frequency of typhoons usually increases. However, over the tropical Atlantic, between Africa and Central America, the winds aloft tend to disrupt the organization of thunderstorms that is necessary for hurricane development; hence, there are fewer hurricanes in this region during strong El Niño events. And, as we saw earlier in this chapter, during a strong El Niño, summer monsoon conditions tend to weaken over India, although this weakening did not happen during the strong El Niño of Although the actual mechanism by which changes in surface ocean temperatures influence global wind patterns is not fully understood, the by-products are plain to see. For example, during exceptionally warm El Niños, drought is normally felt in Indonesia, southern Africa, and Australia, while heavy rains and flooding often occur in Ecuador and Peru. In the Northern Hemisphere, a strong subtropical westerly jet stream normally directs storms into California and heavy rain into the Gulf Coast states. The total damage worldwide due to flooding, winds, and drought may exceed many billions of dollars.

32 Global Wind Patterns and the Oceans 207 Following an ENSO event, the trade winds usually return to normal. However, if the trades are exceptionally strong, unusually cold surface water moves over the central and eastern Pacific, as shown in Fig. 7.38b. Warm water and rainy weather is confined mainly to the western tropical Pacific. This cold-water episode, which is the opposite of El Niño conditions, has been termed La Niña (the girl child). As we have seen, El Niño and the Southern Oscillation are part of a large-scale ocean-atmosphere interaction that can take several years to run its course. During this time, there are certain regions in the world where significant climatic responses to an ENSO event are likely. Figure 7.39 shows how typical winter weather patterns over North America will change between El Niño conditions and La Niña conditions. Such oceanatmosphere interactions, where a warmer or colder ocean surface can influence weather patterns in distant parts of the world, are called teleconnections. Some scientists feel that the trigger necessary to start an ENSO event lies within the changing of the seasons, especially the transition periods of spring and fall. Others feel that the winter monsoon plays a major role in triggering a major El Niño event. As noted earlier, it appears that an ENSO episode and the monsoon system are intricately linked, so that a change in one brings about a change in the other. Presently, scientists (with the aid of coupled general circulation models) are trying to simulate atmospheric and oceanic conditions, so that El Niño and the Southern Oscillation can be anticipated. At this point, several models have been formulated that show promise in predicting the onset and life history of an ENSO event. In addition, in-depth studies of the tropical Pacific Ocean are providing scientists with valuable information about the interactions that occur between the ocean and the atmosphere. The primary aim of these ocean studies is to provide enough scientific information so that researchers can better predict climatic fluctuations (such as ENSO) that occur over periods of months and years. The hope is that a better understanding of El Niño and the Southern Oscillation will provide improved longrange forecasts of weather and climate. Up to this point, we have looked at El Niño and the Southern Oscillation, as well as how the reversal of surface ocean temperatures and atmospheric pressure combine to influence regional and global weather and climate patterns. There are other atmosphere-ocean inter actions that can have an effect on large-scale weather patterns. Some of these are described in the following section. OTHER ATMOSPHERE-OCEAN INTERACTIONS Is there a similar pattern in the Atlantic that compares to the Southern Oscillation in the Pacific? Over the Atlantic there is a reversal of pressure (called the North Atlantic Oscillation, or NAO) that has an effect on the weather in Europe and along the east coast of North America. For example, in winter if the atmospheric pressure in the vicinity of the Icelandic low drops, and the pressure in the region of the Bermuda-Azores high rises, there is a corresponding large difference in atmospheric pressure between these two regions that strengthens the westerlies. The strong westerlies in turn direct strong storms on a more northerly track into northern Europe, where winters tend to be wet and mild. During this positive phase of the NAO, winters in the eastern United States tend to be wet and relatively mild, while northern Canada and Greenland are usually cold and dry (see Fig. 7.40a). FIGURE 7.39 Typical winter weather patterns across North America during an El Niño warm event (a) and during a La Niña cold event (b). During El Niño conditions, a persistent trough of low pressure forms over the north Pacific and, to the south of the low, the jet stream (from off the Pacific) steers wet weather and storms into California and the southern part of the United States. During La Niña conditions, a persistent high-pressure area forms south of Alaska forcing the polar jet stream and accompanying cold air over much of western North America. The southern branch of the polar jet stream directs moist air from the ocean into the Pacific Northwest, producing a wet winter for that region.
 positive phase and (b) negative phase of the North Atlantic Oscillation.")
33 208 Chapter 7 Atmospheric Circulations FIGURE 7.40 Change in surface atmospheric pressure and typical winter weather patterns associated with the (a) positive phase and (b) negative phase of the North Atlantic Oscillation. The negative phase of the NAO occurs when the atmospheric pressure in the vicinity of the Icelandic low rises, while the pressure drops in the region of the Bermuda high (see Fig. 7.40b). This pressure change results in a reduced pressure gradient and weaker westerlies that steer fewer and weaker winter storms across the Atlantic in a more westerly path. These storms bring wet weather to southern Europe and to the region around the Mediterranean Sea. Meanwhile, winters in northern Europe are usually cold and dry, as are the winters along the east coast of North America. Greenland and northern Canada usually experience mild winters. Closely related to the North Atlantic Oscillation is the Arctic Oscillation (AO), where changes in atmospheric pressure between the Arctic and regions to the south cause changes in the upper-level westerly winds. During the positive warm phase of the AO, strong pressure differences produce strong westerly winds aloft that prevent cold arctic air from invading the United States, and so winters in this region tend to be warmer than normal. With cold arctic air in place to the north, winters over Newfoundland and Greenland tend to be very cold. Meanwhile, strong winds over the Atlantic direct storms into northern Europe, bringing with them wet, mild weather. During the negative cold phase of the AO, small pressure differences between the arctic and regions to the south produce weaker westerly winds aloft. Cold arctic air is now able to penetrate farther south, producing colder than normal winters over much of the United States. Cold air also invades northern Europe and Asia, while Newfoundland and Greenland normally experience warmer than normal winters. So, when Greenland has mild winters, northern Europe has cold winters and vice versa. This seesaw in winter temperatures between Greenland and northern Europe has been known for many years. What was not known until recently is that, during the warm Arctic Oscillation phase, relatively warm, salty water from the Atlantic is able to move into the Arctic Ocean, where it melts sea ice, causing it to thin by more than 40 centimeters. During the cold phase surface winds tend to keep warmer Atlantic water to the south, which promotes thicker sea ice. Although the Arctic Oscillation switches from one phase to another on an irregular basis, one phase may persist for several years in a row, bringing with it a succession of either cold or mild winters. Over the Pacific Ocean, changes in surface ocean temperatures appear to influence winter weather along the west coast of North America. In the mid 1990s, scientists at the University of Washington, while researching connections between Alaskan salmon production and Pacific climate, identified a long-term Pacific Ocean temperature fluctuation, which they called the Pacific Decadal Oscillation (PDO) because the ocean surface temperature reverses every 20 to 30 years. The Pacific Decadal Oscillation is like ENSO in that it has a warm phase and a cool phase, but its temperature behavior is much different from that of El Niño in the tropical Pacific. During the warm (or positive) phase, unusually warm surface water exists along the west coast of North America, while over the central North Pacific, cooler
 than normal surface water prevails (see Fig. 7.41a).")
34 Global Wind Patterns and the Oceans 209 FIGURE 7.41 Typical winter sea surface temperature departure from normal in C during the Pacific Decadal Oscillation s warm phase (a) and cool phase (b). (Source: JISAO, University of Washington, obtained via Used with permission of N. Mantua.) than normal surface water prevails (see Fig. 7.41a). At the same time, the Aleutian low in the Gulf of Alaska strengthens, which causes more Pacific storms to move into Alaska and California. This situation causes winters, as a whole, to be warmer and drier over northwestern North America. Elsewhere, winters tend to be drier over the Great Lakes, and cooler and wetter in the southern United States. The present cool (or negative) phase finds coolerthan-average surface water along the west coast of North America and an area of warmer-than-normal surface water extending from Japan into the central North Pacific (see Fig. 7.41b). Winters in the cool phase tend to be cooler and wetter than average over northwestern North America, wetter over the Great Lakes, and warmer and drier in the southern United States. The climate patterns described so far only represent average conditions, as individual years within either phase may vary considerably. Hopefully, as our understanding of the interactions between the ocean and atmosphere improves, climate forecasts across North America and elsewhere will improve as well. SUMMARY In this chapter, we examined a variety of atmospheric circulations. We looked at small-scale winds and found that eddies can form in a region of strong wind shear, especially in the vicinity of a jet stream. On a slightly larger scale, land and sea breezes blow in response to local pressure differences created by the uneven heating and cooling rates of land and water. Monsoon winds change direction seasonally, while mountain and valley winds change direction daily. A warm, dry wind that descends the eastern side of the Rocky Mountains is the chinook. The same type of wind in the Alps is the foehn. A warm, dry downslope wind that blows into southern California is the Santa Ana wind. Local intense heating of the surface can produce small rotating winds, such as the dust devil, while downdrafts in a thunderstorm are responsible for the desert haboob. The largest pattern of winds that persists around the globe is called the general circulation. At the surface in both hemispheres, winds tend to blow from the east in the tropics, from the west in the middle latitudes, and from the east in polar regions. Where upper-level westerly winds tend to concentrate into narrow bands, we find jet streams. The annual shifting of the major pressure systems and wind belts northward in July and southward in January strongly influences the annual precipitation of many regions. Toward the end of the chapter we examined the interaction between the atmosphere and oceans. Here we found the interaction to be an ongoing process where
Wind: Small-scale and Local Systems
 Wind: Small-scale and Local Systems Scales of Atmospheric Motion Atmospheric motions/phenomena occur on many diverse spatial and temporal scales. Weather forecasters tend to focus on Mesoscale and synoptic
Meteorology I Pre test for the Second Examination
 Meteorology I Pre test for the Second Examination MULTIPLE CHOICE 1. A primary reason why land areas warm up more rapidly than water areas is that a) on land, all solar energy is absorbed in a shallow
Local Winds. Please read Ahrens Chapter 10
 Local Winds Please read Ahrens Chapter 10 Scales of Motion Microscale: meters Turbulent eddies Formed by mechanical disturbance or convection Lifetimes of minutes Mesoscale: km s to 100 s of km s Local
Small- and large-scale circulation
 The Earth System - Atmosphere II Small- and large-scale circulation Atmospheric Circulation 1. Global atmospheric circulation can be thought of as a series of deep rivers that encircle the planet. 2. Imbedded
9/25/2014. Scales of Atmospheric Motion. Scales of Atmospheric Motion. Chapter 7: Circulation of the Atmosphere
 Chapter 7: Circulation of the Atmosphere The Atmosphere: An Introduction to Meteorology, 12 th Lutgens Tarbuck Lectures by: Heather Gallacher, Cleveland State University Scales of Atmospheric Motion Small-
MET 200 Lecture 11 Local Winds. Last Lecture: Forces. Review of Forces. Balance of Forces
 MET 200 Lecture 11 Local Winds Last Lecture: Forces Scales of Motion Eddies Sea Breeze Mountain-Valley Circulations Chinook - Snow Eater Drainage Wind - Katabatic Wind 1 2 Review of Forces 1. Pressure
Lecture 13 March 24, 2010, Wednesday. Atmospheric Pressure & Wind: Part 4
 Lecture 13 March 24, 2010, Wednesday Atmospheric Pressure & Wind: Part 4 Synoptic scale winds Mesoscale winds Microscale winds Air-sea interactions The largest synoptic scale wind. Monsoon: Arabic for
Scales of Atmospheric Motion
 Lecture 12 Local Wind Systems Scales of Atmospheric Motion Small turbulent eddies (swirls) A synoptic eddy 1 Coriolis Effect The larger the scale, the longer the life time. Wind shear and turbulent eddy
Air Pressure and Wind
 Air Pressure and Wind 19.1 Understanding Air Pressure Air Pressure Defined Air pressure is the pressure exerted by the weight of air. Air pressure is exerted in all directions down, up, and sideways. The
Chapter. Air Pressure and Wind
 Chapter Air Pressure and Wind 19.1 Understanding Air Pressure Air Pressure Defined Air pressure is the pressure exerted by the weight of air. 19.1 Understanding Air Pressure Air Pressure Defined Air pressure
Winds and Ocean Circulations
 Winds and Ocean Circulations AT 351 Lab 5 February 20, 2008 Sea Surface Temperatures 1 Temperature Structure of the Ocean Ocean Currents 2 What causes ocean circulation? The direction of most ocean currents
McKnight's Physical Geography 11e
 Chapter 2 Lecture McKnight's Physical Geography 11e Lectures Chapter 5 Atmospheric Pressure and Wind Michael Commons Ohio Northern University Atmospheric Pressure and Wind The Nature of Atmospheric Pressure
ATMOSPHERIC CIRCULATION. WIND = The horizontal movement of air. Results from the differences in air pressure. Always moves from HIGH to LOW.
 ATMOSPHERIC CIRCULATION WIND = The horizontal movement of air. Results from the differences in air pressure. Always moves from HIGH to LOW. Pressure differences result from variations in temperature. AIR
Chapter 8. Circulation of The Atmosphere
 Chapter 8 Circulation of The Atmosphere Scales of Atmospheric Motion Atmospheric circulations are broken-down into different scales bases on physical size and duration. Macroscale This is the largest scale,
WEATHER SYSTEMS OF MIDDLE LATITUDES
 CHAPTER 10 WEATHER SYSTEMS OF MIDDLE LATITUDES MULTIPLE CHOICE QUESTIONS 1. In equal volumes, which one of the following air masses exerts the highest surface air pressure? a. cp *b. A c. mp d. ct e. mt
Chapter 7: Circulation And The Atmosphere
 Chapter 7: Circulation And The Atmosphere Highly integrated wind system Main Circulation Currents: series of deep rivers of air encircling the planet Various perturbations or vortices (hurricanes, tornados,
18.1 Understanding Air Pressure 18.1 Understanding Air Pressure Air Pressure Defined Measuring Air Pressure Air pressure barometer
 18.1 Understanding Air Pressure 18.1 Understanding Air Pressure Air Pressure Defined Air pressure is the pressure exerted by the weight of air. Air pressure is exerted in all directions down, up, and sideways.
Local Winds & Microclimates. Unit 2- Module 1
 Local Winds & Microclimates Unit 2- Module 1 Objectives Overview of local winds (sea & land breezes, valley winds) Overview of microclimates (valley, urban, woodland) Local Winds Local Winds Local winds
SIO20 - Midterm Examination 2 v1 Winter Section A. Circle the letter corresponding to the best answer. (1 point each)
") NAME: Section A. Circle the letter corresponding to the best answer. (1 point each) 1. Rainbows result from: a. refraction and reflection of sunlight by water droplets b. reflection of sunlight by oceans
NAME: Section A. Circle the letter corresponding to the best answer. (1 point each) 1. Rainbows result from: a. refraction and reflection of sunlight by water droplets b. reflection of sunlight by oceans
Lornshill Academy. Geography Department Higher Revision Physical Environments - Atmosphere
 Lornshill Academy Geography Department Higher Revision Physical Environments - Atmosphere Physical Environments Atmosphere Global heat budget The earth s energy comes from solar radiation, this incoming
Chapter 6: Atmospheric Pressure, Wind, and Global Circulation
 Discovering Physical Geography Third Edition by Alan Arbogast Chapter 6: Atmospheric Pressure, Wind, and Global Circulation Factors That Influence Air Pressure Air Pressure is the measured weight of air
Monsoon. Arabic word mausim means season. Loose definition: a wind/precipitation pattern that shifts seasonally
 Monsoon Arabic word mausim means season Loose definition: a wind/precipitation pattern that shifts seasonally Classical criteria (Ramage 1971) Prevailing wind shifts 120 o between Jan & July Average frequency
Section 1. Global Wind Patterns and Weather. What Do You See? Think About It. Investigate. Learning Outcomes
 Chapter 5 Winds, Oceans, Weather, and Climate Section 1 Global Wind Patterns and Weather What Do You See? Learning Outcomes In this section, you will Determine the effects of Earth s rotation and the uneven
Lecture Outlines PowerPoint. Chapter 18 Earth Science 11e Tarbuck/Lutgens
 Lecture Outlines PowerPoint Chapter 18 Earth Science 11e Tarbuck/Lutgens 2006 Pearson Prentice Hall This work is protected by United States copyright laws and is provided solely for the use of instructors
Horizontal movement of air between cooler and warmer regions. - horizontal movement of air Convection over areas where is
 Winds and Water Chapter 9 continued... Uneven Heating The various materials of the earth absorb and emit energy at different rates Convection Heated air expands; density reduced; air rises Upward movement
Summary of Lecture 10, 04 March 2008 Introduce the Hadley circulation and examine global weather patterns. Discuss jet stream dynamics jet streams
 Summary of Lecture 10, 04 March 2008 Introduce the Hadley circulation and examine global weather patterns. Discuss jet stream dynamics jet streams arise because the Coriolis force prevents Hadley-type
Chapter 8 Air Masses
 Chapter 8 Air Masses Air Masses - 1 1. An Air Mass is a large body of air usually about 1500 km across and several km thick, that has homogeneous physical properties. 2. The important physical properties
TOPICS YOU NEED TO KNOW
 ATMO 101 Introduction to Meteorology Midterm Study Sheet Chapters 6, 7, 8 and 10 Exam Thursday 3/23/2017 Vocabulary Words for True and False, and Multiple Choice You are responsible for the following words:
Chapter 13 Lecture Outline. The Atmosphere in Motion
 Chapter 13 Lecture Outline The Atmosphere in Motion Understanding Air Pressure Air pressure is the force exerted by weight of air above Weight of the air at sea level 14.7 psi or 1 kg/cm 2 Decreases with
Ocean Currents that Redistribute Heat Globally
 Ocean Currents that Redistribute Heat Globally Ocean Circulation Ocean Currents Fig. CO7 OCEAN CURRENTS Surface ocean currents are similar to wind patterns: 1. Driven by Coriolis forces 2. Driven by winds
ESCI 107 The Atmosphere Lesson 11 Global Circulation
 Reading: Meteorology Today, Chapter 10 THE GLOBAL CIRCULATION ESCI 107 The Atmosphere Lesson 11 Global Circulation Latitudinal heat imbalance The tropics receive more radiation than they emit. The polar
Name Date L.O: SWBAT explain what breezes, planetary winds, ocean currents & monsoons are.
 Name Date L.O: SWBAT explain what breezes, planetary winds, ocean currents & monsoons are. 1. A cool breeze is blowing toward the land from the ocean on a warm, cloudless summer day. This condition is
The atmospheric circulation system
 The atmospheric circulation system Key questions Why does the air move? Are the movements of the winds random across the surface of the Earth, or do they follow regular patterns? What implications do these
Goals for today: continuing Ch 8: Atmospheric Circulation and Pressure Distributions. 26 Oct., 2011
 Goals for today: 26 Oct., 2011 continuing Ch 8: Atmospheric Circulation and Pressure Distributions Examples of synoptic scale and mesoscale circulation systems that are driven by geographic diversity in
Wind is caused by differences in air pressure created by changes in temperature and water vapor content.
 Topic 8: Weather Notes, Continued Workbook Chapter 8 Wind is caused by differences in air pressure created by changes in temperature and water vapor content. Wind blows from high pressure areas to low
Wind: Small Scale and Local Systems Chapter 9 Part 1
 Wind: Small Scale and Local Systems Chapter 9 Part 1 Atmospheric scales of motion Scales of atmospheric circulations range from meters or less to thousands of kilometers- millions of meters Time scales
Atmospheric & Ocean Circulation-
 Atmospheric & Ocean Circulation- Overview: Atmosphere & Climate Atmospheric layers Heating at different latitudes Atmospheric convection cells (Hadley, Ferrel, Polar) Coriolis Force Generation of winds
Air Masses and Fronts
 Air Masses and Fronts A huge body of air that has similar temperature, humidity, and air pressure at any given height is called an air mass. A single air mass may spread over millions of square kilometers
Lecture 13 El Niño/La Niña Ocean-Atmosphere Interaction. Idealized 3-Cell Model of Wind Patterns on a Rotating Earth. Previous Lecture!
 Lecture 13 El Niño/La Niña Ocean-Atmosphere Interaction Previous Lecture! Global Winds General Circulation of winds at the surface and aloft Polar Jet Stream Subtropical Jet Stream Monsoons 1 2 Radiation
Atmosphere Circulation
 Atmosphere Circulation Winds What Causes Winds? Difference in air pressure due to unequal heating of the atmosphere. Temperatures vary according to the amount of sun it gets. Uneven heating of the Earth
Exploring Wind Energy
 2013-2014 Exploring Wind Energy Student Guide SECONDARY Introduction to Wind What is Wind? Wind is simply air in motion. It is produced by the uneven heating of the Earth s surface by energy from the sun.
Meteorology. Circle the letter that corresponds to the correct answer
 Chapter 6 Worksheet 2 Meteorology Name: Circle the letter that corresponds to the correct answer 1) A steep pressure gradient: a. produces light winds. b. produces strong winds. c. is only possible in
Applied Earth Science Climate Exam Practice Questions Page 1
 Name: 1. Which combination of climate factors generally results in the coldest temperatures? A) low elevation and low latitude B) low elevation and high latitude C) high elevation and low latitude D) high
3 Global Winds and Local Winds
 CHAPTER 1 3 Global Winds and Local Winds SECTION The Atmosphere BEFORE YOU READ After you read this section, you should be able to answer these questions: What causes wind? What is the Coriolis effect?
Lesson: Atmospheric Dynamics
 Lesson: Atmospheric Dynamics By Keith Meldahl Corresponding to Chapter 8: Atmospheric Circulation Our atmosphere moves (circulates) because of uneven solar heating of the earth s surface, combined with
Factors Affecting Wind
 Understanding Air Pressure Average air pressure at sea level is about 1 kg per cm 2 (14.7 lbs/in 2 ) Roughly the same pressure that is produced by a column of water 10 m (33 ft) high The pressurized suits
APPI PPG LECTURE 5: FURTHER METEOROLOGY
 LECTURE 5: FURTHER METEOROLOGY Introduction: This lecture covers Further Meteorology and aims to give you more of an understanding of advanced weather conditions and patterns. However Meteorology is a
11. WIND SYSTEMS A&B: Ch 8 (p )
") 1 11. WIND SYSTEMS A&B: Ch 8 (p 214-238) Concepts: I. Scale II. Differential heating III. Wind direction 1. Scales: Three major divisions Space Time Micro meters seconds - minutes Meso kilometers seconds
1 11. WIND SYSTEMS A&B: Ch 8 (p 214-238) Concepts: I. Scale II. Differential heating III. Wind direction 1. Scales: Three major divisions Space Time Micro meters seconds - minutes Meso kilometers seconds
Canada s vast size creates a diverse range of weather conditions and climatic conditions. Warming trend for last 10 years Wet Spring Dry five summers
 Chapter 4 Weather and Climate Canada s vast size creates a diverse range of weather conditions and climatic conditions. Weather examples: Rainy today Snow tomorrow Fog on Wednesday 23 degree C today High
Earth s Atmosphere. Earth s atmosphere is a key factor in allowing life to survive here.
 Chapter 10.2 Earth s Atmosphere Earth s atmosphere is a key factor in allowing life to survive here. This narrow band of air has the right ingredients and maintains the correct temperature, to allow life
Foundations of Earth Science, 6e Lutgens, Tarbuck, & Tasa
 Foundations of Earth Science, 6e Lutgens, Tarbuck, & Tasa The Atmosphere in Motion Foundations, 6e - Chapter 13 Stan Hatfield Southwestern Illinois College Atmospheric pressure Force exerted by the weight
Atmospheric Circulation
 Atmospheric Circulation Why do we say Earth's temperature is moderate? It may not look like it, but various processes work to moderate Earth's temperature across the latitudes. Atmospheric circulation
Review for the second quarter. Mechanisms for cloud formation
 Review for the second quarter Mechanisms for cloud formation 1 Rising air expands and cools; Sinking air compresses and warms. (18) (24) Dry adiabatic lapse rate (10 o C/km): the rate of temperature decrease
Chapter 10, Part 1. Scales of Motion. Examples of Wind at Different Scales. Small Scale Winds
 Chapter 10, Part 1 Small Scale Winds Scales of Motion Wirls or eddies exist at all length scales in the atmosphere. Microscale (2m) Mesoscale (20km) Synoptic scale (2000km) Examples of Wind at Different
10.2 Energy Transfer in the Atmosphere
 10.2 Energy Transfer in the Atmosphere Learning Outcomes Understand the different layers of the atmosphere Understand how energy moves in, out, and around our atmosphere er Composi
Write answers on your own paper. A. the Sun B. the Moon C. Earth s gravity D. Earth s rotation
 The tmosphere Write answers on your own paper 1. What is the primary energy source that drives all weather events, including precipitation, hurricanes, and tornados?. the Sun. the Moon C. Earth s gravity
Atmospheric Circulation (Ch. 8) Ocean & Atmosphere are intertwined Gases & waters freely exchanged Wind Weather Climate
 Ocean & Atmosphere are intertwined Gases & waters freely exchanged Wind Weather Climate") Atmospheric Circulation (Ch. 8) Ocean & Atmosphere are intertwined Gases & waters freely exchanged Wind Weather Climate Atmospheric Structure Consists of Layers Separated by Temperature Stratosphere: Temperature
Atmospheric Circulation (Ch. 8) Ocean & Atmosphere are intertwined Gases & waters freely exchanged Wind Weather Climate Atmospheric Structure Consists of Layers Separated by Temperature Stratosphere: Temperature
ESCONDIDO FIRE DEPT TRAINING MANUAL Section Engine Module Page 1 of 15 Wildland Fire Weather Revised
 Engine Module Page 1 of 15 WEATHER Weather is the most critical element of fire behavior. Weather is also the most unpredictable element. Firefighting personnel should be knowledgeable in local weather
1.3: CLIMATE GEOGRAPHY. pgs
 1.3: CLIMATE GEOGRAPHY pgs. 76-89 INTRODUCTION WEATHER: Is the combination of temperature, precipitation, cloud cover and wind that we experience EACH DAY. Example: 22 0 C and clear skies. CLIMATE: The
Understanding Weather
 Understanding Weather Images Graphic of the atmosphere. Enlarge Cirrus clouds. Enlarge Air masses Air masses are parcels of air that bring distinctive weather features to the country. An air mass is a
6.1 Introduction to Weather Weather air mass Weather factors Temperature Pressure What is wind? Wind Convection in the atmosphere Thermals thermal
 6.1 Introduction to Weather Weather is a term that describes the condition of the atmosphere in terms of temperature, atmospheric pressure, wind, and water. The major energy source for weather events is
Meteorology. Circle the letter that corresponds to the correct answer
 Chapter 7 Worksheet 2 Meteorology Name: Circle the letter that corresponds to the correct answer 1) Which of the following factors contributes to the general subsidence in the latitude zone 20 degrees
Canada s Natural Systems. Canadian Geography 1202
 Canada s Natural Systems Canadian Geography 1202 Canada s Natural Systems Natural System: A system found in nature Here are the four natural systems that we will explore in the next few weeks 1. Canada
V. SEA and LAND BREEZES:
 V. SEA and LAND BREEZES: A. Pressure largely reflects the weight of overlying air, owing to gravity, and is proportional to mass. Therefore pressure decreases with height. 1. Remember, surface pressure
WINDS Understand the cause of wind and how it affects climate Chapter 4 Pages 59-67
 WINDS Understand the cause of wind and how it affects climate Chapter 4 Pages 59-67 What is Wind? A wind is a horizontal movement of air across a surface. Vertical movements are currents or updrafts and
T. James Noyes, El Camino College Winds Unit (Topic 8A-1) page 1
 page 1") T. James Noyes, El Camino College Winds Unit (Topic 8A-1) page 1 Name: Section: Winds Unit (3 pts) The Ocean and the Atmosphere We need to learn about the atmosphere, because the ocean and atmosphere are
T. James Noyes, El Camino College Winds Unit (Topic 8A-1) page 1 Name: Section: Winds Unit (3 pts) The Ocean and the Atmosphere We need to learn about the atmosphere, because the ocean and atmosphere are
THE ATMOSPHERE. WEATHER and CLIMATE. The Atmosphere 10/12/2018 R E M I N D E R S. PART II: People and their. weather. climate?
 R E M I N D E R S Two required essays are due by Oct. 30, 2018. (A third may be used for extra credit in place of a Think Geographically essay.) ESSAY TOPICS (choose any two): Contributions of a noted
Chapter 22, Section 1 - Ocean Currents. Section Objectives
 Chapter 22, Section 1 - Ocean Currents Section Objectives Intro Surface Currents Factors Affecting Ocean Currents Global Wind Belts (you should draw and label a diagram of the global wind belts) The Coriolis
3 Global Winds and Local Winds
 CHAPTER 15 3 Global Winds and Local Winds SECTION The Atmosphere BEFORE YOU READ After you read this section, you should be able to answer these questions: What causes wind? What is the Coriolis effect?
Nevis Hulme Gairloch High School John Smith Invergordon Academy. Gairloch High School / Invergordon Academy
 Nevis Hulme Gairloch High School John Smith Invergordon Academy 1 Gairloch High School / Invergordon Academy ATMOSPHERIC CIRCULATION The Three Cell Model Global Winds The ITCZ The purpose of this presentation
6.9B verify through investigations that thermal energy moves in a predictable pattern from warmer to cooler 6.5B recognize that a limited number of
 6.9B verify through investigations that thermal energy moves in a predictable pattern from warmer to cooler 6.5B recognize that a limited number of elements comprise the largest portion of oceans and atmosphere
PHYSICAL GEOGRAPHY. By Brett Lucas
 PHYSICAL GEOGRAPHY By Brett Lucas ATMOSPHERIC PRESSURE AND WIND Atmospheric Pressure and Wind Atmospheric Processes The Nature of Wind General Circulation of the Atmosphere Modifications of General Circulation
ATMS 310 Tropical Dynamics
 ATMS 310 Tropical Dynamics Introduction Throughout the semester we have focused on mid-latitude dynamics. This is not to say that the dynamics of other parts of the world, such as the tropics, are any
Wednesday, September 20, 2017 Reminders. Week 3 Review is now available on D2L (through Friday) Exam 1, Monday, September 25, Chapters 1-4
 Exam 1, Monday, September 25, Chapters 1-4") Wednesday, September 20, 2017 Reminders Week 3 Review is now available on D2L (through Friday) Exam 1, Monday, September 25, Chapters 1-4 PLEASE don t memorize equations, but know how to recognize them
Wednesday, September 20, 2017 Reminders Week 3 Review is now available on D2L (through Friday) Exam 1, Monday, September 25, Chapters 1-4 PLEASE don t memorize equations, but know how to recognize them
Length of day for a full year. Ocean Gyres. Wet. Adiabatic. lapse rate, starts at. dewpoint Dry Adiabatic lapse rate
 Vernal Equinox March 20, 11:57 AM, CDT Sun will rise exactly in the east and set exactly in the west. All latitudes get 12 hours of day and 12 hours of dark. Length of day for a full year Wet Adiabatic
PGF. Pressure Gradient. Wind is horizontal movement of the air or other word air in motion. Forces affecting winds 2/14/2017
 Winds Wind is horizontal movement of the air or other word air in motion. Forces affecting winds 1. Pressure gradient force a. High pressure flows to low pressure b. Pressure gradient = difference in pressure
Civil Air Patrol Auxiliary of the United States Air Force
 Mountain Flying Qualification Course Civil Air Patrol Auxiliary of the United States Air Force Mountain Weather Slopes Most U.S. mountain ranges are oriented north-south, while the prevailing winds are
Enviro Sci 1A03 Quiz 3
 Enviro Sci 1A03 Quiz 3 Question 1 (1 point) Which of the following measure wind direction and speed? Question 1 options: a) aerovane b) anemometer c) wind vane d) all of the above Question 2 (1 point)
Chapter 10: Global Wind Systems
 Chapter 10: Global Wind Systems Three-cell model of atmospheric circulation Intertropical Convergence Zone (ITCZ) Typical surface wind patterns Upper-level pressure and winds Climatological sea-level pressure
Atmosphere & Weather. Earth Science
 Atmosphere & Weather Earth Science Energy Transfer in the Atmosphere Earth s energy is provided by the SUN! Energy is important to us because it 1. Drives winds and ocean currents. 2. Allows plants to
Greenhouse Effect Activity
 Greenhouse Effect Activity Objectives: The student will: 1. Read and use weather instruments. 2. Collect and record temperature readings. 3. Describe the concept of the greenhouse effect. Materials: Fish
Wednesday, September 27, 2017 Test Monday, about half-way through grading. No D2L Assessment this week, watch for one next week
 Wednesday, September 27, 2017 Test Monday, about half-way through grading No D2L Assessment this week, watch for one next week Homework 3 Climate Variability (due Monday, October 9) Quick comment on Coriolis
Read each slide, some slides have information to record on your organizer. Some slides have numbers that go with the question or red and underlined
 Read each slide, some slides have information to record on your organizer. Some slides have numbers that go with the question or red and underlined to use for answering the questions. Essential Question:
3 Global Winds and Local Winds
 CHAPTER 6 3 Global Winds and Local Winds SECTION The Atmosphere BEFORE YOU READ After you read this section, you should be able to answer these questions: What causes wind? What is the Coriolis effect?
Section 6. The Surface Circulation of the Ocean. What Do You See? Think About It. Investigate. Learning Outcomes
 Chapter 5 Winds, Oceans, Weather, and Climate Section 6 The Surface Circulation of the Ocean What Do You See? Learning Outcomes In this section, you will Understand the general paths of surface ocean currents.
Santa Ana Winds. Surface weather map showing typical Santa Ana conditions.
 Santa Ana Winds Surface weather map showing typical Santa Ana conditions. High Desert Elevation ~1500-2000 ft Santa Ana Winds ~1500 meters 0 meters Santa Ana Winds ~875 mb ~1500 meters ~875 mb Horizontal
Topic 4 Temperature, Atmospheric Circulation and Climate. Temperature Concepts and Measurement 10/2/2017. Thermometer and Instrument Shelter
 Topic 4 Temperature, Atmospheric Circulation and Climate Temperature Controls Global Temp. Patterns Atmospheric Circulation Primary High and Low Pressure Areas Global Circulation Model Local Winds Ocean
W3 Global Circulation Systems
 W3 Global Circulation Systems Which regions of Earth receive the most energy from the Sun? If not for global circulation systems There would only be two narrow regions that would support life What
Wind in the Atmosphere
 Lesson 2 Wind in the Atmosphere ESSENTIAL QUESTION What is wind? By the end of this lesson, you should be able to explain how energy provided by the sun causes atmospheric movement, called wind. p 6.ESS2.2,
AT350 EXAM #2 November 18, 2003
 AT350 EXAM #2 November 18, 2003 Name and ID: Enter your name and student ID number on the answer sheet and on this exam. Record your answers to the 50 questions by using a No. 2 pencil to completely fill
Ocean Currents Unit (4 pts)
") Name: Section: Ocean Currents Unit (Topic 9A-1) page 1 Ocean Currents Unit (4 pts) Ocean Currents An ocean current is like a river in the ocean: water is flowing traveling from place to place. Historically,
Name: Section: Ocean Currents Unit (Topic 9A-1) page 1 Ocean Currents Unit (4 pts) Ocean Currents An ocean current is like a river in the ocean: water is flowing traveling from place to place. Historically,
Notepack 41. Aim: What factors determine the climate of a certain area? Do Now: What is the difference between weather and climate?
 Notepack 41 Aim: What factors determine the climate of a certain area? Do Now: What is the difference between weather and climate? WEATHER VS. CLIMATE Weather atmospheric conditions at a certain location
CHAPTER 6 Air-Sea Interaction
 CHAPTER 6 Air-Sea Interaction What causes Earth s seasons? Tilt (23.5 ) responsible for seasons 2011 Pearson Education, Inc. Distribution of Solar Energy Distribution of Solar Energy Atmosphere absorbs
18 Flight Hazards over High Ground
 18 Flight Hazards over High Ground meteorology 18.1 Mountain Effect on Fronts When a warm front passes a mountain range, the air, is lifted over the mountain and will strengthen the formation of cloud
Weather EOG Review Questions
 Weather EOG Review Questions 1. Which statement best describes runoff? A Water vapor cools off and changes into water droplets. B Water in the form of rain, snow, sleet, or hail falls from clouds. C Precipitation
>>>>>>>>WHEN YOU FINISH <<<<<<<< Hand in the answer sheet separately.
 Instructor: Prof. Seiberling PHYSICS DEPARTMENT MET 1010 2nd Midterm Exam October 28, 2002 Name (print, last rst): Signature: On my honor, I have neither given nor received unauthorized aid on this examination.
Global Circulations. GEOG/ENST 2331 Lecture 15 Ahrens: Chapter 10
 Global Circulations GEOG/ENST 2331 Lecture 15 Ahrens: Chapter 10 Last lecture Microscale (turbulence) Mesoscale (land/sea breeze) Synoptic scale (monsoon) Global scale (3 cell circulation) Three Cell Model
El Niño Unit (2.5 pts)
") T. James Noyes, El Camino College El Niño Unit (Topic 9B) page 1 Name: Section: El Niño Unit (2.5 pts) El Niño is a warm ocean current that flows along the Equator and towards the west coast of South America
T. James Noyes, El Camino College El Niño Unit (Topic 9B) page 1 Name: Section: El Niño Unit (2.5 pts) El Niño is a warm ocean current that flows along the Equator and towards the west coast of South America
Global Winds and Local Winds
 Global Winds and Local Winds National Science Education Standards ES 1j What is the Coriolis effect? What are the major global wind systems on Earth? What Causes Wind? Wind is moving air caused by differences
Introduction to Oceanography OCE 1001
 Introduction to Oceanography OCE 1001 Lecture Notes Chantale Bégin & Jessica Fry Version 2.1 10. Ocean Circulation (Trujillo, Chapter 7) Major ocean currents are stable and predictable; they have been