volvooceanrace.com Volvo Ocean Race Science programme Preliminary results Leg 6 Hong Kong to Auckland
|
|
|
- Rosa Hodge
- 5 years ago
- Views:
Transcription


1 Volvo Ocean Race Science programme Preliminary results Leg 6 Hong Kong to Auckland
2 Preliminary results Leg 6 Compiled using data provided by Dr Toste Tanhua & Dr-Ing. Sören Gutekunst, GEOMAR Helmholtz Centre for Ocean Research Kiel funded by Cluster of Excellence Future Ocean. With thanks to the Turn the Tide on Plastic team, in particular Liz Wardley, for facilitating and conducting the data collection. Further correspondence contact: Mairéad O'Donovan education@volvooceanrace.com / Soren Gutekunst sgutekunst@geomar.de Media & Communication: Robin Clegg robin.clegg@volvooceanrace.com Central Coordination: Volvo Ocean Race Anne-Cécile Turner annececile.turner@volvooceanrace.com All contacts page 12 Refer to the report: Volvo Ocean Race Science Programme - Legs 1 to 4 - Final edition for a more detailed overview of the Science Programme and a summary of preliminary results for Legs 1, 2, 3 & 4
3 Executive Summary The Volvo Ocean Race Science Programme has brought together an elite scientific consortium to capture data that will contribute to a better understanding of the world s ocean and climate. Leg 6 of the race from Hong Kong to Auckland allowed for continued sampling of microplastics and oceanographic data by the Turn the Tide on Plastic boat. Scientific Drifter buoys were also deployed by all boats. The route of this leg partially overlapped the track that Turn the Tide on Plastic sampled during the northbound passage to Hong Kong (Leg 4) providing a second sampling opportunity in some areas. The preliminary results for microplastics revealed the highest levels of microplastic pollution recorded along the race route to date. The level of 357 particles/m 3 was detected in the sample from the South China Sea. There was a notable difference between levels of microplastics recorded during this leg compared to Leg 4 on approach to Hong Kong. This is likely to be partly due to the patchiness of microplastic particle distribution and illustrates the exceptional value of the Volvo Ocean Race sampling effort in contributing to understanding microplastics pollution. Collaboration, Funding and Support The onboard sampling component of the science programme is a collaboration between Volvo Cars, GEOMAR Helmholtz Centre for Ocean Research Kiel (funded by Cluster of Excellence Future Ocean), SubCtech GmbH, bbe Moldaenke and Turn the Tide on Plastic crew. Another sampling unit was fitted to the AkzoNobel boat to provide a second sampling boat proceeding from Auckland (Leg 7). Volvo Cars is funding the onboard equipment through profits from the sale of their Cross Country Volvo V90 Ocean Race edition cars. The scientific drifter buoys are part of the National Oceanic and Atmospheric Administration s (NOAA) drifter programme. The sharing of meteorological data measured from the boats is part of a pilot project developed by JCOMM (Joint technical Commission for Oceanography and Marine Meteorology, WMO IOC1) partners. These organisations are brought together by the Volvo Ocean Race sustainability programme, in order to increase Ocean knowledge, pioneer a new area of data collection and advance the technology of instrumentation in order to contribute to create a global map of standardised data, specifically in the area of microplastic concentration.

4 Ainhoa Sanchez Volvo Ocean Race volvooceanrace.com Onboard sampling
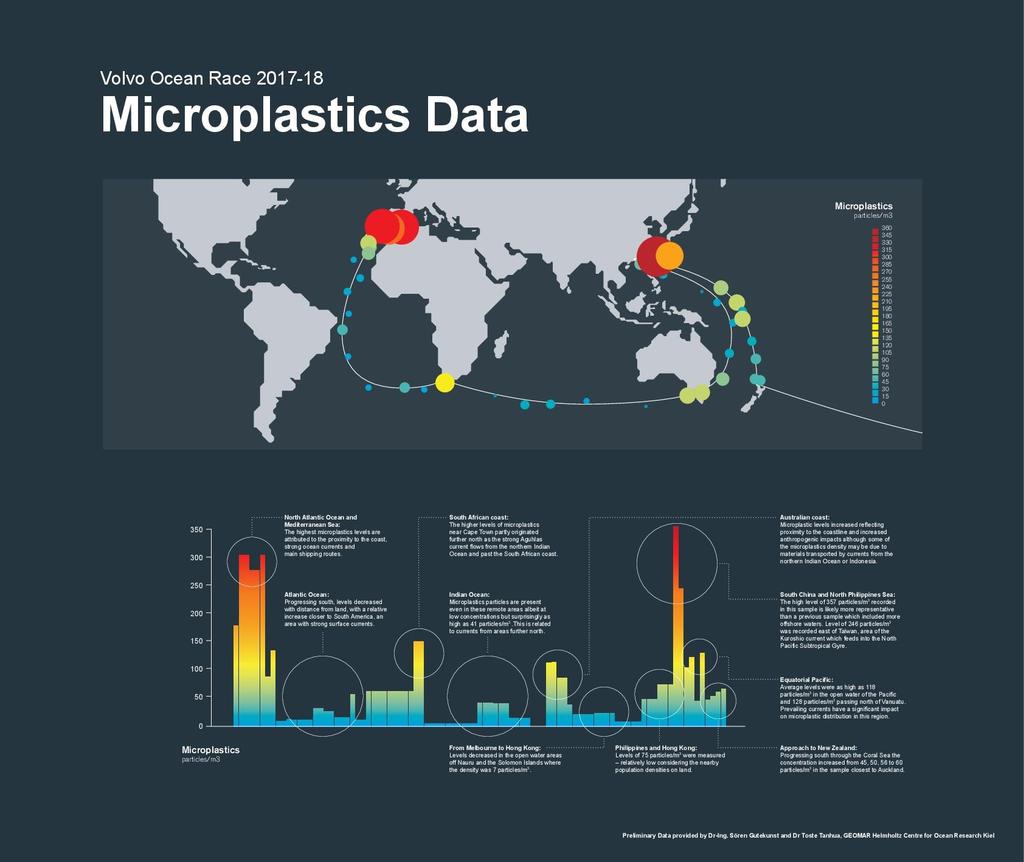
5 Preliminary results Provided by Dr Toste Tanhua and Dr-Ing. Sören Gutekunst, GEOMAR Helmholtz Centre for Ocean Research Kiel Leg 6: Hong Kong to Auckland The Race and Microplastics knowledge advance Leg 6 of the Volvo Ocean Race brought the race from Hong Kong to Auckland. This provided an interesting sampling opportunity as there was some overlap between the route covered and the previous track of Leg 4 (Melbourne to Hong Kong) thereby allowing analysis of different samples from similar areas. There was a gap in sampling over a period of four days in the Philippine Sea as there was an electrical issue with the scientific device onboard. The malfunction was fixed by Liz Wardley and later investigated further during maintenance in Auckland. It is important as always to remember the preliminary nature of these results and also to view them with consideration of ocean currents and the averages that the numbers represent due to the potential geographical range of a single sample. There was a notable difference between levels of microplastics recorded during this leg compared to Leg 4 on approach to Hong Kong. Highest levels detected The most striking finding was the measurement of a microplastic concentration of 357 particles/m 3 in the sample from the South China Sea, the highest level recorded along the race route to date. The level recorded for a similar general area during Leg 4 was 75 particles/m 3. The latest (Leg 6) sample is possibly more representative of actual levels as this sample was taken more inshore and further north east than the earlier (Leg 4) sample. The difference in the averages may also be related to patchiness in the distribution of microplastic particles closer to the source. With distance from the source there is likely to be more even distribution of particles on a local scale, but with ocean currents affecting distribution on a larger scale. Progressing east into the north Philippine Sea, east of Taiwan, a relatively high level of 246 particles/m 3 was recorded. Significantly the area sampled coincides with the Kuroshio current which feeds into the North Pacific Subtropical Gyre. Along the route south through the Pacific and crossing the equator average levels in the areas sampled were 103 particles/m 3 heading south of latitude 15 degrees north and 118 particles/m 3 in the area around the equator. These recorded levels again differed considerably from those recorded during the northbound passage of Leg 4 when 7 particles/m 3 were measured. Again, prevailing currents in this offshore area will be a major factor affecting microplastic density. The recorded level decreased to 44 particles/m 3 on approach to the Solomon Islands with a spike to 128 particles/m 3 as the boat passed north of Vanuatu. In a similar area during Leg 4 concentrations of particles/m 3 were recorded. Progressing south towards New Zealand the concentration increased from 45, 50, 56 to 60 particles/m 3 in the sample closest to Auckland. The questions posed by these latest recorded levels compared to measurements recorded from similar areas during Leg 4 give an insight into the challenge presented to scientists endeavouring to quantify microplastic pollution and understand its distribution. Above all else this illustrates the exceptional value of the Volvo Ocean Race sampling effort in contributing to our knowledge of the seemingly unfathomable extent of microplastic pollution.
6

7 Volvo Ocean Race Oceanography Low partial carbon dioxide levels were recorded northeast of Taiwan. Due to Japanese efforts this region is relatively well monitored and lower pco 2 levels as recorded here are typical of the region. Levels increased approaching the equator and around the equator were in excess of the atmospheric level of 400ppm. This consequence of equatorial upwelling was also observed during the northbound leg through the same area. The outgassing of CO 2 due to such equatorial upwelling is a critical factor affecting the global carbon budget and the annual variability in the upwelling rate in the Pacific is the single most important factor in determining the global annual budget of the carbon cycle. Also, in relation to climate, these upwellings tend to be small during In El Niño years and therefore this CO 2 data is important for climate predictions via the Tropical Pacific Observing System (TPOS) - the single most important ocean observation unit for predicting climate on an annual and inter-annual time-scale. pco 2 - parts per million Map Sören Gutekunst, GEOMAR Helmholtz Centre for Ocean Research Kiel
8 Volvo Ocean Race Oceanography The temperature and salinity data support the carbon dioxide observations. The data illustrate the West Pacific warm pool, the warmest part of the global ocean. Relatively low salinity in the north tropical Pacific, as observed also during Leg 4, is typical of this region where heavy squall activity is characteristic. Temperature - Celsius Salinity - Practical Salinity Unit Chlorophyll a levels were relatively low along this leg. The tropics are typically low in terms of primary productivity. Further north and south along this leg the relatively low productivity reflects the time of year as these areas were sampled outside of highest phytoplankton growth. The map also illustrates nicely the global importance of the South Indian Ocean (Southern Ocean) for its levels of phytoplankton activity and therefore potential to absorb excess atmospheric carbon dioxide. Chlorophyll a mg/m 3 Maps Sören Gutekunst, GEOMAR Helmholtz Centre for Ocean Research Kiel

9 Photo Sam Greenfield Volvo Ocean Race volvooceanrace.com Drifter Buoys

10 Volvo Ocean Race Scientific Drifter buoys Volvo Ocean Race Drifter buoys transmitting data from a critical area lacking drifter buoy coverage Map During Leg 6 each of the competing boats deployed a scientific drifter as they passed 3 degrees north of the equator. Data from this latitude is valuable in the prediction of tropical storms and longer-term monitoring of climate as these buoys will continue to transmit data on sea surface temperature and ocean current movement for up to two years. Watch more about the Leg 6 drifter buoy deployments here:
11 Read more Media Mentions: Previous reports: Volvo Ocean Race Science Programme Preliminary Results Leg 1, 2, 3 & 4 Interesting links: View the Volvo Ocean Race Drifter buoys: Search for the Volvo Ocean Race drifter buoys in the list at Insert the WMO# of one of the buoys at change the time range, display All Positions and refresh the map to see the track line from where each buoy has been transmitting. Alternatively, access the Platform Info to view the raw near real-time data. Photo Volvo Ocean Race


12 Volvo Ocean Race Scientific consortium Contacts. Central Coordination Anne-Cécile Turner Sustainability Programme Leader Volvo Ocean Race Volvo Ocean Race Scientific Consortium coordinator Dr Toste Tanhua GEOMAR Helmholtz Centre for Ocean Research Kiel On site coordinator, data analysis and reporting Dr-Ing. Sören Gutekunst GEOMAR Helmholtz Centre for Ocean Research Kiel Scientific Programme copywriting and communication Mairéad O'Donovan educationvolvooceanrace.com Communication & Media Robin Clegg Sustainability Communications With the support of
volvooceanrace.com Volvo Ocean Race Science programme Preliminary results Legs 10 and 11 Cardiff - Gothenburg - The Hague
 Volvo Ocean Race Science programme Preliminary results Legs 10 and 11 Cardiff - Gothenburg - The Hague Volvo Ocean Race 2017-2018 Preliminary results Legs 10 and 11 Compiled using data provided by Dr Toste
volvooceanrace.com Volvo Ocean Race Science programme Preliminary results Leg 8 Itajaí to Newport
 Volvo Ocean Race Science programme Preliminary results Leg 8 Itajaí to Newport Preliminary results Leg 8 Compiled using data provided by Dr Toste Tanhua & Dr-Ing. Sören Gutekunst, GEOMAR Helmholtz Centre
Science programme. Preliminary results Legs 1,2,3 and 4. volvooceanrace.com
 Science programme Preliminary results Legs 1,2,3 and 4 Compiled using data provided by Dr Toste Tanhua & Dr Ing. Sören Gutekunst, GEOMAR Cluster of Excellence Future Ocean, Helmholtz Centre for Ocean Research.
Ocean Inter-annual Variability: El Niño and La Niña. How does El Niño influence the oceans and climate patterns?
 Name: Date: Guiding Question: Ocean Inter-annual Variability: El Niño and La Niña How does El Niño influence the oceans and climate patterns? Introduction What is El Niño/La Niña? The El Niño/La Niña cycle
Name Class Date. Use the terms from the following list to complete the sentences below. Each term may be used only once. Some terms may not be used.
 Assessment Chapter Test B The Movement of Ocean Water USING KEY TERMS Use the terms from the following list to complete the sentences below. Each term may be used only once. Some terms may not be used.
Module 3, Investigation 1: Briefing 1 What are the effects of ENSO?
 Background The changing temperatures of the tropical Pacific Ocean affect climate variability all over Earth. Ocean warming and cooling dramatically affect human activities by changing weather patterns
Your web browser (Safari 7) is out of date. For more security, comfort and the best experience on this site: Update your browser Ignore
 is out of date. For more security, comfort and the best experience on this site: Update your browser Ignore") Your web browser (Safari 7) is out of date. For more security, comfort and the best experience on this site: Update your browser Ignore L A NIÑA El Niño-Southern Oscillation (ENSO) For the complete encyclopedic
Your web browser (Safari 7) is out of date. For more security, comfort and the best experience on this site: Update your browser Ignore L A NIÑA El Niño-Southern Oscillation (ENSO) For the complete encyclopedic
Level 3 Earth and Space Science, 2018
 91413 914130 3SUPERVISOR S Level 3 Earth and Space Science, 2018 91413 Demonstrate understanding of processes in the ocean system 2.00 p.m. Thursday 22 November 2018 Credits: Four Achievement Achievement
The Movement of Ocean Water. Currents
 The Movement of Ocean Water Currents Ocean Current movement of ocean water that follows a regular pattern influenced by: weather Earth s rotation position of continents Surface current horizontal movement
VOLVO OCEAN RACE - The Route
 WISDOM S WORKSHEET 1.1 / TOPIC 1 / AGE 6-8 NAME: DATE: Hi I m a little lost! Can you help me by writing in the names of the different countries and oceans on the map? VOLVO OCEAN RACE - The Route Gothenburg
Lesson: Ocean Circulation
 Lesson: Ocean Circulation By Keith Meldahl Corresponding to Chapter 9: Ocean Circulation As this figure shows, there is a connection between the prevailing easterly and westerly winds (discussed in Chapter
El Niño / Southern Oscillation (ENSO) and inter-annual climate variability
 and inter-annual climate variability") El Niño / Southern Oscillation (ENSO) and inter-annual climate variability seasonal cycle what is normal? monthly average conditions through a calendar year sea level pressure and surface winds surface
El Niño / Southern Oscillation (ENSO) and inter-annual climate variability seasonal cycle what is normal? monthly average conditions through a calendar year sea level pressure and surface winds surface
VOLVO OCEAN RACE - The Route
 WISDOM S WORKSHEET 1.1 / TOPIC 1 / AGE 8-10 NAME: DATE: Hi! It s a race around the world! Can you label cities (in dotted boxes), countries and oceans in the map? VOLVO OCEAN RACE - The Route Oceans Mediterranean
Lecture 13. Global Wind Patterns and the Oceans EOM
 Lecture 13. Global Wind Patterns and the Oceans EOM Global Wind Patterns and the Oceans Drag from wind exerts a force called wind stress on the ocean surface in the direction of the wind. The currents
The Air-Sea Interaction. Masanori Konda Kyoto University
 2 The Air-Sea Interaction Masanori Konda Kyoto University 2.1 Feedback between Ocean and Atmosphere Heat and momentum exchange between the ocean and atmosphere Atmospheric circulation Condensation heat
March 4 th, 2019 Sample Current Affairs
 March 4 th, 2019 Sample Current Affairs 1. A weak El Niño is developing in the equatorial Pacific Ocean, which is expected to continue for a few months at least. What is El Nino? What causes El Nino? What
What s UP in the. Pacific Ocean? Learning Objectives
 What s UP in the Learning Objectives Pacific Ocean? In this module, you will follow a bluefin tuna on a spectacular migratory journey up and down the West Coast of North America and back and forth across
Landmark for the spawning of Japanese eel
 Landmark for the spawning of Japanese eel Shingo KIMURA and Katsumi TSUKAMOTO Ocean Research Institute, Univ. of Tokyo Salinity front in the North Equatorial Current El Niño/Southern Oscillation Index
Name: OBJECTIVES: By the end of today s lesson, you will be able to
 7 th Grade Science Unit: Water s Cycles and Patterns Lesson: WCP 21 Name: Date: Monday, October 3, 2016 Homeroom: _ OBJECTIVES: By the end of today s lesson, you will be able to SWBAT Explain how currents
Lecture 13 El Niño/La Niña Ocean-Atmosphere Interaction. Idealized 3-Cell Model of Wind Patterns on a Rotating Earth. Previous Lecture!
 Lecture 13 El Niño/La Niña Ocean-Atmosphere Interaction Previous Lecture! Global Winds General Circulation of winds at the surface and aloft Polar Jet Stream Subtropical Jet Stream Monsoons 1 2 Radiation
Name: Class: Date: Multiple Choice Identify the choice that best completes the statement or answers the question.
 Name: Class: _ Date: _ Ch. 9 Climate Test Multiple Choice Identify the choice that best completes the statement or answers the question. 1. The average, year-after-year conditions of temperature, precipitation,
Tropical Pacific Ocean remains on track for El Niño in 2014
 1 of 10 3/06/2014 3:33 PM ENSO Wrap-Up Current state of the Pacific and Indian Ocean Tropical Pacific Ocean remains on track for El Niño in 2014 Issued on Tuesday 3 June 2014 Product Code IDCKGEWWOO The
CHAPTER 7 Ocean Circulation
 1 2 3 4 5 6 7 8 9 10 11 12 13 14 CHAPTER 7 Ocean Circulation Words Ocean currents Moving seawater Surface ocean currents Transfer heat from warmer to cooler areas Similar to pattern of major wind belts
Ocean Circulation, Food Webs and Climate What does the wind have to do with feeding fish (and feeding us)?
?") Ocean Circulation, Food Webs and Climate What does the wind have to do with feeding fish (and feeding us)? El Niño: Tropical Oceans and Global Climate Reading: 9.10-9.13, 9.15 Graphic: Upwelling off Cape
Ocean Circulation, Food Webs and Climate What does the wind have to do with feeding fish (and feeding us)? El Niño: Tropical Oceans and Global Climate Reading: 9.10-9.13, 9.15 Graphic: Upwelling off Cape
(20 points) 1. ENSO is a coupled climate phenomenon in the tropical Pacific that has both regional and global impacts.
 1. ENSO is a coupled climate phenomenon in the tropical Pacific that has both regional and global impacts.") SIO 210 Problem Set 4 Answer key December 1, 2014 Due Dec. 12, 2014 (20 points) 1. ENSO is a coupled climate phenomenon in the tropical Pacific that has both regional and global impacts. (2 points) a)
SIO 210 Problem Set 4 Answer key December 1, 2014 Due Dec. 12, 2014 (20 points) 1. ENSO is a coupled climate phenomenon in the tropical Pacific that has both regional and global impacts. (2 points) a)
REMINDERS: UPCOMING REVIEW SESSIONS: - Thursday, Feb 27, 6:30-8:00pm in HSS 1330
 REMINDERS: Midterm 2: Friday, February 28 - lecture material covering chapters 6, 7, and 15 (since first midterm and through Wed lecture) - same Format as first midterm UPCOMING REVIEW SESSIONS: - Thursday,
OCEANOGRAPHY STUDY GUIDE
 OCEANOGRAPHY STUDY GUIDE Chapter 2 Section 1 1. Most abundant salt in ocean. Sodium chloride; NaCl 2. Amount of Earth covered by Water 71% 3. Four oceans: What are they? Atlantic, Pacific, Arctic, Indian
General Oceanography Geology 105 Expedition #19 The Ocean and Climate
 General Oceanography Geology 105 Expedition #19 The Ocean and Climate Name Not attempting to answer questions on expeditions will result in point deductions on course workbook (two or more blank answers
The Setting - Climatology of the Hawaiian Archipelago. Link to Video of Maui Waves
 The Setting - Climatology of the Hawaiian Archipelago Link to Video of Maui Waves What caused this week s weather? What caused this weekend s weather? Today s Objective: Provide overview and description
Variability in the tropical oceans - Monitoring and prediction of El Niño and La Niña -
 Variability in the tropical oceans - Monitoring and prediction of El Niño and La Niña - Jun ichi HIROSAWA Climate Prediction Division Japan Meteorological Agency SST anomaly in Nov. 1997 1 ( ) Outline
Volvo Ocean Race Sustainability Education Programme
 Volvo Ocean Race Sustainability Education Programme Teachers Guide TOPIC 1 Volvo Ocean Race Teachers Guide Topic 1 What is the Volvo Ocean Race? Photo: Ainhoa Sánchez / Volvo Ocean Race Content Introduction
170 points. 38 points In your textbook, read about modern oceanography. For each item write the word that meets the description.
 Ch 15 Earth s Oceans SECTION 15.1 An Overview of Oceans 38 points In your textbook, read about modern oceanography. For each item write the word that meets the description. (5 points) 1. German research
ENSO Wrap-Up. Current state of the Pacific and Indian Ocean
 18-11-2014 ENSO Wrap-Up Current state of the Pacific and Indian Ocean Tropical Pacific Ocean moves closer to El Niño The Pacific Ocean has shown some renewed signs of El Niño development in recent weeks.
IX. Upper Ocean Circulation
 IX. Upper Ocean Circulation World Ocean Covers 71% of Earth s surface Contains 97% of surface water Arctic Ocean NH: 61% ocean, 39% land Pacific Ocean Atlantic Ocean Southern Ocean Indian Ocean SH: 81%
OCEANOGRAPHY 101. Map, and temperature, salinity & density profiles of the water column at X, near mouth of the Columbia River.
 OCEANOGRAPHY 101 EXAM 2 WINTER 00 NAME STUDENT NUMBER 1 Map, and temperature, salinity & density profiles of the water column at X, near mouth of the Columbia River. P a c i f i c O c e a n X WA Columbia
OCN-201 Chemistry and Physics section
 Name: Class: _ Date: _ OCN-201 Chemistry and Physics section True/False Indicate whether the statement is true or false. 1. Because of the dissolved salt in seawater its freezing point is lower than that
Shoes, Rubber Duckies,, and El Niño
 Shoes, Rubber Duckies,, and El Niño How they are related By Laura Maliszewski and Liz Strojny New Gifts found in the Ocean Instead of that chest full of gold... Did you know you could find that new rubber
OCN 201 Lab Fall 2009 OCN 201. Lab 9 - El Niño
 OCN 201 Lab Fall 2009 OCN 201 Lab 9 - El Niño El Niño is probably one of the most widely publicized oceanic phenomena. If there s one single reason for that it s probably the fact that El Niño s presence
El Nino and Global Warming
 El Nino and Global Warming El Niño and Global Warming El Niño Climate Trade winds Barometric pressure Southern oscillation WHAT YOU WILL LEARN 1. You will identify the cause of El Niño events. 2. You will
El Niño Unit (2.5 pts)
") T. James Noyes, El Camino College El Niño Unit (Topic 9B) page 1 Name: Section: El Niño Unit (2.5 pts) El Niño is a warm ocean current that flows along the Equator and towards the west coast of South America
T. James Noyes, El Camino College El Niño Unit (Topic 9B) page 1 Name: Section: El Niño Unit (2.5 pts) El Niño is a warm ocean current that flows along the Equator and towards the west coast of South America
VOLVO OCEAN RACE - The Route
 WISDOM S WORKSHEET 1.1 / TOPIC 1 / AGE 10-12 NAME: DATE: Hi! It s a race around the world and the sailors will see some amazing places! Can you label the host cities, the countries they are in and the
PRELIMINARY CRUISE REPORT, W9909C R/V WECOMA, September 1999 GLOBEC/ENSO Long-Term Observations off Oregon
 Submitted by Jane Fleischbein College of Oceanic & Atmospheric Sciences Oregon State University Corvallis, Oregon 97331-553 flei@oce.orst.edu, 541.737.5698 FILING DATE: 1 October 1999 PRELIMINARY CRUISE
ENSO Cycle: Recent Evolution, Current Status and Predictions. Update prepared by Climate Prediction Center / NCEP 8 March 2010
 ENSO Cycle: Recent Evolution, Current Status and Predictions Update prepared by Climate Prediction Center / NCEP 8 March 2010 Outline Overview Recent Evolution and Current Conditions Oceanic Niño Index
Marine pollution originating from purse seine and longline fishing vessel operations in the Western and Central Pacific Ocean,
 Marine pollution originating from purse seine and longline fishing vessel operations in the Western and Central Pacific Ocean, 2003-2015 Source: Olive Ridley Project Source: Rizkiyanto, 2011 Kelsey Richardson
Equatorial upwelling. Example of regional winds of small scale
 Example of regional winds of small scale Sea and land breezes Note on Fig. 8.11. Shows the case for southern hemisphere! Coastal upwelling and downwelling. Upwelling is caused by along shore winds, that
OCN 201, Chemistry & Physics Section
 , A 1-April-2015 Name: Answer the True/False and Multiple Choice questions on the scantron sheet. Answer the remaining questions on this exam handout. Turn in both the scantron and exam at the end of class.
Birch Aquarium at Scripps Institution Oceanography
 Student Name: Section: Grade: Birch Aquarium at Scripps Institution Oceanography Introduction: The purpose of this ocean lab field trip is to observe and study live marine life, their habitats, and the
Grade 8 Science. Unit 1: Water Systems on Earth Chapter 3
 Grade 8 Science Unit 1: Water Systems on Earth Chapter 3 Heat Capacity A measure of how long it takes a material to heat up or cool down. Water has a high heat capacity... It takes a long time to heat
SCIENTIFIC COMMITTEE TENTH REGULAR SESSION. Majuro, Republic of the Marshall Islands 6-14 August 2014
 SCIENTIFIC COMMITTEE TENTH REGULAR SESSION Majuro, Republic of the Marshall Islands 6-14 August 214 OVERVIEW OF SIZE DATA FOR BIGEYE TUNA CAUGHT BY JAPANESE LONGLINE FISHERY IN THE PACIFIC OCEAN WCPFC-SC1-214/
and found that there exist a significant overlap between the billfish resources and the exploitation activities targeting tunas and mahi mahi.
 Executive Summary Report 2016 Billfish Research in the Eastern Pacific Ocean Rosenstiel School of Marine and Atmospheric Science University of Miami January 2017 During 2016, the Eastern Pacific Ocean
PART I: DRAFT [PRACTICAL] GUIDELINES OF IOC, WITHIN THE CONTEXT OF UNCLOS, FOR THE COLLECTION OF OCEANOGRAPHIC DATA BY SPECIFIC MEANS
![PART I: DRAFT [PRACTICAL] GUIDELINES OF IOC, WITHIN THE CONTEXT OF UNCLOS, FOR THE COLLECTION OF OCEANOGRAPHIC DATA BY SPECIFIC MEANS](/thumbs/89/99229578.jpg "PART I: DRAFT [PRACTICAL] GUIDELINES OF IOC, WITHIN THE CONTEXT OF UNCLOS, FOR THE COLLECTION OF OCEANOGRAPHIC DATA BY SPECIFIC MEANS") Agenda item: 3.2 IOC/ABE-LOS VII/7 Paris, 19 February 2007 Original: English INTERGOVERNMENTAL OCEANOGRAPHIC COMMISSION (of UNESCO) SEVENTH MEETING OF THE ADVISORY BODY OF EXPERTS ON THE LAW OF THE SEA
Agenda item: 3.2 IOC/ABE-LOS VII/7 Paris, 19 February 2007 Original: English INTERGOVERNMENTAL OCEANOGRAPHIC COMMISSION (of UNESCO) SEVENTH MEETING OF THE ADVISORY BODY OF EXPERTS ON THE LAW OF THE SEA
GEOS 201 Lab 13 Climate of Change InTeGrate Module Case studies 2.2 & 3.1
 Discerning Patterns: Does the North Atlantic oscillate? Climate variability, or short term climate change, can wreak havoc around the world. Dramatic year to year shifts in weather can have unanticipated
NOTE ->->-> DUE THURSDAY APRIL 20 TH 2006 THAT IS CORRECT I FORGOT THIS IS EASTER WEEKEND SO I HAVE EXTENDED THE DUE DATE TO THE ABOVE
 GEO 130 NAME OCEANOGRAPHY TEST 3 TAKE HOME TEST SPRING 2006 NOTE ->->-> DUE THURSDAY APRIL 20 TH 2006 THAT IS CORRECT I FORGOT THIS IS EASTER WEEKEND SO I HAVE EXTENDED THE DUE DATE TO THE ABOVE This test
APPENDIX B NOAA DROUGHT ANALYSIS 29 OCTOBER 2007
 APPENDIX B NOAA DROUGHT ANALYSIS 29 OCTOBER 2007 ENSO Cycle: Recent Evolution, Current Status and Predictions Update prepared by Climate Prediction Center / NCEP October 29, 2007 Outline Overview Recent
The Next Generation Easy-to-Deploy (ETD) Tsunami Assessment Buoy
 Tsunami Assessment Buoy") The Next Generation Easy-to-Deploy (ETD) Tsunami Assessment Buoy R.A. Lawson and D. Graham Science Applications International Corporation 4025 Hancock Street San Diego, CA 92110 USA S. Stalin, C. Meinig,
The Next Generation Easy-to-Deploy (ETD) Tsunami Assessment Buoy R.A. Lawson and D. Graham Science Applications International Corporation 4025 Hancock Street San Diego, CA 92110 USA S. Stalin, C. Meinig,
Tuna [211] 86587_p211_220.indd 86587_p211_220.indd /30/04 12/30/04 4:53:37 4:53:37 PM PM
![Tuna [211] 86587_p211_220.indd 86587_p211_220.indd /30/04 12/30/04 4:53:37 4:53:37 PM PM](/thumbs/85/92584906.jpg "Tuna [211] 86587_p211_220.indd 86587_p211_220.indd /30/04 12/30/04 4:53:37 4:53:37 PM PM") Tuna [] highlights Ocean and Climate Changes The catches of Pacific bluefin tuna and North Pacific albacore tuna have fluctuated considerably from year to year, but no upward or downward trends are apparent
Tuna [] highlights Ocean and Climate Changes The catches of Pacific bluefin tuna and North Pacific albacore tuna have fluctuated considerably from year to year, but no upward or downward trends are apparent
Introduction to Physical Oceanography STUDENT NOTES Date: 1. What do you know about solar radiation at different parts of the world?
 Introduction to Physical Oceanography STUDENT NOTES Date: 1 Warm up What do you know about solar radiation at different parts of the world? What affect does the tilt of the Earth have on the northern and
Currents. History. Pressure Cells 3/13/17. El Nino Southern Oscillation ENSO. Teleconnections and Oscillations. Neutral Conditions
 Teleconnections and Oscillations Teleconnection climate anomalies being related to each other over a large scale Oscillations: Macroscale movement of atmospheric systems that can influence weather, climate,
TEACHER VERSION: Suggested Student Responses Included. Upwelling and Phytoplankton Productivity
 Name: Date: TEACHER VERSION: Suggested Student Responses Included Guiding Questions: Upwelling and Phytoplankton Productivity How does nutrient concentration influence phytoplankton growth in coastal and
and the Link between Oceans, Atmosphere, and Weather
 Geography Worksheet Instructions Using a map, atlas, or any other materials your teacher suggests, label the following on the blank map provided. 1. Label East, West, North, and South. 2. Label the following
Blue crab ecology and exploitation in a changing climate.
 STAC Workshop 28 March 2017 Blue crab ecology and exploitation in a changing climate. Thomas Miller Chesapeake Biological Laboratory University of Maryland Center for Environmental Science Solomons, MD
Is fishing really worth more than
 Is fishing really worth more than biodiversity in the open ocean? $$ =? Summer Martin 1, Lisa T. Ballance 1,2, Theodore Groves 3 1 Scripps Institution of Oceanography 2 NOAA Fisheries, Southwest Fisheries
Wind Driven Circulation Indian Ocean and Southern Ocean
 Wind Driven Circulation Indian Ocean and Southern Ocean Lecture 18 MAR 350 Spring 2017 Reading: Knauss Chapter 7 ECCO2 model animation ecco2_sst_flow (2).mp4 Mean surface height and currents DPO Fig. 11.1
Ocean Currents Unit (4 pts)
") Name: Section: Ocean Currents Unit (Topic 9A-1) page 1 Ocean Currents Unit (4 pts) Ocean Currents An ocean current is like a river in the ocean: water is flowing traveling from place to place. Historically,
Name: Section: Ocean Currents Unit (Topic 9A-1) page 1 Ocean Currents Unit (4 pts) Ocean Currents An ocean current is like a river in the ocean: water is flowing traveling from place to place. Historically,
Atmospheric Forcing and the Structure and Evolution of the Upper Ocean in the Bay of Bengal
 DISTRIBUTION STATEMENT A. Approved for public release; distribution is unlimited. Atmospheric Forcing and the Structure and Evolution of the Upper Ocean in the Bay of Bengal J. Thomas Farrar and Robert
Oceanography 10. Practice Exam #4
 Practice Exam #4 (Topics 8A, 9A, 10A, & 14C) page 1 Oceanography 10 Name: Practice Exam #4 This test is worth a total of 73 pts. You will have approximately 1.75 hours to finish the test. Write the answers
Activity: Because the Earth Turns
 Activity: Because the Earth Turns Introduction: Almost everywhere on Earth (except at the equator), objects moving horizontally and freely (unconstrained) across Earth s surface travel in curved paths.
CORIOLIS, A FRENCH PROJECT FOR IN SITU OPERATIONAL OCEANOGRAPHY. S. Pouliquen, A. Billant, Y. Desaubies, G. Loaec, F. Gaillard, G.
 CORIOLIS, A FRENCH PROJECT FOR IN SITU OPERATIONAL OCEANOGRAPHY S. Pouliquen, A. Billant, Y. Desaubies, G. Loaec, F. Gaillard, G. Maudire IFREMER, BP70, 29280 Plouzané, France Sylvie.Pouliquen@ifremer.fr
JCOMM Technical Workshop on Wave Measurements from Buoys
 JCOMM Technical Workshop on Wave Measurements from Buoys Val Swail Chair, JCOMM Expert Team on Wind Waves and Storm Surges Neville Smith Vincent Cardone Peter Janssen Gerbrand Komen Peter Taylor WIND WAVES
Climate-Ocean Variability, Fisheries and Coastal Response in Indonesian waters
 Climate-Ocean Variability, Fisheries and Coastal Response in Indonesian waters Jonson Lumban-Gaol 1, Stefano Vignudelli 2 and Takahiro Osawa 3 1 Department of Marine Science and Technology Bogor Agriculture
Our Climate: A Global Challenge. Academy of Lifelong Learning Denver, CO April 9, 2015
 Our Climate: A Global Challenge Academy of Lifelong Learning Denver, CO April 9, 2015 Oceans Thermohaline Circulation It takes water 500 to 1000 years to go around the planet. Thermohaline Circulation,
For Class Today How does ocean water circulate? Ocean currents, surface currents, gyres, currents & climate, upwelling, deep ocean circulation
 For Class Today Modified Cornell Notes on section 16.1 (pg. 448-453) **Follow the guide in your ISN and previous notes for help** Heading: How does ocean water circulate? Left hand side categories: Ocean
ENSO Cycle: Recent Evolution, Current Status and Predictions. Update prepared by Climate Prediction Center / NCEP 4 September 2012
 ENSO Cycle: Recent Evolution, Current Status and Predictions Update prepared by Climate Prediction Center / NCEP 4 September 2012 Outline Overview Recent Evolution and Current Conditions Oceanic Niño Index
MFE 659 Lecture 2b El Niño/La Niña Ocean-Atmosphere Interaction. El Niño La Niña Ocean-Atmosphere Interaction. Intro to Ocean Circulation
 MFE 659 Lecture 2b El Niño/La Niña Ocean-Atmosphere Interaction El Niño La Niña Ocean-Atmosphere Interaction Outline Ocean Circulation El Niño La Niña Southern Oscillation ENSO 1 2 Intro to Ocean Circulation
OCN201 Spring14 1. Name: Class: Date: True/False Indicate whether the statement is true or false.
 Name: Class: _ Date: _ OCN201 Spring14 1 True/False Indicate whether the statement is true or false. 1. Short residence time elements are uniformly distributed in the oceans 2. Thermohaline circulation
Introduction to Oceanography OCE 1001
 Introduction to Oceanography OCE 1001 Lecture Notes Chantale Bégin & Jessica Fry Version 2.1 10. Ocean Circulation (Trujillo, Chapter 7) Major ocean currents are stable and predictable; they have been
SURFACE CURRENTS AND TIDES
 NAME SURFACE CURRENTS AND TIDES I. Origin of surface currents Surface currents arise due to the interaction of the prevailing wis a the ocean surface. Hence the surface wi pattern (Figure 1) plays a key
Seasonal predictions of equatorial Atlantic SST in a low-resolution CGCM with surface Heat Flux Correction
 Seasonal predictions of equatorial Atlantic SST in a low-resolution CGCM with surface Heat Flux Correction T. Dippe 1, R. Greatbatch 1, and H. Ding 2 [1] GEOMAR Helmholtz Centre for Ocean Research, Kiel
Oceans and the Global Environment: Lec 2 taking physics and chemistry outdoors. the flowing, waving ocean
 Oceans and the Global Environment: Lec 2 taking physics and chemistry outdoors the flowing, waving ocean Peter Rhines 1 Eric Lindahl 2 Bob Koon 2, Julie Wright 3 www.ocean.washington.edu/courses/has221a-08
The ocean water is dynamic. Its physical
 CHAPTER MOVEMENTS OF OCEAN WATER The ocean water is dynamic. Its physical characteristics like temperature, salinity, density and the external forces like of the sun, moon and the winds influence the movement
Habitat Use and Behavioral Monitoring of Hawaiian Monk Seals in Proximity to the Navy Hawaii Range Complex
 Project Annual Report Habitat Use and Behavioral Monitoring of Hawaiian Monk Seals in Proximity to the Navy Hawaii Range Complex Report Period: July 2011 June 2012 Submitted by: Kenady Wilson, Scientist
EARTH, PLANETARY, & SPACE SCIENCES 15 INTRODUCTION TO OCEANOGRAPHY. LABORATORY SESSION #6 Fall Ocean Circulation
 EARTH, PLANETARY, & SPACE SCIENCES 15 INTRODUCTION TO OCEANOGRAPHY LABORATORY SESSION #6 Fall 2017 Ocean Circulation The focus of the Lab this week is circulation of the ocean and atmosphere. Here, you
Module 3, Investigation 1: Briefing 1 What are the effects of ENSO?
 Module 3, Investigation 1: Briefing 1 Background The changing temperatures of the tropical Pacific Ocean affect climate variability all over Earth. Ocean warming and cooling dramatically affect human activities
Chapter 9: Circulation of the Ocean
 Chapter 9: Circulation of the Ocean Tropical gardens on Britain s Scilly Isles. Only 48 kilometers (30 miles) off the coast of Cornwall at 50 N, these scenic islands lie in the path of the warm waters
The Child. Mean Annual SST Cycle 11/19/12
 Introduction to Climatology GEOGRAPHY 300 El Niño-Southern Oscillation Tom Giambelluca University of Hawai i at Mānoa and Pacific Decadal Oscillation ENSO: El Niño-Southern Oscillation PDO: Pacific Decadal
ESS15 Lecture 12. Review, tropical oceans & El Nino, and the thermohaline ocean circulation. Please see new reading material on website.
 ESS15 Lecture 12 Review, tropical oceans & El Nino, and the thermohaline ocean circulation. Please see new reading material on website. Review. I-clicker exercise: In this graph of Earth s energy imbalances
Drifting buoys. Survey as of 13 December 2016 (ECMWF) JMA starts to produce BUFR
 JMA starts to produce BUFR") Drifting buoys For more than 30 years, drifting buoys had been sending their observations ashore thanks to the Argos system, exclusively. Argos data are processed by CLS in Toulouse (France) and in Largo
Drifting buoys For more than 30 years, drifting buoys had been sending their observations ashore thanks to the Argos system, exclusively. Argos data are processed by CLS in Toulouse (France) and in Largo
Write about this. Have you ever experienced a very strong wind gust? What happened? Have you ever felt a gentle breeze? What did it feel like?
 Write about this. Have you ever experienced a very strong wind gust? What happened? Have you ever felt a gentle breeze? What did it feel like? How wind works Winds flow on earth based on differences in
Goals for today: continuing Ch 8: Atmospheric Circulation and Pressure Distributions. 26 Oct., 2011
 Goals for today: 26 Oct., 2011 continuing Ch 8: Atmospheric Circulation and Pressure Distributions Examples of synoptic scale and mesoscale circulation systems that are driven by geographic diversity in
1 Currents. TAKE A LOOK 2. Read a Map In what direction does the Gulf Stream flow?
 CHAPTER 5 1 Currents SECTION The Movement of Ocean Water BEFORE YOU READ After you read this section, you should be able to answer these questions: What factors affect ocean currents? Why are ocean currents
Name Date L.O: SWBAT explain what breezes, planetary winds, ocean currents & monsoons are.
 Name Date L.O: SWBAT explain what breezes, planetary winds, ocean currents & monsoons are. 1. A cool breeze is blowing toward the land from the ocean on a warm, cloudless summer day. This condition is
MAPCO2 Buoy Metadata Report Project Title:
 MAPCO2 Buoy Metadata Report Project Title: Autonomous Multi-parameter Measurements from a Drifting Buoy During the SO GasEx Experiment Funding Agency: NOAA Global Carbon Cycle program PI(s): Christopher
RESOURCE BOOKLET M13/4/ENVSO/SP2/ENG/TZ0/XX/T ENVIRONMENTAL SYSTEMS AND SOCIETIES PAPER 2. Tuesday 7 May 2013 (afternoon) 2 hours
 2 hours") M13/4/ENVSO/SP2/ENG/TZ0/XX/T 22136303 ENVIRONMENTAL SYSTEMS AND SOCIETIES Standard level PAPER 2 Tuesday 7 May 2013 (afternoon) 2 hours RESOURCE BOOKLET INSTRUCTIONS TO CANDIDATES Do not open this booklet
M13/4/ENVSO/SP2/ENG/TZ0/XX/T 22136303 ENVIRONMENTAL SYSTEMS AND SOCIETIES Standard level PAPER 2 Tuesday 7 May 2013 (afternoon) 2 hours RESOURCE BOOKLET INSTRUCTIONS TO CANDIDATES Do not open this booklet
SCIENTIFIC COMMITTEE Second Regular Session 7-18 August 2006 Manila, Philippines
 SCIENTIFIC COMMITTEE Second Regular Session 7-18 August 2006 Manila, Philippines ANNUAL REPORT PART 1 NEW CALEDONIA The tuna fleet in New Caledonia is composed of longliners managed by 100 % local companies.
El Niño and the Winter Weather Outlook
 El Niño and the 2015-2016 Winter Weather Outlook 2015 NASEO Annual Meeting http://www.ospo.noaa.gov/products/ocean/sst/anomaly/ NWS Boston February 10, 2015 Jimmy Taeger Meteorologist National Weather
What Causes Wind? Exploration: How Does Air Move When Pressure Builds Up? 4.2 Explore. Predict
 4.2 Explore What Causes Wind? In Learning Set 1, you built an anemometer. You used it to measure wind speed and direction in your community. In the last section, you read about how wind and ocean currents
McKnight's Physical Geography 11e
 Chapter 2 Lecture McKnight's Physical Geography 11e Lectures Chapter 5 Atmospheric Pressure and Wind Michael Commons Ohio Northern University Atmospheric Pressure and Wind The Nature of Atmospheric Pressure
Role of the oceans in the climate system
 Role of the oceans in the climate system heat exchange and transport hydrological cycle and air-sea exchange of moisture wind, currents, and upwelling gas exchange and carbon cycle Heat transport Two Primary
Chapter 6. Atmospheric and Oceanic. Circulations. Circulations
 Chapter 6 Atmospheric and Oceanic Circulations Robert W. Christopherson Charlie Thomsen Winds: Transfer energy and mass (1) Balance energy equatorial energy surplus and polar energy deficit (2) Generate
Directed Reading. Section: Ocean Currents. a(n). FACTORS THAT AFFECT SURFACE CURRENTS
. FACTORS THAT AFFECT SURFACE CURRENTS") Skills Worksheet Directed Reading Section: Ocean Currents 1. A horizontal movement of water in a well-defined pattern is called a(n). 2. What are two ways that oceanographers identify ocean currents? 3.
Skills Worksheet Directed Reading Section: Ocean Currents 1. A horizontal movement of water in a well-defined pattern is called a(n). 2. What are two ways that oceanographers identify ocean currents? 3.