Science programme. Preliminary results Legs 1,2,3 and 4. volvooceanrace.com
|
|
|
- Randall Maxwell
- 5 years ago
- Views:
Transcription

1 Science programme Preliminary results Legs 1,2,3 and 4 Compiled using data provided by Dr Toste Tanhua & Dr Ing. Sören Gutekunst, GEOMAR Cluster of Excellence Future Ocean, Helmholtz Centre for Ocean Research. With thanks to the Turn the Tide on Plastic team, in particular Liz Wardley, for facilitating and conducting the data collection. Further correspondence contact: Mairéad O'Donovan education@volvooceanrace.com / Soren Gutekunst sgutekunst@geomar.de Media & Communication: Robin Clegg robin.clegg@volvooceanrace.com Central Coordination: Volvo Ocean Race Anne-Cécile Turner annececile.turner@volvooceanrace.com All contacts p. 21
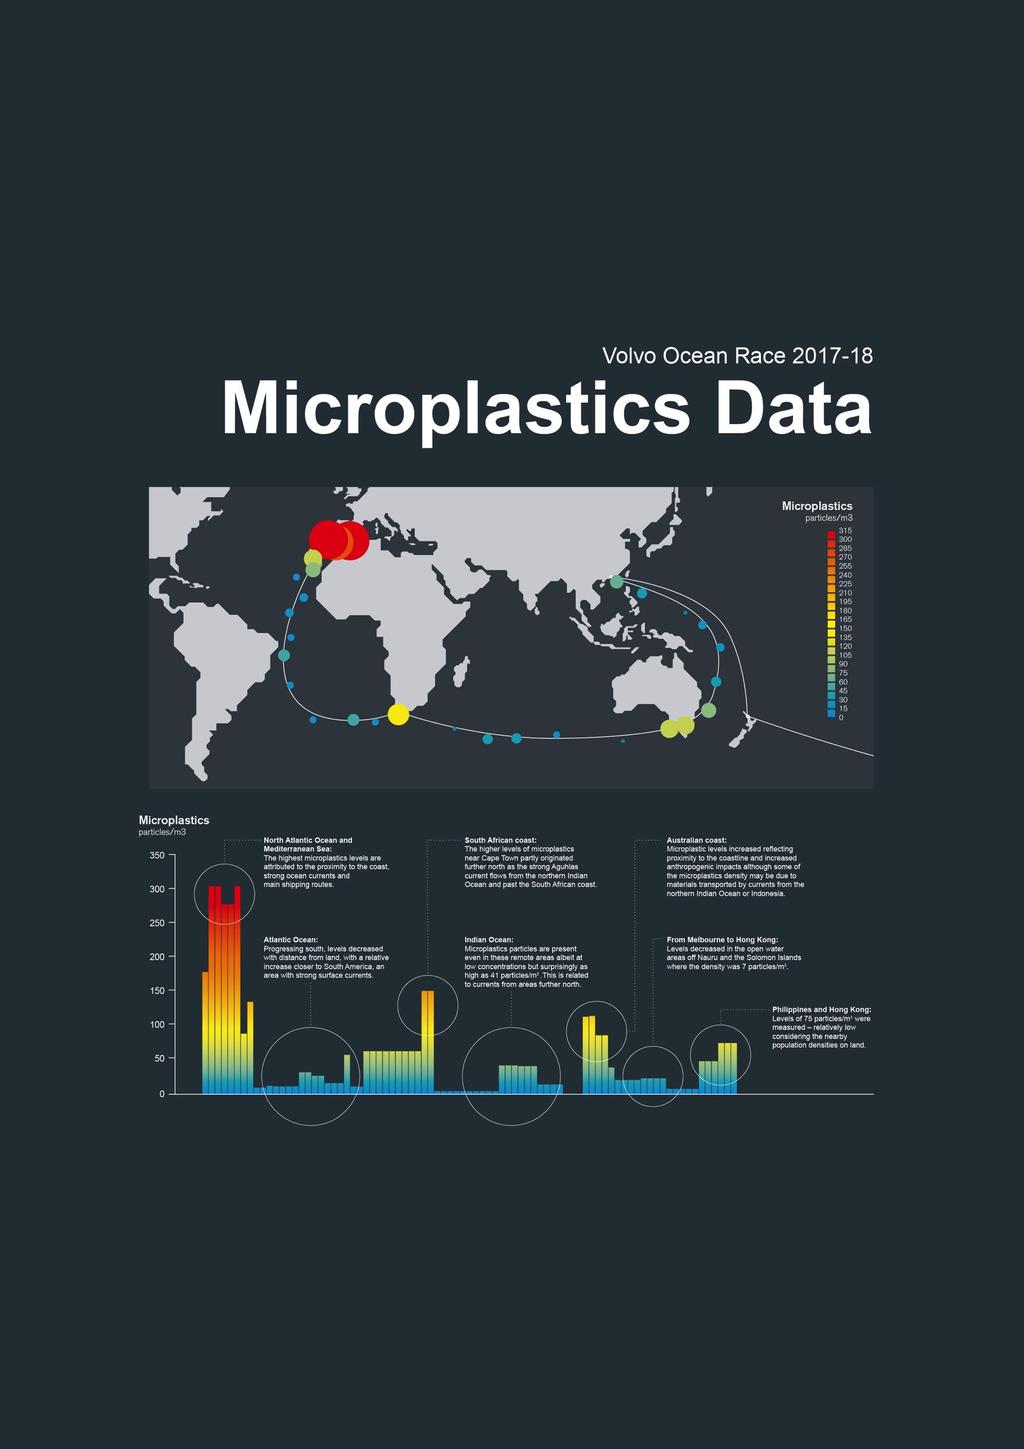
2 Executive Summary The Volvo Ocean Race Science Programme has brought together an elite scientific consortium to capture data that will contribute to a better understanding of the world s ocean and climate. There are three elements to the programme: onboard sampling of oceanographic variables and microplastics concentrations; scientific drifter buoy deployment; sharing of boats meteorological measurements. Environmental and oceanographic data from onboard sampling, scientific drifter buoys and meteorological measurements will contribute a vast amount of data especially from critical data-sparse areas to improve the reliability of forecasts and simulation predictions relating to storms, weather, climate and ocean health. The potential to model the data in combination with ocean current information will provide an exceptional insight into where plastic pollution is originating and accumulating as an area s microplastics burden will be related to both local sources and long-range transport via ocean currents. Most notable to date are the preliminary results from samples collected by the Turn the Tide on Plastic boat that have confirmed microplastics to be present in all samples analysed, even those from the remote Southern Ocean. Preliminary results show the highest levels of microplastics recorded by the Volvo Ocean Race study so far in European Atlantic waters off the coasts of Spain and Portugal, where the average level was 307 particles of microplastics per cubic metre. In the western Mediterranean recorded levels were next highest at 280 particles per cubic metre. Levels of 152 particles per cubic metre were recorded off the southeast coast of South Africa and 115 particles per cubic metre off the south coast of Australia. Collaboration, Funding and Support The onboard sampling component of the science programme is a collaboration between Volvo Cars, GEOMAR Cluster of Excellence Future Ocean Kiel, SubCtech GmbH, bbe Moldaenke and Turn the Tide on Plastic crew. A second sampling unit was fitted to the AkzoNobel boat to provide a second sampling boat proceeding from Auckland (Leg 7). Volvo Cars is funding the onboard equipment through profits from the sale of their Cross Country Volvo V90 Ocean Race edition cars. The scientific drifter buoys are part of the National Oceanic and Atmospheric Administration s (NOAA) drifter programme. The sharing of meteorological data measured from the boats is part of a pilot project developed by JCOMM (Joint technical Commission for Oceanography and Marine Meteorology, WMO IOC1) partners. These organisations are brought together by the Volvo Ocean Race sustainability programme, in order to increase Ocean knowledge, pioneer a new area of data collection and advance the technology of instrumentation in order to contribute to create a global map of standardised data, specifically in the area of Microplastic concentration.

3 Photo Amory Ross Volvo Ocean Race volvooceanrace.com Ships of Opportunity The major value of the programme lies in the unique opportunity that the race route presents for gathering data in areas otherwise hard to access for data collection. The ocean is seriously under-sampled and the lack of data is most notable in remote areas outside of routine shipping routes and at locations difficult and expensive for scientific surveys to reach. The extent of microplastics pollution in the world s oceans is largely unknown. It is estimated that data exists for just 1% of microplastics that are present in the sea and these data are primarily for the surface layer, beaches and in areas relatively close to land. The Volvo Ocean Race provides an exceptional opportunity to directly sample remote areas and to shed light on the global scale and geographical distribution of microplastics pollution in the ocean. The lack of actual measurements of environmental and oceanographic variables in data-sparse areas affects the reliability of forecasting and modelling simulations. For some variables remote sensing (via satellites) can be used, but for predictions to be accurate satellite measurements need to be validated by real measurements. The contribution of Volvo Ocean Race scientific data to more accurate future storm, weather, climate and ocean health predictions is immense. Volvo Ocean Race boats are ideal ships of opportunity for scientific data collection.

4 Ainhoa Sanchez Volvo Ocean Race volvooceanrace.com Onboard sampling
 and now onboard AkzoNobel (from Leg 7), combine two units sampling: Partial pressure of carbon dioxide (pco 2 ) Sea")
5 What is being measured? The sampling devices onboard our race boats Turn the Tide on Plastic (from Leg 1) and now onboard AkzoNobel (from Leg 7), combine two units sampling: Partial pressure of carbon dioxide (pco 2 ) Sea Surface Temperature (SST) Sea Surface Salinity (SSS) Chlorophyll a Microplastics How are we doing this? When sea water is being pumped to provide the boat and crew s water, typically for one hour every 20 hours, the underway is sampled. The critical task of carrying out the onboard sampling is completed by Turn the Tide on Plastic Boat Captain Liz Wardley. Boat Captain Nicolai Sehested and Onboard Reporter James Blake will be responsible for sampling on AkzoNobel. The water is taken from just below the ocean surface with the exact depth depending on the heel of the boat. This is significant as most previous research on microplastics has focussed on sampling the surface of the water. The microplastics sampling unit incorporates a filter system with up to three filters that are changed every two days. The filters capture microplastics and at each race stopover GEOMAR scientists from Germany recover them for analyses in their Kiel laboratory. The OceanPack RACE unit has sensors that record in-situ measurements of oceanographic variables. Partial pressure of carbon dioxide (pco 2 ) Sea Surface Temperature (SST) Sea Surface Salinity (SSS) Chlorophyll a Photo Volvo Ocean Race For further information on the relevance of these oceanographic variables refer to Read More about Oceanography below

6 Photo Jeremie Lecaudey Volvo Ocean Race volvooceanrace.com Pioneering microplastics analyses Dr Sören Gutekunst, of GEOMAR Institute for Ocean Research analyses the microplastics samples at a laboratory in Kiel, Germany using a pioneering prototype system (developed by bbe Moldaenke) to quantify microplastics levels. A holographic camera measures the size of particles and a RAMAN spectroscope identifies which particles are plastic. The process, although still quite time-consuming (6 hours per filter), is considerably more efficient and less subjective than manual analyses using a microscope and has the potential to establish a standard for microplastics sampling. Sharing data Microplastics findings will be published and submitted after complete analyses to the Pangaea data repository ( and the Transboundary Waters Assessment Programme TWAP ( Volvo Ocean Race CO 2 data will be submitted to fill significant gaps in the Surface Ocean CO 2 Atlas - SOCAT ( - and from there will be available to scientists for modelling purposes. The surface ocean salinity and temperature data will be submitted to the Coriolis real-time data centre ( and to the Surface Ocean data centre (GOSUD - to be made available for modelling.
7 Preliminary results Provided by Dr Toste Tanhua and Dr-Ing. Sören Gutekunst, GEOMAR Helmholtz Centre for Ocean Research Kiel Leg 1: Alicante to Lisbon Leg 2: Lisbon to Cape Town Leg 3: Cape Town to Melbourne Leg 4: Melbourne to Hong Kong Unprecedented microplastics dataset The Volvo Ocean Race microplastics data analysed to date give a unique synoptic picture of the distribution of microplastics in the oceans. It represents a remarkable dataset given the extensive coverage of previously unsampled ocean and the fact that the data from different areas are comparable, having been measured in a consistent way using a single sampling unit. A dataset like this is unprecedented. Interpreting data Any results presented here are preliminary and are essentially a summary of the data values measured so far. It is premature at this stage to attribute the microplastic levels recorded entirely to either local sources or long-range transport as microplastics concentration will be related to average surface currents. To examine this a project is being initiated with ocean modellers at GEOMAR to combine microplastics data with surface current modelling to attempt to back track the origin of the plastic pollution. Photo Volvo Ocean Race
8

9 Preliminary results - Microplastics Provided by Dr Toste Tanhua and Dr-Ing. Sören Gutekunst, GEOMAR Helmholtz Centre for Ocean Research Kiel Microplastics detected in all areas Overall the most important fact is that microplastics were detected in samples from all areas including the remote sections of the race route in the southern Indian Ocean, thousands of kilometres from any major landmass (refer to the map in Figure 1 below). Also, as illustrated in the map there are areas with noticeably higher concentrations of microplastics. Modelling of the microplastics distribution based on ocean current movements will provide a better insight into the areas where microplastic pollution originates and accumulates. Figure 1: Map illustrating preliminary microplastics data (particles per m 3 ) from samples collected by Turn the Tide on Plastic during Volvo Ocean Race legs 1, 2, 3 and 4 Dr-Ing. Sören Gutekunst, GEOMAR Helmholtz Centre for Ocean Research Kiel Photo Volvo Ocean Race

10 Preliminary results - Microplastics Provided by Dr Toste Tanhua and Dr-Ing. Sören Gutekunst, GEOMAR Helmholtz Centre for Ocean Research Ki Leg 1 and prologue Mediterranean & inshore North Atlantic The highest relative microplastics levels along the race route so far have been recorded west of the Strait of Gibraltar, i.e. in the North Atlantic off Spain and Portugal (averages of 180 particles/m 3 and 307 particles/m 3 ), and in the western Mediterranean Sea (280 particles/m 3 ). Refer to the map in Figure 2 below which includes also preliminary results recorded during the race prologue. Levels decreased with distance from land but were still as high as 136 particles/m 3 in the North Atlantic southwest of Iberia. The adjacent coast is heavily populated and the route sampled coincides with major shipping routes and strong currents. It is worth noting that the surface waters in the Mediterranean mainly have an origin in the Atlantic so that the high microplastics concentrations off Portugal and southern Spain are likely to have originated to the north rather than from the Mediterranean. Photo Volvo Ocean Race Figure 2: Map illustrating preliminary microplastics data (particles per m 3 ) from samples collected by Turn the Tide on Plastic during Volvo Ocean Race legs 0, 1 and 2 Dr-Ing. Sören Gutekunst, GEOMAR Helmholtz Centre for Ocean Research Kiel
11 Preliminary results - Microplastics Provided by Dr Toste Tanhua and Dr-Ing. Sören Gutekunst, GEOMAR Helmholtz Centre for Ocean Research Kiel Leg 2 Atlantic Progressing offshore and south through the Atlantic, microplastics levels ranged between 11 and 32 particles/m 3 with a relative increase to 57 particles/m 3 closer to the coast of South America and in an area with potentially relatively strong surface currents. Advancing south and east across the southern Atlantic average levels of 11 particles/m 3 were measured until the approach to African mainland when average concentrations increased to 63 particles/m 3. The latter may reflect proximity to land and/or concentration of microplastics due to currents. The relatively higher microplastics concentration southeast of Cape Town, 152 particles/m 3, is likely to have partly originated further north as the strong Aguhlas current flows from the northern part of the Indian ocean and south past the South African coast. Leg 3 Southern Indian Ocean The race leg between Cape Town and Melbourne was particularly significant as it traversed remote waters of the southern Indian Ocean and provided an especially unique opportunity for sampling. The data showed that microplastics particles are present even in these remote areas albeit at low concentrations in places - 4 particles/m 3 southeast of Africa, but surprisingly as high as 41 particles/m 3 further east and at the lowest latitude sampled along the race route to date (latitude 45.5 degrees south). This is likely related to currents or gyres in the area that concentrate relatively high densities of microplastics delivered from areas further north. As Leg 3 progressed closer to the Australian coast and through the Great Australian Bight microplastic levels increased 114/115 particles/m 3 reflecting proximity to mainland and associated anthropogenic impacts, although some of the microplastics density in these samples was likely due to materials transported by prevailing currents from the northern Indian Ocean or Indonesian archipelago. Leg 4 Tasman Sea, Coral Sea, South China Sea As the race progressed on Leg 4 from Melbourne to Hong Kong the average levels recorded were 87 particles/m 3 off the southeast coast of Australia and 39 particles/m 3 progressing north off Australia s east coast. Levels decreased further offshore to 20 and 23 particles/m 3. The area off Nauru and the Solomon Islands had the lowest recorded density along this section of the route at 7 particles/m 3. In southeast Asian waters 48 particles/m 3 were recorded and approaching the Philippines and Hong Kong the level was 75 particles/m 3 relatively low considering the nearby population densities on land. Photo Volvo Ocean Race

12 Preliminary results - Oceanography Provided by Dr Toste Tanhua and Dr-Ing. Sören Gutekunst, GEOMAR Helmholtz Centre for Ocean Research Kiel Oceanographic data Refer also to Read more about Oceanography below a. b. c. d. Figure 3: Maps illustrating preliminary data for pco 2, Sea Surface Temperature, Sea Surface Salinity and Chlorophyll a Dr-Ing. Sören Gutekunst, GEOMAR Helmholtz Centre for Ocean Research Kiel Carbon dioxide partial pressure The ocean acts as a sink for excess anthropogenic carbon dioxide and is currently absorbing one quarter of the excess CO 2 in our atmosphere thereby mitigating climate change. When the amount of carbon dioxide is less than atmospheric levels, the ocean has the capacity to uptake carbon dioxide. Levels for partial pressure of carbon dioxide in the north Atlantic and Atlantic subtropics were generally close to 400 parts per million (ppm) i.e. atmospheric levels. The areas around the equator in the Atlantic (Leg 2) and Pacific (Leg 4) had pco 2 concentrations Photo higher Volvo Ocean Race than atmospheric levels due to the upwelling of subsurface water high in CO 2 to the ocean surface. With such levels these areas of ocean will release CO 2 to the atmosphere. Progressing into the south Atlantic, south of about 30 S, pco 2 concentrations were lower in coincidence with summer conditions when phytoplankton activity is highest and therefore sequestering CO 2 from the atmosphere.
13 Preliminary results - Oceanography Provided by Dr Toste Tanhua and Dr-Ing. Sören Gutekunst, GEOMAR Helmholtz Centre for Ocean Research Kiel Carbon dioxide partial pressure continued Along the race leg from Cape Town to Melbourne the measurements were below the atmospheric level of 400 ppm. This reflects the South Indian/Southern Ocean s critical importance as an area of ocean that uptakes anthropogenic CO 2, particularly during the southern hemisphere summer when phytoplankton activity is highest. During the leg between Melbourne and Hong Kong, up through the Solomon Islands, the relatively low CO 2 levels found can be attributed again to high phytoplankton activity during the summer season. The data collected in the equatorial pacific during this leg (4) area will provide important information for the Tropical Pacific Observing System (TPOS). The TPOS is the single-most important ocean observation unit for predicting climate on an annual and inter-annual time-scale and through this the Volvo Ocean Race data will support the estimation of the global CO 2 sink budget. Sea surface temperature The measurements recorded in the Atlantic during legs 1 and 2 were within expected ranges but it is noteworthy that the temperature in the north Atlantic tended to be higher than in the south Atlantic at the same latitude despite it being early summer in the southern hemisphere. This is due to the circulation of the ocean and the Southern Ocean being essentially a gigantic weather machine with almost unrestricted flow of currents and wind around the south of the planet. Another notable feature, illustrated by the data collected, includes the high water temperature in the West Pacific warm pool the warmest part of the global ocean. Salinity Salinity data were within expected ranges with very high salinity recorded in the Mediterranean and the tropical and sub-tropical Atlantic. Distinctly lower salinity was recorded in the doldrum areas due to heavy rain (squalls) that dilutes the surface waters. Chlorophyll a The higher chlorophyll a concentrations observed at southern latitudes reflect the time of year with higher phytoplankton activity coinciding with southern hemisphere summer. Chlorophyll a levels in the south Atlantic were not as high as might be expected which may be due to the active phytoplankton bloom occurring deeper in the water column or prior to sampling. Higher measurements at points in the Southern Ocean coincide with patches of bloom. Seasonal variations in water temperature in the Southern Ocean result in mixing within the water column which makes nutrients available for primary production by phytoplankton. This differs to the relatively lower productivity typical of tropical waters, reflected in the chlorophyll a levels recorded, where stratification traps nutrients at depth due to the lack of mixing.

14 Photo Sam Greenfield Volvo Ocean Race volvooceanrace.com Drifter Buoys
15 Drifter Buoys What is being measured? The buoys drift with ocean surface currents and collect sea surface temperature associated with their position. The near real-time Sea Surface Temperature measurements will provide critical information for predicting the strengthening of storms (see Read more about Volvo Ocean Drifter Buoys below). Ocean currents affect the distribution of, amongst other things, heat and microplastics globally and data about their speed and direction are critical for the study of climate and microplastics distribution. How are we doing this? The racing boats will deploy one drifter buoy each during four of the race legs. The buoys are part of the National Oceanic and Atmospheric Administration s (NOAA) drifter programme. The deployment locations have been selected to target crucial areas for which data will be especially useful. The buoys have a drogue so that they move with the surface currents rather than the wind and they transmit sea surface temperature measurements and position via satellite every hour. Follow our drifter buoys During Leg 2 of the race between Lisbon and Cape Town scientific drifter buoys were successfully deployed in the Atlantic, 3 degrees north of the equator, by each boat. These have been transmitting data hourly since deployment in November to provide valuable information about Sea Surface Temperature and surface currents (see maps in Read more about Volvo Ocean Drifter Buoys below). The data can be viewed publicly by searching for the Volvo Ocean Race drifter buoys in the list at Insert the WMO# of one of the buoys at change the time range, display All Positions and refresh the map to see the track line from where each buoy has been transmitting. Alternatively, access the Platform Info to view the raw near real-time data. The quality-controlled dataset, updated quarterly, will be available at /gld/krig/parttrk_id_temporal.php. Drifter buoy videos

16 Photo Yann Riou Volvo Ocean Race volvooceanrace.com Meteorological data
17 Meteorological data What is being measured? All race boats have onboard instruments that measure: True Wind Speed True Wind Direction Latitude Longitude Air temperature Sea temperature Barometric Pressure Timestamp of the telemetry measurement How are we doing this? The data collected by the boats are sent every 10 seconds to our race headquarters and this is then shared as a readable file with the National Oceanic and Atmospheric Administration. The data is incorporated into the Global Telecommunication System (GTS) which is the communications and data management component of the World Meteorological Organisation (WMO). Once in the GTS the data are available publicly for use by scientists and weather forecasters. The data is shared in a similar way with the Shipboard Automated Meteorological and Oceanographic System Initiative (SAMOS) and archived by the National Centre for Environmental Information. Every weather modeller can access and utilise the data for weather prediction and more importantly the archived data will be available forever to the scientific community.
18 Read more Media Mentions The Guardian NZ Herald Sea Technology Magazine Hurriyet Daily News Other interesting links
19 Read more about Oceanography Why record oceanographic data in our oceans? The measurements of oceanographic variables cannot be examined in isolation from each other as they are so inextricably linked and interdependent in the overall functioning of the marine system. However, following is a basic understanding of the variables individually: The ocean acts as a sink for excess anthropogenic carbon dioxide and is currently absorbing one quarter of the excess CO 2 in our atmosphere thereby mitigating climate change. When the amount of carbon dioxide is less than atmospheric levels, the ocean has the capacity to uptake carbon dioxide taking it out of the atmosphere. Observations of surface ocean carbon dioxide concentrations are necessary to estimate the annual and inter-annual capacity of the ocean to absorb more atmospheric carbon dioxide. Additionally, increasing levels of CO 2 in sea water cause the ph to decrease - the term ocean acidification is given to this chemical change (Raven et al., 2005) which may have a direct negative impact on marine organisms that have calcium carbonate structures or shells, e.g. coral reefs, and an indirect impact on the system as a whole due to the change in the chemistry. Sea Surface Temperature (SST) is related to the overall temperature of the planet as the ocean absorbs atmospheric heat and is an important parameter in models of climate the direct measurements provided by Volvo Ocean Race provide an important input to validate remote sensing measurements especially in the areas where direct data measurements are absent or scarce. Sea surface temperature will also of course influence carbon dioxide absorption, salinity and primary production. Sea Surface Salinity (SSS) affects the density of sea water. Water with a higher salinity is denser and sinks. Changes in the distribution of salinity in the (surface) ocean are good indicators of changes in the global hydrological cycle. Changes in SSS will have an impact on water circulation in the ocean (and therefore nutrient and carbon cycling between deep and shallow waters) thereby influencing the global water cycle and the sea s capacity to absorb or release CO 2 as described above. Chlorophyll a levels are an indirect measure of phytoplankton activity which is the primary production at the base of the marine food web and the main driver of biogeochemical processes in ocean ecosystems i.e. marine phytoplankton harness non-living chemicals (nutrients) and make them available in the ocean food web. Furthermore, marine phytoplankton account for approximately 50% of the global biological uptake of CO 2 (Field et al., 1998) which links back to carbon dioxide levels, ocean acidification and climate change. References Field C.B., Behrenfeld M.J., Randerson J.T., Falkowski P. (1998) Primary production of the biosphere: Integrating terrestrial and oceanic components. Science 281: Raven J., Caldeira K., Elderfield H., Hoegh-Guldberg O., Liss P., Riebesell U., Shepherd J., Turley C., and Watson A. (2005): Ocean Acidification due to Increasing Atmospheric Carbon Dioxide. Policy Document 12/05. The Royal Society, London, 59 pp a 29/05/2013

20 Read more about Drifter Buoys Why collect data using drifter buoys? The near real-time Sea Surface Temperature measurements will provide critical information for predicting the strengthening of storms. For example, between latitudes 5 and 20 sea temperatures are a driving parameter affecting the development of hurricanes, cyclones or typhoons. A sea surface temperature of 27 C (80 F) or more is one of two elements necessary to initiate a hurricane. The other is a weather disturbance such as a thunderstorm which draws warm air to its centre a. The position data transmitted by the buoys allow them to be tracked and are used to derive information about surface currents. Ocean currents affect the distribution of heat globally and changes indicate the occurrence of climate cycles such as El Niño and La Niña which impact world-wide weather. Also significantly, surface currents affect the distribution of microplastics particles. By combining microplastics data with surface current information scientists will be better able to understand where microplastic pollution is originating and accumulating. Volvo Ocean Race drifter buoys will continue to transmit data for approximately two years after deployment. Where are the Volvo Ocean Race drifter buoys sampling? Map A Buoy number deployed by AKZONOBEL on 12 November 2017 Map B Buoy number deployed by SUN HUNG KAI SCALLYWAG on 13 November 2017 Map C Buoy number deployed by VESTAS 11 TH HOUR RACING on 12 November 2017
21 Read more about Drifter Buoys Where are the Volvo Ocean Race drifter buoys sampling?. Map D Buoy number deployed by DONGFENG RACE TEAM on 12 November 2017 Map E Buoy number deployed by TURN THE TIDE ON PLASTIC on 13 November 2017 Map F Buoy number deployed by BRUNEL on 12 November 2017 Map G Buoy number deployed by MAPFRE on 12 November 2017


22 Volvo Ocean Race Scientific consortium. Contacts Central Coordination Anne-Cécile Turner Sustainability Programme Leader Volvo Ocean Race Volvo Ocean Race Scientific Consortium coordinator Dr Toste Tanhua GEOMAR Cluster of Excellence Future Ocean Helmholtz Centre for Ocean Research On site coordinator, data analysis and reporting Dr Ing. Sören Gutekunst GEOMAR Cluster of Excellence Future Ocean Helmholtz Centre for Ocean Research Scientific Programme copywriting and communication Mairéad O'Donovan educationvolvooceanrace.com Communication & Media Robin Clegg Sustainability Communications With the support of
volvooceanrace.com Volvo Ocean Race Science programme Preliminary results Leg 6 Hong Kong to Auckland
 Volvo Ocean Race Science programme Preliminary results Leg 6 Hong Kong to Auckland Preliminary results Leg 6 Compiled using data provided by Dr Toste Tanhua & Dr-Ing. Sören Gutekunst, GEOMAR Helmholtz
volvooceanrace.com Volvo Ocean Race Science programme Preliminary results Legs 10 and 11 Cardiff - Gothenburg - The Hague
 Volvo Ocean Race Science programme Preliminary results Legs 10 and 11 Cardiff - Gothenburg - The Hague Volvo Ocean Race 2017-2018 Preliminary results Legs 10 and 11 Compiled using data provided by Dr Toste
volvooceanrace.com Volvo Ocean Race Science programme Preliminary results Leg 8 Itajaí to Newport
 Volvo Ocean Race Science programme Preliminary results Leg 8 Itajaí to Newport Preliminary results Leg 8 Compiled using data provided by Dr Toste Tanhua & Dr-Ing. Sören Gutekunst, GEOMAR Helmholtz Centre
VOLVO OCEAN RACE - The Route
 WISDOM S WORKSHEET 1.1 / TOPIC 1 / AGE 10-12 NAME: DATE: Hi! It s a race around the world and the sailors will see some amazing places! Can you label the host cities, the countries they are in and the
VOLVO OCEAN RACE - The Route
 WISDOM S WORKSHEET 1.1 / TOPIC 1 / AGE 8-10 NAME: DATE: Hi! It s a race around the world! Can you label cities (in dotted boxes), countries and oceans in the map? VOLVO OCEAN RACE - The Route Oceans Mediterranean
Lecture 13 El Niño/La Niña Ocean-Atmosphere Interaction. Idealized 3-Cell Model of Wind Patterns on a Rotating Earth. Previous Lecture!
 Lecture 13 El Niño/La Niña Ocean-Atmosphere Interaction Previous Lecture! Global Winds General Circulation of winds at the surface and aloft Polar Jet Stream Subtropical Jet Stream Monsoons 1 2 Radiation
CHAPTER 7 Ocean Circulation
 1 2 3 4 5 6 7 8 9 10 11 12 13 14 CHAPTER 7 Ocean Circulation Words Ocean currents Moving seawater Surface ocean currents Transfer heat from warmer to cooler areas Similar to pattern of major wind belts
VOLVO OCEAN RACE - The Route
 WISDOM S WORKSHEET 1.1 / TOPIC 1 / AGE 6-8 NAME: DATE: Hi I m a little lost! Can you help me by writing in the names of the different countries and oceans on the map? VOLVO OCEAN RACE - The Route Gothenburg
Ocean Inter-annual Variability: El Niño and La Niña. How does El Niño influence the oceans and climate patterns?
 Name: Date: Guiding Question: Ocean Inter-annual Variability: El Niño and La Niña How does El Niño influence the oceans and climate patterns? Introduction What is El Niño/La Niña? The El Niño/La Niña cycle
Module 3, Investigation 1: Briefing 1 What are the effects of ENSO?
 Background The changing temperatures of the tropical Pacific Ocean affect climate variability all over Earth. Ocean warming and cooling dramatically affect human activities by changing weather patterns
Introduction to Oceanography OCE 1001
 Introduction to Oceanography OCE 1001 Lecture Notes Chantale Bégin & Jessica Fry Version 2.1 10. Ocean Circulation (Trujillo, Chapter 7) Major ocean currents are stable and predictable; they have been
Equatorial upwelling. Example of regional winds of small scale
 Example of regional winds of small scale Sea and land breezes Note on Fig. 8.11. Shows the case for southern hemisphere! Coastal upwelling and downwelling. Upwelling is caused by along shore winds, that
OCN 201 Lab Fall 2009 OCN 201. Lab 9 - El Niño
 OCN 201 Lab Fall 2009 OCN 201 Lab 9 - El Niño El Niño is probably one of the most widely publicized oceanic phenomena. If there s one single reason for that it s probably the fact that El Niño s presence
Section 6. The Surface Circulation of the Ocean. What Do You See? Think About It. Investigate. Learning Outcomes
 Chapter 5 Winds, Oceans, Weather, and Climate Section 6 The Surface Circulation of the Ocean What Do You See? Learning Outcomes In this section, you will Understand the general paths of surface ocean currents.
Assessment Schedule 2016 Earth and Space Science: Demonstrate understanding of processes in the ocean system (91413)
") NCEA Level 3 Earth & Space Science (91413) 2016 page 1 of 6 Assessment Schedule 2016 Earth and Space Science: Demonstrate processes in the ocean system (91413) Evidence Statement Q Evidence with with Excellence
NCEA Level 3 Earth & Space Science (91413) 2016 page 1 of 6 Assessment Schedule 2016 Earth and Space Science: Demonstrate processes in the ocean system (91413) Evidence Statement Q Evidence with with Excellence
Ocean Circulation, Food Webs and Climate What does the wind have to do with feeding fish (and feeding us)?
?") Ocean Circulation, Food Webs and Climate What does the wind have to do with feeding fish (and feeding us)? El Niño: Tropical Oceans and Global Climate Reading: 9.10-9.13, 9.15 Graphic: Upwelling off Cape
Ocean Circulation, Food Webs and Climate What does the wind have to do with feeding fish (and feeding us)? El Niño: Tropical Oceans and Global Climate Reading: 9.10-9.13, 9.15 Graphic: Upwelling off Cape
Weather drivers in South Australia
 August 2008 Key facts Weather drivers in South Australia Major weather drivers in South Australia are: El Niño - Southern Oscillation frontal systems cut-off lows blocking highs Indian Ocean Dipole cloudbands
Lecture 13. Global Wind Patterns and the Oceans EOM
 Lecture 13. Global Wind Patterns and the Oceans EOM Global Wind Patterns and the Oceans Drag from wind exerts a force called wind stress on the ocean surface in the direction of the wind. The currents
Your web browser (Safari 7) is out of date. For more security, comfort and the best experience on this site: Update your browser Ignore
 is out of date. For more security, comfort and the best experience on this site: Update your browser Ignore") Your web browser (Safari 7) is out of date. For more security, comfort and the best experience on this site: Update your browser Ignore L A NIÑA El Niño-Southern Oscillation (ENSO) For the complete encyclopedic
Your web browser (Safari 7) is out of date. For more security, comfort and the best experience on this site: Update your browser Ignore L A NIÑA El Niño-Southern Oscillation (ENSO) For the complete encyclopedic
Lesson: Ocean Circulation
 Lesson: Ocean Circulation By Keith Meldahl Corresponding to Chapter 9: Ocean Circulation As this figure shows, there is a connection between the prevailing easterly and westerly winds (discussed in Chapter
Well, Well, Well. BACKGROUND Seasonal upwelling is a very important process in the coastal ocean of the Pacific Northwest.
 Well, Well, Well SUMMARY In this activity students investigate the relationship between winds, surface currents, sea surface temperature and upwelling and downwelling off the coast of OR and WA. Students
Tropical Pacific Ocean remains on track for El Niño in 2014
 1 of 10 3/06/2014 3:33 PM ENSO Wrap-Up Current state of the Pacific and Indian Ocean Tropical Pacific Ocean remains on track for El Niño in 2014 Issued on Tuesday 3 June 2014 Product Code IDCKGEWWOO The
170 points. 38 points In your textbook, read about modern oceanography. For each item write the word that meets the description.
 Ch 15 Earth s Oceans SECTION 15.1 An Overview of Oceans 38 points In your textbook, read about modern oceanography. For each item write the word that meets the description. (5 points) 1. German research
OCN 201, Chemistry & Physics Section
 , A 1-April-2015 Name: Answer the True/False and Multiple Choice questions on the scantron sheet. Answer the remaining questions on this exam handout. Turn in both the scantron and exam at the end of class.
The Movement of Ocean Water. Currents
 The Movement of Ocean Water Currents Ocean Current movement of ocean water that follows a regular pattern influenced by: weather Earth s rotation position of continents Surface current horizontal movement
Temperature, salinity, density, and the oceanic pressure field
 Chapter 2 Temperature, salinity, density, and the oceanic pressure field The ratios of the many components which make up the salt in the ocean are remarkably constant, and salinity, the total salt content
The Setting - Climatology of the Hawaiian Archipelago. Link to Video of Maui Waves
 The Setting - Climatology of the Hawaiian Archipelago Link to Video of Maui Waves What caused this week s weather? What caused this weekend s weather? Today s Objective: Provide overview and description
Name Class Date. Use the terms from the following list to complete the sentences below. Each term may be used only once. Some terms may not be used.
 Assessment Chapter Test B The Movement of Ocean Water USING KEY TERMS Use the terms from the following list to complete the sentences below. Each term may be used only once. Some terms may not be used.
OCEANOGRAPHY STUDY GUIDE
 OCEANOGRAPHY STUDY GUIDE Chapter 2 Section 1 1. Most abundant salt in ocean. Sodium chloride; NaCl 2. Amount of Earth covered by Water 71% 3. Four oceans: What are they? Atlantic, Pacific, Arctic, Indian
THE ATMOSPHERE. WEATHER and CLIMATE. The Atmosphere 10/12/2018 R E M I N D E R S. PART II: People and their. weather. climate?
 R E M I N D E R S Two required essays are due by Oct. 30, 2018. (A third may be used for extra credit in place of a Think Geographically essay.) ESSAY TOPICS (choose any two): Contributions of a noted
General Oceanography Geology 105 Expedition #19 The Ocean and Climate
 General Oceanography Geology 105 Expedition #19 The Ocean and Climate Name Not attempting to answer questions on expeditions will result in point deductions on course workbook (two or more blank answers
IX. Upper Ocean Circulation
 IX. Upper Ocean Circulation World Ocean Covers 71% of Earth s surface Contains 97% of surface water Arctic Ocean NH: 61% ocean, 39% land Pacific Ocean Atlantic Ocean Southern Ocean Indian Ocean SH: 81%
OCEANOGRAPHY 101. Map, and temperature, salinity & density profiles of the water column at X, near mouth of the Columbia River.
 OCEANOGRAPHY 101 EXAM 2 WINTER 00 NAME STUDENT NUMBER 1 Map, and temperature, salinity & density profiles of the water column at X, near mouth of the Columbia River. P a c i f i c O c e a n X WA Columbia
OCN201 Spring14 1. Name: Class: Date: True/False Indicate whether the statement is true or false.
 Name: Class: _ Date: _ OCN201 Spring14 1 True/False Indicate whether the statement is true or false. 1. Short residence time elements are uniformly distributed in the oceans 2. Thermohaline circulation
OCN-201 Chemistry and Physics section
 Name: Class: _ Date: _ OCN-201 Chemistry and Physics section True/False Indicate whether the statement is true or false. 1. Because of the dissolved salt in seawater its freezing point is lower than that
Shoes, Rubber Duckies,, and El Niño
 Shoes, Rubber Duckies,, and El Niño How they are related By Laura Maliszewski and Liz Strojny New Gifts found in the Ocean Instead of that chest full of gold... Did you know you could find that new rubber
Duckies have been found in Hawaii, Alaska, S. America, Scotland, Washington state and Australia as of 2012.
 Duckies have been found in Hawaii, Alaska, S. America, Scotland, Washington state and Australia as of 2012. We learned that it takes 3 years to complete one circuit of the North Pacific Gyre flow in the
Lecture Outlines PowerPoint. Chapter 15 Earth Science, 12e Tarbuck/Lutgens
 Lecture Outlines PowerPoint Chapter 15 Earth Science, 12e Tarbuck/Lutgens 2009 Pearson Prentice Hall This work is protected by United States copyright laws and is provided solely for the use of instructors
EARTH, PLANETARY, & SPACE SCIENCES 15 INTRODUCTION TO OCEANOGRAPHY. LABORATORY SESSION #6 Fall Ocean Circulation
 EARTH, PLANETARY, & SPACE SCIENCES 15 INTRODUCTION TO OCEANOGRAPHY LABORATORY SESSION #6 Fall 2017 Ocean Circulation The focus of the Lab this week is circulation of the ocean and atmosphere. Here, you
and the Link between Oceans, Atmosphere, and Weather
 Geography Worksheet Instructions Using a map, atlas, or any other materials your teacher suggests, label the following on the blank map provided. 1. Label East, West, North, and South. 2. Label the following
Lecture 24. El Nino Southern Oscillation (ENSO) Part 1
 Part 1") Lecture 24 El Nino Southern Oscillation (ENSO) Part 1 The most dominant phenomenon in the interannual variation of the tropical oceanatmosphere system is the El Nino Southern Oscillation (ENSO) over the
Lecture 24 El Nino Southern Oscillation (ENSO) Part 1 The most dominant phenomenon in the interannual variation of the tropical oceanatmosphere system is the El Nino Southern Oscillation (ENSO) over the
Ocean Currents that Redistribute Heat Globally
 Ocean Currents that Redistribute Heat Globally Ocean Circulation Ocean Currents Fig. CO7 OCEAN CURRENTS Surface ocean currents are similar to wind patterns: 1. Driven by Coriolis forces 2. Driven by winds
Seawater. Earth is an Ocean Planet
 Seawater Earth is an Ocean Planet Topics Origin of the Ocean and Atmosphere Hydrologic Cycle Biogeochemical Cycle Seawater Salinity Variations in Seawater Chemistry Carbonic Acid System Topics Origin of
El Niño Lecture Notes
 El Niño Lecture Notes There is a huge link between the atmosphere & ocean. The oceans influence the atmosphere to affect climate, but the atmosphere also influences the ocean, which can also affect climate.
Climate-Ocean Variability, Fisheries and Coastal Response in Indonesian waters
 Climate-Ocean Variability, Fisheries and Coastal Response in Indonesian waters Jonson Lumban-Gaol 1, Stefano Vignudelli 2 and Takahiro Osawa 3 1 Department of Marine Science and Technology Bogor Agriculture
Lecture 14. Heat lows and the TCZ
 Lecture 14 Heat lows and the TCZ ITCZ/TCZ and heat lows While the ITCZ/TCZ is associated with a trough at low levels, it must be noted that a low pressure at the surface and cyclonic vorticity at 850 hpa
9/25/2014. Scales of Atmospheric Motion. Scales of Atmospheric Motion. Chapter 7: Circulation of the Atmosphere
 Chapter 7: Circulation of the Atmosphere The Atmosphere: An Introduction to Meteorology, 12 th Lutgens Tarbuck Lectures by: Heather Gallacher, Cleveland State University Scales of Atmospheric Motion Small-
CORIOLIS, A FRENCH PROJECT FOR IN SITU OPERATIONAL OCEANOGRAPHY. S. Pouliquen, A. Billant, Y. Desaubies, G. Loaec, F. Gaillard, G.
 CORIOLIS, A FRENCH PROJECT FOR IN SITU OPERATIONAL OCEANOGRAPHY S. Pouliquen, A. Billant, Y. Desaubies, G. Loaec, F. Gaillard, G. Maudire IFREMER, BP70, 29280 Plouzané, France Sylvie.Pouliquen@ifremer.fr
NOTE ->->-> DUE THURSDAY APRIL 20 TH 2006 THAT IS CORRECT I FORGOT THIS IS EASTER WEEKEND SO I HAVE EXTENDED THE DUE DATE TO THE ABOVE
 GEO 130 NAME OCEANOGRAPHY TEST 3 TAKE HOME TEST SPRING 2006 NOTE ->->-> DUE THURSDAY APRIL 20 TH 2006 THAT IS CORRECT I FORGOT THIS IS EASTER WEEKEND SO I HAVE EXTENDED THE DUE DATE TO THE ABOVE This test
General Introduction to Climate Drivers and BoM Climate Services Products
 General Introduction to Climate Drivers and BoM Climate Services Products Climate Information Services Australian Bureau of Meteorology Yuriy Kuleshov El Niño Southern Oscillation (ENSO) El Niño Southern
Sailing the Seas: Wind Driven Ocean Circulation Ocean Gyres
 Sailing the Seas: Wind Driven Ocean Circulation Ocean Gyres Ocean Currents What Happens at the Coast? Readings: Ch 9: 9.2-9.6, 9.8-9.13 Graphic: America's Cup sailboat race off Newport, Rhode Island. J.
Leeuwin Current - Reading
 Leeuwin Current At 5,500 kilometres, the Leeuwin is our longest ocean current! One of Australia s most influential natural features, the Leeuwin Current, has been confirmed as the longest continuous coastal
GEOS 201 Lab 13 Climate of Change InTeGrate Module Case studies 2.2 & 3.1
 Discerning Patterns: Does the North Atlantic oscillate? Climate variability, or short term climate change, can wreak havoc around the world. Dramatic year to year shifts in weather can have unanticipated
Wind Driven Circulation Indian Ocean and Southern Ocean
 Wind Driven Circulation Indian Ocean and Southern Ocean Lecture 18 MAR 350 Spring 2017 Reading: Knauss Chapter 7 ECCO2 model animation ecco2_sst_flow (2).mp4 Mean surface height and currents DPO Fig. 11.1
Lecture 5.1 Surface Ocean Circulation. Image from Daily Mail Newspaper, UK
 Lecture 5.1 Surface Ocean Circulation Image from Daily Mail Newspaper, UK Announcements Midterm is Thursday, consists of 25 multiple choice, 3 pages short answer questions No Scantron needed Calculators,
W3 Global Circulation Systems
 W3 Global Circulation Systems Which regions of Earth receive the most energy from the Sun? If not for global circulation systems There would only be two narrow regions that would support life What
The ocean water is dynamic. Its physical
 CHAPTER MOVEMENTS OF OCEAN WATER The ocean water is dynamic. Its physical characteristics like temperature, salinity, density and the external forces like of the sun, moon and the winds influence the movement
Lornshill Academy. Geography Department Higher Revision Physical Environments - Atmosphere
 Lornshill Academy Geography Department Higher Revision Physical Environments - Atmosphere Physical Environments Atmosphere Global heat budget The earth s energy comes from solar radiation, this incoming
Oceans Humans both depend on it and threaten it with their activities
 Oceans Humans both depend on it and threaten it with their activities Oceans Water covers nearly ¾ of the Earth s surface More than 50% of the world s population lives within an hour of the coast Oceans
Oceans and the Global Environment: Lec 2 taking physics and chemistry outdoors. the flowing, waving ocean
 Oceans and the Global Environment: Lec 2 taking physics and chemistry outdoors the flowing, waving ocean Peter Rhines 1 Eric Lindahl 2 Bob Koon 2, Julie Wright 3 www.ocean.washington.edu/courses/has221a-08
RESOURCE BOOKLET M13/4/ENVSO/SP2/ENG/TZ0/XX/T ENVIRONMENTAL SYSTEMS AND SOCIETIES PAPER 2. Tuesday 7 May 2013 (afternoon) 2 hours
 2 hours") M13/4/ENVSO/SP2/ENG/TZ0/XX/T 22136303 ENVIRONMENTAL SYSTEMS AND SOCIETIES Standard level PAPER 2 Tuesday 7 May 2013 (afternoon) 2 hours RESOURCE BOOKLET INSTRUCTIONS TO CANDIDATES Do not open this booklet
M13/4/ENVSO/SP2/ENG/TZ0/XX/T 22136303 ENVIRONMENTAL SYSTEMS AND SOCIETIES Standard level PAPER 2 Tuesday 7 May 2013 (afternoon) 2 hours RESOURCE BOOKLET INSTRUCTIONS TO CANDIDATES Do not open this booklet
Geostrophic and Tidal Currents in the South China Sea, Area III: West Philippines
 Southeast Asian Fisheries Development Center Geostrophic and Tidal Currents in the South China Sea, Area III: West Philippines Anond Snidvongs Department od Marine Science, Chulalongkorn University, Bangkok
Atmospheric and Ocean Circulation Lab
 Atmospheric and Ocean Circulation Lab name Key Objectives: The main goal of this lab is to learn about atmospheric and oceanic circulation and how these two processes are strongly inter-dependent and strongly
ENSO Cycle: Recent Evolution, Current Status and Predictions. Update prepared by Climate Prediction Center / NCEP 8 March 2010
 ENSO Cycle: Recent Evolution, Current Status and Predictions Update prepared by Climate Prediction Center / NCEP 8 March 2010 Outline Overview Recent Evolution and Current Conditions Oceanic Niño Index
Atmospheric Forcing and the Structure and Evolution of the Upper Ocean in the Bay of Bengal
 DISTRIBUTION STATEMENT A. Approved for public release; distribution is unlimited. Atmospheric Forcing and the Structure and Evolution of the Upper Ocean in the Bay of Bengal J. Thomas Farrar and Robert
Name Date L.O: SWBAT explain what breezes, planetary winds, ocean currents & monsoons are.
 Name Date L.O: SWBAT explain what breezes, planetary winds, ocean currents & monsoons are. 1. A cool breeze is blowing toward the land from the ocean on a warm, cloudless summer day. This condition is
Upwelling and Phytoplankton Productivity
 Name: Date: Guiding Questions: Upwelling and Phytoplankton Productivity How does nutrient concentration influence phytoplankton growth in coastal and open ocean waters? What and where are the upwelling
Role of the oceans in the climate system
 Role of the oceans in the climate system heat exchange and transport hydrological cycle and air-sea exchange of moisture wind, currents, and upwelling gas exchange and carbon cycle Heat transport Two Primary
Tropical Cyclone Climate in the Asia- Pacific Region and the Indian Oceans
 Tropical Cyclone Climate in the Asia- Pacific Region and the Indian Oceans Johnny Chan Guy Carpenter Asia-Pacific Climate Impact Centre School of Energy and Environment City University of Hong Kong Annual
Currents. History. Pressure Cells 3/13/17. El Nino Southern Oscillation ENSO. Teleconnections and Oscillations. Neutral Conditions
 Teleconnections and Oscillations Teleconnection climate anomalies being related to each other over a large scale Oscillations: Macroscale movement of atmospheric systems that can influence weather, climate,
ENSO Wrap-Up. Current state of the Pacific and Indian Ocean
 18-11-2014 ENSO Wrap-Up Current state of the Pacific and Indian Ocean Tropical Pacific Ocean moves closer to El Niño The Pacific Ocean has shown some renewed signs of El Niño development in recent weeks.
MAPCO2 Buoy Metadata Report Project Title:
 MAPCO2 Buoy Metadata Report Project Title: Autonomous Multi-parameter Measurements from a Drifting Buoy During the SO GasEx Experiment Funding Agency: NOAA Global Carbon Cycle program PI(s): Christopher
Data Analysis of the Seasonal Variation of the Java Upwelling System and Its Representation in CMIP5 Models
 Data Analysis of the Seasonal Variation of the Java Upwelling System and Its Representation in CMIP5 Models Iulia-Mădălina Ștreangă University of Edinburgh University of Tokyo Research Internship Program
TEACHER VERSION: Suggested Student Responses Included. Upwelling and Phytoplankton Productivity
 Name: Date: TEACHER VERSION: Suggested Student Responses Included Guiding Questions: Upwelling and Phytoplankton Productivity How does nutrient concentration influence phytoplankton growth in coastal and
Friday, February 8 th. Winds/Coriolis Worksheet: Due Today Lab Worksheet: Finish Questions
 Ocean Currents Friday, February 8 th Winds/Coriolis Worksheet: Due Today Lab Worksheet: Finish Questions Non-rotating Earth Convection cell model Add rotation and add landmasses unequal heating and cooling
Agronomy 406 World Climates
 Agronomy 406 World Climates January 30, 2018 Monsoons. Ocean properties and circulation. Review for today: Online textbook: 1.3.1 (Sea water) Composition and properties. For Thursday: Rahmstorf, S.: The
Earth s oceans covers 71 % _ of the planet s surface. In reality, Earth s ocean waters are all. interconnected as part of a single large global ocean.
 Ocean Motion Met 101: Introduction to the World's Oceans Produced by The COMET Program Geography: Name Pd. Earth s oceans covers 71 % _ of the planet s surface. In reality, Earth s ocean waters are all
Current: large mass of continuously moving ocean water
 Ocean Currents Current: large mass of continuously moving ocean water Surface Currents--Wind Circulation These waters make up about 10% of all the water in the ocean. These waters are the upper 400 meters
Chapter 10: Global Wind Systems
 Chapter 10: Global Wind Systems Three-cell model of atmospheric circulation Intertropical Convergence Zone (ITCZ) Typical surface wind patterns Upper-level pressure and winds Climatological sea-level pressure
What s UP in the. Pacific Ocean? Learning Objectives
 What s UP in the Learning Objectives Pacific Ocean? In this module, you will follow a bluefin tuna on a spectacular migratory journey up and down the West Coast of North America and back and forth across
March 4 th, 2019 Sample Current Affairs
 March 4 th, 2019 Sample Current Affairs 1. A weak El Niño is developing in the equatorial Pacific Ocean, which is expected to continue for a few months at least. What is El Nino? What causes El Nino? What
REMINDERS: UPCOMING REVIEW SESSIONS: - Thursday, Feb 27, 6:30-8:00pm in HSS 1330
 REMINDERS: Midterm 2: Friday, February 28 - lecture material covering chapters 6, 7, and 15 (since first midterm and through Wed lecture) - same Format as first midterm UPCOMING REVIEW SESSIONS: - Thursday,
ESS15 Lecture 12. Review, tropical oceans & El Nino, and the thermohaline ocean circulation. Please see new reading material on website.
 ESS15 Lecture 12 Review, tropical oceans & El Nino, and the thermohaline ocean circulation. Please see new reading material on website. Review. I-clicker exercise: In this graph of Earth s energy imbalances
The General Circulation and El Niño. Dr. Christopher M. Godfrey University of North Carolina at Asheville
 The General Circulation and El Niño Dr. Christopher M. Godfrey University of North Carolina at Asheville Global Circulation Model Air flow broken up into 3 cells Easterlies in the tropics (trade winds)
ATS150: Global Climate Change. Oceans and Climate. Icebergs. Scott Denning CSU 1
 The Oceans Wind-Driven Gyre Circulations Icebergs Scott Denning CSU 1 Surface Balance of Forces friction coriolis wind stress resultant current Wind stress accelerates surface water Friction couples surface
Meteorology I Pre test for the Second Examination
 Meteorology I Pre test for the Second Examination MULTIPLE CHOICE 1. A primary reason why land areas warm up more rapidly than water areas is that a) on land, all solar energy is absorbed in a shallow
Midterm Exam III November 25, 2:10
 Midterm Exam III November 25, 2:10 25, 2:10 3:25 pm, HW714 Chapters 7 (7.12 7.17), 8 and 9 (through section 9.15, included) 60 multiple choice questions this exam constitutes 22% (only) of your total (overall)
Outline. 1 Background Introduction. 3 SST Amphidrome 4 Niño Pipe 5. SST in China Seas. Seasonality Spiral. Eddy Tracking. Concluding Remarks
 GHRSST XVIII Outline 1 Background Introduction 2 SST in China Seas 3 SST Amphidrome 4 Niño Pipe 5 Seasonality Spiral 5 stories in S(S)T oceanography 6 7 Eddy Tracking Concluding Remarks 2 Welcome to a
APPENDIX B NOAA DROUGHT ANALYSIS 29 OCTOBER 2007
 APPENDIX B NOAA DROUGHT ANALYSIS 29 OCTOBER 2007 ENSO Cycle: Recent Evolution, Current Status and Predictions Update prepared by Climate Prediction Center / NCEP October 29, 2007 Outline Overview Recent
For Class Today How does ocean water circulate? Ocean currents, surface currents, gyres, currents & climate, upwelling, deep ocean circulation
 For Class Today Modified Cornell Notes on section 16.1 (pg. 448-453) **Follow the guide in your ISN and previous notes for help** Heading: How does ocean water circulate? Left hand side categories: Ocean
J4.2 AUTOMATED DETECTION OF GAP WIND AND OCEAN UPWELLING EVENTS IN CENTRAL AMERICAN GULF REGIONS
 J4.2 AUTOMATED DETECTION OF GAP WIND AND OCEAN UPWELLING EVENTS IN CENTRAL AMERICAN GULF REGIONS Xiang Li*, University of Alabama in Huntsville Huntsville, AL D. K. Smith Remote Sensing Systems Santa Rosa,
Currents & Gyres Notes
 Currents & Gyres Notes Current A river of water flowing in the ocean. 2 Types of Currents Surface Currents wind-driven currents that occur in the top 100m or less Deep Currents density-driven currents
Preliminary results of SEPODYM application to albacore. in the Pacific Ocean. Patrick Lehodey
 SCTB15 Working Paper ALB-6 Preliminary results of SEPODYM application to albacore in the Pacific Ocean Patrick Lehodey Oceanic Fisheries Programme Secretariat of the Pacific Community Noumea, New Caledonia
Weather drivers in Victoria
 August 2008 Weather drivers in Victoria Key facts Major weather drivers in Victoria are: El Niño - Southern Oscillation frontal systems cut-off lows blocking highs Southern Annular Mode cloudbands Figure
CHAPTER 6 Air-Sea Interaction
 CHAPTER 6 Air-Sea Interaction What causes Earth s seasons? Tilt (23.5 ) responsible for seasons 2011 Pearson Education, Inc. Distribution of Solar Energy Distribution of Solar Energy Atmosphere absorbs
Oceanographic Research With The LiquID Station
 Oceanographic Research With The LiquID Station Application Note OCEANOGRAPHIC RESEARCH The field of oceanography relies on knowing the precise physical, chemical, and biological state of seawater at different
Introduction to Physical Oceanography STUDENT NOTES Date: 1. What do you know about solar radiation at different parts of the world?
 Introduction to Physical Oceanography STUDENT NOTES Date: 1 Warm up What do you know about solar radiation at different parts of the world? What affect does the tilt of the Earth have on the northern and
McKnight's Physical Geography 11e
 Chapter 2 Lecture McKnight's Physical Geography 11e Lectures Chapter 5 Atmospheric Pressure and Wind Michael Commons Ohio Northern University Atmospheric Pressure and Wind The Nature of Atmospheric Pressure
Write about this. Have you ever experienced a very strong wind gust? What happened? Have you ever felt a gentle breeze? What did it feel like?
 Write about this. Have you ever experienced a very strong wind gust? What happened? Have you ever felt a gentle breeze? What did it feel like? How wind works Winds flow on earth based on differences in
ATMS 310 Tropical Dynamics
 ATMS 310 Tropical Dynamics Introduction Throughout the semester we have focused on mid-latitude dynamics. This is not to say that the dynamics of other parts of the world, such as the tropics, are any