Time Projection Chamber for Multi-Purpose Detector at NICA
|
|
|
- Lesley Lynch
- 5 years ago
- Views:
Transcription
1 Time Projection Chamber for Multi-Purpose Detector at NICA Technical Design Report (rev.05) A.Averyanov, A.Bazhazhin, V.F.Chepurnov, V.V. Chepurnov, G.Cheremukhina, S.Chernenko, O.Fateev, Yu.Kiriushin, A.Kolesnikov, A.Korotkova, F.Levchanovskiy, J.Lukstins, S.Movchan, A.Pilyar, S.Razin, A.Ribakov, V.Samsonov, S.Vereschagin, Yu.Zanevsky, S.Zaporozhets and V.Zruyev Laboratory of High Energy Physics, JINR Dubna 2017
2 Acknowlegements The JINR LHEP TPC team wishes to thank all the technical and administrative staff involved during the preparation of the TPC in particular: A.Moskovsky, A.Butorin, O.Volodina, M.Zaitseva, A.Scherbakov and V.Komarov. We thank S.Basilev, V.Slepnev, I.Slepnev, A.Shutov and A.Baskakov for readout electronics, which was partially used at the first stage of the TPC-prototype testing. Also, we are grateful to V.Kolesnikov and A.Zinchenko for help in writing of chapters 1 and 10 of this report. The help provided by the STAR and ALICE collaborations throughout the years is greatly appreciated. We would like to acknowledge the contributions made by C.Lippman, D.Vranic, C.Garabatos, L.Musa, A.Lebedev and A.Kluge. We would also like to acknowledge the contributions made by members of SAMPA collaboration in particular M.Bregant, A.Velure, A.Oskarsson and K.Tun-Lanoe. We are also grateful to some organizations and industries for help in manufacturing of detached detector components. These are Central Research Institute of Special Machinery Center of Advanced Technoloqy (CRISMCAT, Khotkovo), Mechanical and Instrument Engineering Corporation (Bryansk), Petersburg Nuclear Physics Institute (PNPI, Gatchina), ProgressTech-Dubna Company, Scientific Production Association ATOM (Dubna), ARTMASH Company (Minsk, Belarus) and Institute of Nuclear Problems of Belarusian State University (Minsk, Belarus). i
3 Summary This Technical Design Report describes the Time Projection Chamber (TPC) for the MPD-NICA. The TPC is the main detector for tracking in the central barrel. In following we summarize the design considerations and specifications for the TPC and its subsystems. In Chapter 1 we briefly describe the main physics task and the Multi-Purpose Detector (MPD) barrel set-up. The main physics requirements for the TPC/MPD are pointed out. In Chapter 2 the TPC design overview is described. The lay-out of the TPC is shown schematically. The basic design parameters of the TPC are specified. In Chapter 3 the characteristics of the TPC filed cage and the HV electrode are described. Also the TPC deformation under gravity load is shown. In Chapter 4 the TPC Readout Chamber (ROC) based on MWPC and pad-plane configuration are described. The chamber deformation caused by the wire tension is shown. In Chapter 5 the TPC laser calibration configuration is described. In Chapter 6 the common view of the TPC temperature stability and cooling system are shown. The design of outer thermo- screen and of its individual panel is shown. In Chapter 7 the TPC gas system is shown. Its design, the main parameters and schematic view are described. In Chapter 8 the TPC front-end electronics (FEE) configuration is declared. The basic parameters of the front-end card (FEC) and readout control unit (RCU) are described. A single channel scheme is shown. The main components of boards are given. The front-end card-prototype appearance (top and bottom views) and its characteristics are specified. In Chapter 9 the TPC prototyping and testing results are presented. In Chapter 10 the TPC detector performance in heavy ion collisions that was studied by means of detailed Monte-Carlo (MC) simulations is described. In Chapter 11 the R&D for alternative readout chamber based on GEM is considered. In Chapter 12 the material budget for TPC is summarized. Since the amount and position of material traversed by particles in the MPD inner detectors have an impact on the performance of the outer detectors the material budget of the TPC has to be kept as low as possible. The TPC thickness (less than 5% X 0 ) is acceptable. In Chapter 13 the infrastructure, TPC assembly and safety are presented. In Chapter 14 the organization, editorial group, time schedule and cost of TPC are presented. ii
4 Contents Acknowlegements Summary i ii 1 Physics objectives 1 2 Detector design overview Operating conditions Design units Cylinders manufacture technology Field cage and high-voltage electrode Field cage High-voltage electrode Readout chambers Mechanical structure Wire planes and readout pads Tests and prototyping Laser calibration system Design considerations Implementation Testing and prototyping Cooling system Overview and temperature stabilization Cooling of front-end electronics Cooling of bus and ROC covers Thermal screen Gas system Technical requirements Gas system description Fresh gas mixture preparation Outer circulation loop Inner circulation loop Temperature measurement iii
5 7.2.5 Insulating volume purging Protection level for high and low pressure Gas consumption Pipelines pressure losses Gas system assembly and slow control subsystem Slow control software Main control module GUI items Multichannel controller DAQ Controller purpose and facility Accuracy and measurement time Calibration Front-end electronics Design concept and general requirements Front-end card and its prototype Prototype card Front-end card FEC64S FEC testing Readout control unit Data stream estimate Prototyping Detector performance R&D for alternative readout GEM-based readout chamber SAMPA-based front-end electronics Material budget Infrastructure, assembly and safety Infrastructure Assembly of detector Assembly procedure Assembly tooling Safety Mechanical Gas Radiation protection RF shielding Electrical protection Organization TPC organization TPC TDR editorial group Participating institutes iv
6 14.4 Time schedule and cost book References 93 Abbreviation 99 List of Figures 104 List of Tables 105 v
7 Chapter 1 Physics objectives The main goal of studying heavy-ion collisions is to explore the properties of nuclear matter under extreme density and temperature conditions. Theory predits that at the energy density above 1 GeV/fm 3 the nuclear matter undergoes a phase transition to the state of deconfined quark and gluons - Quark-Gluon Plasma (QGP). Such energy densities are released in head-on collisions of heavy ions at energies ( s) of several GeV. However, the region of the QCD phase diagram of non-zero baryon densities is mostly unexplored up to now. A new experimental program at the NICA accelerator complex at JINR (Dubna) is aimed to close this gap by performing a comprehensive study of dense nuclear matter in the range of collision energies from s = 4A to 11A GeV. The NICA physics program with heavy ions will address the following topics: study of the properties of the deconfinement phase transition, experimental investigation on medium modification of vector mesons, and search for the QCD critical end point. The envisaged experimental program with heavy ions at NICA includes simultaneous measurements of observables that are presumably sensitive to high-density effects and phase transitions. In particular, the observables that will be measured on the event-by-event basis are particle yields, particle ratios, correlations, and fluctuations. The Nuclotron-based Ion Collider Facility (NICA) [1, 2] will operate at a luminosity up to cm 2 s 1 for Au 79+ ions. Two interaction points are foreseen at NICA for two detectors. One of these detectors, the Multi-Purpose Detector (MPD) would be capable of unique measurements of heavy-ion collisions including high-precision tracking and particle identification in the full phase-space as well as very accurate event characterization (centrality and event plane). The set-up of the central barrel part of the MPD is shown in Fig. 1.1 The Time-Projection Chamber (TPC) is the main tracking detector of the MPD central barrel. It is a well-known detector for 3-dimensional tracking and particle identification for high multiplicity events. The TPC/MPD will provide: - The overall acceptance of η < The momentum resolution for charge particles under 3% in the transverse momentum range 0.1 < pt < 1 GeV/c. - Two-track resolution of about 1 cm. 1

8 Figure 1.1: MPD barrel setup - Hadron and lepton identification by de/dx measurements with a resolution better than 8%. These requirements must be satisfied at the NICA design luminosity, max charged particle multiplicity 1000 in central collisions and the event rate about 7 khz. 2
9 Chapter 2 Detector design overview The design and structure of the Time-Projection Chamber (TPC) are similar to those that were used in the STAR, ALICE and NA49 experiments [5, 6, 7]. The TPC being a large but conceptually simple detector must be constructed with very high precision to reduce nonlinear systematic effects. High stability of the mechanical structure and uniformity of the drift field, the temperature, the drift gas purity and the gas gain have to be provided to get precise track reconstruction and energy-loss measurements. 2.1 Operating conditions TPC is a detector of charge particles produced by the nuclear-nuclear collisions inside the NICA collider [8, 9]. Momentum dp/p and energy de/e resolution depend on the TPC design and the solenoid magnetic field. The TPC body must be rigid with the minimum deformation under gravity and non sensitive to the magnetic field. The TPC material budget must be minimal for good matching the inner and the external tracking. Track reconstruction is based on drift time and R-ϕ coordinate measurement of primary clusters. Electric field inside the TPC drift volume must be uniform and stable in time to achieve high precision of the track reconstruction. Stability of the TPC gas mixture composition is very important. The O 2 and H 2 O admixture must be at level of 20 ppm and 10 ppm. The TPC drift volume temperature stability must be at the level of 0.5 C. Laser calibration system will be used for monitoring of drift velocity and for taking electric field distortion into account. The lay-out of the TPC is shown schematically in Fig.2.1. In outline the TPC consists of hollow cylinder the axis of which is aligned with the beams from NICA and is parallel to the uniform solenoid magnetic field [15, 16, 17]. The TPC has an inner diameter of 54 cm, an outer diameter of 280 cm, and an overall length along the beam direction of 340 cm. Since the amount and position of material traversed by particles in the MPD inner detectors have an impact on the performance of the outer detectors the material budget of the TPC has to be kept as low as possible. The TPC lateral thickness 5-6% X 0 ) is acceptable. The active gas volume of the TPC is bounded by coaxial field cage cylinders with a pad plane readout structure at both end-caps. The uniform electric field in the active volume required for drift electrons is created by a thin central HV electrode together 3

10 Figure 2.1: TPC schematic design with a voltage dividing network at the surface of the outer and inner cylinders and at the readout end-caps. Monolithic full-size plastic cylinders will be used for the TPC field cage construction. It has been shown that radial magnetic and electric field components have to be not more than of order [4] to reach the required value of transverse momentum resolution. Hence, the mechanical structure and electric field defining network have to be designed in a way to keep radial field non-uniformity at the level of TPC readout system is based on the Multi-Wire Proportional Chambers (MWPC) with cathode pad readout. Image charges are induced on an array of pads and are recorded as a function of time. For given drift gas mixture and fixed wire geometry the gas gain is determined by high voltage applied to the anode wires. The electrostatic and gravitation forces lead to variations in gas gain along the anode wires. These variations can be controlled by calibrating the signal response with the injection of radioactive Kr 83 into the drift gas. This method was applied in [6, 7] and it was shown the overall gas gain variation (electronics and wire amplification) of the order of 10% can be corrected with 0.5% precision. The gas mixture of 90% argon and 10% methane (P10) is supposed to be used in the TPC. The gas over-pressure has to be as small as possible to reduce the multiple scattering in the TPC gas. The TPC active volume must be sufficiently gastight to keep the oxygen level below about 5 ppm for minimizing primary ionization loss in the TPC drift volume. Operating on the peak of the voltage-velocity curve (for argonmethane mixture E=140 V/cm) makes the drift velocity stable and low-sensitive to small variations in temperature and pressure. The thermal isolation of the TPC must guarantee the temperature stability about 0.5 C over the active gas volume [6]. The TPC readout system is based on the Multi-Wire Proportional Chambers (MWPCs) with cathode readout pads, mounted in two end-caps of the TPC cylinder and each covering 30 in azimuth. The basic design parameters of the TPC are summarized 4
11 Table 2.1: The basic parameters of the TPC Item Dimension Length of the TPC 340 cm Outer radius of vessel 140 cm Inner radius of vessel 27 cm Outer radius of the drift volume 133 cm Inner radius of the drift volume 34 cm Length of the drift volume 163 cm (of each half) HV electrode Membrane at the center of the TPC Electric field strength 140 V/cm Magnetic field strength 0.5 Tesla Drift gas 90% Ar+10% Methane, Atmospheric pres. + 2 mbar Gas amplification factor 10 4 Drift velocity 5.45 cm/µs Drift time < 30 µs Temperature stability < 0.5 C Number of readout chambers 24 (12 per each end-plate) Segmentation in ϕ 30 Pad size 5x12 mm 2 and 5x18 mm 2 Number of pads Pad raw numbers 53 Zero suppression up to 90% Maximal event rate < 7 khz ( Lum ) Electronics shaping time ns Signal-to-noise ratio 30:1 Signal dynamical range 10 bits Sampling rate 10 MHz Sampling depth 310 time buckets Two-track resolution 1 cm in Table 2.1. List of the TPC main systems is presented underway. They are: - Construction of the TPC body (includes field cage, flanges and others) - Readout Chambers (ROC) - FEE, Readout, DAQ - Laser Calibration System - Cooling System - Gas System 5

 - 24 pc Slider - TPC & SSW")
12 2.2 Design units The schematic view of the TPC is presented in Fig.2.2. The full TPC length with electronics and heat shield is L=4000 mm. Figure 2.2: The schematic common view of the TPC Here are: SSW - service support wheel with front end electronics C1 - C4 field cage containment cylinders Readout chamber (ROC) - 24 pc Slider - TPC & SSW support and adjust structure Figure 2.3: TPC cylinders 3-D view 6


13 Figure 2.4: Design of the cylinder C1 Figure 2.5: Design of the cylinder C2 Figure 2.6: Design of the cylinder C3 7

14 Figure 2.7: Design of the cylinder C4 The TPC main units: Four cylinders C1-C4 (see Fig ) with L=3400 mm, outer diameter D out =2814 mm and inner diameter D in =540 mm. Inside C1 a beam pipe and a Si-tracker will be installed; HV electrode divides the TPC into two equal parts. Electrode is perpendicular to the beam axis; Field cage: non uniformity of electric field has to be less than 10 4 ; Flanges: cylinders C1-C2 and C3-C4 are connected together by means of aluminum flanges to create gas tight gap. 2.3 Cylinders manufacture technology The TPC body design is based on four cylinders (C1 and C2 wall thickness - 3 mm, C3-4 mm and C4-6 mm) and two end cap flanges (see Fig.2.2). The gap between C1-C2 and C3-C4 is filled with nitrogen (N 2 ) for HV discharges protection and prevents O 2 and H 2 O diffusion into the TPC gas volume. The gap value depends on the HV electrode voltage i.e. from the TPC gas mixture Ar+CH 4 (90:10) and optimal drift electric field (E=140 V/cm). For the TPC drift distance L=163.1 cm the HV electrode voltage will be U=23 kv. The gap value between cylinders is dl=30 mm. Cylinders were manufactured by Russian industry. First layer is fiberglass with thickness h= 0.5 mm then 2 layers of 25 µm Tedlar then about 3 mm of Cevlar and again 2 layers of Tedlar. Tedlar film is used for gas tightness and Cevlar film for durability. The C1 and C4 have aluminum layer h=50 µm for the TPC electromagnetic shielding. The C2 and C3 have aluminum strips (width W=30 mm, step S=100 mm, aluminum thickness h=50 µm) for configuration electric field shape. The final material agglomeration is made at temperature T=160 C. To protect inner surface of a cylinder 8
 and strip to strip - by resistor (red) Figure 2.")
 inner fiberglass layer was used and then it was removed after each cylinder manufacture finished.")
15 Figure 2.8: C2 cylinder wall cross-section (non in scale). Yellow - 3 mm of Cevlar, violet - 50 µm of Tedlar, blue - aluminum strips h=50 µm. Opposite strips connected by wire (black) and strip to strip - by resistor (red) Figure 2.9: FEA calculation result for cylinder C2 with L=3000 mm, wall thickness h=3 mm, load F=80 kg in the middle (from the HV electrode) and fixed flanges. (Deformation is less than 100 µm and deformation of rest cylinders is less than for C2) inner fiberglass layer was used and then it was removed after each cylinder manufacture finished. Typical cylinder wall cross-section is shown in Fig.2.8. Additional short fiberglass flanges on C1, C2 and C3 will be used for the TPC assembly. The flange in the middle of C2 will be used for fixation of the HV electrode. The strip to strip will be connected by resistor. FEA calculation results were shown that C2 deformation is less than 100 µm (see Fig.2.9). The radiation thickness is about 0.4 g/cm 2 due to low Kevlar density. The tests have shown that C2 cylinder gas tightness for O 2 corresponds to requirements. 9
16 Chapter 3 Field cage and high-voltage electrode 3.1 Field cage The main purpose of the TPC field cage is creation of uniform electrostatic field in a cylindrical high-purity gas volume to transport the primary ionization charges over long distances of 1.63 m towards the readout end-plates. For reasons of symmetry in colliding beam experiments, two identical field cage configurations are chosen, backto-back in common gas volume, with a common high-voltage (HV) electrode located at the axial center of the cylinder. The basic TPC configuration is shown in Fig.3.1. Four cylinders are required to make the complete field-cage structure: two field-cage vessels (one inner and one outer) and two containment vessels (inner and outer). The outer containment vessel of the TPC is 280 cm in outer diameter, inner containment vessel is 54 cm in inner diameter and 340 cm in length. The readout end-plates spaced at 1.65 m from the central high voltage membrane. The inner and outer field-cage vessels define the active drift gas volume. They have diameters of 68 cm (inner vessel) and 266 cm (outer vessel). The active gas volume is divided by a high voltage membrane placed at the center of the outer field cage on two equal parts. High negative potential is applied to this membrane. The central electrode and two opposite axial potential degraders provide the uniform drift fields and define the drift volume with uniform electric field. The drift field value is defined by the intrinsic properties of the drift gas affecting drift velocity and diffusion of primary ionization electrons. Thus, for the maximum drift path 1.63 m and P10 drift gas, the HV at the central electrode should be as high as 24 kv to provide the electron drift velocity of 5.5 cm/µs. For Ar+CO 2 gas mixture this value will be about 70 kv. In general, our design is similar to that of the TPCs used in STAR and ALICE experiments, except for the size. The actual field cage is surrounded by insulating gas containment vessels C1 and C4 as shown in Fig.3.1(bottom). They provide personnel and operation safety with minimum material traversed by particles. The outer gas containment surface is coated with thin Al foil screen. The main function of the outer field cage (OFC) is to retain the electric potential along one boundary of the active volume of the TPC with homogeneous electric field at one side and zero fields at the other side. The OFC vessel should be gastight to 10
 and the")
17 Figure 3.1: Inner view of the TPC (top) and the front view of the TPC (bottom) 11
 is defining the electrical potential along the inner radius of the")
18 minimize drift gas contamination with oxygen and water and have minimal material budget. The Fig.3.1(top) shows the overall configuration and some details of the OFC. Figure 3.2: TPC deformation under gravity load, C2 cylinder deformation is less than 25 µm The primary function of the inner field cage (IFC) is defining the electrical potential along the inner radius of the active volume of the TPC; its secondary function is gas containment. Its support structure is not as substantial as that of the OFC and is required for self-support only. The space between the IFC vessel and the containment vessel is filled with dry gas N 2. The IFC vessel must perform its functions and at the same time have the minimum matirial for particles passing through it into the TPC s tracking volume. Therefore, minimum radiation length materials should be used to fabricate the IFC and the inner containment vessels. As it was mentioned, our design is similar to that of the TPCs used in the STAR and ALICE experiments but, considering cylinders forming drift gas and containment volumes of the TPC, all four cylinders will be produced as monolithic Kevlar composite constructions. Such an approach allows one to minimize problems with gluing field cage parts and fragments together. Moreover, we suppose to mount field cage, central electrode and end-plates as independent precisely adjusted constructions which will be inserted between Kevlar vessels and fixed together mechanically and with epoxy. Calculations show that walls of vessels should be rather thin (3 mm). The end cap flanges and the C2 cylinder assembled together form the strong mechanical construction. It will be subjected to the maximal working load (high voltage electrode, support tubes and so on). The Fig.3.2 shows the calculation results of the deformation of the 340 cm long cylinder C2 under total load of 80 kg. This deformation is not more than 100 µm. Deformations of other cylinders will be less. Final density of wall composite material was measured and it makes up with 1.27 g/cm. Kevlar composite cannot provide gastight of the envelope therefore it is laminated with two layers of Tedlar 25 µm film (Tedlar TUT 10BG3) at both inner and outer sides of the wall. In case of containment vessels 50 µm Al foil is glued over Tedlar film to form electromagnetic screen (see Fig.3.3). 12
 and both surfaces of outer")
 of Al foil strips (a) and resistors mounted on the wall of the field cage vessel (b), Kevlar (yellow) thickness - 3 mm, Al-foil (blue) - 50 µm Kevlar composite")
19 Figure 3.3: Wall structure for vessels forming the drift volume and two containment envelopes The both sides of drift volume are covered with Al foil strips (pointed in the drawing) and both surfaces of outer vessels (containment envelope) are covered with continuous Al foil. Figure 3.4: Schematic view (not in scale) of Al foil strips (a) and resistors mounted on the wall of the field cage vessel (b), Kevlar (yellow) thickness - 3 mm, Al-foil (blue) - 50 µm Kevlar composite laminated with Tedlar film is produced at C temperature. Tedlar TUT 10BG3 film is not degraded at this temperature, on the contrary, homogenous junction between film sheets and Kevlar is obtained. The prototype of containment cylinder with length of 1 m and diameter of 90 cm was produced in this way and tested for gas tightness and mechanical hardness. In result, tests have shown that the material of prototype wall has all sufficient properties required for the TPC construction. The vessels surrounding drift volume serves as electric field boundary. To avoid the accumulation of positive ion surface charges Al foil concentric strip rings are glued on both sides of vessel wall (30 mm wide with 100 mm pitch) as shown in 3.4(a). Corresponding outer and inner rings are connected to each other across the field cage wall via hermetic pins while inner rings are connected to low current high voltage 13

).")


20 Figure 3.5: View of the 340 cm prototype vessel, produced to elaborate technology of aluminum foil strips gluing on inside wall of 600 mm diameter divider (see Fig.3.4(b)). Taking that length of the vessel is 3.4 m and diameter of the inner vessel is 60 cm into account it is a challenging task to glue rings together inside this vessel. Several experiments were carried out and a technology was found to glue rings with high quality as shown in Fig.3.5 for 340 cm long cylinder C2. All four cylinders C1-C4 manufactured and stored at JINR (see Fig.3.6). Figure 3.6: TPC cylinders: C4 (top-left), C3 (top-center), C2 (top-right) and C1 (bottom-center) 14


21 3.2 High-voltage electrode To create high-voltage (HV) electrode, we took into account the experience of ALICE TPC team. In production of the central membrane the 50 µm Mylar film we used. The membrane is stretched over two hoops supported by the OFC cylinder and glued to the IFC cylinder as shown in Fig.3.7. Figure 3.7: Scheme of the high voltage membrane assembling The potential degrading network defining the uniform electric field inside the TPC active volume will be realized in the same way as it is done in the ALICE TPC [6]. Figure 3.8: Potential degrader rods produced by industry using composite material (Kevlar + Macrolon + Al foil) The aluminized Mylar strips will be stretched over 12 rods placed equidistantly over the outer and inner field cage circumferences in conformity with the modular structure of the readout chambers. There 112 potential 13 mm width Mylar strips along the field cage axis will be placed. They are connected electrically to the resistor highvoltage divider placed inside two rods. Rings of aluminum foil 13 mm wide and 50 µm thick (separated by insulating gaps of 2 mm width and 2 mm depth) are glued on the surface of rods. The supporting tube prototypes produced in industry using composite material are shown in Fig
 precisely placed strips; (right) one strip is shifted by 50 µm The voltage on each strip corresponds to the strip")
22 Figure 3.9: The field distortions in the drift volume defined by Mylar strip system: (left) precisely placed strips; (right) one strip is shifted by 50 µm The voltage on each strip corresponds to the strip center position along the field cage axis from the central electrode. The non-uniformity of the electric field inside the sensitive TPC volume has to be not more than 10 4 relative to nominal value (140 V/cm P10 gas mixture). The numerical calculation of the electric field [24, 28] has been done using ANSYS MAXWELL software code. The Fig.3.9,(left) shows the regions of the field distortions in the drift volume defined by Mylar strip system, high voltage electrode and readout plane for the case of precisely placed strips. The Fig.3.9,(right) shows how the distortion will be changed in the case where one Mylar strip is shifted by 50 µm from the nominal position. Figure 3.10: The dependence of worst region size with the field distortion more than 10 4 The dependence of the size of the worst region with the field distortion more than 10 4 is shown in Fig.3.10 inward the drift space (violet line) and along the line parallel to the strip surface (orange line). The distortions are down to 10 4 at distance of about 23 mm from the strip surface inward drift space. The positioning precision of the strips into nominal place has to be not less than 50 µm. Four outer rows of rods at any side of the HV membrane serve as a UV pipeline for laser calibration system and one is used for the voltage degrader. All rods except that for high voltage supply have 1.0 mm diameter holes (between Al strips) for drift gas inlet on inner row of rods and outlet on rods near OFC. High voltage supply for the central membrane is mounted in a rod of inner raw. 16
23 Chapter 4 Readout chambers The TPC readout system is based on the Multi-Wire Proportional Chambers (MWPC) with cathode pad readout (ROC). The end-cap readout plane is covered by 12 trapezoidal sectors of the readout chamber with the bases of 213 mm and 642 mm and the height of 800 mm, each covering 30 in azimuth (see Fig. 4.1). Figure 4.1: The location of the ROC chambers The active zone length of the ROC in the radial direction is 796 mm. The dead zone between chambers is 29 mm. It includes the width of the wire framework (13 mm for every chamber) and a gap (3 mm) between chambers. The full active area of the ROC chambers is equal to 7.65 m 2. 17

24 4.1 Mechanical structure The aluminum frame provides the overall mechanical stability of the ROC chamber (see Fig. 4.2). The frame thickness in beam direction is 5 mm and thickness of isolated plate and pad plane is 3 mm each. Pad plane and isolated plate glued to the aluminum frame. The frame is reinforced by stiffening rib. A series of holes across the aluminum frame are machined for the readout electronics connectors. The frame has 3 fixation holes for chamber adjustment and fixation. Figure 4.2: Aluminum frame of ROC chamber The chamber frame stability against deformation caused by wire stretching has to provide minimal overall deformation as possible (less than the expected wire sag caused by electrostatic force. The results of a finite element calculation of the chamber frame are shown in Fig.4.3. The deformations do not exceed 27 µm at the total wire tension F 800 N and over pressure inside the TPC up to dp=5 mbar. Figure 4.3: Finite element calculation of the chamber deformation caused by the wire tension (F = 800 N) and overpressure 5 mbar. The maximum deformation is 27 µm 18
25 The mechanical structure of the ROC chamber consists of the three wire planes, the pad plane, the insulation plate and trapezoidal aluminum frame. The cross section of the ROC chamber structure is shown in Fig.4.4. Figure 4.4: Cross section of the ROC chamber 4.2 Wire planes and readout pads The gap between the anode wire plane and the pad plane, as well as the gap between the anode wire and the cathode wire planes is h=3.0 mm (see Fig.4.5, left). To reduce the accumulated charge per unit length of the anode wire and thus the variation of the gas gain in high charged particle environment the anode wire pitch has to be small enough. It is matched with the pad length and is set equal to S=3 mm. Cathode wire pitch is 1.5 mm. The gating grid, with alternating wires connected together electrically, is located above the cathode-wire grid at the distance of h=3.0 mm, sufficient to trap the ions within a typical gate opening time. The anode wire grid and the gating grid are not staggered with respect to the cathode wire grid. To keep the alternating bias voltages low, the pitch between the gating grid wires is S=1.25 mm. All wires and pad rows run in the azimuth direction. The wire length varies from 190 mm at the trapezoidal pad plane bottom to 620 mm at the top. To provide the gas gain of G=10 4 at moderate anode potential the gold-plated tungsten-rhenium D=20 µm diameter wire was chosen for the anode grid and mounted with F=50 g stretching force. The cathode and gating grid copper-beryllium wires have a diameter of D=75 µm and a stretching force of F=80 g. The pad plane itself is a 3 mm thick printed circuit board with four layers of traces from the pads to the connectors. The routing of the traces has to be optimized for minimum trace length and trace-to-trace distance. The connection of the pad plane connectors with FEE cards will be made via flat flexible capton cables. We have chosen 27 rows of pad with the size of 5x12 mm at inner area and 26 rows of pad with size of 5x18 mm at outer area of the readout plane as a compromise of 19


26 Figure 4.5: Schematic view of ROC chamber (left) and pad plane electrode (right) reasonable number of readout electronics channels. The pads have a rectangular shape, and the total number of pads in the TPC is The details of the pad plane are shown in Fig.4.5, right. 4.3 Tests and prototyping To obtain a desired spatial resolution it is necessary for the induced charge in the azimuthal direction to be distributed over 2 or 3 pads. In the case of triggering more than three pads the spatial resolution deteriorates due to the reduction of signal-tonoise ratio. The width of the pads should be matched with the width of the distributed induced charge. The relative distribution of the signal amplitudes on adjacent pads, induced from point avalanche near anode wire, is called the response function of pads (PRF) [29]. It can be calculated by integrating the distribution of the induced charge by the square pad S: P RF (x, y) = S Q(x, y)ds Two-dimensional distribution of the induced charge Q(x,y) can be expressed by the geometrical parameters of the wire patterns [30]. In Fig.4.6 the PRF for gaps 2.5 mm and 3 mm between the pad-plane and anode grid and width of pads - 4 mm and 5 mm is shown. It is seen that a reasonable distribution of the induced charge can be achieved. 20

27 Figure 4.6: PRF for pads width 4 mm and 5 mm: h - anode-cathode gap 2.5 mm and 3 mm, anode wire D=20 µm with pitch - 3 mm Several prototypes of the ROC were built to construction technology development and ROC characteristics study. The prototypes were tested on two gas mixtures Ar/CH 4 (90/10) and Ar/CO 2 (80/20) with radioactive sources Fe 55 and Sr 90. For both mixtures was obtained the plateau characteristic more 200 V and dark current does not exceed several na. The gain dependence on anode voltage for mixture Ar/CH 4 (90/10) is shown in Fig.4.7. The required gas gain 10 4 is achieved by the anode voltage 1400 V. The gas gain inhomogeneity on chamber area does not exceed ±9%. Figure 4.7: Gas gain versus anode voltage When all gating grid wires are under the identical potential, the electrons from the drift volume freely pass into the zone of the gas gain. Under application of the potential difference on adjacent wires this gating grid prevents charges to penetrate in the gain zone from the drift volume and back. The main purpose of gating grid is to block the flow of ions in the drift volume from the gain zone. 21
28 Figure 4.8: Drift current vs gating grid potential difference The drift current dependence of the potential difference on the gating grid adjacent wires under gas gain 10 4 is shown in Fig.4.8. According to the results of measurements the efficiency of gating grid is 10 4 under potential difference 200 V. The track density of charged particles overall the drift volume depends nearly 1/r. In Fig.4.9 the distribution of the ionization points per unit of the readout pad plane area (1 cm) is shown as a function of the radius for 2000 minimum by Au + Au collisions at 9 GeV simulated with UrQMD code. To resolve the adjacent ionization clusters the pad has to be not more than 50 mm 2 in the central area of the readout plane. Figure 4.9: The distribution of the ionization points per unit area (1 cm) of readout pad plane as a function of the radius for 2000 minimum by Au+Au collisions at 9 GeV To estimate the multi-track resolution the pad response was simulated for two close tracks. In Fig.4.10 the distribution of pad responses is shown along the pad row in 22

29 Figure 4.10: Distribution of pad responses along the pad row in dependence of time for two tracks with the angle of 1.5 between them dependence of time for two tracks with the angle of 1.5 between them. The two-track resolution ( 1.2 cm) can be reached with the pads of 4 mm in width in the central area of the detector. 23
30 Chapter 5 Laser calibration system 5.1 Design considerations The aim of the laser system is to measure the response of the TPC to straight tracks at known position. Taking the experience of STAR [5] and ALICE [6] experiments into account, we suppose to use calibration system for monitoring of the TPC working regime parameters by a UV laser based. The UV laser system is a part of the test and calibration procedure designed to produce a set of the laser beam tracks at well-defined angles and positions. The accuracy of the laser beam position should be significantly better than the spatial resolution of the TPC. The system will provide on-line monitoring of the value of drift velocity which depends on the drift gas pressure changes (caused by changes of atmospheric pressure), the temperature, E B noncollinearity and space charge effects. The laser beams follow the paths of stiff charge particle tracks emerging from the interaction region and can be used for correction of the sagitta of these tracks. 5.2 Implementation In order to minimize the error in the absolute position measurement by the TPC, it is necessary to account for both static and time-dependent distortions in the drift path of the ionization cloud. The static distortions are the result of non-uniformities in B and E fields. A calibration system that provides absolute positional references is needed so that a deconvolution procedure, which determines the absolute spatial position from the row pad and time bucket information, can be developed. Time-dependent distortions can result from the changes in gas performance, in environmental variables (temperature or atmospheric pressure), or from spontaneous failures. A calibration system that can reproduce fiducial tracks is needed to monitor the TPC performance. As shown in Fig.5.1, the initial wide beam (18 mm) is divided into two arms with a semi-transparent mirror (green box). A part of beam (25%) is aimed into tube with bundles of micro mirrors (see Fig.5.2) while remaining 75% are transported by set of prisms to the second semitransparent mirror splitting a part of beam (33% of the power) into the second tube. Farther, the beam reaches the third semitransparent mirror where 50% are aimed into tube with bundles of micro mirrors and remaining part is transported to the last mirror that 98% of the beam reflects into tube. The remaining part reaches beam position detector. In every tube there are 4 bundles of 7 24

31 Figure 5.1: Schematic view of high-power laser beam into 112 tracks of 1 mm in diameter Figure 5.2: Semitransparent mirror beam splitter 25

32 micro mirrors forming 1 mm rays (see text). Thin (1 mm diameter) UV rays emitted from the 4 tubes (yellow) forms set of four planes with 28 rays in each of them. The second laser creates rays at the opposite side of the central electrode. Figure 5.3: Technical drawing of scheme of Fig.5.1 The technical drawing of scheme and fragment of three prisms are shown in Figs.5.3, 5.4. The wide laser beam will be transported using prisms around outer perimeter because the central part over the TPC flange is filled with the readout electronics and cables. Taking into account the experience of STAR and ALICE experiments, we suppose to use for monitoring of the TPC working regime parameters by a UV laser based calibration system. The UV laser system is a part of the test and calibration procedure designed to produce a set of laser beam tracks at well-defined angles and positions. The accuracy of the laser beam position should be significantly better than the spatial resolution of the TPC. The system will provide on-line monitoring the value of drift velocity which depends on the drift gas pressure changes (caused by changes of atmospheric pressure), the temperature, E B non-collinearity and space charge effects. The laser beams follow the paths of stiff charge particle tracks emerging from the interaction region and can be used for correction of the sagitta of these tracks. It was planned that the system selected to perform these functions consists of two pulsed 130 mj 5-7 ns Nd:YAG lasers NL311FH-10 or NL313FH-30 with 10 Hz repetition rate. The 18 mm wide beams from each laser are split to four beams and then, through 4 tubes placed inside the drift volume of TPC, where micro mirrors (diameter of active reflecting surface is 1.3 mm) are illuminated to form 112 narrow calibration rays at each side of HV membrane. These 112 rays are distributed into 4 equidistant quasi planes of 28 rays in each, emitted from 4 tubes (see Fig.5.1 and 5.3) within the half of active volume of the TPC (224 rays in whole TPC). Distance between planes is

33 Figure 5.4: Technical scheme fragment of Fig.5.1 mm. Each tube contains four bundles with 7 mirrors. Scheme of beams of a plane is shown in Fig.5.5. If bundles are mounted in an exact plane resolution in region of ray crossing points is distorted. Therefore, the bundles of a plane are shifted at 4 cm level respectively each to others. Therefore, we have quasi planes of narrow laser rays. Figure 5.5: Drawing of the TPC quasi plane that showing position of four mirror blocks emitting 28 beams within one plane Initial beam from a laser is divided into two arms by a splitter semitransparent mirror so, that 25% of the power is transmitted inside the first tube to the bundles of micro mirrors (see Fig.5.1 and 5.2) while remaining part, using a system of three prisms, is transported to the second semitransparent mirror over the second tube with micro mirrors. (Really, it should be taken into account, that a part of energy is lost 27
34 Figure 5.6: Schematic view of a mirror bundle on the surfaces of prisms therefore reflection coefficients are calculated in dependence of prism surface covering.) This mirror reflects part of the power (33%) into second tube while other part of power is transported to the third tube. (Some details are shown in the Fig.5.3 and 5.4). Similarly, this semitransparent 50% mirror reflects part of beam into tube and allows a remaining part to be transported to the last mirror over the fourth tube with micro mirrors. The last semitransparent mirror a tiny part of light (1-2%) does not reflect into tube but passes to the UV beam position detector (cameras). Cameras are tuned to control laser beam position. Remote control piezoelectric picomotor drivers will be used to correct mirror angle and to adjust beam position if necessary. Cameras will be used also to control initial beam position at the front of MPD to observe position of beam profile reflected by quartz plate. The number of laser beams is of the same order as in STAR [5] and ALICE [6] TPCs and is sufficient to calibrate the TPC at different η and ϕ. To produce tracks in TPC prototype which is under testing the same type of Q- switched Nd:YAG laser model NL131/FH is used but with low power (0-2 mj per pulse), repetition rate 10 Hz or lower, pulse duration 3-4 ns. FH notes fourth harmonic output 266 nm wavelength in the case. Two types of mirrors were tested with high power (10-20 times more than that necessary to produce tracks) laser shots. Mirror surface degradation was controlled with microscope (see Fig.5.6 photos of two different samples). The TPC prototype is built for one of 12 readout segments therefore only two blocks of three mirrors are mounted at different distances from cathode to have a possibility to control the drift velocity. A green light laser used to adjust mirrors in the bundles and in the TPC prototype (see Fig.5.7). A drawing of a TPC quasi plane showing position of four mirror blocks emitting 28 beams within one plane is shown in Fig.5.6. Actually, bundles of a plane are shifted by 4 cm to avoid bad resolution around beam cross points. Details (tubes, field cage strips) removed. Diameter 2131 mm is inner surface of OFC wall, diameter 609 mm is outer surface of IFC. Four similar planes are placed at both sides of HV membrane. Distance between the planes mm. 28


35 Figure 5.7: Photo of the mirror surface viewed with electron microscope after UV laser shots Figure 5.8: Green light laser used to adjust mirrors 29


36 5.3 Testing and prototyping Few tests of mirrors were carried out using electron microscope. It is not so easy to see mirror when optical microscope is used. However, we found quite effective instrument to check if mirror plane is good enough to reject mirrors with expanding beam or damaged or simply dirty surface. Figure 5.9: The first TPC prototype tests with laser beams We use pixel detector of high resolution (52 microns per pixel) which is sensitive to laser beam. If measured beam image is of the same size and form at 30 cm and 200 cm distance from a mirror the mirror is qualified as ready to be used for the calibration system. In Fig.5.9 test tracks are presented which were created by UV rays reflected with few mirrors in TPC prototype and registered with readout chamber. Figure 5.10: Laser NL The tests have shown that it is rather challenging task to mount a bundle of seven tiny cylindrical glass tubes if one needs to orient all reflecting surfaces at the fixed angles. It should be taken into account that approximately bundles should be produced because few of them are rejected due tests. Another problem is fragility of glass edges. In result we started experiments with mirrors created on ceramic base also. 30
37 Considering this conception bundles are formed using three blocks with three or two mirrors in each block. Reflecting surface of each mirror is oriented at corresponding angle when ceramic prism is produced. Thus, bundle of seven mirrors is mounted while three prisms are pressed together and glued into container. Final distribution of the laser beam angles will be measured for all bundles. However, estimates carried out at CRYTUR (Turnov, Czech Republic) have shown that such method is rather expensive. The problem is to polish faces of prisms at different angles. In result, mirrors were produced on quartz rods of 1.3 mm and 40 bundles successfully glued up to now. Figure 5.11: NL310 series laser heads While NL131/FH is used to ionize gas in the prototype TPC in the full-scale chamber two lasers of similar type but another modification NL303HT-10-FH are supposed to be used. The laser is similar to that presented at Fig.5.10,5.11 and 5.1. We have estimated that in case of very accurate adjusting of laser beam a diameter of 14 mm can be used but to avoid accidental shadows the beams will be expanded to 18 mm diameter and mirror bundles will be slightly removed from the beam axis (see Fig.5.12). As it was mentioned, finally, adapted for the case NL303HT-10-FH laser was chosen. The telescope beam expander will be designed and mounted into laser to have 18 mm UV (266 nm)beam at output. Since only UV output is planned the laser is more simply then serial product. While pulse power is mj it is enough due to 18 mm beam diameter instead of initially planned 24 mm diameter. Nevertheless, we have a reserve of nominal 110 mj what allows to increase lifetime of flash lamps. In addition to the laser calibration, the TPC is supposed to be tested with cosmic rays prior to mounting inside of the MPD magnet. During all these tests one can check the performance of laser beam position monitoring system, based on internet WEB-cameras, as well as remote mirror adjusting devices with piezoelectric picomotor drives. Taking into account proposed beam splitting scheme into account initial 70 mj will be divided into four beams of = 18 mm (maximal diameter, 20 or 24 mm options are also analyzed) or 255 mm 2 each beam. It means, that with pulse length of 5 ns energy density will be 120 µj per mm 2 (taking into account reflections on prism surfaces) while µj per mm 2 is enough to ionize gas to simulate minimum ionization particle track. Just in case of 22 mm beam one has 40% reserve. Therefore, the laser will provide 31
 and mirror bundle diameters (bottom) energy high enough taking into account losses in prisms and mirrors in period of 6 month typical date of laser and")
38 Figure 5.12: Laser initial 10 mm-beam (top) and mirror bundle diameters (bottom) energy high enough taking into account losses in prisms and mirrors in period of 6 month typical date of laser and optics cleaning. Prisms and semitransparent mirrors are mounted in closed system with minimal amount of dust. It means that laser beam of 18 mm diameter is adequate for the task. 32
39 Features Table 5.1: Properties of Laser NL303HT-10-FH Rugged sealed laser cavity Better than 1 % rms pulse energy stability 10 Hz pulse repetition rate 3-6 ns pulse duration Thermo stabilized second, third, fourth and fifth harmonics generator modules Optional attenuators for fundamental or/and harmonics wavelengths Water-to-air cooling Replacement of flashlamps without misalignment of the laser cavity Remote control via keypad or/and USB port Specifications Pulse repetition rate 10 Hz Pulse energy at 266 nm 110 mj (after telescope) Pulse energy stability (StDev) at 266 nm 3.5 % Long term energy drift ±2% Pulse duration 3 6 ns Polarization at 1064 nm vertical, >90% Optical pulse jitter 0.5 ns rms Linewidth at 1064 nm <1cm 1 Beam profile Hat-Top in near field and close to Gaussian in far field Beam diameter 8 mm (at the output) Beam diameter 18 mm after telescope in the required distance Beam divergence TBD Beam pointing stability at 1064 nm 50 µrad Physical characteristics Laser head size (W H L) mm Cooling unit and power supply size mm Room temperature C Relative humidity (noncondensing) 20-80% Voltage 208 or 240 VAC, single phase 50/60 Hz Power < 1.8 kva 33

40 Chapter 6 Cooling system 6.1 Overview and temperature stabilization Figure 6.1: Common view of TPC temperature stability and cooling system The common view and general outline of TPC cooling and temperature stabilization system are presented in Fig Fig.6.3. It consists of the TPC outer and inner thermal screen, two end-cap screen and cooling system for FE cards, LV buses and HV divider, namely: 2 x 12 loops for the front-end electronic cooling 2 x 2 loops for the bus bar cooling and the ROC covers 2 x 2 loops for the ROC cooling 2 x 2 loops for the inner thermal screen 1 x 1 loops for the resistor rods A diagram representing the TPC cooling plant as well as some of the piping to the detector is based on the ALICE concept. The plant consists of a reservoir large enough 34

41 Figure 6.2: General outline of TPC cooling and temperature stabilization system to contain all the water in the set-up, a pump, heat exchanger connected to the mixed water network, one supply manifold and one return manifold. A total of 52 circuits have been connected to these manifolds. All this circuits are temperature and flow adjustable. Figure 6.3: Schematic view of the TPC cooling system The main goal of the cooling system is to provide temperature stability of the TPC gas mixture with a high precision. The temperature stability and homogeneity within the TPC drift volume have to be at the level of T< 0.5 C. The main heat source is FE cards. Each FE card dissipates about 6.4 W, the ROC chamber - about 330 W 35
, but this heat is dissipated directly into the gas volume. Other heat sources are neighboring detectors. Power consumption of 1488 FE cards is 9.5 kw, 24 ROC chambers 8 kw, LV buses 2 kw.")

42 and LV bus bar - 20 W. Another important heat source affecting the TPC gas is the power produced by the field-cage divider (resistor rods). While the power is relatively small (0.6 W per rod), but this heat is dissipated directly into the gas volume. Other heat sources are neighboring detectors. Power consumption of 1488 FE cards is 9.5 kw, 24 ROC chambers 8 kw, LV buses 2 kw. Total power consumption is about 19.5 kw. 6.2 Cooling of front-end electronics Each ROC contains 62 FE-cards. One sector dissipates 400 W. The 2 x 12 sectors dissipate a total of 9.5 kw. Cooling is provided individually to every sector. The schematic view of the FEE cooling and layout on the TPC is shown in Fig.6.4. We are going to use 6 mm copper tube to cool the individual card and silicon tube to connect copper tube. The FEE cooling envelope consists of two copper plates, 1 mm thick each, and the FE card inside. The copper tube is soldered to copper plate. The effective flow rate will be optimized. Figure 6.4: The front-end electronics cooling: left - cooling pipe layout for one ROC, right - cooling pipes layout for one TPC endcap 6.3 Cooling of bus and ROC covers This circuit cools the outer covers of the Read-Out Chambers, as shown in Fig.6.5. The heat dissipated by bus bars running along the spokes of the service support wheel need also to be removed. The one loop consists in 6 ROCs covers and 6 bus bars per supply line. Panel design and flow rate will be optimized. The ROC readout plane circuit layout is shown in Fig


43 Figure 6.5: Cooling of LV bus and FE boards 6.4 Thermal screen Figure 6.6: ROC readout plane circuit layout Outer thermal screen design is presented on Fig.6.7. Weight of each panel is about 3 kg. Total weight of 48 panels is 144 kg. The schematic view of the front and outer thermal screens and cooling of 62 FE-cards are shown in Fig.6.8. For monitoring the temperature distribution on the TPC the arrays of sensors are mounted both inside and outside of the gas volume of the TPC. In addition to sensors covering the outside of the inner and outer Field Cage, sensors are mounted onto each Read-Out Chamber. The Table 6.1 summarizes the location and number of the sensors. Additional temperature sensors on the front-end electronic cards complete the monitoring system. 37


 Table 6.")

44 Figure 6.7: Design of outer thermal screen (left) and panel (right) Figure 6.8: Design of front and outer thermal screens (left) and cooling of 62 FE-cards (right) Table 6.1: Number of temperature sensors Location Outer Field Cage Inner Field Cage ROC chamber Number of sensors
45 Chapter 7 Gas system The TPC consists of an inner drift volume and two insulating volumes (gaps) enveloping it. The insulating gaps are flushed with N 2. Several hollow rods, located inside the drift volume, will be flushed with working gas mixture for resistor chain cooling. The N 2 flow rate needs to be high enough to prevent of atmospheric contaminants due diffusion into insulating gap. The H 2 O concentration has to be less than a few tenths percent. A total flow of 15 L/min will allow a complete five volume change to purge insulating volumes in 1 day. 7.1 Technical requirements The considered gas system is assigned to provide a drift volume with the gas mixture 90%Ar + 10%CH 4 at the constant temperature and the constant overpressure. This system has to provide an inflow of the required gas flow N 2 in the insulated gaps of the TPC and of the gas mixture in the channels for the cooling of the strip system divider resistors forming a uniform electrical field in the sensitive volume. At the regular mode the gas system operates as the closed-loop system with the regeneration of the gas mixture portion circulating through the TPC. At the same time a small amount of the fresh gas mixture is added and the same amount is removed from the system (including the leaks). In the mode of the drift volume purification this system operates as the open one. The cross section of the TPC is shown in Chapter 3, Fig.3.1. The central electrode divides the active volume of the TPC into two identical parts of a length 170 cm. The drift volume of the TPC is liters, the volume of the inner and outer insulated gaps liters. At the modes of the purification and filling the gas flow through the TPC has to provide the five-time purify of the gas per day in the drift volume. At the regular mode the circulation rate of the gas mixture is L/hour. The concentration of O 2, CH 4 and water vapor in the gas mixture is controlled by the respective analyzers in the each branch of the system. According to their readings part of the gas mixture is directed into the branch of the regeneration to remove the water vapor and oxygen. Into the system a little flow of pure gases from a reservoir for the gas mixture preparation is supplied too. The developed system has to provide the constant pressure 2.0±0.03 mbar (relative to atmospheric) in the active volume of the TPC. 39
46 The concentration of CH 4 in Argon is retained at the level 10±0.1%. The temperature of the gas mixture is controlled at the input and output of TPC. The operation and control of the gas system operating parameters are realized with the help of a specialized electronic system, which controls the operation of all managed elements of the system, detects the operating parameters and generates a warning signal in case of the deviation from the setting values. The presented project is developed in accordance with the TPC gas system technical requirements. It uses the practical experience on development of the similar systems for the experiments STAR and PHENIX [31, 32, 33] at Brookhaven National Laboratory (BNL, USA) and also the last developments of the gas system [34] for the experiment CBM in Darmstadt, Germany. 7.2 Gas system description The schematic circuit is presented in Fig.7.1. Its main assignment is to supply the pure gas mixture of the stable composition in the TPC at the specified temperature and differential pressure and also to provide the reliable operation of the detector during a long term experiment. Figure 7.1: Scheme of TPC gas system Structurally, the gas system can operate as in the closed version for a long term experiment as in the opened one for purging of the TPC. Since the distance between the TPC and the gas system location is about 70 meters, the gas scheme contains two circulating loops: outer - with the compressors C1, C2 and inner - with the blowers C3,C4. The usage of two circulating loops can significantly reduce the cost of the connecting pipelines of a large diameter, and the outer circulating loop can be used for the TPC-prototype test without the inner loop. In the mode of a long term experiment 40
47 the outer circulating loop is used for the mixture analyze at various points of the system, namely: for the fresh mixture SV4, for the mixture inside of the detector - SV5, for the mixture at the purification unit output of the outer circulate loop - SV7 and for the mixture at the purification unit output of the inner circulate loop - SV9. Also, this loop is allowed to retain the differential pressure at the level 2.0+/-0.1mbar Fresh gas mixture preparation In this system the version of the dynamic preparation of the fresh binary mixture is used. In our case the main component is argon, which is changed into gas from liquid state by means of heat exchanger-gasifier and is blown to input SV2 of solenoid valve and then to mass-controller FM1. The flow indicator F11 and the solenoid valve SV1, opened normally, are used to increase the argon flow at the purging of the TPC. Within a long term experiment mode the rate at the F11 is set at the level of 5 L/min and the SV1 is closed. In the case of the power shutdown the SV1 and SV8 are opened and the TPC is filled by the pure argon that prevents the air diffusion into the TPC at an atmosphere pressure increasing. The second component is the pure gaseous methane, which is supplied to the masscontroller input FM2 at the pressure of 1bar through the solenoid valve SV3 from one of the commutated collectors. The component mixing to obtain the desired composition is carried out by means of the FM1, FM2 and Mixer. In this case the FM1 controls the FM2 that is allowed to keep the fixed composition of the gas mixture independently of the pressure oscillation at the inputs of the mass-controllers. The quantitative and qualitative composition of the fresh mixture is controlled by the analyzers of CH 4, H 2 O and O 2. Additionally, the content of Methane is estimated by the flow rate relation through the FM1 and FM2 by PC of the electronic control system. The limits of the flow rate regulation are: for the FM L/min, for the FM L/min. The choice of these limits is due to necessity of the five-time purging of the TPC during 24 hours. The required flow rate of the gas mixture is set by PC. Then, after Mixer, the fresh mixture is fed into the supply line ( 22 1 mm) of the outer loop and mixed with the circulatory flow. The Mixer is a cylindrical volume with the internal diameter of 30 mm and a height of 400 mm, filled by no oxide copper shavings to promote the flow turbulization and mixing. The Mixer temperature is controlled by temperature sensor TT Outer circulation loop Its functional purpose was described above. The using of two diaphragm-type compressors C1, C2 are caused by a guarantee of the operation reliability within a long experiment. During the operation only one compressor is used, the second is in reserve. The capability of each compressor is 30 L/min at the pump pressure 100 mbar. The differential pressure in the input collector of the compressors is determined by the difference between the differential pressure of the TPC and the pressure loss in the pipeline ( 32 mm 1 mm) connecting the input collector with the TPC. A constancy of the differential pressure in the TPC is kept by the electro-pneumatic controller PIDC1, which controls the pneumatic bypass valve BV1. The pressure sensors PT4 (input compressor collector) or PT8 (TPC) can be used as the sensor of feedback PIDC1. 41
48 The PID controller is an autonomous, microprocessor-based and connected with PC. This gives you the possibility to set quickly the specified pressure value and the PID adjustment coefficients in order to obtain the desired process of the pressure stabilization. If the pressure in the TPC will start to decrease relative to the set value, the PIDC1 will start to open BV1. In this case a more amount of the gas mixture will bypass from the pump collector to the input collector, and the pressure in the TPC will be increased. If the pressure in the TPC will be increased relatively to the setting value, the PIDC1 will start to close BV1, the pump collector pressure will start to increase, and when it will be at the level about 100 mbar the mixture will be exhaust into the atmosphere. This level (100 mbar) is set by means of the reverse pressure regulator BPCV1 and is measured by the pressure sensor PT3 and the indicator PI4. As result of this the differential pressure in the input collector of the compressors will reduced and eventually in the TPC. It should be noted that the manual bypass gate BMV1 is adjusted in order that the PID controller tuning limits have been optimal. For the normal operation of the PID controller an air pressure (Nitrogen) 1 bar is required. After the output collector of the compressors the circulate mixture is divided into two flows. One flow moves through the solenoid valve SV6 to the purging unit, which includes the element of oxygen removing from the gas mixture (Purifier) and the mixture dryer (Dryer). Structurally both elements have a cylinder form with the inner diameter - 40 mm and the height mm. The element Purifier is filled by an active coper and operates at the temperature C. To support this temperature the display-controller TIC1 is used. At the same temperature the element regeneration by explosion-proof mixture (Ar + 5% H 2 ) is carried out. The Dryer is filled up by zeolite NaX and operates at room temperature. Its regeneration is performed by the purging with the dry Argon at the temperature C. This temperature is stabilized by display-controller TIC2. The manual valves MV7, MV8 and MV9 are used at the regeneration of the purging unit elements. As noted above the solenoid valve SV7 is used for the gas sampling analyze. The content of oxygen and moisture is not above 2-3 ppm after purging unit. The mixture flow, moving through the purging unit, is measured and regulated by the flow indicator FI7 and it can reach up to 30% of the total. For the dust removal on the output of the purging unit the filter 5 µm (F3) is installed. The second flow passes through the pressure regulator PCV1. The pressure on the output from the PCV1is set at level about 20 mbar and is controlled by the pressure indicator PI3. The total flow in the outer circulate loop (including the fresh mixture) is measured by the indicator FI Inner circulation loop The main purpose of this loop is a fast exchange of the TPC volume by the gas mixture with its oxygen and the moisture purging and the high-voltage resisters cooling. The loop includes two compressors of eddy type C3, C4 with the volume capability - 13 m 3 /hour, each at the blow pressure mbar. At the active state is only one compressor, the second is in reserve. At this capability the one TPC volume exchange will take less than 1.5 hours. The reverse valves C7 and C8 prevent the bypass of the mixture flow through the inactive compressor. 42
49 The pressure at the blower output is measured by the pressure sensor PT11 and the indicator PI5. The bypassed manual valve BMV2 regulates the overall flow of the circulate mixture. By means of the hand-operated valve MV10 and the flow indicator FI8 the mixture delivery to the purging unit is regulated. The purging unit of this loop is similar to that described above, but it has a larger size and does not require more detailed description. The Purifier and Dryer have a cylinder form with the inner diameter - 80 mm the height mm. Up to 20% of the circulate mixture passes through the purging unit. On the output of the latest the filter 5 µm (F5) is installed. The differential pressure sensor PT12 controls the filter clogging. A mixture sample analysis is performed by means of the solenoid valve SV9. All flows are joined on the flow indicator output FI8 and then are moved into the water-cooled heat exchanger TO1. The flow sensor FT1 measures the total flow of the gas mixture circulated through the TPC. The filter 2 µm (F4) is installed at the TPC input Temperature measurement The temperature of the circulating mixture is measured at a few points, mostly in close of the TPC. As the temperature sensors the platinum thermometers 100 Ω placed in the mixture flow are used. It is provided the 5 temperature sensors for installation. The TT1 is located on the Mixer of the TPC gas system main frame, the TT2 - at input of water-cooled heat exchanger TO1, TT3 is placed at the TPC input, the TT4 - directly in the TPC gas volume and the TT5 - at output from the TPC Insulating volume purging The pure dry Nitrogen is used for the purging of the TPC insolating gap. It is obtained by the gasification of the liquid Nitrogen in air heat exchanger gasifier at a pressure 1bar which is measured by the pressure sensor PT10 and the indicator PI6. Then the pure and dry Nitrogen is injected to the flow indicator FI9. By means of this indicator the required flow rate within the limits 5 10 L/min is set. The differential pressure sensor PT7 is installed at the insolating volume input. It controls the pressure difference between the pressures in the active and the insolating volumes of the TPC. This difference must be positive. At the negative difference the electronic scheme will warn by sound and the light signals. The sensor of the minimal Methane concentration LLT1 is installed at the insolating gap output. It measures a minimal amount of Methane in the flow relatively to the minimal acceptable level of an explosive risk. At occurrence of the signal above the predetermined level from the sensor LLT1 the electronic system will warn by the sound and the light signals. The pressure liquid limiter Bubbler 2, configured to 1mbar, is used for the insolating volume protection Protection level for high and low pressure The electronic and electromechanical protection levels for the high and low pressure in the active TPC volume, which can lead to detector failure, are foreseen at the gas system. These levels duplicate each other and differ by capability (response time of 43
50 an electronic protection is ms and of an electromechanical is no more 1 s). All sensors, including the pressure, temperature, gas consumption and the analyzer output signals, are connected to electronic system. The pressure in the TPC is controlled by the differential pressure sensor PT9 in relation to the atmospheric pressure measured by the barometer BP1. The electronic system will warn by the sound and the light signal if the pressure value will exceed the first preset limit mbar. Upon the reaching of the second acceptable limit the electronic system will close the fresh mixture supply (SV2 and SV3 will be closed) and will open the alarm solenoid valve SV8 to eject the excess mixture into atmosphere. When the operating pressure inside the TPC will be 2 mbar, all valves will return to the initial state. If the pressure is reduced below the operating value to 1.8 mbar, the electronic system will increase the fresh mixture flow by 30% of the initial one. Upon the reaching of the operative pressure in the TPC the fresh mixture flow will be returned to the starting state. The pressure decreasing to 1.8 mbar can only happen at the sharp barometric pressure increment (rate > 0.5 mbar/min), that is not typical for Moscow region, or at the alarm loss of the pressure in the TPC. An electromechanical protection system is based on the pressure liquid limiter Bubbler 1 and the electro-contact manometer PIS1, in which are the adjustable limiters of low and high pressure levels. The pressure liquid limiter Bubbler 1 is filled up by vacuum oil and is tuned to the maximal permissible pressure 3mbar in the TPC. A low pressure threshold determined at the electro-contact manometer PIS1 will not exceed 0.8 mbar and high one not above 2 mbar. If the pressure will be below 0.8 mbar, the PIS1will open SV1, and the pure Argon will be added to the fresh mixture. At the exceeding of 0.8 mbar the PIS1 will close the SV1. An addition of pure Argon will not cause a significant variation of the mixture composition in the TPC. The estimates show that this variation will not exceed 0.01% on Methane. This value is below the Methane analyzer error. If the pressure will be above 2 mbar, the PIS1 will open SV8 and will close it at the pressure decrease below 2 mbar. The main technical features of the gas system are shown in Table 7.1. Table 7.1: The technical features of the gas system Feature Value Operating mixture Argon ± 0.1% Metane Consumption range control of fresh mixture 0-50 L/min Operating pressure in TPC 2.0±0.1 mbar Recirculation rate of outer loop 30 L/min Recirculation rate of inner loop 200 L/min Oxygen content 20 ppm Moisture content 10 ppm Gas purging of TPC insolating volume nitrogen Purging rate of insolating volume 5-20 L/min 44
51 7.3 Gas consumption The suggested data on a consumption of gases per day and month in view of the TPC initial purging, the volume of which is accepted to 18 m 3, are presented in Table 7.2. The initial purging of the TPC is implemented by Nitrogen two-times exchange of the TPC volume, by Argon two-times exchange and by the mixture (Argon+10%Methane) three-times exchange. The fresh mixture rate is accepted to 6 liter/min within a long term experiment. Table 7.2: Gases consumption Mode Argon, m 3 Methan, m 3 Nitrogen, m 3 TPC purging Experiment Per day Per month Pipelines pressure losses The estimate of the pressure losses is performed for the direct and inverse pipelines of the outer circulating loop and also for feed line of Nitrogen into the insolating gap, as each of them has a length about 70 m. The purging mode pressure losses for the direct pipeline with the inner diameter - 20 mm and the rate - 50 L/min are shown in Table 7.3. Table 7.3: Pressure losses for purging mode Gas Pressure losses, mbar Argon 8.5 Argon + 10% Methane 8.1 Nitrogen 5.6 The experiment mode pressure losses for the direct and inverse pipelines for mixture (Argon + 10% Methane) with rate 36 liter/min are shown in Table 7.4. Table 7.4: Pressure losses for experiment mode Pipeline name Inner diameter, mm Pressure losses, mbar Direct Inverse
52 Figure 7.2: Structural scheme of slow control subsystem 7.4 Gas system assembly and slow control subsystem Structurally the gas system is divided into 3 parts. The main part of the gas system is mounted in the standard frame of the electronics ( mm 3 ). It is located about 70m from the detector. The second part of the system is mounted in a smaller frame with dimensions mm 3 and is located in close to detector to provide the minimum length of the inner circulating loop. Some of the gas system equipment is assembled at the area for gases reservoir. The major part of the control subsystem is mounted on the sidebar of the gas system main frame. The computer is installed there too. The schemes for gas system and slow control subsystem are shown in Fig.7.2 Fig Slow control software It is assumed that for the gas system slow control of the TPC/MPD the software [35], which has been developed at the experiments STAR and PHENIX at BNL (USA) and RICH CBM [36], will be used. Developed on the windows platform this software includes a manual control by the gas system, data readout from all sensors, visualization and saving of all requirement parameters and the detector protection from differential alarms too. This software consists of three separate program modules: The module Gas system control is provided the data acquisition, its storage and the control by the gas system The DBViewer [37] performs the functions of the data visualization, event logging and data transfer from the database to the text file or MS Excel table for the successive analysis The module Charts [38] is used for an imaging of the time-depended parameters in real time. It is possibility to set the alarming levels for each table parameter in the tabular style. Additionally, this program module supports a protocol TCP/IP for the data transfer that provides the remote system control The database MS Access is used for the data and system events storage. 46

53 Figure 7.3: Connection scheme of gas system main frame Figure 7.4: Cable scheme of control module 47
54 Figure 7.5: Connection scheme of power supply modules and heaters Figure 7.6: Connection scheme of sensors and devices in close to detector 48
55 7.4.2 Main control module The main control module consists of two threads. The first is provided the graphical user interface (GUI) and event log, and the second is for data acquisition from the system sensors, a hardware control and an error handling. The second thread has a highest priority to provide a stable system operation at the high loads. The software basic window has the following menu options: Main control - the basic graphical interface window System parameters - the parameter tuning, electronics connection, sensor readout period et al. Alarms - the system diagnostic configuration of failed and alarm states Database - the sensor calibrated modification of coefficients and database edition DAQ32 - an expert fine tuning of the controller DAQ32 The software interface is described by the RICH CBM gas system example GUI items Main control item The Main control item is to control manually by the gas system (see Fig.7.7). In this window is displayed a simplified scheme of the gas system. All controllable discrete elements of the gas system are shown by the active icons on the scheme. The red color of an icon indicates the closed valves or disconnected devices, the green the opened valves or enabled hardware. A part of hardware and valves are controlled by the electro-contact manometer PIS1, which can disable a software manual control. All readout sensor names and values are shown at right as the tree-type structure. Below are located the control buttons of the gas system modes and diagnostics (at right) and event log contents (at left). On default button Alarms Disable is ON and error processing is OFF before start. System parameters item The System parameters item contains the tuning of all communication parameters and the pressure sensors PT4 (input compressor collector) (see Fig.7.8). The button Connect is used for connection to the controller by serial port. The buttons Data poll interval and Database interval are significant. The first determined readout period of sensor values from controller and the second the readout period of the parameter storage in the database (is recommended s). In case of an alarm the parameters values will be immediately written into database regardless of storage period. A flag [Ask valves control confirmation] prevents casual touches on the valve icons in the main window by any action confirmation if it is ON. 49

 can set the next values: Active sensor Sensor")
56 Figure 7.7: Gas system manual control window Figure 7.8: System parameters item Alarm item At an alarm the all system parameters will be automatically processed (see Fig.7.9). For each parameter user (Alarm name/enable) can set the next values: Active sensor Sensor Actuation level Level Recovery level Recovery - the system diagnostic configuration of failed and alarm states Alarm message 50

57 Status indicators of the valves and the configuration of all devices Figure 7.9: Alarm configuration The alarm processing procedure is analogized with an algorithm of the hardware alarm lockout developed for experiments STAR and PHENIX [39]. In each readout cycle the DAQ thread compares the actuation levels with the sensors values. If the sensor value exceeds the actuation level, the alarm message is written in the event log and the valve/device state is changed relate to the response template (red - OFF, green - ON, grey - prior state). A map of the changed state devices is stored in the memory. A recovery procedure after an alarm situation refers to the map devices. The alarm processing has the highest priority in relation to the recovery procedure. At the each cycle beginning of alarm processing the current state of all active devices as initial map of hardware states is used. Also is possibility to load defaults. The alarm configuration is saved in ini-file. There are two configuration files: an operation configuration and default. The operation configuration is read at every run and used at normal operation. The control buttons for alarm situations are shown in Fig Database item The Database enables item to tune the system parameters and calibrating coefficients for its writing into database (see Fig.7.11). All channels are divided into 3 groups: Fast, Slow and Control. For gas system is used only groups Fast and Control. The first 32 channels correspond to sensors connected to 32 analog inputs of controller. The channels from 33 to 36 fit to four analog outputs. The physical values for these channels are calculated by formula: S = (V + KA) KB The each channel has the following propeties for an edition: 51


58 Figure 7.10: Control buttons for alarm situations Name - channel name KA, KB - calibrating coefficients AVG - average coefficient Units - sensor measurement unit Branch - branch of channel Comment - user comment Figure 7.11: Database structure 52
 < S i 1 > Thus, if AVG=1 average is off, if AVG=0.1 average is performed by 10 samples.")
59 The name, units and comment are character strings. Coefficient of averaging AVG is used for sensor value smoothing by formula: < S i >= AV G S i + (1 AV G) < S i 1 > Thus, if AVG=1 average is off, if AVG=0.1 average is performed by 10 samples. The branches are used as channel groups for program modules Charts and DBViewer. For systems with 100 parameters and more to classify channels on subsystems. For simple systems with low count of channels are used two branches: the first for all system parameters, the second for controller (tuning coefficients, readout period et al.). Besides there is special branch for unused channels (Disabled branch). In this case unused channels are not shown at visualisation. The tool bar in the upper right corner enables to write and read channel configuration to/from ini-file. The database size should not exceeded 800 MB otherwise a new database with the file name (date+time) will be automatically created. 7.5 Multichannel controller DAQ Controller purpose and facility The controller DAQ32 is intended for the sensor signal measurement at the slow control system [40]. Up to 32 sensors can be connected to it. Its accuracy is 0.004% of measurement range, which can be switched at limits +4 V, ±5 V, +10 V, ±10 V. The used at industry analog sensors, as rule, have the voltage and current outputs. An accuracy of these sensors is not better hundredth of a percent and therefore a resolution 16 bits is enough for such sensors. Figure 7.12: Unit DAQ32 The DAQ32 is based on MCU-on-chip SiLabs C8051F064 and can independently control experimental setup without PC. All main control algorithms are programmed 53

60 inside the microcontroller. All signals are practically outputted to the single backside connector (96-pin DIN41612) excepting the interfaces USB and RS-232. Besides the 16 digital control signals are outputted to this connector. These are buffered outputs by type open collector for relay control by other devices of experimental setup, for example as valves, compressors et al. Maximal current through the each output µa. Figure 7.13: Analog filter with optional current shunt The controller DAQ32 is a euro-mechanics unit with the high - 3U (100 mm 160 mm, see Fig.7.12). It can control other units of a crate. The each signal from the sensor is moved through the analog filter and then to the multiplexer. After that signal is digitized by 16-bit ADC and buffered. At analog filter (see Fig.7.13) a shunt installation for the sensor current signals is provided. The rated current shunt should be chosen in compliance with ADC dynamic range. The simplified structural scheme of controller DAQ32 is shown in Fig Figure 7.14: Simplified scheme of DAQ32 For the purpose of the MCU from hanging the specialized scheme watch-dog, which restarts it through 47 ms, is used. In this case, the counter of the restarts is incremented. The software for DAQ32 is realized on the C/C++ and supported the main functions: the readout of the input analog channels, the control by the output channels and the data transfer. In the controller firmware the 4-channel PID-regulator for tuning of analog outputs is realized Accuracy and measurement time The controller software provides an averaging of the analog signal amplitudes on the ADC sampling tuning number. This procedure (average) permits to suppress a noise 54
61 but to increase the time of the measurement for 32 channels. The 32-channel scanning time dependence of the averaging factor is shown in Table 7.5. Table 7.5: Sampling number and measurement time Sampling number for averaging Scanning time, ms The measurement results are saved in RAM and can be read and processed by PC. The time resolution is 35 µs. Figure 7.15: Voltage-Time characteristic for one channel without averaging The typical voltage-time characteristic for channel 31 at measuring path after a multiplexer switching to channel 1 is shown in Fig The external source voltage is 2.5 V. The transient processes at multiplexer switching are faster ADC sampling. The maximal total current for 32 channels is 640 ma. For a crosstalk research three channels (1, 3 and 5) were connected to external voltage source (2.5 V). Even channels are equipped by the current shunts and are connected to 5 V. The 11 odd channels are equipped by current shunts 301 Ω and are connected to zero potential or 5 V by turns. Thus, there were studied the crosstalk of total current 183 ma on the measurement stability of the external reference voltage. The distribution of the reference voltage measuring values for 3 channels is shown in Fig Measurement mode is averaging on 16 samplings, the total scanning time 55
62 Figure 7.16: Voltage measurement distribution for 3 channels Figure 7.17: Current channel crosstalk of 32 channels - 25 ms, ADC sampling range V. From the distribution is seen that sigma (180 µv) approximately equals ADC least bit value (153 µv). The switching current crosstalk on the reference voltage for the neighbor analog channels is shown in Fig The switching current in the odd channels is represented by 7 th channel plot (ADC7). As you can see on the chart the current crosstalk 183 ma essentially smaller of the ADC resolution and has no effect on the measurement stability Calibration The controller calibration is carried out by means of the multimeter Keithley The measurement differential between the DAQ32 and the Keithley 2700 is shown in Fig Evidently that the calibration error is not exceeded ±0.2 mv. It corresponds to 0.004% of the full scale at the ADC using range from 0 to 10 V. Also, this error corresponds to the proper error of the multimeter Keithley 2700, which equals 0.2 mv 56
63 at the 10V-range. Figure 7.18: The DAQ32 calibration error Thus, the errors of the DAQ32 and the Keithley 2700 are comparable. The error 0.004% of the full scale satisfies quite the requirements of the measuring systems overwhelming majority, because the sensor calibration error as rule is not better of 0.01%. 57
64 Chapter 8 Front-end electronics 8.1 Design concept and general requirements The Front-End Electronics (FEE) has to read out charge detected by pads of the readout chamber located at the TPC end-caps. These pads deliver a current signal with a fast rise time and a long tail due to the motion of the positive ions. The induced on the pad plane signal is usually over 3 neighbouring pads. To satisfy the NICA project requirements, the TPC s data readout system has to transfer the mean data stream of 7 GB/s with the mean multiplicity per event of about 300 tracks and maximum multiplicity up to 1000 tracks. Another significant condition is to minimize the quantity of the substance in the TPC end-caps. The 16-channel ALICE TPC chip set (PASA [12] and ALTRO [13]) was adopted in FEC design to amplify the low noise signal to provide data processing and zero suppression. Another essential component of the system is FPGAs which provide communication and control functions. The data from all FECs are readout in parallel via fast serial interfaces. Readout Control Units (RCUs) are equipped with optical links. The main parameters of the front-end electronics for TPC are specified in Table 8.1. Table 8.1: Main parameters of FEE Parameter Value Total number of channels Signal to noise ratio, S/N > MIP (σ noise < 1000 e ) Dynamic Range 1000 (10-bit sampling ADC) Shaping time ns Sampling 10 MHz Tail cancellation < 1% (after 1 µs) Zero-suppression up to 90% Bandwidth up to 5 TPC Power consumption 100 mw/ch 58
 is served by 62 FECs having 64-channels each and one RCU as it is shown in Fig.8.1. Figure 8.")
65 Each of the two end-caps of the TPC is divided into 12 readout chambers (see Chapter 4). The readout system of each chamber is independent. Every readout chamber (ROC) is served by 62 FECs having 64-channels each and one RCU as it is shown in Fig.8.1. Figure 8.1: Structural scheme of one chamber readout Thus, all the data readout system consists of registration channels, 1488 FECs and 24 RCUs. 8.2 Front-end card and its prototype Prototype card The first phase of the FEE development was to create front-end card prototype (FEC64) for the ALTRO features study and the FPGA logic debugging. This card has interface USB 2.0 that allows you to operate with it without readout controller (RCU). The structural scheme of prototype card FEC64 is shown in Fig.8.2. On the FE card, as was FE-prototype, there are 4 PASAs and 4 ALTROs supporting altogether 64 channels per board and one FPGA Altera that performs the functions of the controller. The FPGA architecture is shown in Fig.8.3. The main tasks of FPGA are clock and power supply control, trigger signal control, interfaces with 40-bit bi-direction bus of ALTRO chip, SPI-bus and with FT232H (USB 2.0). 59
![Figure 8.2: FEC-prototype block-diagram Figure 8.3: FPGA architecture 8.2.2 Front-end card FEC64S The 64-channel front-end card FEC64S [46] is a modified version of the prototype card FEC64.](/docs-images/93/113591136/images/66-0.jpg "Like the prototype it consists of 64 readout channels and based on two ASICs: Pre Amplifier ShAper (PASA) and the ALice Tpc ReadOut chip (ALTRO chip).")

66 Figure 8.2: FEC-prototype block-diagram Figure 8.3: FPGA architecture Front-end card FEC64S The 64-channel front-end card FEC64S [46] is a modified version of the prototype card FEC64. Like the prototype it consists of 64 readout channels and based on two ASICs: Pre Amplifier ShAper (PASA) and the ALice Tpc ReadOut chip (ALTRO chip). The card FEC64S view and its structural scheme are shown in Figs.8.4 and 8.5. The signal flow starts with the analogue signal transported through two flexible cables and connectors at the detector end. The PASA has short connection links to these connectors to minimize the crosstalk caused by the fast input signal from detector. Afterwards, the ALTROs are directly joint to the PASAs using differential 60
 Cable between the detector and FEC; 2) PASA chips - low noise amplification of the signal; 3) ALTRO chips - digitization and processing; 4) FPGA board controller; 5) Serializer/Deserializer chip")
 bus, which is connected to the FPGA.")
67 Figure 8.4: Front-End Card FEC64S. 1) Cable between the detector and FEC; 2) PASA chips - low noise amplification of the signal; 3) ALTRO chips - digitization and processing; 4) FPGA board controller; 5) Serializer/Deserializer chip Figure 8.5: Card FEC64S structural scheme signals. The ALTRO chip connects the analogue part of the FEC64S with the digital part. The digital outputs are multiplexed through the LVCMOS (Low Voltage CMOS) bus, which is connected to the FPGA. The main function of FPGA is multiplexing 40-bit ALTRO words to a serial stream which is transmitted through a high-speed transceiver of the TLK 2711 chip ( Gbps). The scheme of one registering channel is shown in Fig.8.6. The output signals of the PASA chip are digitized by a 10-bit pipeline ADC with 25MSPS (one per channel) operating at a configurable sampling rate in the range of MHz. After the analogue to digital conversion, the signal processing is performed in 5 steps: 1) the first correction and substraction of the signal baseline, 2) the cancellation of long-term components of signal tail, 3) the second baseline correction, 4) the suppression of the 61

68 Figure 8.6: Single channel structural scheme samples having no useful information (zero suppression) and 5) data formatting. The ADC and digital processing logic are contained in the ALTRO as well as the buffer memory for 4-8 events. The digital processing parameters are configurable from the detector control system. The vital component of the FEC is ALTERA EP3C16Q240 FPGA. The on-board FPGA implements the following functions: - assures a possibility of initialzing all ALTROs channels; - provides the acquisition modes; - reformats 40-bit ALTROs words to 10-bit words for consequent coding; - encodes outgoing ALTROs data with Hamming-code; - monitors the condition of the FEC and collects some statistic information; - provides managment of the FEC; - realizes the auxiliary slow control interface - SPI (Serial Peripheral Interface) 40 MHz. The card can operate in two acquisition modes. They are the individual readout mode (IRM) and automatic scan mode (ASM). In IRM RCU has to send Channel Readout command individually to all channels to receive the data contained there. This mode is fairly slow and does not allow receiving the information simultaneously from all FECs. The ASM is used for automation of the data readout process. After activating of ASM the FEC becomes the master. In this mode the FPGAs state machine monitors the arrival of the second level trigger (LVL2) which informs that the valid data are stored in the ALTRO buffer memory. After receiving of LVL2 the FPGAs state machine starts to read the event length registers of all the ALTRO channels and stores their information in the dedicated FIFO memory. When the event length information is received from all 64 channels, the data readout circuit becomes active. At this ASM 62
69 mode only the channels which actually have buffered the data are read out and all the empty channels are skipped. It is worth noting that receiving the event length information is of higher priority than the channel readout in the FPGAs state machine. This is done because the event length register contains the information only about the latest event stored in the ALTRO buffers while for ADC samples there is the multi-event buffer memory. The data readout cycle from the channels is interrupted if another LVL2 has been obtained before all the available information is received and the cycle is resumed only after the new event length information is stored to the dedicated FIFO memory in the FPGA. After receiving Channel Readout command the ALTRO becomes the master of the bus and starts to transfer the registered ADC data from the multi-event buffer. In the ALTRO transfer mode the transmission of 40-bits data words starts at every cycle of the readout clock. The received parallel data are stored in a specialized FIFO buffer. The data at the FIFO output are sliced up in 10-bit words and then coded with Hamming code. The 11-th bit at the Hamming coder input is used for informational coloring of the words being transmitted. The 16-bit output words of the Hamming coder are given to the parallel input of Serializer/Deserializer chip TLK2711 to be serialized and transmitted to RCU. Also FPGAs firmware implements the functions of monitoring conditions of the board. Every FEC contains the 12 bit 16 channels - ADC AD7490 of successive approximation which is connected to the FPGA via SPI (Serial Peripheral Interface). An analogue temperature sensor MAX6607 is connected to one of the ADC channels. The measurement range of sensor is from -20 C to +85 C and accuracy from 0.6 C to 1.5 C. The remaining 15 channels are used for measuring currents and voltages. The measured values of currents, voltages and temperature of the board are taken to the FPGA where they are compared with the threshold registers. When the threshold is violated the interruption line is set and the interruption vector is formed. ALTROs and PASAs are combined on the card into two groups. Each of these groups is fed from separate power sources which are managed from FPGA. This architecture allows one to switch off half of the board if some problem occurs. A set of 62 registers has been realized in FPGA firmware.they are needed to manage the card, monitor its state and collect some statistics. The access to the FPGA registers is available through the high-speed serial interface as well as through additional SPI 40 MHz. The SPI slave has been realized in FPGA and can be used optionally. The SRAM based FPGA on FECs are particularly sensitive to radiation exposure because they will be located directly on the ROCs. The option of cyclic redundancy checking of the firmware is activated to prevent the incorrect operation of FPGA caused by violation of its configuration file. If any error occurs the FPGA activates the CRC line and external circuit initializes its reconfiguration. The FECs PCB (Printed Circuit Board) contains four signal layers and four power layers divided into two supply layers and two ground layers. The FEC64S is 95 mm wide and 167 mm long. 63
70 8.2.3 FEC testing When developing the FEC it is necessary to control noise and crosstalk values which affect the chamber space and de/dx resolutions. The Equivalent Noise Charge (ENC) was calculated by means of measuring the signal RMS value at the absence of the injected charge. To improve the measurement precision, we have taken the average value of several ten thousand measurements. Figure 8.7: Noise value at 16 FECs channels (without cable) Figure 8.8: FEC linearity. Top graph shows the difference between the measured value and the linear fit. The bottom graph demonstrates FEC response to the input signal The measured value of ENC for all the channels turned out to be about 0.5 ADC bits (see Fig.8.7). In order to measure FEC linearity, the input charge was generated by using a voltage step into the capacitor connected in series with the input. As a voltage source we used the Keysight 81160A pulse generator with remote control. To decrease the signal amplitude, the attenuator was connected to the generator output. The Fig.8.8 shows a typical response curve. The crosstalk was studied as well. It was found to be about 0.5%. 64

71 8.3 Readout control unit The RCU fulfils key system-level functions: distribution of trigger and clock signals to the FECs, configuration of each front-end channel, readout of the trigger related data from the FECs, subsequent formatting and transfer to the MPD DAQ system. RCU also provides monitoring the voltages, currents, board temperature and acquisition status registers. RCU is based on ALTERA Cyclone V GX series FPGAs. It consists of 8 input FPGAs and one main FPGA. Each of 8 input FPGAs serves up to 8 FECs. Up to 64 FECs can be connected to the RCU. Each input FPGA receives a serial stream from FECs implemented through the embedded high-speed transceivers. After data deserialization by FPGA which then decodes the information by Hamming code, reformats it to the 32-bits and stores to each of 8 FIFO buffers. All the 8 input channels operate simultaneously. When the information from the cards is received then it is multiplexed and transmitted to the main FPGA through the high-speed transceiver. Figure 8.9: Test system for eight cards. 1) FECs array (512 ch. in total), 2) clocks and control signal distribution card, 3) RCU emulator The general task of the main FPGA is receiving and multiplexing the data from 8 input FPGAs. The multiplexed data stream is transmitted to a high-speed optical link. Additionally to the optical interface the main FPGA is equipped with Ethernet of 10/100/1000 which provides independent link with the MPD detector control system. At this point the RCU schematic has been completed. The FPGA firmware has been designed and tested. The PCB design is in progress. In our design the FECs are directly connected to the RCU. The RCU emulator based on Cyclone V SX development board was used to test the FECs that also allowed one to verify RCUs FPGA firmware. The Fig.8.9 shows a test setup. The setup consists 65
72 of Cyclone V SX development board, 8 FECs (512 ch. in total), power supply sources and the dedicated card made to fan-out triggers, clocks and reset signals. 8.4 Data stream estimate The estimated evaluation of data stream from front-end electronics which is replaced at the readout chambers of TPC was calculated on the basis of initial parameters from Table 8.2. Table 8.2: Initial parameters for data stream estimate Parameter Value Total number of channels Pad raw number per ROC 53 ADC bit digitization 10 Event header size per channel (bit) 40 Time-stamp and cluster width size (bit) 20 Frequency of events (khz) 7 Average number of tracks in TPC 300 Maximal number of tracks in TPC 1000 The results of calculation on data stream estimate for 300 tracks are given in Table 8.3. Table 8.3: Data stream estimate for 300 tracks Parameter Value Event size without filtering (Mbit) 303 Front-end input stream (Gbps) 2121 Throughput of one FEC64S (Gbps) 2 Total throughput of Front-end (Gbps) 3024 Event size with filtering (Mbit) 7 66


73 Chapter 9 Prototyping For testing of the TPC drift volume gas leak the cylindrical tube for technological prototype is 950 mm in diameter and 900 mm long and has a mass of about 10 kg. The prototype cylinder was covered at both bases by flat plate and blown through with clean argon gas. A test of the tube showed that Kevlar laminated by Tedlar film as the wall material satisfies the requirements for the gas tightness. The oxygen admixture to the output gas was controlled in time and it has been found oxygen content is below 10 ppm. Figure 9.1: Test of 3 FE cards with small prototype of ROC chamber Test set up for study FE cards and DAQ is shown in Fig.9.1. Small proportional chamber with pad cathode was built. The signal shape is presented in Fig.9.2. To test the ROC chamber prototype the small gastight box with Mylar foil cover was constructed. The tests were performed with Fe 55 radioactive source. The drift gap for Fe 55 gamma-rays was about 5 cm. The anode of the chamber is segmented into five independent parts across high voltage power. The chamber cathode pad plane was manufactured by multilayer printed-board technology. It contains two sets of pad: 16 layers of 4x10 mm 2 pads and 32 layers of 6x12 mm 2 pads. Gas mixture Ar/CH 4 (90/10) was used in for testing. The test results are shown in Fig.9.3. The expected gas gain G 10 4 is reached at the anode voltage of 1450 V for the case of Ar/CH 4 (90/10) gas mixture. 67
 gas mixture Figure 9.")
 was built using the monolithic containment vessel 90 cm in diameter and 95 cm long cylinder produced by Industry.")
74 Figure 9.2: Digitized signal from the single pad Figure 9.3: Count plateau and gas gain versus anode voltage for Ar/CH 4 (90/10) gas mixture Figure 9.4: Prototyping of the TPC with Industry (Material: Kevlar laminated by Tedlar film) The Prototype 1 (see Fig ) was built using the monolithic containment vessel 90 cm in diameter and 95 cm long cylinder produced by Industry. The wire chamber is used for readout. The Field Cage is constructed from aluminized 13 mm wide Mylar strips with 15 mm pitch. The drift volume is about 75 cm long. The quartz 68


 with repetition rate 10 Hz or lower and duration")

75 windows are mounted into Prototype for ultraviolet laser beam input-output. Figure 9.5: Assembly of readout chamber prototype The TPC prototype tests with UV-laser beam and cosmic rays have been carried out. Low-power light pulse from Q-switched Nd:YAG laser model NL131/FH (0-2 mj per pulse) with repetition rate 10 Hz or lower and duration 3-4 ns got into the TPC prototype field cage through sapphire window to produce tracks in the TPC prototype and have been synchronized with the readout electronics. Figure 9.6: The TPC Prototype 1 69
76 In the cosmic ray tests the trigger signal for the readout electronics was generated by coincidence of signals from three scintillation counters. Two scintillation counters were positioned above the prototype field cage and one counter below. One of the goals of the TPC prototyping is the determination of the space point resolution. The laser and cosmic ray tests data of track coordinates are fitted by straight line and the space point resolution is determined from the residuals of the fit to the track coordinates. The residual distributions for laser beam are shown in Fig.9.7. Figure 9.7: Space resolution for UV laser beam The Pad Response Function (PRF) for 4x10mm pads determined using 0.8mm diameter collimated Fe 55 source is presented in Fig.9.8. The PRF dispersion (1.9 mm for 4x10 mm 2 pads) is consistent with the simulation results. The Prototype was equipped with the Field Cage and high voltage degrader. Field Cage consisting of set of aluminized Mylar strips. UV laser used for generate 5 tracks inside the TPC prototype drift volume. The five reconstructed laser tracks are shown in Fig.5.9 (section 5.3). In the drift velocity measurement (time difference between Figure 9.8: Pad Response Function (Prototype 1) 70
77 signals from any two laser beams) the electric field created in this way was found to be sufficiently uniform over the active area of the pad plane. Main test results see [15] - [29]. 71
78 Chapter 10 Detector performance TPC performance in heavy ion collisions was studied by means of detailed Monte-Carlo (MC) simulations. These studies were performed within a dedicated software framework - MPDRoot, which comprises interfaces to several event generators (UrQMD, HSD, LAQGSM, etc.), description of the detector geometry, particle propagation with the GEANT3,4 packages, detailed detector response simulation, as well as event reconstruction and analysis algorithms. The detailed description of the MPD geometry used in the simulation can be found elsewere [3, 4]. The overall detector material budget in the midrapidity region is dominated by the contribution from the TPC inner and outer cages, made of composite materials, resulting in the total amount of the material not exceeding 10% of the radiation length. Figure 10.1: Track reconstruction efficiency as a function of particle transverse momentum p t Tracking performance of the MPD TPC was studied with the Au+Au collisions from the UrQMD [43] generator at s NN = 9A GeV. The track reconstruction method is based on the Kalman filtering technique (see, e.g. [44]). In Fig the track finding efficiency in the TPC for primary and secondary tracks is shown as a function of the track transverse momentum. The efficiency studied in the mid-rapidity region ( η <1.3) is defined as the ratio of the found tracks to the generated ones. In this 72
79 study the number of TPC points per track was required to be greater than 10 to ensure precise momentum and de/dx measurements. The sample of secondary tracks includes those particles produced within 50 cm from the primary vertex both in transverse and longitudinal directions. Figure 10.2: The relative transverse momentum resolution as a function of transverse momentum p t (left) and pseudorapidity η (right) The transverse momentum resolution as a function of p T is shown on the left panel of Fig As one can see, p t /p t is less than 2% over the transverse momentum interval 0.2 < p t < 1 GeV/c. Moreover, the same level of the momentum uncertainty is observed for the pseudorapidty range η < 1.2 (see the right panel of Fig. 10.2). At larger pseudorapidities, however, the tracking performance degrades sharply for the TPC alone. Figure 10.3: The primary vertex position resolution along transverse and longitudinal directions as a function of primary track multiplicity An accurate determination of the primary events vertex position essentially improves the momentum resolution and the secondary vertices finding efficiency. The primary vertex is found by the extrapolating all primary tracks reconstructed in the TPC back to the origin and its resolution is defined as the RMS of the distribution of the whole sample of primary track extrapolations at the origin. Figure 10.3 shows the primary vertex resolution along the beam direction and perpendicular to the beam 73

80 direction as a function of the reconstructed primary tracks multiplicity. Both the primary and secondary vertex reconstruction methods utilized make use of the similar approach based on the Kalman filtering formalism [45]. Figure 10.4: Specific energy loss vs magnetic rigidity for electrons, hadrons and light nuclei For every track reconstructed in the TPC the specific energy loss de/dx is calculated as a truncated mean of charges of the TPC hits assigned to the track. The truncation level of 70% was chosen. In the MPD TPC specific energy loss resolution at the level of 8% can be achieved. Hadrons (π,k,p) and light nuclei can be identified using the de/dx information from the TPC only over a large part of the final-state phase space (see Fig.10.4). As shown in Fig.10.4 kaons can be discriminate from pions up to momentum of 0.7 GeV/c and protons discriminate from π and K mesons up to momentum 1.3 GeV/c. Figure 10.5: The reconstructed invariant mass of π + and π spectrum Reconstruction of strange mesons and hyperons in the MPD detector is possible by combining charged tracks reconstructed in the TPC using the secondary vertex finding technique with an optimized set of topological and track quality cuts in order to guarantee that track combinations are associated with real decays. To ensure that the charged tracks are secondary ones, distinct cuts are applied on the minimum value of the impact parameters to the primary vertex. 74
81 In addition, a pair of tracks is rejected if the distance of closest approach (DCA V 0 ) in space between the two opposite charged tracks is larger than a given value. Once the secondary vertex position is defined, only those falling within a fiducial region starting from a given distance from the main vertex are kept. Finally, the invariant mass is calculated under the proper hypothesis. Figure 10.6: The reconstructed invariant mass of protons and π spectrum The exact values of selection cuts were found by performing a multidimensional scan over the whole set of selection criteria with a requirement to maximize the invariant mass peak significance, defined as S/ S + B, where S and B are total numbers of signal (described the the gaussian) and background (polynomial function) combinations inside ±2σ interval around the peak position. More details about the analysis procedure can be found in Ref. [41]. In Fig.10.5 and Fig.10.6 are shown invariant mass spectra of (π +,π ) pairs and (p,π ) pairs, respectively. The used event sample contains about 10 4 central Au+Au collisions. One can see that the reconstruction quality and efficiency are high enough, such that the accumulated statistics will allow us to get unique experimental information on hyperon production over a broad region of the QCD phase diagram and a large phase-space of the reaction. Moreover, using of the two pions decay mode of K 0 in the MPD TPC would be possible as a convenient tool to monitor tracking detector and track reconstruction performance. 75


82 Chapter 11 R&D for alternative readout The track registration of charge particles in the pseudorapidity region above 1.2 will provide by the system of MPD end cap tracking detectors. In order to reach required momentum resolution and particle identification capability in this pseudorapidity region the TPC end caps have to be transparent in material. One of a way to minimize the material in the end caps is the use of low material gaseous detector such as GEM for TPC readout, by either to use more up-to-day ASIC chips for front-end electronics GEM-based readout chamber In our studies we are based on wide experience in the development of GEM for AL- ICE time projective chamber [Christian Lippmann A continuous read-out TPC for the ALICE upgrade, Frontier Detectors for frontier physics, 13th Pisa Meeting on advanced detectors, May 2015, La Biodola, Isola d Elba, Italy]. Figure 11.1: Detector components for BMN tracker In collaboration with CERN a few GEM detectors were produced and tested in BM&N experiment with the NUCLOTRON beams at JINR. The detector design was done at JINR. All detector components were manufactured at CERN facility and detector assembly and technological test was done at CERN by CERN and JINR engineers. The complete technological chain of GEM detector production is studied at CERN by JINR engineers for the last years and an infrastructure for the GEM chamber assembling is created at JINR. 76
 for GEMs are soldered on drift electrode. All components are cleaning by compressed air and are washing by deionization water before assembling.")

 and then bars-foils package is compressed by screws (see Fig.11.2, right). HV test is applied to check current leakage each GEM.")
.")
83 The strip readout electrode, drift electrode, GEM frame, GEM gap bars and GEM foil are shown in Fig Gas inlet and outlet are installed into GEM frame. HV spring connectors (6 pc) for GEMs are soldered on drift electrode. All components are cleaning by compressed air and are washing by deionization water before assembling. The components are heating up to T=160 C inside thermobox. GEM frame and gap bars are coating by urethane. Figure 11.2: Assembly of detector based on 3 pc GEM-foils GEM detector assembly is carried out in clean room. The special tool with reference pins is used fr GEM gap bars installation and GEM-foil positioning. GEM-foil is fixed on temporary frame and is pretension by scotch. The anti-dust role and napkins are used for dust cleaning. All 3 pc GEM-foils are installed on gap bars one by one (see Fig.11.2, left) and then bars-foils package is compressed by screws (see Fig.11.2, right). HV test is applied to check current leakage each GEM. If current leakage is acceptable GEM foils are cutting around frame perimeter. Figure 11.3: Connectivity test and final assembly The strip readout electrode and 3-GEM package are cleaning. 3-GEM package is installed on strip readout electrode and it is tension by screws around GEM frame perimeter. After that HV pins with each GEM-foil are checked (see Fig.11.3, left). The central coupling bolt is installed in the middle of the detector (see Fig.11.3, right) and flatness of strip electrode and drift electrode are checked. At the final step HV test with current leakage monitoring is carried out. The detector gas tightness is checked with gas leak detector. HV divider is soldered 77
. HV is apply to detector up to HV = -4 kv with step 50-100 V. The HV current must be less than 100 na.")

84 Figure 11.4: Detector gas gain non uniformity test with radioactive source Fe 55 (see Fig.11.4, left) to strip electrode and grounding connectors plug - to strip electrode connectors. The detector is flashed by gas mixture Ar/CO 2 (70:30). HV is apply to detector up to HV = -4 kv with step V. The HV current must be less than 100 na. The detector gas gain non uniformity is tested with radioactive source Fe 55 (see Fig.11.4, right) SAMPA-based front-end electronics The SAMPA project was started at the CERN in 2014 aiming to develop new ASIC chip for an Alice TPC/MCH frontend electronics upgrade for operating after 2018 when a luminosity of LHC accelerator will significantly increase. There are a number of institutes from Europe, America and US involved in this project. The main SAMPA features are presented in Table Table 11.1: The main features of SAMPA chip Specification SAMPA Voltage supply 1.25 V Polarity Positive/Negative Linear Range 100 fc, 500 fc Sensitivity 4 mv/fc, 20 mv/fc, 30 mv/fc Non-Linearity < 1% Crosstalk < 0.2% ADC resolution 10-bit Sampling Frequency 10 MSps Read-out Bandwidth up to 3.2 Gbps Power consumption (per ch.) 30 mw Channels per chip 32 SAMPA chip is considered as main component for the frontend electronics upgrade in the ALICE experiment at CERN, in TPC/STAR at RHIC and in TPC/NICA (JINR). 78

85 There are a several features, which SAMPA attractive for an application in the TPC/NICA frontend electronics are making. Figure 11.5: SAMPA schematic diagram The first of all is a small size of chip, which comprising both analog and digital parts. This significantly decreases a size of the frontend electronics board that, in turn, provides the essential step toward the TPC end caps transparency. Figure 11.6: Structural scheme of SAMPA test board The second, chip possibility of operating as well positive as negative input signal gives such opportunity for smooth upgrade TPC readout system when MWPC chambers will be substitute for GEM chambers. The SAMPA chip has 32 analog-digital channels. Each channel includes charge sensitive amplifier shaper (CSA+Shaper), digital signal processor (DSP) and event buffer. It supports continuous and triggered read-out. In fact, this chip is an evolution of two 16-channels PASA and ALTRO chips, which are presently used in ALICE. The schematic diagram of SAMPA channel is shown in Fig The input signal of positive/negative polarity is amplified and integrated by charge sensitive amplifier (CSA) and Shaper and then is digitized by 10-bit 10 MHz ADC. 79
. The first iteration of SAMPA chip (MPW1) has been studied by group of ALICE CERN and JINR.")
86 The SAMPA higher integration 15x15 mm 2 BGA chip and reduced power consumption will enable to design a more compact readout card. The test boards for the naked and BGA package chips were designed in 2016 (see Fig.11.6). The first iteration of SAMPA chip (MPW1) has been studied by group of ALICE CERN and JINR. The second iteration MPW2 was designed in 2016 and delivered in spring The two iterations of SAMPA chip (MPW1 and MPW2) were studied by groups of SAMPA collaboration. Some pilot chips were tested and the measured results have shown the feasibility of SAMPA-based FEC for the TPC MPD/NICA. It should be noted the idea of using the SAMPA chips in the FECs by modifying the designed one seems to be very productive. Figure 11.7: FEC32S board based on SAMPA chip The comparison table of some estimated parameters for front-end electronics of the TPCs ALICE, STAR and NICA/MPD are given in Table Table 11.2: Front-end comparison table TPC ALICE TPC STAR TPC MPD (SAMPA) (ALTRO) Total number of channels (in thousands) FEC channel number FEC configuration SAMPA+GBT SAMPA+FPGA SAMPA ALTRO+FPGA FEC throughput (Gbps) 18 N/A Planned frequency of event receiving (khz) 10 N/A 7 7 The 32-channel FEC32S (see Fig.11.7) board prototype was designed and produced on the basis of the SAMPA MPW2 BGA-chip. The FEC32S board has a size 75x56 mm 2 and contains 6 layers. 80
87 Chapter 12 Material budget The MPD Time Projection Chamber is the main tracking detector of the central barrel and, together with inner tracking system, time of flight system and electromagnetic calorimeter, has to provide the requirements following from physics objectives at pseudorapidities η < 1.2. Since the amount and position of material traversed by particles in the MPD inner detectors has an impact on the performance of outer detectors it has to be optimized for minimal multiple scattering and secondary particles production. The list of TPC materials traversed by particle moving from interaction point is presented in Table 12.1 (without central electrode). This estimation was done without electronics and cooling material. Table 12.1: List of TPC materials Material Thickness, cm X0, cm X/X0,% for η = 0 for η = 1.31 Tedlar Kevlar C1 h= Nitrogen N 2 gap C1-C2 h= Kevlar C2 h= %Ar+10%CH 4 h= Kevlar C3 h= Nitrogen N 2 gap C3-C4 h= Kevlar C4 h= Al TPC shielding h= Total In the azimuth the field cage material is not homogeneously distributed. We have 24 Kevlar support rods (1.8 cm) here, as shown in Fig.2.2, and for each 30 0 there will be singularity in material distribution. The track reconstruction in the region of pseudorapidity beyond 1.2 is provided by both TPC and endcap tracker. In order to have required momentum resolution and particle identification capability in this region the TPC end plate elements and readout electronics which is mounted on them have to be minimized for material budget. 81
88 Table 12.2: Material distribution in TPC end cap for wire chamber and GEM-based chamber readout Base line option Upgrade Wire Chamber X/X0,% Gem-based chamber X/X0,% 1. Wires + Gas GEM foils Cu, x5 µm = 40 µm Kapton 4x50 µm = 200 µm 2. Pad plane h=3 mm Pad plane h=1.5 mm Insulating plate h=3 mm Insulating plate h=1.5 mm Al frame h=5 mm Carbon panel h=25 mm Epoxy glue (2x0.1 mm) Epoxy glue (2x0.1 mm) Air gap L=10 cm 0.03 Air gap L=10 cm 0.03 Total: 9.34 Total: FE (62 FE boards) FE (based on SAMPA chip) PCB + components FE single layer 1.0 FE - 4 layers 5.0 FE Cooling FE Cooling Cu radiators + H 2 O 49.9 Al pipes + plates on chips 2.5 TPC thermo-screen 1.69 TPC thermos-screen 1.69 Total: 86.1 Total: 17.5 The TPC with proportional chamber readout it is suppose will be used for first stage of MPD setup. In future to minimize the material in the TPC end cap the proportional chamber will be replaced by Gem-based readout chamber equipped with front end electronics based on SAMPA chip. The readout electronics will be mounted on the pad plane directly or on a few printed boards placed in stack parallel to pad plane. The fractional radiation lengths of the different constructional elements in the TPC end plate are shown in Table The X/Xo is 17.5% for more precise calculations where the electronics and cooling material were included. 82

89 Chapter 13 Infrastructure, assembly and safety 13.1 Infrastructure As was mentioned above the main TPC construction elements were produced by industry. A new TPC assembly hall will be built for the TPC assembly and testing. The common view of Bld.217 and general layout of the TPC assembly hall are shown in Figs.13.1 and The hall has the clean area for the TPC assembling and two rooms for experimental equipment such as gas supply and regeneration system, cooling system, high voltage and the LV power supplies and so on. The clean room has square about 7 m x 12 m = 84 m 2 and air purity class 1000/ISO6 (see Fig.13.3) Figure 13.1: Building 217 common view All handling of the TPC will be done using a special transportation frame which will allow moving the TPC from Bld.217 to the MPD detector hall. It will also be used during the installation of the TPC into the MPD detector. 83

90 Figure 13.2: Assembly hall plan Figure 13.3: Clean room 13.2 Assembly of detector Assembly procedure Since the TPC field cage containment cylinders are not differ significantly each form other in size the TPC assembling will be done at horizontal position of each elements. 84

91 Figure 13.4: Schematic view of the arrangement for TPC assembly The arrangement for TPC assembling is shown schematically in Fig The pair of precisely positioned rails placed on flat surface, the strong arm I-beam with adjustable module, a system of three travelling lodgements and a special mobile platform create mechanical structure for step-by-step assembling of the TPC field cage elements. At the first step the pairs of cylinders C1-C2 and C3-C4 are glued by means of intermediate flanges. For C3-C4 an additional adjustable flanges are used to prevent the cycle form of cylinders as shown in Fig In the next stage the C1-C2 assemblage is set on the arm and the flanges and high voltage electrode are mounted as shown in Fig Then they are arranged in respective to the readout chamber sectors. The HV electrode is placed on the C2 cylinder in its middle. The HV electrode has a support in its bottom part. This support gives possibility to rotate C1-C2 with the HV electrode in respect to the TPC flanges. The 3 holes on the external TPC flange diameter are used to align the HV electrode relatively the TPC flanges by means of 3 installation roads parallel with precision 100 µm. After finishing of TPC flanges and the HV electrode adjustment the actual position of all elements, including the flatness and rotation relatively to each other, is checked by laser range meter and flange reference pins. Then 24 tubes for inner field cage are installed and all elements are fixed in its positions by epoxy as it is shown in Fig After removing of installation roads the mylar tape inner field cage is mounted. Mylar tape with thickness 50 µm coated on both sides by aluminum is used. The tape cut on the belts. Two connectors are fixed to each belt. The length of each belt with connectors is calibrated at fixed temperature and humidity. 85


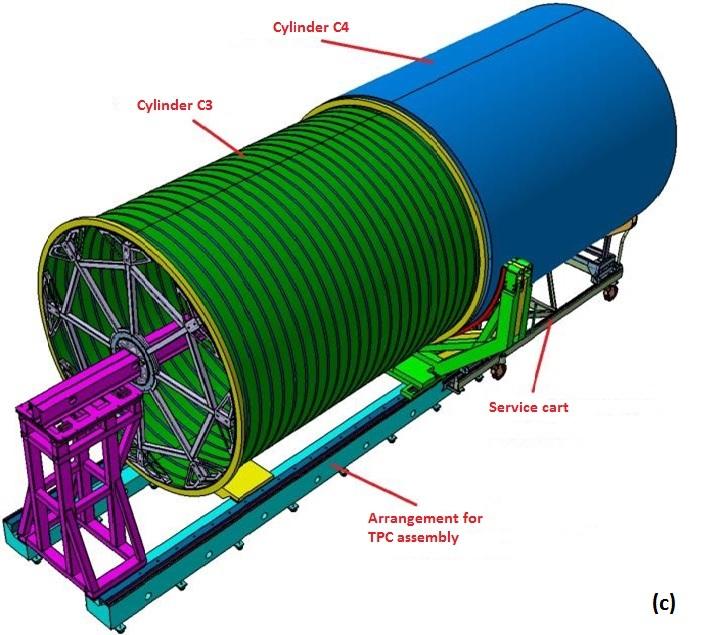

92 Figure 13.5: The consecutive steps of C3-C4 cylinders assembling procedure 86


93 Figure 13.6: HV electrode and TPC end cap flange assembling procedure 87


94 Figure 13.7: Field cage assembly stage 88


95 Figure 13.8: Manufactured assembly tooling The external TPC field cage is assembled in the same way as internal field cage. Then mirrors and prisms for laser calibration are installed and positions of laser rays inside the TPC volume are measured. In the finish step the C3-C4 is assembled and the TPC is placed on mobile platform. All next assemble procedures are carried out in this TPC position Assembly tooling The special assembly tooling described above was manufactured at Mechanical and Instrument Engineering Corporation (Bryansk, Russia) and delivered to LHEP at this juncture (see Fig.13.8). 89
96 13.3 Safety Mechanical A detailed set of specifications for TPC cylinders, end-plates and other mechanical constructions, including specific manipulators, are proposed to the manufactures according to state quality standards. The vessels are designed for a maximum over-pressure of 50 mbar despite the fact that the TPC will be operated at a pressure of 2 mbar above atmospheric Gas Gas system has to supply safe and normal operation of TPC. All the gases in the TPC should be pure. As far as the contained vessels are concerned, redundant and stand-alone safety mechanisms have been implemented in order to protect the device from under- or over-pressure. The details of electromechanical protection, alarm and control functions of gas subsystem are described in section Radiation protection There are two main mechanisms that may induce radioactivity in the TPC. These are low-energy neutron activation and inelastic hadronic interaction at high energy. We do not expect any radiation hazards to be caused by the accumulation of radionuclides in the TPC RF shielding Both surfaces of the inner and outer TPC containment vessels are coated with a 50 µm thick layer of aluminium foil. Thicker metallic shielding is incompatible for a low-mass structures for the TPC Electrical protection High voltage for field cage It is obvious that any component failure in the system must automatically lead to high-voltage shutdown, including the risks associated with very high-voltage circuitry of the TPC field cage. The possibilities to recognize component failure are very limited, usually restricted to measuring the current through the voltage divider resistor chain. Giving the limited access and the mechanical fragility of the system, it is also clear that corrective measures to the voltage divider network itself are extremely difficult, if not impossible, to make. Therefore, every single component (e.g. the resistors), and each stage during the assembly of the rod are carefully inspected and tested. High voltage for readout chambers The range of ROC operating voltage is V. The installation is based on standard coaxial high-voltage cables rated for 5 kv, including standard high-voltage connectors. 90
97 For gating grid the voltage up to 200 V will be supplied. Here will be used highvoltage cable RG58 rated for 3 kv and BNC-connectors for 500 V. The remotely-controlled power supplies with voltage and current monitoring will be used. Low voltage The front-end electronics of the TPC is a typical low-voltage high-current system (about 2 ka in total), which may run the risk of fire in case of uncontrolled current. For each FEC three power supply levels will be delivered: +5.0 V/ 100 ma, +3.8 V/ 200 ma and +3.0 V/ 800 ma. Total power supply is no more 6 kw (nominally - 5 kw and reserve - 1kW). The low-voltage system is based on universal multichannel power supply system CAEN SY4527. For stabilization of low-voltage system the interface module LVDB-N was developed. It supplies actual voltage levels for FECs and has the tools of current and temperature control in real time. Laser The TPC laser system consists of two pulsed 130 mj 5-7 ns Nd:YAG lasers with 10Hz repetition rate. The laser will be placed as close as possible to the TPC outside magnet. The laser light will be guided by mirror system to the end-plates of the TPC (see Section 5). Once the laser light has entered the TPC drift volume through the quartz windows no further protection is needed. All parts of the laser system will be labelled with proper warning symbols. 91
98 Chapter 14 Organization 14.1 TPC organization The TPC organization is constituted by project leader, a deputy leader and sections as is shown in Fig.14.1 Figure 14.1: TPC organization 14.2 TPC TDR editorial group The TPC TDR editorial group was composed of the following persons: S.A.Movchan, S.V.Razin and G.A.Cheremukhina Participating institutes The following institutes participate in construction of the TPC detector: Laboratory of High Energy Physics of Joint Institute for Nuclear Research (Dubna, Russia) 92
99 Petersburg Nuclear Physics Institute (Gatchina, Russia) Institute of Nuclear Problems of Belarusian State University (Minsk, Belarus) 14.4 Time schedule and cost book The TPC assembly and test time schedule is presented in Table 14.1 for the period of Table 14.1: The TPC time schedule N Item Date 1 Assembly TPC cylinders C1+C2 December TPC assembly hall ready January TPC assembly (C1-C4 + 2 flanges) December ROC chamber manufacture (27 pc) Assembly ROC chamber (24pc)to January - June TPC electronics manufacture May 2018 ( 1650pc FEC64S and 24pc RCU) pc FE cards assembly to ROC chamber September December TPC test with cosmic and laser calibration system 2018 July TPC transportation from Bld.217 to the MPD hall August Installation to MPD September TPC gas and cooling systems assembly in the MPD hall January September test inside MPD 2020 TPC total cost is $. The TPC cylinders C1-C4, the TPC prototypes and FE electronic prototype were manufactured for the period of Total expenses for this period are about 2.1M$. The TPC cost book is presented in Fig

100 Figure 14.2: TPC financial costs
Design and Construction of a GEM-TPC Prototype for R&D Purposes
 Design and Construction of a GEM-TPC Prototype for R&D Purposes 2003 IEEE NSS - Satellite Workshop on Micro-Pattern Detectors for Time Projection Chambers Portland, Oregon (USA) 19-25 October, 2003 1)
Long term stability tests of INO RPC prototypes
 Long term stability tests of INO RPC prototypes While the problem of sudden aging in the glass RPC prototypes is being investigated, a few RPCs of dimension 40 cm 30 cm were fabricated, using glass procured
TPC Report. D. Karlen T2K ND280m meeting December 7, 2004 Rome
 TPC Report D. Karlen T2K ND280m meeting Rome Outline Review of current TPC concept as outlined in the TPC feasibility report (December 6, 2004) http://particle.phys.uvic.ca/~karlen/t2k Performance goals
ATLAS RPC QA results at INFN Lecce
 ATLAS RPC QA results at INFN Lecce M. Bianco,, I. Borjanovic, G. Cataldi, A. Cazzato,, G. Chiodini, M.R. Coluccia,, P. Creti, E. Gorini,, F. Grancagnolo, R. Perrino, M. Primavera, S. Spagnolo,, G. Tassielli,,
IEEE RAS Micro/Nano Robotics & Automation (MNRA) Technical Committee Mobile Microrobotics Challenge 2016
 Technical Committee Mobile Microrobotics Challenge 2016") IEEE RAS Micro/Nano Robotics & Automation (MNRA) Technical Committee Mobile Microrobotics Challenge 2016 OFFICIAL RULES Version 2.0 December 15, 2015 1. THE EVENTS The IEEE Robotics & Automation Society
IEEE RAS Micro/Nano Robotics & Automation (MNRA) Technical Committee Mobile Microrobotics Challenge 2016 OFFICIAL RULES Version 2.0 December 15, 2015 1. THE EVENTS The IEEE Robotics & Automation Society
DEVICES FOR FIELD DETERMINATION OF WATER VAPOR IN NATURAL GAS Betsy Murphy MNM Enterprises 801 N. Riverside Drive Fort Worth, Texas 76111
 INTRODUCTION Water vapor in natural gas has more than a substantial effect on the quality of the gas stream. Without quality measurement of water vapor the gas is basically not saleable. Contracts are
Gas density monitor With integrated transmitter Model GDM-100-TI
 SF 6 gas solutions Gas density monitor With integrated transmitter Model GDM-100-TI grid Products WIKA data sheet SP 60.05 for further approvals see page 5 Applications Gas density monitoring of closed
Detecting sound wave of bubbles produced in a boiling liquid
 Detecting sound wave of bubbles produced in a boiling liquid Angela Galvez Abstract This experiment attempted to detect the sound wave produced by bubbles in boiling water and liquid nitrogen as an application
Analysis of RPC Performance with Different Gas Mixture
 Analysis of RPC Performance with Different Gas Mixture Cern Summer Student Programme Report Xing FAN xfan@icepp.s.u-tokyo.ac.jp 11/Sep/2015 Supervisor: Beatrice Mandelli (CERN PH-DT) 1 Introduction 1.1
The Transition Radiation Detector of the AMS-02 Experiment
 The Transition Radiation Detector of the AMS-02 Experiment Simonetta Gentile Università di Roma La Sapienza, INFN (Italy) for: RWTH Aachen, MIT, KNU Daegu, IEKP Karlsruhe, Universita La Sapienza, & INFN
Columbus Instruments
 0215-003M Portable O 2 /CO 2 /CH 4 Meter User s Manual Columbus Instruments 950 NORTH HAGUE AVENUE TEL:(614) 276-0861 COLUMBUS, OHIO 43204, USA FAX:(614) 276-0529 1 www.colinst.com TOLL FREE 1-800-669-5011
arxiv: v1 [physics.ins-det] 6 May 2016
![arxiv: v1 [physics.ins-det] 6 May 2016](/thumbs/96/129283480.jpg "arxiv: v1 [physics.ins-det] 6 May 2016") Preprint typeset in JINST style - HYPER VERSION Effect of water vapor on the performance of glass RPCs in avalanche mode operation arxiv:15.67v1 [physics.ins-det] 6 May 16 K. Raveendrababu a,d, P. K. Behera
Preprint typeset in JINST style - HYPER VERSION Effect of water vapor on the performance of glass RPCs in avalanche mode operation arxiv:15.67v1 [physics.ins-det] 6 May 16 K. Raveendrababu a,d, P. K. Behera
Yoke Instrumentation: ILD Muon System / Tail Catcher. Valeri Saveliev IAM, RAS, Russia DESY, Germany 3 June, 2016
 Yoke Instrumentation: ILD Muon System / Tail Catcher Valeri Saveliev IAM, RAS, Russia DESY, Germany 3 June, 2016 ILD Muon System/Tail Catcher µ - µ + Events/0.2 [GeV] 150 + Zh µ µ - X 100 50 s = 250 GeV
Annex 1 Gas circulation / purification system
 Annex 1 Gas circulation / purification system In the proposed experiment, a high pressure hydrogen TPC and a large aperture Forward Tracker are placed in one vessel which could stand for pressures up to
Assembly and measurements of a mechanical prototype of the BIS MDT chamber
 ATLAS Internal Note MUON NO 243 9 June 1998 Assembly and measurements of a mechanical prototype of the BIS MDT chamber K. Ekonomou Physics Department, Aristotle University of Thessaloniki, Thessaloniki,
PRC CO ² -LASER PRESENTATION
 Page 1 of 7 PRC CO ² -LASER PRESENTATION GENERAL CHARACTERISTICS - Embedded PC104 Electronics with exchangeable software allowing very easy integration of customer specified functions: such as eg. specific
Laser-Induced Bubbles in Glycerol-Water Mixtures
 Laser-Induced Bubbles in Glycerol-Water Mixtures Allison R. McCarn, Erin M. Englert, and Gary A. Williams Department of Physics and Astronomy, University of California, Los Angeles, California 90095, USA
The HumiSys. RH Generator. Operation. Applications. Designed, built, and supported by InstruQuest Inc.
 The HumiSys RH Generator Designed, built, and supported by InstruQuest Inc. Versatile Relative Humidity Generation and Multi-Sensor System The new HumiSys with single or dual RH probes capabilities is
Level MEASUREMENT 1/2016
 Level MEASUREMENT 1/2016 AGENDA 2 A. Introduction B. Float method C. Displacer method D. Hydrostatic pressure method E. Capacitance method G. Ultrasonic method H. Radar method I. Laser method J. Level
OxyScan Graphic. Operating Instructions. UMS Micro-oxygen sensor 501. Microprocessor instrument
 OxyScan Graphic Operating Instructions UMS Micro-oxygen sensor 501 Microprocessor instrument Introduction Thank you for choosing the UMS Micro Oxygen Sensor 501 - a highly advanced product! Please read
Experience with the ZEUS central tracking detector
 Computer Physics Communications 1 Computer Physics Communications Experience with the ZEUS central tracking detector David Bailey, a, * Richard Hall-Wilton b a H.H.Wills Physics Laboratory, Tyndall Avenue,
Genesis MX SLM-Series
 Single Frequency Visible OEM and End-User OPS Laser Systems Applications like Flow Cytometry, Particle Counting, DNA Sequencing and Microscopy are enable by low noise, visible true CW lasers. The Genesis
SPWE Series. Setup Instructions. Version 2.0
 SPWE Series Integrated Tank Weighing Assembly Setup Instructions Version 2.0 Load Cell Central follows a policy of continuous improvement and reserves the right to change specifications without notice.
Design of a Solid Wall Transonic Wind Tunnel
 Design of a Solid Wall Transonic Wind Tunnel David Wall * Auburn University, Auburn, Alabama, 36849 A solid wall transonic wind tunnel was designed with optical access from three sides to allow for flow
The Resistive Plate Chamber detectors at the Large Hadron Collider experiments. Danube School, September 8-13, 2014 Novi Sad
 The Resistive Plate Chamber detectors at the Large Hadron Collider experiments Roberto Guida PH-DT-DI Danube School, September 8-13, 2014 Novi Sad Ionization chambers Ionizing particles are producing primary
New Highly Productive Phased Array Ultrasonic Testing Machine for Aluminium Plates for Aircraft Applications
 19 th World Conference on Non-Destructive Testing 2016 New Highly Productive Phased Array Ultrasonic Testing Machine for Aluminium Plates for Aircraft Applications Christoph HENKEL 1, Markus SPERL 1, Walter
Wave phenomena in a ripple tank
 Wave phenomena in a ripple tank LEP Related topics Generation of surface waves, propagation of surface waves, reflection of waves, refraction of waves, Doppler Effect. Principle Water waves are generated
E M. Birski 1,,D.Dabrowski 2, 3,M.Peryt 2, 3,K.Roslon 2, 3, M. Bielewicz 3, 4 NETWORK ANALYZER USED IN MPD SLOW CONTROL SYSTEM AUTOMATION
 E13-2017-84 M. Birski 1,,D.Dabrowski 2, 3,M.Peryt 2, 3,K.Roslon 2, 3, M. Bielewicz 3, 4 NETWORK ANALYZER USED IN MPD SLOW CONTROL SYSTEM AUTOMATION Submitted to Particles and Nuclei, Lettersª 1 University
Plasma Cleaner. Yamato Scientific America. Contents. Innovating Science for Over 125 Years. Gas Plasma Dry Cleaner PDC200/210/510 PDC610G.
 Yamato Scientific America Innovating Science for Over 125 Years Plasma Cleaner Contents Gas Plasma Dry Cleaner PDC200/210/510 PDC610G Gas Plasma Reactor 145 146 147 149 144 Gas Plasma Dry Cleaner Plasma
Analysis of Pressure Rise During Internal Arc Faults in Switchgear
 Analysis of Pressure Rise During Internal Arc Faults in Switchgear ASANUMA, Gaku ONCHI, Toshiyuki TOYAMA, Kentaro ABSTRACT Switchgear include devices that play an important role in operations such as electric
HumiSys HF High Flow RH Generator
 HumiSys HF High Flow RH Generator Designed, built, and supported by InstruQuest Inc. Versatile Relative Humidity Generation and Multi-Sensor System The HumiSys HF is a high flow version of the previously
Flow in a shock tube
 Flow in a shock tube April 30, 05 Summary In the lab the shock Mach number as well as the Mach number downstream the moving shock are determined for different pressure ratios between the high and low pressure
Guideline for RMO Key comparison for Air kerma rate in 60 Co gamma radiation
 Guideline for RMO Key comparison for Air kerma rate in 60 Co gamma radiation This intercomparison will be carried out under the lead of KRISS with the cooperation of ARPANSA. This comparison has been approved
Microscopy Cryogenic WORKSTATION. Performance by Design
 CRYO Microscopy Cryogenic WORKSTATION Optical cryostat for use in microscopy and spectroscopy Performance by Design RC102-CFM Microscopy Cryostat offers fast cooldown, high efficiency, excellent temperature
UNIVERSITY OF CAMBRIDGE INTERNATIONAL EXAMINATIONS General Certificate of Education Ordinary Level
 www.xtremepapers.com UNIVERSITY OF CAMBRIDGE INTERNATIONAL EXAMINATIONS General Certificate of Education Ordinary Level *1732862249* PHYSICS 5054/22 Paper 2 Theory October/November 2012 1 hour 45 minutes
Lab 1c Isentropic Blow-down Process and Discharge Coefficient
 058:080 Experimental Engineering Lab 1c Isentropic Blow-down Process and Discharge Coefficient OBJECTIVES - To study the transient discharge of a rigid pressurized tank; To determine the discharge coefficients
The Principles of Vacuum Technology
 The Principles of Vacuum Technology Vacuum Terminology Vacuum units Vacuum regimes How to measure vacuum. Gauge designs. How to create vacuum Pump classifications and designs UHV compatibility considerations
Using PV Diagram Synchronized With the Valve Functioning to Increase the Efficiency on the Reciprocating Hermetic Compressors
 Purdue University Purdue e-pubs International Compressor Engineering Conference School of Mechanical Engineering 21 Using PV Diagram Synchronized With the Valve Functioning to Increase the Efficiency on
WP2 Fire test for toxicity of fire effluents
 Pagina 3 di 89 TRA SFEU VTT 22.6.2009 v.2 WP2 Fire test for toxicity of fire effluents Task 2.1.2 Development of small-scale test method for fire effluents Step 1: Use of modeling Plans according to DoW:
Next Generation Quartz Pressure Gauges
 Next Generation Quartz Pressure Gauges Rick Puccio, Ph.D. Senior Scientist Quartzdyne Houston, TX March 2, 2016 Outline Quartz Pressure Gauge Introduction Gauge Size Reduction Long Term Pressure Drift
ETCHING OF COPPER COATED MYLAR TUBES WITH CF4 GAS. Karl M. Ecklund, Keith W. Hartman, Michael J. Hebert, Stanley G. Wojcicki
 SLAC-PUB-16219 ICFA INSTRUMENTATION B ULLETIN ETCHING OF COPPER COATED MYLAR TUBES WITH CF4 GAS Karl M. Ecklund, Keith W. Hartman, Michael J. Hebert, Stanley G. Wojcicki Department of Physics, Stanford
Gases&Technology. Measurement of Impurities in Helium Using the Dielectric Barrier Discharge Helium Ionization Detector. FEATURE.
 Gases&Technology FEATURE Measurement of Impurities in Helium Using the Dielectric Barrier Discharge Helium Ionization Detector. B Y M A T T H E W M O N A G L E Abstract Bulk gases are often delivered to
Introductory Lab: Vacuum Methods
 Introductory Lab: Vacuum Methods Experiments in Modern Physics (P451) In this lab you will become familiar with the various components of the lab vacuum system. There are many books on this topic one of
Chapter I Standard application in photon dosimetry José Guilherme Pereira Peixoto Maria da Penha Potiens
 Chapter I Standard application in photon dosimetry José Guilherme Pereira Peixoto Maria da Penha Potiens The characteristic ionizing radiation response is defined by the relationship between the stimulus
EXPERIMENTAL RESULTS OF GUIDED WAVE TRAVEL TIME TOMOGRAPHY
 18 th World Conference on Non destructive Testing, 16-20 April 2012, Durban, South Africa EXPERIMENTAL RESULTS OF GUIDED WAVE TRAVEL TIME TOMOGRAPHY Arno VOLKER 1 and Hendrik VOS 1 TNO, Stieltjesweg 1,
FTC130 Transmitter. Operating Manual
 Seite 1 von 11 FTC130 Transmitter Fast Thermal Conductivity Analyzer Operating Manual 1.09KD180724CWI1V05 Messkonzept GmbH Seite 2 von 11 1. Intended Use... 3 2. Description... 4 3. Measuring gases and
Outline Chapter 7 Waves
 Outline Chapter 7 Waves 7-1. Water Waves 7-2. Transverse and Longitudinal Waves 7-3. Describing Waves 7-4. Standing Waves 7-5. Sound 7-6. Doppler Effect 7-7. Musical Sounds 7-8. Electromagnetic Waves 7-9.
Exradin Ion Chambers. What attributes make Exradin the smart choice? EXRADIN Ion Chambers
 EXRADIN Ion Chambers Exradin Ion Chambers Exradin (EXacting RADiation INstrumentation) Ion Chambers have been built for over 33 years, are recognized by top research institutes and standards laboratories,
Vacuum Simulations of the KATRIN Experiment
 Vacuum Simulations of the KATRIN Experiment Marcel Krause (KATRIN collaboration) 31.03.2014 KIT University of the State of Baden-Wuerttemberg and National Research Center of the Helmholtz Association www.kit.edu
The Gas Attenuator of FLASH
 INTRODUCTION The Gas Attenuator of FLASH K. Tiedtke, N. von Bargen, M. Hesse, U. Jastrow, U. Hahn The experimental hall of the FLASH user facility is located approximately 30m behind the last dipole magnet
End of Chapter Exercises
 End of Chapter Exercises Exercises 1 12 are conceptual questions that are designed to see if you have understood the main concepts of the chapter. 1. While on an airplane, you take a drink from your water
Granville-Phillips Series 370 Stabil-Ion Vacuum Gauge Controller
 Granville-Phillips Series 370 Stabil-Ion Vacuum Gauge Controller All-metal, rack-mount controller for Stabil-Ion and Convectron vacuum gauges is noise-immune and CE compliant Accurate vacuum pressure measurement
STS Advanced Oxide Etch DRIE System Trends
 Date: 7/16/07 STS Advanced Oxide Etch DRIE System A- INTRODUCTION The purpose of this document is to help for process development of the AOE DRIE. This document provides general trends but the actual results
Barrier Development and Evaluation Methodology. D.S. Musgrave 1 1 Thermal Visions, Inc., Granville, USA
 Barrier Development and Evaluation Methodology D.S. Musgrave 1 1 Thermal Visions, Inc., Granville, USA 1. Introduction: Vacuum insulation is now a rapidly expanding market and technical advances are being
Performance of a triple-gem detector for high rate charged particle triggering
 Performance of a triple-gem detector for high rate charged particle triggering G. Bencivenni a,p.desimone a,f.murtas a, M. Poli Lener a1, W. Bonivento b, A. Cardini b,c.deplano b,d.pinci b,c, D. Raspino
Resonator alignment of a small argon laser with internal mirrors and a wavelength selection prism
 Resonator alignment of a small argon laser with internal mirrors and a wavelength selection prism Nenad Filipović, M.Sc. EE Document version: 0.3 1. Abstract In the case where resonator mirrors together
Precision level sensing with low-pressure module MS
 The task on hand Level sensing as it is understood in modern process automation is much more than simply "tank half full" or "tank a quarter full". Using suitable sensors, levels, inlets and outlets can
End of Chapter Exercises
 End of Chapter Exercises Exercises 1 12 are conceptual questions that are designed to see if you have understood the main concepts of the chapter. 1. While on an airplane, you take a drink from your water
A Study of Spatial Resolution of GEM TPC with Ar-CF 4 -ic 4 H 10 Gas Mixtures
 A Study of Spatial Resolution of GEM TPC with Ar-CF 4 -ic 4 H 10 Gas Mixtures H.Kuroiwa 1, K.Fujii 1, M.Kobayashi 1, T.Matsuda 1, R.Yonamine 1, A.Aoza 2, T.Higashi 2, A.Ishikawa 2, A.Sugiyama 2, H.Tsuji
SiD VXD Geometry Update Su Dong SLAC
 SiD VXD Geometry Update Su Dong SLAC Aug/16/05 Su Dong SiD Vertexing: Snowmass 05 SiD trk+vtx 1 General Strategy The barrel + endcap layout is aimed a reducing the various effects at shallow entrance angles
L-708 / L-708LD Bore Alignment System
 L-708 / L-708LD Bore Alignment System Aligning Bores is Now Faster and Easier Than Ever Geometric Alignment Laser Systems L-708 / L-708LD Laser Bore Alignment System The Leader in Laser Bore Alignment
Pressure & Vacuum Measurement. Series 370. Solutions. Stabil-Ion Vacuum gauge and Controller
 w w w. m k s i n s t. c o m Pressure & Vacuum Measurement Solutions Series 370 Stabil-Ion Vacuum gauge and Controller Features & Benefits All-metal, rack-mount controller for Stabil-Ion and Convectron
Figure 1 Schematic of opposing air bearing concept
 Theoretical Analysis of Opposing Air Bearing Concept This concept utilizes air bearings to constrain five degrees of freedom of the optic as shown in the figure below. Three pairs of inherently compensated
Table of Contents FIRST 2005 FIRST Robotics Competition Manual: Section 3 The Arena rev B Page 1 of 8
 Table of Contents 3 THE ARENA...2 3.1 OVERVIEW...2 3.1.1 Dimensions and Tolerances...3 3.2 PLAYING FIELD...4 3.2.1 Boundaries and Markings...4 3.2.2 Goals...5 3.2.3 Center Goal...5 3.2.4 Tetra Loading
H 2 O Bubble Chamber Superheated Active Target System. Safety and Systems Overview B. DiGiovine
 H 2 O Bubble Chamber Superheated Active Target System Safety and Systems Overview B. DiGiovine Physics Division and Bubble Chambers April 2009 First Bubble Chamber Received Full Operation Authorization
The HumiPyc - Model 1 - Gas Pycnometer; Density, Moisture, Permeation Analyzer; RH sensor Calibrator
 The HumiPyc - Model 1 - Gas Pycnometer; Density, Moisture, Permeation Analyzer; RH sensor Calibrator Designed, built, and supported by InstruQuest Inc. Temperature controlled, multi-technique volumetric
arxiv: v1 [physics.ins-det] 16 Aug 2014
![arxiv: v1 [physics.ins-det] 16 Aug 2014](/thumbs/90/101993511.jpg "arxiv: v1 [physics.ins-det] 16 Aug 2014") Preprint typeset in JINST style - HYPER VERSION RPC Gap Production and Performance for CMS RE4 Upgrade arxiv:1408.3720v1 [physics.ins-det] 16 Aug 2014 Sung Keun Park, Min Ho Kang and Kyong Sei Lee Korea
Preprint typeset in JINST style - HYPER VERSION RPC Gap Production and Performance for CMS RE4 Upgrade arxiv:1408.3720v1 [physics.ins-det] 16 Aug 2014 Sung Keun Park, Min Ho Kang and Kyong Sei Lee Korea
This test shall be carried out on all vehicles equipped with open type traction batteries.
 5.4. Determination of hydrogen emissions page 1 RESS-6-15 5.4.1. This test shall be carried out on all vehicles equipped with open type traction batteries. 5.4.2. The test shall be conducted following
LOW PRESSURE EFFUSION OF GASES revised by Igor Bolotin 03/05/12
 LOW PRESSURE EFFUSION OF GASES revised by Igor Bolotin 03/05/ This experiment will introduce you to the kinetic properties of low-pressure gases. You will make observations on the rates with which selected
Victoreen B. Operators Manual. Image Intensifier Ion Chamber
 Victoreen 6000-530B Image Intensifier Ion Chamber Operators Manual March 2005 Manual No 6000-530B-1 Rev. 4 2004, 2005 Fluke Corporation, All rights reserved. All product names are trademarks of their respective
Long Win s Educational Facilities for Fluid Mechanics
 Since 1985 F luid mechanics is a science to study how fluids flow and how fluids act on objects. T he wind tunnel is a comprehensive, complete and substantial system for students to study fundamental and
STEAM STERILIZABLE POLAROGRAPHIC OXYGEN ELECTRODE
 STEAM STERILIZABLE POLAROGRAPHIC OXYGEN ELECTRODE GENERAL INFORMATION This family of dissolved oxygen electrodes is of the steam sterilizable polarographic type, designed to be interchangeable with NBS
ARTICLE IN PRESS. Nuclear Instruments and Methods in Physics Research A
 Nuclear Instruments and Methods in Physics Research A 602 (2009) 845 849 Contents lists available at ScienceDirect Nuclear Instruments and Methods in Physics Research A journal homepage: www.elsevier.com/locate/nima
ESAIL D3.1.1 Requirement specifications of the tether test reels
 D3.1.1 Requirement specifications of the tether test reels Work Package: WP 3.1 Version: Version 1.0 Prepared by: DLR German Aerospace Center, Olaf Krömer, Roland Rosta Time: Bremen, May 30 th, 2011 Coordinating
Technical Note. Determining the surface tension of liquids by measurements on pendant drops
 Technical Note Pendant Drop Measurements Technical note: TN316e Industry section: all Author: FT, TW Date: 12/2010 Method: Drop Shape Analyzer DSA100 Keywords: Methods, surface tension, interfacial tension,
Lab # 03: Visualization of Shock Waves by using Schlieren Technique
 AerE545 Lab # 03: Visualization of Shock Waves by using Schlieren Technique Objectives: 1. To get hands-on experiences about Schlieren technique for flow visualization. 2. To learn how to do the optics
Vibrating Wire Load Cell (3, 4, 5 And 6 Gauge Cells) User Manual
 User Manual") Vibrating Wire Load Cell (3, 4, 5 And 6 Gauge Cells) User Manual Man 188 1.1.0 06/08/2014 Chris Rasmussen Philip Day Chris Rasmussen Manual No. Revision Date Originator Checked Authorised for Issue User
Vibrating Wire Load Cell (3, 4, 5 And 6 Gauge Cells) User Manual Man 188 1.1.0 06/08/2014 Chris Rasmussen Philip Day Chris Rasmussen Manual No. Revision Date Originator Checked Authorised for Issue User
LOW PRESSURE EFFUSION OF GASES adapted by Luke Hanley and Mike Trenary
 ADH 1/7/014 LOW PRESSURE EFFUSION OF GASES adapted by Luke Hanley and Mike Trenary This experiment will introduce you to the kinetic properties of low-pressure gases. You will make observations on the
Relative Dosimetry. Photons
 Relative Dosimetry Photons What you need to measure! Required Data (Photon) Central Axis Percent Depth Dose Tissue Maximum Ratio Scatter Maximum Ratio Output Factors S c & S cp! S p Beam profiles Wedge
LaserSnake Underwater Laser Cutting Phase 1 TWI
 LaserSnake2 110128 Underwater Laser Cutting Phase 1 TWI-002 6-13 Contents 1 Introduction 1 2 Objectives 1 3 Underwater Cutting Nozzle Design and Operation 1 3.1 Design 1 3.2 Dry-zone testing 3 4 Equipment
FLUORESCENCE DETERMINATION OF OXYGEN
 FLUORESCENCE DETERMINATION OF OXYGEN Objectives This experiment will familiarize the students with the principles of fluorescence quenching as well as the Ocean Optics FOXY Fiber Optic Sensor System. Spectra
ACCURATE PRESSURE MEASUREMENT FOR STEAM TURBINE PERFORMANCE TESTING
 ACCURATE PRESSURE MEASUREMENT FOR STEAM TURBINE PERFORMANCE TESTING Blair Chalpin Charles A. Matthews Mechanical Design Engineer Product Support Manager Scanivalve Corp Scanivalve Corp Liberty Lake, WA
Precision Rotary Ball Screw
 57E Precision Rotary Ball Screw Models DIR and BLR Outer ring Ball screw nut Deflector Section A Screw shaft Spacer Seal Collar Ball End cap Retainer End cap Ball Screw shaft Outer ring Structure of Standard-Lead
Investigation on Divergent Exit Curvature Effect on Nozzle Pressure Ratio of Supersonic Convergent Divergent Nozzle
 RESEARCH ARTICLE OPEN ACCESS Investigation on Divergent Exit Curvature Effect on Nozzle Pressure Ratio of Supersonic Convergent Divergent Nozzle Shyamshankar.M.B*, Sankar.V** *(Department of Aeronautical
Truck-mounted Mass Flow Metering for LPG Delivery
 Truck-mounted Mass Flow Metering for LPG Delivery Itron, Inc. 1310 Emerald Rd. Greenwood, SC 29646 Introduction The mathematician Gustave De Coriolis first described the Coriolis Effect, which is an inertial
LAMP SUGC/S400-A5
 Features Choice of various viewing angles Available on tape and reel. Reliable and robust Pb free The product itself will remain within RoHS compliant version. Compliance with EU REACH Compliance Halogen
The Experts in Vacuum Solutions
 By Woodrow Farrow - Reprinted with permission from Specialty Gas Report Vacuum: a space that is relatively empty of matter, especially when that void has been created through artificial means. The earth
How to specify a product. Process Sensors and Mechanical Instruments
 How to specify a product Process Sensors and Mechanical Instruments Keep the overview. Here is some guideline information on how to specify our products. Intended as supplementary help to specification
C-Flow Coriolis Mass Flow Meters
 Coriolis Mass Flow Meters Ready for Take Off The New Compact C-Flow Küppers Elektromechanik GmbH The C-Flow The C-Flow Coriolis Mass Meters consist of two components: KCE Transmitter KCM Transducer 2 KEM
THE development of more advanced techniques in radiotherapy,
 1 A Geant4-based simulation of an accelerator s head used for Intensity Modulated Radiation Therapy F. Foppiano, B. Mascialino, M.G. Pia, M. Piergentili. Abstract We present a Geant4-based simulation,
PFH. Application example. Pneumatic 2-Finger Parallel Gripper Long-stroke Gripper. Weight 2.65 kg 12.6 kg. Gripping force 630 N 2950 N
 PFH www.comoso.com Sizes 30 50 Weight 2.65 kg 12.6 kg Gripping force 630 N 2950 N Stroke per finger 30 mm 100 mm Workpiece weight 3.15 kg 13 kg Application example Assembly unit for intermediate sleeves
A Longterm Aging Study of the Honeycomb Drift Tubes of HERA-B Using a Circulated and Purified CF -Gas Mixture
 A Longterm Aging Study of the Honeycomb Drift Tubes of HERA-B Using a Circulated and Purified CF -Gas Mixture 4 M. Capeáns, K. Dehmelt, M. Hohlmann, B. Schmidt a c b b c a CERN (Geneva) b DESY (Hamburg)
WMO LABORATORY INTERCOMPARISON OF RAIN INTENSITY GAUGES
 WMO LABORATORY INTERCOMPARISON OF RAIN INTENSITY GAUGES Christophe ALEXANDROPOULOS and Muriel LACOMBE Météo-France, Direction des Systèmes d Observation, BP 202-78195 Trappes France christophe.alexandropoulos@meteo.fr
sorting solutions osx separator series
 osx separator series Comex offers a newly developed complex optical sorting system, in a user friendly platform, for the identification and separation of particles and materials, based on their many physical
OPENINGS AND REINFORCEMENTS 26
 ASME BPVC.VIII.1-2015 UG-35.2 UG-36 (4) It is recognized that it is impractical to write requirements to cover the multiplicity of devices used for quick access, or to prevent negligent operation or the
T EK-COR 1100A. Coriolis Mass Flowmeter. FLOW. Technology Solutions
 Technology Solutions T EK-COR 1100A Coriolis Mass Flowmeter FLOW www.tek-trol.com Flow Level Temperature Pressure Valves Analyzers Accessories TekValSys Introduction There can often be more than one type
Teacher s Assistant Laboratory Guide
 Teacher s Assistant Laboratory Guide Joseph B. Hakanson 1, Warner Meeks 2, and Dr. Joshua L. Rovey 3 Missouri University of Science and Technology, Rolla, Missouri, 65409 These instructions will discuss
Model Description
 LEAKHUNTER Plus LEAKHUNTER Plus Model 8066 Description The MATHESON LEAKHUNTER Plus is a truly universal leak detector. Extensive R&D has produced a multi-functional leak detector engineered to perform
1224SUBC/C470/S400-A4
 Features Choice of various viewing angles Available on tape and reel. Reliable and robust The product itself will remain within RoHS compliant version. Compliance with EU REACH Compliance Halogen Free.(Br
EALP05RDBRA0 LAMP. Features. Description. Applications. Choice of various viewing angles. Available on tape and reel. Reliable and robust
 Features Choice of various viewing angles Available on tape and reel. Reliable and robust The product itself will remain within RoHS compliant version. Compliance with EU REACH Compliance Halogen free.