An Introduction to Statistical Process Control Charts (SPC) Steve Harrison
|
|
|
- Randolf Victor Nicholson
- 5 years ago
- Views:
Transcription

1

 Steve")
2 An Introduction to Statistical Process Control Charts (SPC) Steve Harrison
3 Topics Variation A Quick Recap An introduction to SPC Charts Interpretation Quiz Application in Improvement work
4 Variation
5 Common Cause Variation Typically due to a large number of small sources of variation Example: Variation in work commute due to traffic lights, pedestrian traffic, parking issues Usually requires a deep understanding of the process to minimise the variation Multiple factors 5
6 Special Cause Variation Are not part of the normal process. Arises from special circumstances Example: Variation in work commute impacted by flat tyre, road closure, ice and snow. Usually best uncovered when monitoring data in real time (or close to that) Assignable cause 6
7 Special Cause - My trip to work 120 Min Upper process limit Mean Lower process limit Consecutive trips
8 Two Types of Variation Common Cause: chance cause noise Special Cause: assignable cause signal Statistically significant (not good or bad) 8
9 9 SPC Charts
10 SPC, Statistical Process Control or The Control Chart Elements 1. Chart/graph showing data, running record, time order sequence 2. A line showing the mean 3. 2 lines showing the upper and lower process control limits Its best if you have 25 data points to set up a control chart, but 50 are better if available. Be careful of too many points
11 The Anatomy of an SPC or Control Chart F M A M J J A S O N D J F M A M J J A S O N D Upper process control limit Mean Lower process control limit
12 Measures of Central Tendency Mean = Average SPC Chart Median = Central or Middle Value Run Chart Mode = Most frequently occurring value 12
13 Standard Deviation or σ In statistics, standard deviation shows how much variation exists from the mean. A low standard deviation indicates that the data points tend to be very close to the mean; high standard deviation indicates that the data points are spread out over a large range of values.

14 Standard Deviation and a normal distribution
15 PRACTICAL INTERPRETATION OF THE STANDARD DEVIATION 99.7% will be within 3 s Mean - 3s Mean Mean + 3s
16 3s AND THE CONTROL CHART 3s 3s UCL Mean LCL 6s
17 4-Apr 6-Apr 8-Apr 12-Apr 14-Apr 18-Apr 20-Apr 22-Apr 3-May 5-May 9-May 11-May 13-May 15-May % Daily TTOs Completed by Noon Run Charts vs. SPC Charts Run Chart Simple Easy to create in Excel or on paper Less Sensitive Only need data points Ward x % of total TTOs completed by 12 noon 80 April 4 - May 15, 2012 SPC More Powerful Control lines show the degree of variation Need software Better with 25+ data points
18 Special cause variation F M A M J J A S O N D J F M A M J J A S O N D
 MEAN")
19 SPECIAL CAUSES - RULE 1 UCL Point above Upper Control Limit (UCL) MEAN LCL
20 SPECIAL CAUSES - RULE 1 UCL MEAN LCL Or point below Lower Control Limit (LCL)

21 SPECIAL CAUSES - RULE 2 UCL MEAN LCL Eight points above centre line

22 SPECIAL CAUSES - RULE 2 UCL Or eight points below centre line MEAN LCL

23 SPECIAL CAUSES - RULE 3 UCL Six points in a downward direction MEAN LCL

24 SPECIAL CAUSES - RULE 3 UCL Or six points in an upward direction MEAN LCL
25 Quiz Does the chart show A. Special Cause Variation? B. Common Cause Variation? C. Both of the above D. No Variation 67% 33% 0% 0% Special Cause Variation? Common Cause Variation? Both of the above No Variation

26 How many special cause signals are present on this chart? A. 0 B. 1 C. 2 D. 3 E % 67% 0% 0% 0%

27 How many special cause signals are present on this chart? A. 0 B. 1 C. 2 D. 3 E % 0% 0% 0% 0%

28 How many special cause signals are present on this chart? A. 0 B. 1 C. 2 D. 3 E % 0% 0% 0% 0%
29 What use is this? Evaluate and improve underlying process Is the process stable? Use data to make predictions and help planning Recognise variation Prove/disprove assumptions and (mis)conceptions Help drive improvement identify statistically significant change
30 Example
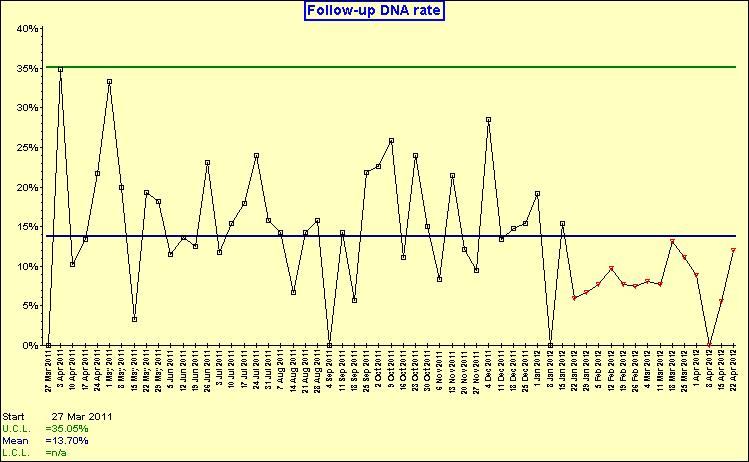
31 Annotated SPC Charts One of the most powerful tools for improvement Describe a process captured over time (as opposed to being a single sample) Reveal any trends a process might be experiencing When combined with careful annotation they track the impact of change

32 Annotated SPC Charts

33 Application Responding to Variation 33
34 Process with special cause variation Identify the cause: if positive then can it be replicated or standardized. If negative then cause needs to be eliminated Process with common cause variation Reduce variation: make the process even more reliable Not satisfied with result: redesign process to get a better result 34
35 PRACTICAL

36 Length Of Stay for Bowel Surgery Patients

37 Quality Composite Ratio

38 Outpatient attendances (Part 1)

39 Outpatient attendances (Part 2)
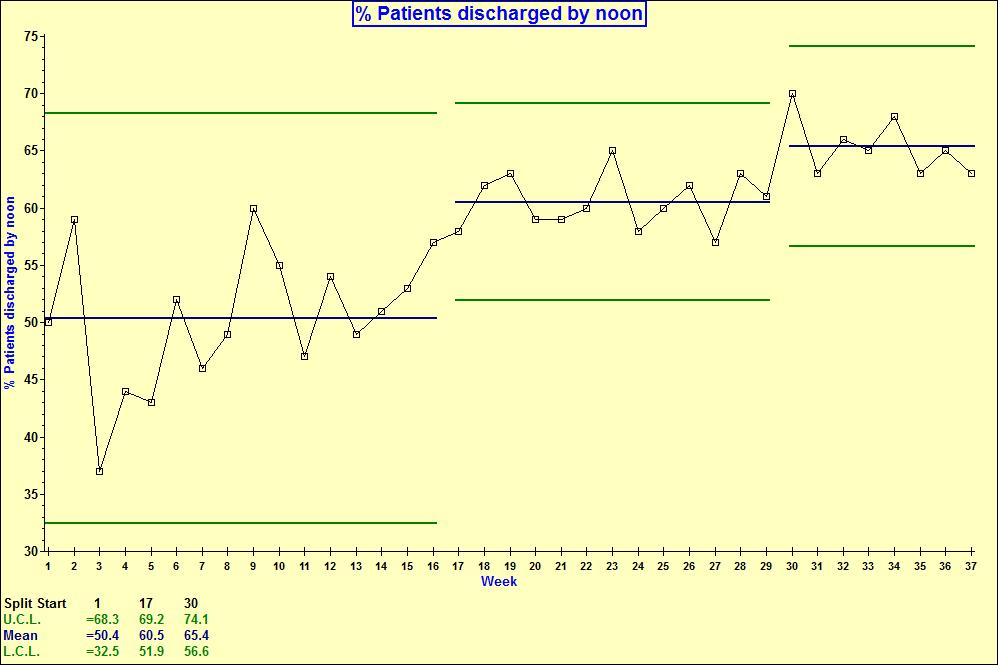
40 % discharged by noon
41 THANKS!
42
To help us make good management decisions in the way we react to that variation. To understand the variation that lives within our data
 Wednesday 15 July 2015 Why do we analyse and present data? To understand the variation that lives within our data To help us make good management decisions in the way we react to that variation Source:
Chapter 5: Methods and Philosophy of Statistical Process Control
 Chapter 5: Methods and Philosophy of Statistical Process Control Learning Outcomes After careful study of this chapter You should be able to: Understand chance and assignable causes of variation, Explain
Statistical Process Control Basics. LeanSix LLC
 Statistical Process Control Basics Statistical Process Control (SPC) is an industry standard methodology for measuring and controlling quality during the manufacturing process. Attribute data (measurements)
Some information on Statistical Process Control (SPC) c charts that may be useful for clinical teams
 c charts that may be useful for clinical teams") Some information on Statistical Process Control (SPC) c charts that may be useful for clinical teams Evonne Curran Nurse Consultant Infection Control Health Protection Scotland July 9 All the SPC charts
Some information on Statistical Process Control (SPC) c charts that may be useful for clinical teams Evonne Curran Nurse Consultant Infection Control Health Protection Scotland July 9 All the SPC charts
5.1 Introduction. Learning Objectives
 Learning Objectives 5.1 Introduction Statistical Process Control (SPC): SPC is a powerful collection of problem-solving tools useful in achieving process stability and improving capability through the
The use of Control Charts with Composite materials. E. Clarkson, Statistician ASQ Certified Quality Engineer
 The use of Control Charts with Composite materials E. Clarkson, Statistician ASQ Certified Quality Engineer Control Charts Everything varies at least a little bit. How can you tell when a process is just
Exploring Measures of Central Tendency (mean, median and mode) Exploring range as a measure of dispersion
 Exploring range as a measure of dispersion") Unit 5 Statistical Reasoning 1 5.1 Exploring Data Goals: Exploring Measures of Central Tendency (mean, median and mode) Exploring range as a measure of dispersion Data: A set of values. A set of data can
Unit 5 Statistical Reasoning 1 5.1 Exploring Data Goals: Exploring Measures of Central Tendency (mean, median and mode) Exploring range as a measure of dispersion Data: A set of values. A set of data can
3Q17 Core Measures and 1Q18 MBQIP Data
 3Q17 Core Measures and 1Q18 MBQIP Data May 18, 2018 Joshua Salander, MBA, PMP Consultant Reports delivery Updated 3Q17 reports were sent via email on May 15, 2018 Quarterly Reports Quarterly Trend Charts
Analysis of Highland Lakes Inflows Using Process Behavior Charts Dr. William McNeese, Ph.D. Revised: Sept. 4,
 Analysis of Highland Lakes Inflows Using Process Behavior Charts Dr. William McNeese, Ph.D. Revised: Sept. 4, 2018 www.spcforexcel.com Author s Note: This document has been revised to include the latest
STANDARD SCORES AND THE NORMAL DISTRIBUTION
 STANDARD SCORES AND THE NORMAL DISTRIBUTION REVIEW 1.MEASURES OF CENTRAL TENDENCY A.MEAN B.MEDIAN C.MODE 2.MEASURES OF DISPERSIONS OR VARIABILITY A.RANGE B.DEVIATION FROM THE MEAN C.VARIANCE D.STANDARD
living with the lab control of salinity 2012 David Hall
 control of salinity 2012 David Hall General Idea The objective is to keep the salinity close to a setpoint which will be provided by your instructor The salinity sensor measures the analog voltage output
Psychology - Mr. Callaway/Mundy s Mill HS Unit Research Methods - Statistics
 Psychology - Mr. Callaway/Mundy s Mill HS Unit 2.3 - Research Methods - Statistics How do psychologists ask & answer questions? Last time we asked that we were discussing Research Methods. This time we
An Analysis of Reducing Pedestrian-Walking-Speed Impacts on Intersection Traffic MOEs
 An Analysis of Reducing Pedestrian-Walking-Speed Impacts on Intersection Traffic MOEs A Thesis Proposal By XIAOHAN LI Submitted to the Office of Graduate Studies of Texas A&M University In partial fulfillment
Congestion Reduction in Europe: Advancing Transport Efficiency. MG Tackling urban road congestion D3.4
 Congestion Reduction in Europe: Advancing Transport Efficiency MG-5.3-2014 Tackling urban road congestion D3.4 Patterns of congestion in European cities Multiple-indicator analysis using real-time GPS
control of salinity Thanks to David Hall, from LWTL
 control of salinity Thanks to David Hall, from LWTL DI water (0.0% NaCl) salt water (1.0% NaCl) General Idea The objective is to keep the salinity close to a setpoint which will be provided by your instructor
Gait Analyser. Description of Walking Performance
 Gait Analyser Description of Walking Performance This brochure will help you to understand clearly the parameters described in the report of the Gait Analyser, provide you with tips to implement the walking
! Problem Solving Students will use past Olympic statistics and mathematics to predict the most recent Olympic statistics.
 Title: Running Into Statistics Brief Overview: Since the 1996 Olympics took place close to home, they were a major topic of discussion all over the region. Students have traditionally been interested in
Quality Assurance Charting for QC Data
 Quality Assurance Charting for QC Data September 2018 Iowa s Environmental & Public Health Laboratory Copyright the State Hygienic Laboratory at the University of Iowa 2017. All rights reserved. Images
Life Transitions and Travel Behaviour Study. Job changes and home moves disrupt established commuting patterns
 Life Transitions and Travel Behaviour Study Evidence Summary 2 Drivers of change to commuting mode Job changes and home moves disrupt established commuting patterns This leaflet summarises new analysis
Legendre et al Appendices and Supplements, p. 1
 Legendre et al. 2010 Appendices and Supplements, p. 1 Appendices and Supplement to: Legendre, P., M. De Cáceres, and D. Borcard. 2010. Community surveys through space and time: testing the space-time interaction
save percentages? (Name) (University)
 (University)") 1 IB Maths Essay: What is the correlation between the height of football players and their save percentages? (Name) (University) Table of Contents Raw Data for Analysis...3 Table 1: Raw Data...3 Rationale
1 IB Maths Essay: What is the correlation between the height of football players and their save percentages? (Name) (University) Table of Contents Raw Data for Analysis...3 Table 1: Raw Data...3 Rationale
Unit 3 ~ Data about us
 Unit 3 ~ Data about us Investigation 3: Data Sets & Displays I can construct, interpret, and compare data sets and displays. I can find, interpret, and compare measures of center and variation for data
Congestion Evaluation Best Practices
 Congestion Evaluation Best Practices Todd Litman Victoria Transport Policy Institute Presented International Transportation and Economic Development Conference 10 April 2014 Congestion Indicators Indicator
In the actual exam, you will be given more space to work each problem, so work these problems on separate sheets.
 K300 Practice Exam 1 Note: This gives you an idea of the types of questions I ask. The length of the exam may differ. The questions are meant to be representative but not all-inclused (i.e. this is a sample
Queue analysis for the toll station of the Öresund fixed link. Pontus Matstoms *
 Queue analysis for the toll station of the Öresund fixed link Pontus Matstoms * Abstract A new simulation model for queue and capacity analysis of a toll station is presented. The model and its software
Dark ages to renaissance rebirth of stroke care in Wales
 Presenters: Michelle Graham & Mike Davidge 18 April 2012 rebirth of stroke care in Wales Insert name of presentation on Master Slide Acute Stroke care in Wales: 6,300 admissions in 2010/11 Age standardised
Update June 2018 OUR 2017 PUBLIC ENGAGEMENT
 Update June 2018 Hi, Let s Get Wellington Moving (LGWM) is developing a Recommended Programme of Investment (RPI) that meets our programme objectives and supports the city s and region s growth. As part
Analysis of Variance. Copyright 2014 Pearson Education, Inc.
 Analysis of Variance 12-1 Learning Outcomes Outcome 1. Understand the basic logic of analysis of variance. Outcome 2. Perform a hypothesis test for a single-factor design using analysis of variance manually
Key statistics from the National Cardiac Arrest Audit 2016/17
 Key statistics from the National Cardiac Arrest Audit 216/17 Supported by Resuscitation Council (UK) and Intensive Care National Audit & Research Centre (ICNARC) Data collection scope (NCAA Version 1.3)
Interim Transit Ridership Forecast Results Technical Memorandum
 Interim Transit Ridership 401 South Jackson Street Seattle, WA 98104-2826 September 2012 Table of Contents 1 INTRODUCTION... 1-1 1.1 Project Background... 1-1 2 RIDERSHIP FORECASTS... 2-1 2.1 System Ridership
LEE COUNTY WOMEN S TENNIS LEAGUE
 In order for the Lee County Women s Tennis League to successfully promote and equitably manage 2,500+ members and give all players an opportunity to play competitive tennis, it is essential to implement
NCAA March Madness Statistics 2018
 NCAA March Madness Statistics 2018 NAME HOUR 111-120 101-110 91-100 81-90 71-80 61-70 51-60 41-50 31-40 21-30 11-20 1-10 March Madness Activity 1 Directions: Choose a college basketball team in the March
$ 12" $#&%$ 86.) *1! *1 /3 )00, , (1* Neighborhood Traffic Calming Part 3 Solutions Bradley William Yarger, P.E.
 *1! *1 /3 )00, , (1* Neighborhood Traffic Calming Part 3 Solutions Bradley William Yarger, P.E.") $ 12" $#&%$ 86.)3+5+2 714 *1! *1 /3 )00,12 3.+ -0127 1, (1* Neighborhood Traffic Calming Part 3 Solutions by Bradley William Yarger, P.E. It is extremely tempting to jump to this step of the process thinking
$ 12" $#&%$ 86.)3+5+2 714 *1! *1 /3 )00,12 3.+ -0127 1, (1* Neighborhood Traffic Calming Part 3 Solutions by Bradley William Yarger, P.E. It is extremely tempting to jump to this step of the process thinking
HIGHWAY CAPACITY MANUAL 2010: NEW SIGNALIZED INTERSECTION METHODOLOGY. James A. Bonneson, Ph.D., P.E.
 HIGHWAY CAPACITY MANUAL 2010: NEW SIGNALIZED INTERSECTION METHODOLOGY James A. Bonneson, Ph.D., P.E. Texas Transportation ti Institute t Housekeeping 2 All participant phone lines are muted to avoid distractions
living with the lab control of salinity 2012 David Hall
 control of salinity 2012 David Hall General Idea The objective is to keep the salinity close to a setpoint which will provided by your instructor The salinity sensor measures the analog voltage output
METHODOLOGY. Signalized Intersection Average Control Delay (sec/veh)
") Chapter 5 Traffic Analysis 5.1 SUMMARY US /West 6 th Street assumes a unique role in the Lawrence Douglas County transportation system. This principal arterial street currently conveys commuter traffic
Chapter 5 Traffic Analysis 5.1 SUMMARY US /West 6 th Street assumes a unique role in the Lawrence Douglas County transportation system. This principal arterial street currently conveys commuter traffic
A N E X P L O R AT I O N W I T H N E W Y O R K C I T Y TA X I D ATA S E T
 A N E X P L O R AT I O N W I T H N E W Y O R K C I T Y TA X I D ATA S E T GAO, Zheng 26 May 2016 Abstract The data analysis is two-part: an exploratory data analysis, and an attempt to answer an inferential
U.S. Bicycling Participation Study
 U.S. Bicycling Participation Study Report of findings from the 2016 survey Conducted by Corona Insights Commissioned by PeopleForBikes Released July 2017 Table of Contents Background and Objectives 3 Research
Chapter 12 Practice Test
 Chapter 12 Practice Test 1. Which of the following is not one of the conditions that must be satisfied in order to perform inference about the slope of a least-squares regression line? (a) For each value
Measuring the Distribution and Costs of Congestion. Tim Lomax Texas Transportation Institute
 Measuring the Distribution and Costs of Congestion Tim Lomax Texas Transportation Institute http://mobility.tamu.edu The Congestion Measurement Story Travel time, variations, compare to goals WHAT? WHY?
Value of time, safety and environment in passenger transport Time
 TØI report 1053B/2010 Author(s): Farideh Ramjerdi, Stefan Flügel, Hanne Samstad and Marit Killi Oslo 2010, 324 pages Norwegian language Summary: Value of time, safety and environment in passenger transport
By-Law 16 ATHLETE RANKINGS
 By-Law 16 ATHLETE RANKINGS Version: as ratified on 2 February 2017 Table of Contents Name 3 Source 3 Intent 3 Scope 3 System of ranking 3 Publication of ranking points 3 Ranking points 4 Ranking and standard
Effects of Traffic Signal Retiming on Safety. Peter J. Yauch, P.E., PTOE Program Manager, TSM&O Albeck Gerken, Inc.
 Effects of Traffic Signal Retiming on Safety Peter J. Yauch, P.E., PTOE Program Manager, TSM&O Albeck Gerken, Inc. Introduction It has long been recognized that traffic signal timing can have an impact
Understanding Winter Road Conditions in Yellowstone National Park Using Cumulative Sum Control Charts
 1 Understanding Winter Road Conditions in Yellowstone National Park Using Cumulative Sum Control Charts Amber Nuxoll April 1st, 2014 Contents 1 Introduction 2 2 Data Collection and Background 2 3 Exploratory
HIGHWAY CAPACITY MANUAL
 HISTORY OF THE HIGHWAY CAPACITY MANUAL TexITE - Houston Chapter November 10, 2010 Michael Y. Ereti City of Houston Department of Public Works & Engineering THE NEW GUY (Michael Ereti) Consultant (10 years)
CAPACITY ESTIMATION OF URBAN ROAD IN BAGHDAD CITY: A CASE STUDY OF PALESTINE ARTERIAL ROAD
 VOL. 13, NO. 21, NOVEMBER 218 ISSN 1819-668 26-218 Asian Research Publishing Network (ARPN). All rights reserved. CAPACITY ESTIMATION OF URBAN ROAD IN BAGHDAD CITY: A CASE STUDY OF PALESTINE ARTERIAL ROAD
How Fast Can You Throw?
 Name Date Period How Fast Can You Throw? Directions: Find a spot 40 feet from a wall and mark it with a piece of chalk. From that point, you will throw the ball 5 times with your right hand, and then five
Data: Central Tendency, Box & Whisker Plot Long-Term Memory Review Review 1
 Review 1 2. The mean, median and mode define the measures of tendencies. Tina kept a record of her points from playing basketball for the last two weeks. Points Scored for each Game GAME 1 2 3 POINTS 13
Users Group Conference 2018
 Users Group Conference 2018 Compressor Analysis Special Circumstances Tracy Wimberly Sr. Reciprocating Equipment Analyst, Windrock 1 Topics, top compressor questions Ultrasound Baseline Cat Eyes Leak Index
Tulsa Metropolitan Area LONG RANGE TRANSPORTATION PLAN
 Tulsa Metropolitan Area LONG RANGE TRANSPORTATION PLAN Indian Nations Council of Governments August 2005 CONTACTING INCOG In developing the Destination 2030 Long Range Transportation Plan, INCOG s Transportation
Neighborhood Influences on Use of Urban Trails
 Neighborhood Influences on Use of Urban Trails Greg Lindsey, Yuling Han, Jeff Wilson Center for Urban Policy and the Environment Indiana University Purdue University Indianapolis Objectives Present new
Allocations vs Announcements
 Allocations vs Announcements A comparison of RIR IPv4 Allocation Records with Global Routing Announcements Geoff Huston May 2004 (Activity supported by APNIC) BGP Prefix Length Filters Some years back
Internet Technology Fundamentals. To use a passing score at the percentiles listed below:
 Internet Technology Fundamentals To use a passing score at the percentiles listed below: PASS candidates with this score or HIGHER: 2.90 High Scores Medium Scores Low Scores Percentile Rank Proficiency
Looking at Spacings to Assess Streakiness
 Looking at Spacings to Assess Streakiness Jim Albert Department of Mathematics and Statistics Bowling Green State University September 2013 September 2013 1 / 43 The Problem Collect hitting data for all
Preliminary analysis of yellowfin tuna catch, effort, size and tagging data using an integrated age-structured model
 Preliminary analysis of yellowfin tuna catch, effort, size and tagging data using an integrated age-structured model Introduction John Hampton Secretariat of the Pacific Community Noumea, New Caledonia
Warm-up. Make a bar graph to display these data. What additional information do you need to make a pie chart?
 Warm-up The number of deaths among persons aged 15 to 24 years in the United States in 1997 due to the seven leading causes of death for this age group were accidents, 12,958; homicide, 5,793; suicide,
Liverpool Lime Street station engineering work. Knowledge and support for October 2017 improvement work November 2017
 Liverpool Lime Street station engineering work Knowledge and support for October 2017 improvement work November 2017 Overview before the engineering work starts On 30 September work began at Liverpool
Highway & Transportation (I) ECIV 4333 Chapter (4): Traffic Engineering Studies. Spot Speed
 ECIV 4333 Chapter (4): Traffic Engineering Studies. Spot Speed") Introduction Spot Speed Speed is an important measure of the quality of travel and safety of road network. Speed by definition is the rate of movement of vehicle in distance per unit time. A typical unit
Introduction Spot Speed Speed is an important measure of the quality of travel and safety of road network. Speed by definition is the rate of movement of vehicle in distance per unit time. A typical unit
Safety Manual VEGAVIB series 60
 Safety Manual VEGAVIB series 60 NAMUR Document ID: 32005 Contents Contents 1 Functional safety... 3 1.1 General information... 3 1.2 Planning... 4 1.3 Adjustment instructions... 6 1.4 Setup... 6 1.5 Reaction
Appendix E: Bike Crash Analysis ( )
") Appendix E: Bike Crash Analysis (2009-2012) Davis Bicycle Crashes Analysis 2009-2012 December 2013 Ride Walk Davis Active Transportation Program City of Davis December 2013 Prepared by: Jimmy Fong Active
Appendix E: Bike Crash Analysis (2009-2012) Davis Bicycle Crashes Analysis 2009-2012 December 2013 Ride Walk Davis Active Transportation Program City of Davis December 2013 Prepared by: Jimmy Fong Active
2010 TRAVEL TIME REPORT
 CASUALTY ACTUARIAL SOCIETY EDUCATION POLICY COMMITTEE 2010 TRAVEL TIME REPORT BIENNIAL REPORT TO THE BOARD OF DIRECTORS ON TRAVEL TIME STATISTICS FOR CANDIDATES OF THE CASUALTY ACTUARIAL SOCIETY June 2011
Introduction to Highway Safety Course
 Introduction to Highway Safety Course Introduction to Crash Analysis Prepared by Robert K. Seyfried, PE, PTOE Northwestern University Center for Public Safety Introduction to Highway Safety Series Course
Assessing the Traffic and Energy Impacts of Connected and Automated Vehicles (CAVs)
") Assessing the Traffic and Energy Impacts of Connected and Automated Vehicles (CAVs) Steven E. Shladover, Sc.D. (Retired from) California PATH Program University of California, Berkeley SIP-adus Workshop
Assessing the Traffic and Energy Impacts of Connected and Automated Vehicles (CAVs) Steven E. Shladover, Sc.D. (Retired from) California PATH Program University of California, Berkeley SIP-adus Workshop
Running head: DATA ANALYSIS AND INTERPRETATION 1
 Running head: DATA ANALYSIS AND INTERPRETATION 1 Data Analysis and Interpretation Final Project Vernon Tilly Jr. University of Central Oklahoma DATA ANALYSIS AND INTERPRETATION 2 Owners of the various
Monitoring the length structure of commercial landings of albacore tuna during the fishing year
 SCTB15 Working Paper ALB-5 Monitoring the length structure of commercial landings of albacore tuna during the 2001 2002 fishing year Linda Griggs National Institute of Water and Atmospheric Research Ltd.
Bay Area Council 2016 Report of Survey Results Regarding Transportation
 Bay Area Council Report of Survey Results Regarding Transportation Methodology Web survey of San Francisco Bay Area residents The survey was available in English, Chinese, and Spanish Report includes analysis
A Combined Recruitment Index for Demersal Juvenile Cod in NAFO Divisions 3K and 3L
 NAFO Sci. Coun. Studies, 29: 23 29 A Combined Recruitment Index for Demersal Juvenile Cod in NAFO Divisions 3K and 3L David C. Schneider Ocean Sciences Centre, Memorial University St. John's, Newfoundland,
Section I: Multiple Choice Select the best answer for each problem.
 Inference for Linear Regression Review Section I: Multiple Choice Select the best answer for each problem. 1. Which of the following is NOT one of the conditions that must be satisfied in order to perform
Evaluating NBA Shooting Ability using Shot Location
 Evaluating NBA Shooting Ability using Shot Location Dennis Lock December 16, 2013 There are many statistics that evaluate the performance of NBA players, including some that attempt to measure a players
Fundamentals of Machine Learning for Predictive Data Analytics
 Fundamentals of Machine Learning for Predictive Data Analytics Appendix A Descriptive Statistics and Data Visualization for Machine learning John Kelleher and Brian Mac Namee and Aoife D Arcy john.d.kelleher@dit.ie
Chapter 5 5. INTERSECTIONS 5.1. INTRODUCTION
 Chapter 5 5. INTERSECTIONS 5.1. INTRODUCTION Intersections are the physical component of the roadways where two highways intersect. They are the most complex element of roadways, since it requires more
Chapter 8 Team Competition
 hapter 8 Team ompetition 1. General. This chapter covers special considerations applicable to the conduct of team tournaments and to team competition as a part of a tournament including other events. 2.
ABSTRACT AUTHOR. Kinematic Analysis of the Women's 400m Hurdles. by Kenny Guex. he women's 400m hurdles is a relatively
 Study Kinematic Analysis of the Women's 400m Hurdles by IAAF 27:1/2; 41-51, 2012 by Kenny Guex ABSTRACT The women's 400m hurdles is a relatively new discipline and a complex event that cannot be approached
CHAPTER 28 DEPENDENT FAILURE ANALYSIS CONTENTS
 Applied R&M Manual for Defence Systems Part C - Techniques CHAPTER 28 DEPENDENT FAILURE ANALYSIS CONTENTS Page 1 Introduction 2 2 Causes of Dependent Failures 3 3 Solutions 4 Issue 1 Page 1 Chapter 28
Journal of Chemical and Pharmaceutical Research, 2014, 6(3): Research Article
: Research Article") Available online www.jocpr.com Journal of Chemical and Pharmaceutical Research 2014 6(3):304-309 Research Article ISSN : 0975-7384 CODEN(USA) : JCPRC5 World men sprint event development status research
Available online www.jocpr.com Journal of Chemical and Pharmaceutical Research 2014 6(3):304-309 Research Article ISSN : 0975-7384 CODEN(USA) : JCPRC5 World men sprint event development status research
Factors that affect the motion of a vehicle along a surface
 SPECIMEN GENERAL CERTIFICATE OF SECONDARY EDUCATION TWENTY FIRST CENTURY SCIENCE ADDITIONAL SCIENCE A Unit A154: (controlled assessment) PHYSICS A Unit A184 (controlled assessment) A154 A184 Factors that
4 DISRUPTION MANAGEMENT PLAN HIGHWAY 7 RAPIDWAY CONSTRUCTION BETWEEN BAYVIEW AVENUE AND WARDEN AVENUE TOWNS OF MARKHAM AND RICHMOND HILL
 4 DISRUPTION MANAGEMENT PLAN HIGHWAY 7 RAPIDWAY CONSTRUCTION BETWEEN BAYVIEW AVENUE AND WARDEN AVENUE TOWNS OF MARKHAM AND RICHMOND HILL The Transportation Services Committee recommends the adoption of
LaDawn Bisson Measures of Central Tendency
 LaDawn Bisson 2014 Measures of Central Tendency LaDawn Bisson 2014 Measures of central tendency: a measure used to describe data; the mean, median, and mode are measures of central tendency Mean: the sum
Monitoring Rusty Crayfish in Southern Ontario Streams and Rivers
 Monitoring Rusty Crayfish in Southern Ontario Streams and Rivers Scott Reid, Tom Brooke, Jane Devlin, Joe Nocera Applied Research and Development Branch Background rusty crayfish first reported in 1960s:
Philadelphia Bus Network Choices Report
 Philadelphia Bus Network Choices Report JUNE 2018 SEPTA Table of Contents Executive Summary...7 What if transit gave us more freedom?... 8 What is this report?... 8 The main conclusions... 9 What is happening
UNIT V 1. What are the traffic management measures? [N/D-13] 2. What is Transportation System Management (TSM)? [N/D-14]
![UNIT V 1. What are the traffic management measures? [N/D-13] 2. What is Transportation System Management (TSM)? [N/D-14]](/thumbs/87/95571671.jpg "UNIT V 1. What are the traffic management measures? [N/D-13] 2. What is Transportation System Management (TSM)? [N/D-14]") UNIT V 1. What are the traffic management measures? [N/D-13] Some of the well-known traffic management measures are: a) Restrictions on turning movements b) One - way streets c) Tidal - flow operations
UNIT V 1. What are the traffic management measures? [N/D-13] Some of the well-known traffic management measures are: a) Restrictions on turning movements b) One - way streets c) Tidal - flow operations
Hitting with Runners in Scoring Position
 Hitting with Runners in Scoring Position Jim Albert Department of Mathematics and Statistics Bowling Green State University November 25, 2001 Abstract Sportscasters typically tell us about the batting
COMPARISON OF DIFFERENTIAL PRESSURE SENSING TECHNOLOGIES IN HOSPITAL ISOLATION ROOMS AND OTHER CRITICAL ENVIRONMENT APPLICATIONS
 COMPARISON OF DIFFERENTIAL PRESSURE SENSING TECHNOLOGIES IN HOSPITAL ISOLATION ROOMS AND OTHER CRITICAL ENVIRONMENT APPLICATIONS APPLICATION NOTE LC-136 Introduction Specialized spaces often times must
Title: Investigating variations (differences) in the urban quality of life, in Boscombe, Dorset.
 in the urban quality of life, in Boscombe, Dorset.") Human Fieldwork Enquiry: Title: Investigating variations (differences) in the urban quality of life, in Boscombe, Dorset. AIM: To investigate the variations in quality of life in the urban area of Boscombe.
Human Fieldwork Enquiry: Title: Investigating variations (differences) in the urban quality of life, in Boscombe, Dorset. AIM: To investigate the variations in quality of life in the urban area of Boscombe.
AP-R361/10 AUSTROADS RESEARCH REPORT. The Road Safety Consequences of Changing Travel Modes
 AP-R361/10 AUSTROADS RESEARCH REPORT The Road Safety Consequences of Changing Travel Modes The Road Safety Consequences of Changing Travel Modes Published July 2010 Austroads Ltd. 2010 This work is copyright.
PURE SUBSTANCE. Nitrogen and gaseous air are pure substances.
 CLASS Third Units PURE SUBSTANCE Pure substance: A substance that has a fixed chemical composition throughout. Air is a mixture of several gases, but it is considered to be a pure substance. Nitrogen and
Transit Ridership - Why the Decline and How to Increase. Hosted by the. Virginia Transit Association
 Transit Ridership - Why the Decline and How to Increase Hosted by the Virginia Transit Association Virginia Transit Association 1108 East Main Street, Suite 1108 Richmond, VA 23219 804.643.1166 www.vatransit.com
EX0-008 exin. Number: EX0-008 Passing Score: 800 Time Limit: 120 min.
 EX0-008 exin Number: EX0-008 Passing Score: 800 Time Limit: 120 min Exam A QUESTION 1 Which statement describes Release Planning? A. After looking at all the stories in the backlog, the team estimates
Investigating Commute Mode and Route Choice Variability in Jakarta using multi-day GPS Data
 Investigating Commute Mode and Route Choice Variability in Jakarta using multi-day GPS Data Zainal N. Arifin Kay W. Axhausen Conference paper STRC 2011 Investigating Commute Mode and Route Choice Variability
Safety Manual OPTISWITCH series relay (DPDT)
") Safety Manual OPTISWITCH series 5000 - relay (DPDT) 1 Content Content 1 Functional safety 1.1 In general................................ 3 1.2 Planning................................. 5 1.3 Adjustment
Safety Manual OPTISWITCH series 5000 - relay (DPDT) 1 Content Content 1 Functional safety 1.1 In general................................ 3 1.2 Planning................................. 5 1.3 Adjustment
PHASE 1 WIND STUDIES REPORT
 PHASE 1 WIND STUDIES REPORT ENVIRONMENTAL STUDIES AND PRELIMINARY DESIGN FOR A SUICIDE DETERRENT SYSTEM Contract 2006-B-17 24 MAY 2007 Golden Gate Bridge Highway and Transportation District Introduction
Statistical Process Control Lab
 Statistical Process Control Lab by Jenna Hartmann Submitted to Dr. C. G. Willson ChE 253M Department of Chemical Engineering The University of Texas at Austin Fall 2007 Statistical Process Control Abstract
Rules and Playing Conditions of Cricket Conference Cup. 1. Title The title of the Competition shall be The Conference Cup for the Bertie Joel Trophy.
 Rules and Playing Conditions of Cricket Conference Cup 1. Title The title of the Competition shall be The Conference Cup for the Bertie Joel Trophy. 2. Management The Competition shall be managed by a
Study Guide and Intervention
 Study Guide and Intervention Normal and Skewed Distributions A continuous probability distribution is represented by a curve. Types of Continuous Distributions Normal Positively Skewed Negatively Skewed
Calculation of Trail Usage from Counter Data
 1. Introduction 1 Calculation of Trail Usage from Counter Data 1/17/17 Stephen Martin, Ph.D. Automatic counters are used on trails to measure how many people are using the trail. A fundamental question
Temporal and Spatial Variation in Non-motorized Traffic in Minneapolis: Some Preliminary Analyses
 Temporal and Spatial Variation in Non-motorized Traffic in Minneapolis: Some Preliminary Analyses Spencer Agnew, Jason Borah, Steve Hankey, Kristopher Hoff, Brad Utecht, Zhiyi Xu, Greg Lindsey Thanks to:
Measuring Success: Transportation Improvements along Sandy Boulevard between NE 13 th and NE 47 th Avenues
 Measuring Success: Transportation Improvements along Sandy Boulevard between NE 13 th and NE 47 th Avenues FINAL REPORT pared by Dan Bower and Scott Cohen City of Portland, Office of Transportation January
Preparation for Salinity Control ME 121
 Preparation for Salinity Control ME 121 This document describes a set of measurements and analyses that will help you to write an Arduino program to control the salinity of water in your fish tank. The
A Continued Worker Safety Issue
 The petroleum industry has undertaken a voluntary environmental performance tracking initiative, recording detailed information about spills and releases, their causes and consequences. The members of
Unit 4: Inference for numerical variables Lecture 3: ANOVA
 Unit 4: Inference for numerical variables Lecture 3: ANOVA Statistics 101 Thomas Leininger June 10, 2013 Announcements Announcements Proposals due tomorrow. Will be returned to you by Wednesday. You MUST