Congestion Reduction in Europe: Advancing Transport Efficiency. MG Tackling urban road congestion D3.4
|
|
|
- Kelley Bradford
- 5 years ago
- Views:
Transcription
1 Congestion Reduction in Europe: Advancing Transport Efficiency MG Tackling urban road congestion D3.4 Patterns of congestion in European cities Multiple-indicator analysis using real-time GPS speed data WP 3 Quantitative Analysis of Travel Due date 31 January 2018 Actual delivery date: 31 May 2018 Start date of project: June 1 st 2015 Duration Prepared by: Status Dissemination Level 36 months Paulo Anciaes, UCL Peter Jones, UCL Final Public (PU) Page 0 of 80 Del Version 1.0
2 Contents 1. Introduction Data and methods Data: INRIX Roadway Analytics Methods Speeds Time distribution of speeds Free-flow speeds Average speeds by time period Speeds: synthesis Intensity of congestion Proportion of a time road segment is congested: main indicators Proportion of time a road segment is congested: sensitivity analysis Proportion of time speed is below a threshold Average delay Excess travel time Intensity of congestion: synthesis Variability of congestion Standard deviation of speeds Interquartile range Skew % percentile of speeds Variability of congestion: synthesis Trip-based indicators Further analysis: London Incorporating speed limits Weighting by traffic volumes Weighting by census data Disaggregating by movement and place function of the road Effect of road design on speeds Comparison with a Stage 1 city (Adana, Turkey) Comparison with INRIX scorecard Discussion and conclusions Acknowledgements References Page 1 of 80 Del Version 1.0
3 List of tables Table 1: Zones (area and population) Table 2: Functional road classification Table 3: Number of road segments, by zone and functional road classification Table 4: Coverage of the dataset Table 5: Average free-flow speeds (km/h), by zone and functional road classification (2017) Table 6: Average peak-time speeds (km/h), by zone and functional road classification (2017) Table 7: Average off-peak speeds (km/h), by zone and functional road classification (2017) Table 8: Average speeds: synthesis Table 9: Proportion of peak time when speed is below 65% of free-flow speed, by zone and functional road classification (2017) Table 10: Proportion of off-peak time when speed is below 65% of free-flow speed, by zone and functional road classification (2017) Table 11: Proportion of peak time when speed is below 50%-75% of free-flow speed, by zone and functional road classification (2017) Table 12: Proportion of (revised) peak time when speed is below 65% of free-flow speed, by zone and functional road classification (2017) Table 13: Proportion of peak time when speed is below 65% of maximum hourly speed, by zone and functional road classification (2017) Table 14: Proportion of peak time when speed is below 15km/h, by zone and functional road classification (2017) Table 15: Average delay, by zone and functional road classification (2017) Table 16: Excess travel time (%), by zone and functional road classification (2017) Table 17: (Revised) excess travel time (%), by zone and functional road classification (2017) Table 18: Speed-based indicators: synthesis Table 19: Travel time-based indicators: synthesis Table 20: Standard deviation of speeds (% of mean), by zone and functional road classification (2017) Table 21: Interquartile range of speeds (% of median), by zone and functional road classification (2017) Table 22: Interquartile range of speeds (% of free-flow speed), by zone and functional road classification (2017) Table 23: Skew (25%/75% percentile version), by zone and functional road classification (2017) Table 24: Skew (5%/95% percentile version), by zone and functional road classification (2017) Table 25: 5% percentile of speeds (% of median), by zone and functional road classification (2017). 48 Table 26: 5% percentile of speeds (% of free-flow speed), by zone and functional road classification (2017) Table 27: 5% percentile of speeds (km/h), by zone and functional road classification (2017) Table 28: Indicators of variability of congestion: synthesis Table 29: Trips to city centre: length and time, by zone and functional road classification (2017) Table 30: Trips to city centre: speeds and speed-based indicators, by zone and functional road classification (2017) Table 31: Trips to city centre: travel time-based indicators, by zone and functional road classification (2017) Table 32: Speed limits vs. average free-flow and peak-time speeds (London, 2017) Table 33: Proportion of time in congestion: incorporating speed limits (London, 2017) Table 34: Proportion of time in congestion: weighting by traffic volumes (London, 2017) Table 35: Location in the centre, and length/ time of trips to the centre, weighted by census data (London) Table 36: Peak-time speeds and indicators of congestion for trips to the centre, weighted by census data (London) Page 2 of 80 Del Version 1.0
4 Table 37: Number of road segments in London, by movement and place function (%) Table 38: Speeds by movement and place function of the road (London, 2017) Table 39: Indicators of congestion by movement and place function of the road (London, 2017) Table 40: Adana: number of segments, by zone and functional road classification Table 41: Comparison Adana and Stage 3 cities: speed-based indicators (2017) Table 42: Comparison Adana and Stage 3 cities: travel time-based indicators (2017) Table 43: Comparison Adana and Stage 3 cities: indicators of variability (2017) Table 44: Comparison Adana and Stage 3 cities: trip-based indicators Table 45: Difference between data and methods in this report and the INRIX Scorecard report Table 46: Proportion of peak time when speed is below 65% of free-flow speed: comparison with INRIX scorecard: Page 3 of 80 Del Version 1.0
5 List of figures Figure 1: Zones and road segments: maps Figure 2: Average weekday speeds (km/h), by zone and hour (2017) Figure 3: Average peak-time speeds (km/h), by zone and day of week (2017) Figure 4: Average free-flow speeds (km/h): cumulative distribution (2017) Figure 5: Average free-flow speeds (km/h), by distance from city centre (2017) Figure 6: Average free-flow speeds (km/h): maps (2017) Figure 7: Average peak-time speeds (km/h): cumulative distribution (2017) Figure 8: Average peak-time speeds (km/h), by distance from city centre (2017) Figure 9: Average peak-time speeds (km/h): maps (2017) Figure 10: Average peak-time speeds (km/h): evolution Figure 11: Average off-peak speeds (km/h): cumulative distribution (2017) Figure 12: Average off-peak speeds (km/h), by distance from city centre (2017) Figure 13: Average off-peak speeds (km/h): maps (2017) Figure 14: Average off-peak speeds (km/h): evolution Figure 15: Proportion of time when speed is below 65% of free-flow speed, by zone and time of day (Weekdays, 2017) Figure 16: Proportion of peak time when speed is below 65% of free-flow speed, by zone and day of week (2017) Figure 17: Proportion of peak time when speed is below 65% of free-flow speed: cumulative distribution (2017) Figure 18: Proportion of peak time when speed is below 65% of free-flow speed, by distance from city centre (2017) Figure 19: Proportion of peak time when speed is below 65% of free-flow speed: maps (2017) Figure 20: Proportion of peak time when speed is below 65% of free-flow speed: evolution Figure 21: Proportion of off-peak when speed is below 65% of free-flow speed: cumulative distribution (2017) Figure 22: Proportion of off-peak when speed is below 65% of free-flow speed, by distance from city centre (2017) Figure 23: Proportion of off-peak when speed is below 65% of free-flow speed: maps (2017) Figure 24: Proportion of off-peak when speed is below 65% of free-flow speed: evolution Figure 25: Proportion of peak time when speed is below 15km/h: cumulative distribution (2017) Figure 26: Proportion of peak time when speed is below 15km/h, by distance from city centre (2017) 33 Figure 27: Proportion of peak time when speed is below 15km/h: maps (2017) Figure 28: Proportion of peak time when speed is below 15km/h: evolution Figure 29: Average delay: cumulative distribution (2017) Figure 30: Average delay, by distance from city centre (2017) Figure 31: Average delay: maps (2017) Figure 32: Average delay: evolution Figure 33: Excess travel time (%): cumulative distribution (2017) Figure 34: Excess travel time (%), by distance from city centre (2017) Figure 35: Excess travel time (%): maps (2017) Figure 36: Excess travel time (%): evolution Figure 37: Standard deviation of speeds (% of mean): cumulative distribution (2017) Figure 38: Standard deviation of speeds (% of mean), by distance from city centre (2017) Figure 39: Standard deviation of speeds (% of mean): maps (2017) Figure 40: Interquartile range of speeds (% of median): cumulative distribution (2017) Figure 41: Interquartile range of speeds (% of median), by distance from city centre (2017) Figure 42: Interquartile range of speeds (% of median): maps (2017) Figure 43: Skew: cumulative distribution (2017) Page 4 of 80 Del Version 1.0
6 Figure 44: Skew, by distance from city centre (2017) Figure 45: Skew: maps (2017) Figure 46: 5% percentile of speeds (% of median): cumulative distribution (2017) Figure 47: 5% percentile of speeds (% of median), by distance from city centre (2017) Figure 48: 5% percentile of speeds (% of median): maps (2017) Figure 49: Trips to city centre: origins and destinations (London) Figure 50: Trips to city centre: travel time (maps) Figure 51: Trips to city centre: average speeds (maps) Figure 52: Trips to city centre: excess travel time (maps) Figure 53: Speed limits vs. free-flow and peak-time speeds: cumulative distribution (London, 2017). 57 Figure 54: Proportion of time travelling at different speeds (London, 2017) Figure 55: Trip-based indicators, by census unit (London) Figure 56: The road/street type matrix: expected types of users and speeds (London) Figure 57: Blackfriars Road improvement: before and after Figure 58: Average peak-time speed (km/h) in Blackfriars Road: evolution Figure 59: Proportion of time when speed is below 15km/h in Blackfriars Road: evolution Figure 60: Adana: zones and road segments Page 5 of 80 Del Version 1.0
7 1. Introduction Congestion is a multi-faceted issue and is measured in different ways by city governments, traffic data companies, and researchers, using a wide range of different indicators, which capture different aspects of the problem. The ways in which these indicators are selected and then used to frame the congestion debate in cities reflect public and political perceptions of the problems of the transport system and of solutions to tackle those problems. As policy priorities change, so do the appropriate metrics for measuring the performance of the transport system. The main hypothesis of the EU-funded CREATE project is that urban transport policy in many cities tends to move along a common trajectory, from an initial focus on private car movement ("Stage 1") to a more holistic approach considering all modes of transport, nonmovement needs, and wider societal objectives ("Stage 3"). This evolution in policy priorities requires a parallel evolution in the type of indicators used to assess the success of interventions, including indicators of congestion. In our previous report (Jones and Anciaes 2018), we discussed the limitations of the set of indicators of congestion that are currently in use and proposed indicators that could provide a more insightful and comprehensive view of road network performance, suitable to the aims of a Stage 3 transport policy. We emphasized that the usual indicators of congestion rely on several assumptions, which are treated in different ways in different cities at different times. There is a need for indicators that are consistent across space and time, to allow for a more objective comparison of the performance of each city. There is also a gap regarding the measurement of the variability of congestion, which is an important component of people s perceptions of the problem, as it affects the reliability of travel times, and ultimately trip quality - a crucial aspect for Stage 3 policies. More generally, the term congestion reflects a 'Stage 1' thinking, which may have less relevance in later stages of the transport policy trajectory. A holistic assessment of road network performance requires balancing intensity and variability of congestion, the needs of users of all modes of transport, and the movement and place functions of roads. One of aims of the CREATE project is to develop a consistent set of indicators of urban transport network performance to deepen understanding of the extent to which each city is delivering efficient and effective sustainable mobility. The present report is aligned with that overall aim and has two specific objectives, linked to expected contributions to transport policy and research. The first objective is to analyse patterns of congestion in the five Stage 3 cities in the CREATE project (London, Paris, Berlin, Vienna, and Copenhagen), reflecting on similarities and differences in congestion patterns across cities that are at the same stage in the transport policy trajectory. We aim to contribute to the literature on urban congestion patterns by using a standardized set of indicators and apply them to a set of cities that are similar in terms of transport policies, using a consistent framework for segmenting the analysis in zones and road types and for analysing the statistical, spatial, and time patterns in those indicators. Page 6 of 80 Del Version 1.0
8 The second objective is to compare the information provided by the different indicators, reflecting on their suitability to capture congestion patterns in urban areas. We aim to contribute to the literature on measuring congestion by testing the impact on the indicators of changing some of their assumptions and developing indicators of variability of congestion based on statistical measures of dispersion and skew of measured speeds. We use data provided by INRIX, extracted from the INRIX Roadway Analytics platform. The datasets used contain real-time speeds obtained from GPS probe data from vehicles and aggregated by road segment. This allowed us to compute detailed measurements that could not be rigorously be computed otherwise, such as the proportion of time speeds are below a certain level, and indicators of variability of speeds based on their statistical distributions. The indicators used in this report capture congestion from the perspective of the road network. Indicators are estimated for each road segment, and then aggregated by time period, zone of the city, and functional road classification not weighted by traffic volumes (except in London, where we use simple annual average daily flows in Section 7.2). This approach is different from the one used by INRIX in the INRIX Scorecard reports (Cookson 2018), which is based on driving times, and weights congestion indicators by estimated traffic volumes in each segment, deriving city-wide indicators which are also adjusted for city size. In Section 6 of this report we also estimate indicators from the perspective of trips, but we assume theoretical peak-time trips to the city centre from each point in a grid outside the centre. This approach also differs from the INRIX Scorecard approach, which takes into consideration actual trips. The following section is an overview of the INRIX Roadway Analytics data used in this report and of the methods used to segment the data according to time periods, zones, and functional road classification in the five cities. Section 3 analyses average speeds at different times of day and days of the week, and compares the distributions of free-flow, peak-time, and off-peak time speeds. Sections 4 analyses indicators of intensity of congestion (based on speeds and on travel times), and Section 5 looks at indicators of variability of congestion. In these sections, a set of main indicators are studied in terms of their statistical, spatial, and time distribution in 2017 and evolution since We then do a sensitivity analysis changing some of the assumptions implicit in those indicators. Section 6 looks at indicators of intensity of congestion from the perspective of trips, based on theoretical peak-time trips to the city centre. The trip-based indicators aggregate the segment-level indicators along the fastest routes, estimated in a Geographical Information System (GIS). Section 7 extends the analysis for one of the cities (London), combining the INRIX speed data with additional datasets with speed limits, traffic volumes, census data, and a twodimensional classification of road segments according to their movement and place functions. We also look at the impact of redesigning a road to reallocate space from cars to cyclists and pedestrians. Page 7 of 80 Del Version 1.0
9 Section 8 compares the results of the main indicators in the five CREATE Stage 3 cities with the ones estimated for one of the CREATE Stage 1 cities (Adana, Turkey), which is also included in INRIX Roadway Analytics dataset. Section 9 compares the results with the ones published in the INRIX 2017 Scorecard, which are based on time spent by road users in congestion and is aggregated using different methods than the ones we used. Section 10 synthesizes the main conclusions of the report, discussed the limitations of the methods used, and proposes directions for assessing other aspects of the road network performance that were not studied in this report. Page 8 of 80 Del Version 1.0
10 2. Data and methods 2.1. Data: INRIX Roadway Analytics The data used in this report was extracted from INRIX Roadway Analytics, a platform provided by INRIX to the authors for the purposes of the CREATE project. The dataset includes the estimated speed of vehicles traversing each road segment, at regular time intervals. The free-flow speed of each segment is also provided. The data is available from 2014 for London, Berlin, Vienna, and Copenhagen, and from 2016 in Paris. The data used in this report covers the period from January 2014 (January 2016) to December Data is also available for a Stage 1 city (Adana, Turkey) from October 2014 but in our analysis of that city in Section 8, we use only the period January-December The set of road segments in each city is very extensive, with gaps only in minor roads, as explained later in this section. In most cases, segments are split at junctions. Sections of large junctions and legs of roundabouts are in most cases treated as separate segments. Roads with multiple lanes are also represented by multiple segments. The data can be accessed from INRIX Roadway Analytics with a granularity of up to 1 minute (i.e. 1 observation per minute per road segment). For the purposes of this report, we used a granularity of 5 minutes, to reduce the data processing time. A granularity of 5 minutes still provides an enormous amount of detail and produces very large datasets. However, we deemed this was necessary to calculate some of the indicators, which are based on the proportions of time when speeds are below a certain level. The dataset also includes a 'confidence value' for each data point (i.e. for each 5-minute period in each segment) representing the probability that the speed value represents the actual road conditions in that segment in that period. All segment-level averages in this report are weighted by this confidence value. A separate dataset was provided to the authors by INRIX with the location of the road segments, in a GIS format. The segments in this dataset can be linked with the segments in the speeds dataset (and then with the segment-level indicators we produced). That segments file was also matched with other spatial data in some of the analyses to produce trip-based indicators (Section 6) and in the London-only analysis in Section 7. The file was also used as one of the components of the maps produced Methods The study analyses different indicators of congestion, which are compared across the five cities. This is done by looking at the following five aspects consistently across the cities and indicators: The (length-weighted) averages of the segment-level indicators in 2017, by zone (central, inner, and outer parts of the city) and the functional classification of the road. In all results tables, we also include a row with the (unweighted) average of the five cities. The cumulative statistical distribution of the segment-level indicators in This uses all segments excluding minor roads due to gaps in the INRIX coverage. Page 9 of 80 Del Version 1.0
11 The time distribution of the zone-level indicators in 2017 (by time of day and day of the week). These zone-level indicators are the length-weighted averages of all segments in each zone, excluding minor roads. The spatial distribution of the segment-level indicators in 2017, using maps and charts of the (length-weighted) averages of segment-level indicators by their road network distances from the city centre - for all segments excluding minor roads. The month-by-month evolution of the indicators from January 2014 to December This uses the (length-weighted) average of all segments in the datasets of each city, excluding minor roads. These five aspects are not presented for every indicator as they are not always relevant. In addition, when comparing different versions of the same indicator, we only look at the first of these aspects (the averages by zone and the functional road classification). The disaggregation of the five cities into zones follows the approach used in CREATE Deliverable 3.3-Cross-city comparison (Wittwer and Gerike 2018), which split each city into an "Inner" and an "Outer" functional area, slightly modifying the zones based on administrative areas that were used in Deliverable 3.2-City reports (CREATE 2016). In the present report, we further split the Inner area into two zones: "Centre" and "Inner (not centre)". To simplify the presentation of the outputs, the "Inner (not centre)" zone is presented in the report simply as "Inner". The central zone was defined considering the locations of public transport fare zones, ring roads, and circular underground, train lines or bus routes. Table 1 shows the area and population of the three zones in each city. There are clear differences between the five cities - which are reflected in the results of this report. London and Paris are "world cities" with a very large population. Berlin has about half of the population of Paris, while Vienna and Copenhagen are much smaller. London is by far the largest city in area, but Berlin is larger than Paris. Vienna and Copenhagen are smaller, but the difference to Paris and Berlin is not as pronounced as in the case of population. The majority of the population lives in the Outer area in all cities except in Copenhagen. Table 1: Zones (area and population) Area (km2) Zone Centre Inner Outer All Population (millions) Centre+ Inner Outer London Paris Berlin Vienna Copenhagen Average Sources: Population: Calculated from data presented in Wittwer and Gerike (2018). Area: Calculated using publicly available GIS data on administrative areas and information from CREATE reports and other sources to delimit zones All All the road segments in the five cities were classified according to their functional role (for movement), using the Functional Road Classification (FRC) provided in the INRIX Roadway Analytics platform. FRCs are "set by the provider of the mapping software used by each Page 10 of 80 Del Version 1.0
12 satellite navigation system" (Cookson 2016, p.4). The table below describes the five FRC levels, as defined by INRIX. FRC1 are the most important roads. FRC5 are the least important. Table 2: Functional road classification Zone FRC1 FRC2 FRC3 FRC4 and FRC5 Description Main national connecting routes, usually dual carriageway, with limited access, that connect major cities and towns The next level of main route that connects from the FRC1 routes into the centres of towns and cities, or distributes traffic within cities and towns. Many are dual carriageway, but some may be single More minor connecting A-roads (and some B roads) that connect smaller towns and villages in rural areas, or suburban districts of larger towns Smaller B and local, unnumbered roads Source: Adapted from Cookson 2016, p.4 Table 3 shows statistics on the road segments included in the analysis, by their functional road classification, and the city zone where their central point is located. London and Paris have by far the largest road network in the database, in terms of number of segments. However, the datasets of London, Berlin, Vienna, and Copenhagen provide a similar coverage of those cities, when looking at the total segment length relative to the total area of the city (Table 4). Paris has a slightly better coverage. In all cities, FRC3 roads are the most frequent, followed by FRC2 roads. The large majority of the road segments in central areas are FRC3 roads, with very few FRC2 and FRC4 roads and virtually no FRC1 and FRC5 roads. For this reason we aggregated all road segments in the central zone. In the Inner zones there are few FRC1 segments, which we aggregated with FRC2 segments. In both Inner and Outer zones, there are few FRC5 segments, which we aggregate with FRC4 segments. Table 3: Number of road segments, by zone and functional road classification Number of segments Zone Centre Inner Outer FRC Total London Paris Berlin Vienna Copen Aggregate all Centre zone Aggregate FRC 1 and 2 in Inner zone Aggregate FRC 4 and 5 in Inner zone Aggregate FRC 4 and 5 in Outer zone Page 11 of 80 Del Version 1.0
13 Table 4: Coverage of the dataset Total length (km) Total area (km2) Coverage of dataset (km road/km2area) London Paris Berlin Vienna Copenhagen Average The maps in Figure 1 show the zones and road segment types in the five cities. In London, the only FRC1 roads are sections of the circular M25 motorway. There are several FRC2 roads in the Outer zone but the only FRC2 roads in the Inner zone are in the Western part of this zone. In Paris, a FRC1 road runs along most of the border between the Inner and the Outer zones. There are also several FRC1 roads in the Outer zone and a FRC2 road cutting through the Inner and Central zones. Berlin has few FRC1 roads but several FRC2 roads in all areas, and a series of FRC2 and FRC3 roads originating from the city centre. Vienna has several FRC1 and FRC2 roads in both Inner and Outer zones but a poor coverage of all types of road in the city centre. Copenhagen has several FRC1 and FRC2 ring roads. The central zone is very small but has several FRC2 and FRC3 roads. Overall, Paris is the city with more "major" roads cutting through the city, especially comparing with London, a city with a similar size and "world" status. Looking at these results, we decided not to compute city-wide aggregated indicators of congestion as the database does not cover all the segments in the road network, since it has a limited coverage of roads with lower importance for movement (FRC4 and FRC5). The report proceeds by looking at the variables provided directly in the original dataset (i.e. speeds) in the five cities. Then, Sections 3 to 6 compute indicators of congestion based on those speeds. Section 7 refines the analysis in London by combining the speeds dataset with other data on speed limits, traffic volumes, demographics, and an alternative road classification, while also looking at the impacts of a specific policy. Sections 8 and 9 compare our indicators for the five Stage 3 cities with a Stage 1 city (Adana, Turkey) and with the indicators in the INRIX Scorecard, respectively. Page 12 of 80 Del Version 1.0


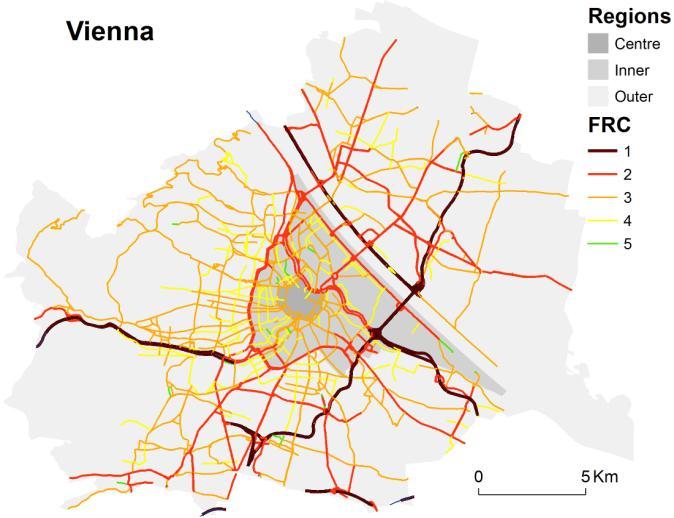
14 Figure 1: Zones and road segments: maps Page 13 of 80 Del Version 1.0
15 3. Speeds 3.1. Time distribution of speeds This section looks at average speeds aggregated by time period in the five cities. The analysis is split by zone only (not by type of road). The segment-level speeds in each zone were aggregated based on segment length. Minor roads (FRC4 and FRC5) were excluded due to the poor coverage of the dataset for these roads. Figure 2 show the average speeds by zone hour of the day on weekdays. In all cities, the speeds are higher at night-time than at daytime and decrease abruptly at 6:00, not returning to the same levels before 22:00-23:00. In central areas in London and Paris, the speeds do not vary much from 6:00 to 17:00, not showing evidence of a morning/afternoon "off-peak" period. Speeds start to increase in central areas at 17:00 in London and Paris and slightly earlier in the other cities. In the Inner and Outer areas (but more noticeably in the latter) there is a clear demarcation in all cities between a morning peak (6:00-9:00/10:00), a morning/afternoon off-peak (9:00/10:00-14:00/15:00), an afternoon/evening peak (14:00/15:00-18:00/19:00) and an evening off-peak period (18:00/19:00-22:00/23:00). In terms of absolute values, in the Inner zone there is a clear ranking of speeds from the lowest in London, followed by Paris, Berlin, Vienna, and Copenhagen. This pattern changes in other zones. In the Central zone, the distinction is between London and Paris (with lower speeds - with London having the lowest ones) and the other three cities. In the Outer zones Copenhagen has by far the highest speeds, around km/h higher, on average, than the other four cities. Figure 3 shows the average peak-time speeds, by zone and day of the week. As expected, speeds are higher on weekdays in all zones of all cities. Speeds are higher on Saturdays than on Sundays and very similar on Sundays and public holidays. The increase from Friday to Saturday is higher in London and Paris, especially in the Central and Inner zones. Considering these results, in the computation of the indicators in this report, we consider the peak period in all cities as 6:00-10:00 and 15:00-19:00 on weekdays and the off-peak period as 10:00-15:00 and 19:00-22:00 on weekdays. However, in Section 4.2 we also test a different definition of peak period (6:00-9:00 and 16:00-19:00). We also ran the analysis of all indicators for the night period (22:00-6:00) and the weekend peak period, but do not discuss the results in detail, showing only aggregate values in Section 9. Page 14 of 80 Del Version 1.0
16 Average speed (km/h) (Outer city) Average speed (km/h) (Centre) Average speed (km/h) (Inner city) Average speed (km/h) (Outer city) Average speed (km/h) (Centre) Average speed (km/h) (Inner city) Figure 2: Average weekday speeds (km/h), by zone and hour (2017) Centre Inner Time of day (hour) 0 Time of day (hour) Outer Time of day (hour) Figure 3: Average peak-time speeds (km/h), by zone and day of week (2017) Centre Inner Mon Tue Wed Thu Fri Sat Sun Holiday Day of the week 0 Mon Tue Wed Thu Fri Sat Sun Holiday Day of the week Outer Mon Tue Wed Thu Fri Sat Sun Holiday Day of the week Page 15 of 80 Del Version 1.0
17 3.2. Free-flow speeds The free-flow speeds can be understood as an indicator of the level of service provided by the road transport system to motorised traffic. The values of the free-flow speeds in each segment in our analysis were provided in the original INRIX dataset and are the 66% percentile speed for that segment. This approach was used by INRIX to avoid using the night-time quiet times, which have 'unrealistic' high speeds. As explained in our previous report (Jones and Anciaes 2018, Section 5.1.1) this approach also helps us using a common basis for defining the free-flow speed across different cities, as it is based on performance characteristics of the road network and not on fixed night-time periods, an approach which would be sensitive to the exact definition of those periods. The table and figures that follow show the results. In all cities, free-flow speeds increase as we move away from the city centre (Figure 5) and are higher on major roads, such as circular roads and motorways (Figure 6). Free-flow speeds tend to increase as we move from the Central to the Inner and then to the Outer zones, and as we move from roads with less importance to more importance (Table 5). The increase is particularly noticeable when we move from Inner zone FRC1/2 roads to Outer zone FRC1 roads, where the speeds are very high in all cities (reaching 98km/h in Copenhagen). There are some differences between London/Paris and the other three cities (Table 5). The free-flow speeds are markedly lower in London and Paris in central areas and in less important roads in other zones (roads with FRC lower than 1 in Inner areas and lower than 2 in Outer areas). London provides a better level of service than Paris in major roads (FRC1) in Outer areas while Paris provides a better level of service in major roads (FRC1/2) in Inner areas. Overall, Copenhagen tends to have much higher free-flow speeds than all other cities (Figure 4), with the difference increasing with distance from the city centre (Figure 5). On average, the Copenhagen speeds are much higher than other cities in Outer areas, but also higher in most roads in Inner areas (Table 5). The high level of service in Outer areas in Copenhagen occurs in the major ring roads around the Inner area (Figure 6). Table 5: Average free-flow speeds (km/h), by zone and functional road classification (2017) Zone Inner Outer Centre Road importance 1/2 3 4/ /5 London Paris Berlin Vienna Copenhagen Average Page 16 of 80 Del Version 1.0
18 Cumulative frequency Reference speed (km/h) Figure 4: Average free-flow speeds (km/h): cumulative distribution (2017) Figure 5: Average free-flow speeds (km/h), by distance from city centre (2017) 100% 80 75% 60 50% 40 25% 20 0% Reference speed (km/h) Distance from city centre (km) Note: These two charts, and similar charts in the rest of this report are based on the city-wide distribution of the indicators across FRC1, FRC2, and FRC roads, i.e. all roads excluding minor ones. Results are weighted by segment length. Figure 6: Average free-flow speeds (km/h): maps (2017) Page 17 of 80 Del Version 1.0
19 3.3. Average speeds by time period Speeds are the simplest indicator of congestion, measuring how fast traffic is flowing. In this section we look at average speeds by time period, using the definitions of peak (6:00-10:00 and 15:00-19:00 weekdays) and off-peak (10:00-15:00 and 19:00-22:00 weekdays) which were chosen based on the analysis in Section 3.1. The average speeds were calculated for each road segment in each city, aggregating speeds in all days in 2017 in the relevant time period. Average peak-time speeds The table and figures that follow show the results for the peak period. The spatial distribution is more or less similar to the one found for free-flow speeds, as average peak-time speeds increase as we move away from the city centre, in all cities (Figure 8). In Berlin, Vienna, and Copenhagen, we also found the same pattern where major roads have higher speeds (Table 6). However, in London and Paris is less straightforward to match the location of the roads with the highest speeds in the map in Figure 9 with the location of the major roads in the map in Figure 1. In particular, the first ring road in Paris has lower speeds than expected from its functional classification and free-flow speed. The maps also show a large extension of areas in the Central and Inner zones in Paris where average peak-time speeds are below 20km/h. On average, peak-time speeds increase as we move from the Central to the Inner and then to the Outer zones, and as we move from roads with less importance to more importance, with this last increase less noticeable in London and Paris (Table 6). Speeds are very high in FRC1 roads in Outer areas, close to free-flow speeds in all cities except Paris. There is also a divide between London/Paris and the other three cites (Figure 7 and Table 6). Average speeds are lower in Paris than in those three cities in almost all zones and road types. Average speeds in London are also lower than those three cities throughout the Central and Inner areas. Copenhagen tends to have much higher average speeds than all other cities (Figure 7), with the difference increasing with distance from the city centre (Figure 8). The chart with the evolution of average speeds since January 2014 (Figure 10) suggests a slight downward trend from 2014 to mid 2015 in London, Berlin, Vienna, and Copenhagen (data for this period in not available in Paris) and then a stable trend until December There is a marked seasonal increase in speeds in Paris in August and a much smaller seasonal increase in that month in the other cities. Page 18 of 80 Del Version 1.0
20 Cumulative frequency Peak-time speed (km/h) Table 6: Average peak-time speeds (km/h), by zone and functional road classification (2017) Zone Inner Outer Centre Road importance 1/2 3 4/ /5 London Paris Berlin Vienna Copenhagen Average Figure 7: Average peak-time speeds (km/h): cumulative distribution (2017) Figure 8: Average peak-time speeds (km/h), by distance from city centre (2017) 100% 80 75% 60 50% 40 25% 20 0% Peak-time speed (km/h) Distance from city centre (km) Page 19 of 80 Del Version 1.0
 Figure 9: Average peak-time speeds (km/h): maps (2017) Figure 10: Average peak-time speeds (km/h): evolution 2014-2017 60 50 40 30 20 2014 2015 2016 2017 Average off-peak")
21 Jan Feb Mar Apr Mai Jun Jul Aug Set Oct Nov Dec Jan Feb Mar Apr May Jun Jul Aug Sep Oct Nov Dec Jan Feb Mar Apr May Jun Jul Aug Sep Oct Nov Dec Jan Feb Mar Apr May Jun Jul Aug Sep Oct Nov Dec Peak-time speed (km/h) Figure 9: Average peak-time speeds (km/h): maps (2017) Figure 10: Average peak-time speeds (km/h): evolution Average off-peak speeds The table and figures that follow show the average speeds in the off-peak period. Table 7 shows that the increase in speeds, comparing with the peak period (Table 6), tends to be minimal in all cities, zones, and road types, with increases of 1km/h or 2km/h in almost all cases. The exceptions are the major roads (FRC1/2) in Outer areas in London and Paris, with increases of 5-7 km/h and 4-12km/h respectively, and major roads (FRC1/2) in Inner Page 20 of 80 Del Version 1.0
22 Cumulative frequency Off-peak time speed areas in Paris, with an increase of 6km/h. As an example, the outer ring road in Paris has offpeak speeds above 50km/h along most of its length (Figure 13), which did not happen in the peak period. The divide between Copenhagen (which has higher speeds) and the other cities (Figure 11) and the general increase in speeds with distance from the city centre (Figure 12) found for the free-flow and peak-time speeds still apply in the case of off-speak speeds. The evolution of the indicator (Figure 14) reveals the same tendency for a reduction of speeds in from 2014 to mid 2015, as in the case of peak-time speeds. The seasonal increase in speeds in August is less noticeable. In particular, the increase in Paris is much smaller than in the case of peak speeds. Table 7: Average off-peak speeds (km/h), by zone and functional road classification (2017) Zone Inner Outer Centre Road importance 1/2 3 4/ /5 London Paris Berlin Vienna Copenhagen Average Figure 11: Average off-peak speeds (km/h): cumulative distribution (2017) Figure 12: Average off-peak speeds (km/h), by distance from city centre (2017) 100% 80 75% 60 50% 40 25% 20 0% Off-peak speed (km/h) Distance from city centre (km) Page 21 of 80 Del Version 1.0
23 Jan Feb Mar Apr Mai Jun Jul Aug Set Oct Nov Dec Jan Feb Mar Apr May Jun Jul Aug Sep Oct Nov Dec Jan Feb Mar Apr May Jun Jul Aug Sep Oct Nov Dec Jan Feb Mar Apr May Jun Jul Aug Sep Oct Nov Dec Off-peak-time speed (km/h) Figure 13: Average off-peak speeds (km/h): maps (2017) Figure 14: Average off-peak speeds (km/h): evolution Speeds: synthesis Overall, we found that speeds tend to increase with distance from the city centre and with road importance and are generally higher in Copenhagen than in the other cities. London and Paris have a distinctive speed profile, with lower speeds in the Central and Inner areas comparing with other cities, and a higher discrepancy between the free-flow, peak, and offpeak speeds. There was a general reduction of speeds from 2014 to mid-2015 and a seasonal increase in August in all years. Page 22 of 80 Del Version 1.0
24 Table 8 synthesises the zone/road type information of this section. The values are the averages of the speeds indicators in the five cities, and come from the last rows of Tables 5-7. As expected, peak and off-time speeds are below free-flow speeds in all areas, but the difference between peak and off-peak speeds is only relevant in FRC1 roads in Outer areas. All speeds are higher in Outer areas, followed by Inner and Central areas, and always increase with road importance. Table 8: Average speeds: synthesis Zone Inner Outer Centre Road importance 1/2 3 4/ /5 Free-flow speeds Peak-time speeds Off-peak speeds Values are the five-city averages, from Tables 5-7 Page 23 of 80 Del Version 1.0
25 4. Intensity of congestion Intensity is one of the dimensions of road congestion (the others being duration, extent, and variability - Falcocchio and Levinson 2015, p.95), and can be defined as the degree to which a road is congested. In this section, we first analyse the proportion of time each road segment is congested, defined as the situation when the speed of the vehicles traversing that segment is below a certain percentage of the free-flow speed. We used as a base indicator the proportion of time when speed is below 65% of the free-flow speed in a given time period (peak or off-peak), taking the free-flow speed data provided by INRIX (which represent the 66th percentile of speeds). In a separate sub-section, we test the sensitivity of this indicator to its underlying assumptions, i.e. the definitions of "peak period" and "free-flow speed" and the 65% threshold value defining congestion. We then test an alternative set of indicators of intensity of congestion, measuring the proportion of time that traffic is moving at speeds below a threshold value representing very low speeds. The last two sub-sections look at two indicators based on the time required to cross the road segments: the average delay per minute and the excess travel time. These indicators take into account the magnitude of congestion in a segment at each moment in time (i.e. each 5- minute period), while the speed-based indicators classify each moment as either congested or not congested Proportion of a time road segment is congested: main indicators Our base indicator of intensity of congestion is the proportion of time each road segment was congested during 2017, defining congestion as a speed below 65% of the free-flow speed. For each segment and data point (i.e. each 5 minute-period) we calculated whether the measured speed is below 65% of the free-flow speed and then aggregated the values by time period for all days in The proportion of time the segment is congested is then the number of data points (5 minute periods) when the link is congested divided by the number of total data points. We use 65% of the free-flow speed as the threshold defining congestion for two reasons: This is the threshold in the INRIX Scorecard approach, which uses the same GPS base data we used, processed with a different method. This allows us to compare our results with the INRIX Scorecard (this is done in Section 9 of this report). 65% is about the mid-point of the 50%-75% range of values used by transport authorities around the world, as reported in the literature (see Litman 2014, p.4 and Falcocchio and Levinson 2016, p.107). However, in Section 4.2 we also compute indicators using threshold values of 50% and 75%. Time distribution The two figures below show the indicator aggregated by time period in the five cities. As in the analysis for speeds, we split the results by zone only (not by type of road), aggregating Page 24 of 80 Del Version 1.0
26 % peak time speed<65% ff speed (Outer) % peak time speed<65% ff speed (Centre) % peak time speed<65% ff speed (Inner) the segment-level indicators using the segment length. Minor roads (FRC4 and FRC5) were excluded due to the poor coverage of the dataset for these roads. Figure 15 shows the values of the indicator by hour of the day on weekdays. The differences in road congestion between daytime and night-time are clear in all cities and zones. Congestion increases sharply from 6:00 and only returns to the night-time levels at 22:00/23:00. In all cities and zones there are two clear peaks for congestion, with the afternoon/evening peak being higher, except in central London. Figure 15: Proportion of time when speed is below 65% of free-flow speed, by zone and time of day (Weekdays, 2017) Centre Inner 50% 50% 40% 40% 30% 30% 20% 20% 10% 10% 0% Time of day (hour) 0% Time of day (hour) Outer 50% 40% 30% 20% 10% 0% Time of day (hour) Figure 16 shows the values of the indicator by zone and day of the week. Congestion is much higher on weekdays in all zones of all cities. Unlike in the case of speeds, there are some differences in congestion by weekday. In the central areas, congestion is always lower on Mondays. In London and Paris, in central areas, congestion increases from Monday to Thursday but in Inner areas (and to a lesser degree, also in Outer areas), the increase only occurs from Monday to Tuesday. In Inner and Outer areas of Berlin, Vienna, and Copenhagen, congestion remains at about the same level in all weekdays. In central Paris, congestion is much smaller on Sundays than on Saturdays and even smaller on public holidays. In all other cities and zones, congestion is only slightly higher on Saturdays than on Sundays and similar on Sundays and public holidays. Page 25 of 80 Del Version 1.0
27 % peak-time speed<65% ff speed (Outer) % peak-time speed<65% fr speed (Centre) % peak-time speed<65% ff speed (Inner) Figure 16: Proportion of peak time when speed is below 65% of free-flow speed, by zone and day of week (2017) Centre Inner 50% 50% 40% 40% 30% 30% 20% 20% 10% 10% 0% Mon Tue Wed Thu Fri Sat Sun Holiday Day of the week 0% Mon Tue Wed Thu Fri Sat Sun Holiday Day of the week Outer 50% 40% 30% 20% 10% 0% Mon Tue Wed Thu Fri Sat Sun Holiday Day of the week Peak time The table and figures that follow show the results of the indicator aggregated for the peak period. There is a clear divide between London and Paris (which have higher congestion) and the other three cities (Figure 17). The difference occurs in all zones and road types (Table 9). However, the spatial pattern of congestion is different in London and Paris. In Outer areas in Paris, congestion is higher on the most important roads (FRC1) while in London these roads are less congested than less important roads (FRC2/3) (Table 9). This is reflected in a concentration of congestion in major ring roads in Paris while in London there is a more widespread pattern of congestion across the Outer zone (Figure 19). The indicator decreases as we move away from the city centre, in all cities (Figure 18). However, in London the decrease in only noticeable at distances longer than 14km from the centre. In general, congestion decreases as we move from the Inner to the Outer zones and from the most important roads to less important roads (FRC4/5) (Table 9). However, in Outer areas in London, Vienna, and Copenhagen, congestion increases when we move to FRC1 roads to FRC2 roads. In London, major roads (FRC1/2) in the Inner area are more congested than central roads. In Berlin, Vienna, and Copenhagen, congestion was higher at the end of 2017 than it was at the beginning of 2014 (Figure 20). Congestion tends to decrease in August in all cities, Page 26 of 80 Del Version 1.0
28 Cumulative frequency % of peak time speed<65% of free-flow speed especially in Paris, where congestion goes from 20% to 10% in that month. There was also a decrease in congestion in December-January in all cities. Table 9: Proportion of peak time when speed is below 65% of free-flow speed, by zone and functional road classification (2017) Zone Inner Outer Centre Road importance 1/2 3 4/ /5 London Paris Berlin Vienna Copenhagen Average Figure 17: Proportion of peak time when speed is below 65% of free-flow speed: cumulative distribution (2017) Figure 18: Proportion of peak time when speed is below 65% of free-flow speed, by distance from city centre (2017) 100% 50% 75% 40% 30% 50% 20% 25% 10% 0% 0% 10% 20% 30% 40% 50% 60% 70% 80% 90% 100% % of peak time where speed<65% of free-flow speed 0% Distance from city centre (km) Page 27 of 80 Del Version 1.0
29 % of peak time speed<65% of free-flow speed Jan Feb Mar Apr Mai Jun Jul Aug Set Oct Nov Dec Jan Feb Mar Apr May Jun Jul Aug Sep Oct Nov Dec Jan Feb Mar Apr May Jun Jul Aug Sep Oct Nov Dec Jan Feb Mar Apr May Jun Jul Aug Sep Oct Nov Dec Figure 19: Proportion of peak time when speed is below 65% of free-flow speed: maps (2017) Figure 20: Proportion of peak time when speed is below 65% of free-flow speed: evolution % 30% 20% 10% 0% Off-peak time The table and figures that follow show the results of the indicator aggregated for the off-peak period. In Berlin, Vienna, and Copenhagen, the reduction in congestion from the peak to offpeak period is low (between 0% and 5%) (comparing Table 10 with Table 9). The decrease in congestion is higher in London and Paris. For example, in Paris, in the most important roads in the Inner and Outer zones, the difference is 17% and 20% respectively. The Page 28 of 80 Del Version 1.0
30 Cumulative frequency % of off-peak time speed<65% of free-flow speed decrease in congestion in the off-peak period is evident in the maps in Figure 23, which show a lower density of roads congested 50% of the time in Inner and Outer areas in London and Paris, comparing with the peak period maps (Figure 19). The divide between London/Paris (which have higher congestion) and the other cities (Figure 21) is less noticeable than in the case of congestion in peak periods (Figure 19). There is a general decrease in congestion with distance from the city centre (Figure 22) in all cities, including in London, where in the peak period this only happened at some distance from the city centre. As in the peak period, congestion was higher at the end of 2017 than it was at the beginning of 2014 in Berlin, Vienna, and Copenhagen (but not in London). The seasonal decreases in congestion in August and December/January in all cities are smaller than in the case of the peak period (Figure 24). Table 10: Proportion of off-peak time when speed is below 65% of free-flow speed, by zone and functional road classification (2017) Zone Inner Outer Centre Road importance 1/2 3 4/ /5 London Paris Berlin Vienna Copenhagen Average Figure 21: Proportion of off-peak when speed is below 65% of free-flow speed: cumulative distribution (2017) Figure 22: Proportion of off-peak when speed is below 65% of free-flow speed, by distance from city centre (2017) 100% 50% 75% 40% 30% 50% 20% 25% 10% 0% 0% 10% 20% 30% 40% 50% 60% 70% 80% 90% 100% % of off-peak time where speed<65% of free-flow speed 0% Distance from city centre (km) Page 29 of 80 Del Version 1.0
31 Jan Feb Mar Apr Mai Jun Jul Aug Set Oct Nov Dec Jan Feb Mar Apr May Jun Jul Aug Sep Oct Nov Dec Jan Feb Mar Apr May Jun Jul Aug Sep Oct Nov Dec Jan Feb Mar Apr May Jun Jul Aug Sep Oct Nov Dec % of off-peak time speed<65% of free-flow speed Figure 23: Proportion of off-peak when speed is below 65% of free-flow speed: maps (2017) Figure 24: Proportion of off-peak when speed is below 65% of free-flow speed: evolution % 30% 20% 10% 0% Page 30 of 80 Del Version 1.0
32 4.2. Proportion of time a road segment is congested: sensitivity analysis Indicators of congestion tend to be sensitive to their assumptions, which is particularly the case of the proportion of time a road segment is congested, which depends on three assumptions: the definitions of "peak period" and "free-flow speed" and the threshold value defining congestion. In this section, we compare the city zone/road type averages of the peak-time indicator analysed in Section 4.1 (the proportion of peak time when speed is below 65% of the free-flow speed - with free flow speed being the 66% percentile of all speeds) with the same indicator slightly changed to reflect different assumptions. All analyses refer to weekdays in We first tested different threshold values defining congestion: 50% and 75%, which, as previously mentioned, are the lower and upper limits of the range of values used by transport authorities around the world, as reported in the literature. The values of the indicator in London and Paris and in all central areas change substantially (Table 11). As an example, in the case of central areas in Paris, the original indicator (based on a 65% threshold speed) was 30% while the range of values obtained using 50% and 75% threshold speeds is 18%- 51%. In central areas in London the original indicator was 24% and the range of values is 9%-37%. The conclusion is that the magnitude of estimated congestion (and its implicit political implications) is highly dependent of changes in a single assumption. Table 11: Proportion of peak time when speed is below 50%-75% of free-flow speed, by zone and functional road classification (2017) Zone Inner Outer Centre Road importance 1/2 3 4/ /5 London Paris Berlin Vienna Copenhagen Average We then tested a different definition of peak period (6:00-9:00, 16:00:19:00), which, as the original definition, is also consistent with the results of the analysis of the time distribution of speeds done in Section 3.1 (see Figure 2). The resulting changes are minimal, always below a 2% increase/decrease (Table 12). Page 31 of 80 Del Version 1.0
33 Table 12: Proportion of (revised) peak time when speed is below 65% of free-flow speed, by zone and functional road classification (2017) Zone Inner Outer Centre Road importance 1/2 3 4/ /5 London Paris Berlin Vienna Copenhagen Average Finally, we tested a different definition of free-flow speed, defined as the maximum hourly speed, i.e. the average speed in the hour of the day when that average is highest. The average was calculated across all weekdays in This definition of free-flow speed retains an important property of free-flow speeds - it is based on performance characteristics of the road network in each city, and not on fixed night-time periods - and so it can be used as a common basis for defining free-flow speed across different cities. The changes in the estimated values in the Inner and Outer areas all cities are substantial (Table 13), with increases in estimated congestion of up to 28% (in the case of the Inner zone FRC1/2 roads in London) (comparing Table 13 with Table 9). The changes are much smaller in Outer areas in all cities, in some cases being only 0%-1% higher. The increases in estimated congestion are smaller in Copenhagen in all zones and road types. Table 13: Proportion of peak time when speed is below 65% of maximum hourly speed, by zone and functional road classification (2017) Zone Inner Outer Centre Road importance 1/2 3 4/ /5 London Paris Berlin Vienna Copenhagen Average Proportion of time speed is below a threshold The indicator measuring the proportion of time when speed is below a certain percentage of the free-flow speed does not take into account the fact that in some occasions congestion is acute and perceived by users more than proportionately than the reduction of speed - for example, when the speed goes below a certain threshold value of a very low speed. We tested two values for this threshold: 5 km/h (the usual speed for pedestrians) and 15km/h (the usual speed for cyclists and buses in urban areas). The 5km/h threshold did not produce interesting results, as its values approached 0 in most of the zones and road types in the five cities. Therefore, we present results only for the threshold of 15km/h. There is still a clear divide between London and Paris (which have higher values for the indicator) and the other three cities (Figure 25). The difference occurs in all zones and road Page 32 of 80 Del Version 1.0
34 Cumulative frequency % of peak time speed <15k/h types except FRC1 roads in Outer areas, where the indicator is low in all cities (Table 14). This last result reflects the high free-flow speeds in these road types of km/h (see Table 5), which decreases the probability that speeds decrease down to 15km/h and below. The segments with the highest values tend to be more spatially concentrated in Paris than in London (Figure 27). In all cities, the indicator decreases rapidly as we move away from the city centre, up to 4-6km from the centre, when it becomes stable (Figure 26). It also decreases slightly as we move from the Central to the Inner zone and then more substantially when we move to the Outer zone. In general, it also decreases as we move from less important to more important roads, once again reflecting differences in free-flow speeds. This indicator shows a clear evidence of an increase in congestion since In London the proportion of peak time when speed was below 15km/h grew from 1% to 10% and in Berlin, Vienna, and Copenhagen from almost nil to 3-5%. In Paris the indicator also increased from 9% in the beginning of 2016 to 13% at the end of There is also a seasonal decrease in the values of the indicators in August and December-January in all cities. Table 14: Proportion of peak time when speed is below 15km/h, by zone and functional road classification (2017) Zone Inner Outer Centre Road importance 1/2 3 4/ /5 London Paris Berlin Vienna Copenhagen Average Figure 25: Proportion of peak time when speed is below 15km/h: cumulative distribution (2017) Figure 26: Proportion of peak time when speed is below 15km/h, by distance from city centre (2017) 100% 50% 75% 40% 30% 50% 20% 25% 10% 0% 0% 10% 20% 30% 40% 50% 60% 70% 80% 90% 100% % of peak time where speed<15km/h 0% Distance from city centre (km) Page 33 of 80 Del Version 1.0
35 Jan Feb Mar Apr Mai Jun Jul Aug Set Oct Nov Dec Jan Feb Mar Apr May Jun Jul Aug Sep Oct Nov Dec Jan Feb Mar Apr May Jun Jul Aug Sep Oct Nov Dec Jan Feb Mar Apr May Jun Jul Aug Sep Oct Nov Dec % of peak time speed<15km/h Figure 27: Proportion of peak time when speed is below 15km/h: maps (2017) Figure 28: Proportion of peak time when speed is below 15km/h: evolution % 15% 10% 5% 0% Page 34 of 80 Del Version 1.0
36 4.4. Average delay The indicators analysed in Sections were based on speeds, i.e. the distance covered in a certain amount of time. A different way of representing the same data is to look at the time it takes to cover a certain distance. One possible indicator is the delay per km, estimated for each segment in each 5-minute period, as This indicator can assume any value, including negative values (i.e. real travel time below travel time with free flow speed). The segment-level indicators for each 5-minute period can then be averaged for longer periods. In this section, we report the results for the peak-period on weekdays during Most of the patterns of congestion found in the case of the speed-based indicators also apply for the delay. London and Paris are more congested than the other 3 cities (Figure 29), across all zones and road types (Table 15), although the spatial patterns of congestion are also more concentrated in Paris than in London (Figure 31). Delays decrease with distance from the city centre (Figure 30) and are higher in Inner than in Outer areas (Table 15). The only differences to the patterns found for speed-based indicators is that delays are highest in central areas and not in major roads (FRC1/2) in inner areas (Table 15), and that there is less evidence of an increase in congestion over time (Figure 32). Falcocchio and Levinson (2015, p.3) suggest that drivers start to perceive congestion when their trip time increases by around min/mile ( min/km) and become "acutely aware" of it when the trip time increases by min/mile ( min/km). Using these threshold values, our results suggest that on average, drivers perceive congestion in almost all trips in Central and Inner areas in the five cities, and in most trips in outer areas in London and Paris. They are also "acutely aware" of congestion in all trips in Central and Inner areas in London and Paris. However, these comparisons must be treated with caution as the values mentioned by Falcocchio and Levinson probably refer to overall trip times while our analysis refers to averages of times to cross road segments in given zones. It is also not clear whether those threshold values come from empirical analysis. Table 15: Average delay, by zone and functional road classification (2017) Zone Inner Outer Centre Road importance 1/2 3 4/ /5 London Paris Berlin Vienna Copenhagen Average Page 35 of 80 Del Version 1.0
 0.00 0 2 4 6 8 10 12 14 16 18 20 Distance from city centre (km) Figure 31: Average delay: maps (2017) Page 36 of 80 Del 3.4 - Version 1.")
37 Cumulative frequency Delay (mins/km) Figure 29: Average delay: cumulative distribution (2017) Figure 30: Average delay, by distance from city centre (2017) 100% % % % % Delay (minutes/km) Distance from city centre (km) Figure 31: Average delay: maps (2017) Page 36 of 80 Del Version 1.0
38 Jan Feb Mar Apr Mai Jun Jul Aug Set Oct Nov Dec Jan Feb Mar Apr May Jun Jul Aug Sep Oct Nov Dec Jan Feb Mar Apr May Jun Jul Aug Sep Oct Nov Dec Jan Feb Mar Apr May Jun Jul Aug Sep Oct Nov Dec Delay (min/km) Figure 32: Average delay: evolution Excess travel time The previous indicator expressed delays relative to segment length. An alternative approach is to use delays as a proportion of uncongested (free-flow) travel time. This indicator is known in the literature by different names. In this report we call it "excess travel time". Up to 2016, INRIX used a version of this indicator (the INRIX Travel Time Index) as its main indicator of congestion. The excess travel time, expressed as a percentage of the travel time with free flow speed, can be expressed, for each segment, in each 5-minute period, as An excess travel time of 20% means that, for example, a trip that takes 10 minutes in uncongested conditions (i.e. travelling at free-flow speeds) would take 12 minutes in congested conditions. The indicator can assume any value, including negative values (real travel time below travel time with free flow speed). Values above 100% represent the case when the real travel time is more than double the travel time with free flow speed. The segment-level indicators for all 5-minute periods are then averaged for a longer period. In this section, we report the results for the peak-period on weekdays during Some of the patterns of congestion found are similar to the ones found in the case of the speed-based indicators and the other travel time-based indicator (delay). London and Paris are more congested than the other 3 cities (Figure 33), across all zones and road types (Table 16), although the spatial patterns of congestion are also more concentrated in Paris than in London (Figure 35). Congestion decreases with distance from the city centre (Figure 34). There is no strong evidence of a trend in congestion since 2014 (Figure 35). Page 37 of 80 Del Version 1.0
39 Cumulative frequency Excess travel time Table 16: Excess travel time (%), by zone and functional road classification (2017) Zone Inner Outer Centre Road importance 1/2 3 4/ /5 London Paris Berlin Vienna Copenhagen Average Figure 33: Excess travel time (%): cumulative distribution (2017) Figure 34: Excess travel time (%), by distance from city centre (2017) 100% 50% 75% 40% 30% 50% 20% 25% 10% 0% 0% 25% 50% 75% 100% 125% 150% Excess travel time 0% Distance from city centre (km) Page 38 of 80 Del Version 1.0
 Figure 35: Excess travel time (%): maps (2017) Figure 36: Excess travel time (%): evolution 2014-2017 50% 40% 30% 20% 10% 0% 2014 2015 2016 2017 As mentioned above, the indicator can")
40 Jan Feb Mar Apr Mai Jun Jul Aug Set Oct Nov Dec Jan Feb Mar Apr May Jun Jul Aug Sep Oct Nov Dec Jan Feb Mar Apr May Jun Jul Aug Sep Oct Nov Dec Jan Feb Mar Apr May Jun Jul Aug Sep Oct Nov Dec Excess travel time (%) Figure 35: Excess travel time (%): maps (2017) Figure 36: Excess travel time (%): evolution % 40% 30% 20% 10% 0% As mentioned above, the indicator can assume negative values. The implication is that travelling at speeds higher than the free-flow speed reduces congestion - although this may not correspond to drivers' perceptions of congestion. The indicator can be revised to account for this by setting to 0 all the values when the travel time is above the free-flow travel time in a 5-minute period in a given segment. However, the impact on the estimated zone/frc aggregated indicators is minimal (compare Table 17 with Table 16). Page 39 of 80 Del Version 1.0
41 Table 17: (Revised) excess travel time (%), by zone and functional road classification (2017) Zone Inner Outer Centre Road importance 1/2 3 4/ /5 London Paris Berlin Vienna Copenhagen Average Intensity of congestion: synthesis Overall, the results of this section point to a higher intensity of congestion in London and Paris than in the other three cities, and a decrease in congestion with distance from the city centre and with road importance in all cities. The spatial patterns of congestion are different in London (less dispersed) and in Paris (more concentrated). The evolution of some of the indicators since 2014 suggests an increase in congestion in all cities. This is especially the case of the proportion of peak time when speed is below 15km/h. The evolution of the other indicators, especially the ones based on travel times, does not show such strong evidence of an upward trend. All indicators show a seasonal decrease in congestion in all cities in August and December-January. Table 18 and Table 19 synthesise the zone/road type information of Section 4. The values are the average of indicators of speed in the five cities, and come from Tables As expected, the proportion of time when speed is below 65% of the free-flow speed is lower in the off-peak than in the peak period. The values for the peak time vary about 10% when the threshold defining congestion is set at 50% or 75% of the free-flow speed. Modifying the definition of peak period has a minimal impact, but defining free-flow as the maximum hourly speed (rather than using the 66% percentile speed) inflates the indicator. In central areas, the proportion of peak time when speed in below 15km/h is higher than the proportion when speed is below 65% of the free flow speed. The delay and excess travel time indicators represent the same data from a different perspective (of travel time, not of speed). These indicators also account for the intensity of congestion in each moment (i.e. each 5-minute period), as they are based on differences between real and free-flow travel time, while the speed-based indicators classify each moment as either congested or not congested. The delay indicator emphasizes congestion in central areas, estimated to be above all other zones and road types, which does not happen in the other travel time-based indicators. The excess travel time indicator follows similar patterns to the speed-based indicators. Adjusting for periods when the real speed is above the free-flow speed has a minimal impact on the excess travel time indicator. Page 40 of 80 Del Version 1.0
42 Table 18: Speed-based indicators: synthesis Zone Inner Outer Centre Road importance 1/2 3 4/ /5 % peak time speed <65% free-flow speed % off-peak time speed <65% free-flow speed % peak time speed <50% free-flow speed % peak time speed <75% free-flow speed % (revised) peak time speed <65% free-flow speed % peak time speed <65% maximum speed % peak time speed<15km/h Values are the five-city averages, from Tables 9-14 Table 19: Travel time-based indicators: synthesis Zone Inner Outer Centre Road importance 1/2 3 4/ /5 Delay (min/km) Excess travel time Excess travel time (revised) Values are the five-city averages, from Tables Page 41 of 80 Del Version 1.0
43 5. Variability of congestion Trip time reliability is often more relevant than average speeds and delays, particularly for the freight and logistics sector, where reducing unpredictability is particularly important commercially. Private car users also prefer to keep moving rather than experience unexpected delays even if trip times are shorter in the latter case. From an economic and social point of view, cities can therefore be more disadvantaged by unreliable network performance than by low speeds. As cities move along the different stages of the transport policy trajectory, focusing first on vehicle-based, then to person-based indicators, travel time reliability becomes a major concern. In fact, an international comparison of transport appraisal methods in developed countries in 2013 concluded that "the focus of policy attention is shifting from travel time savings to journey reliability and quality and the effort to improve the appraisal system is responding to that development" (Mackie and Worsley 2013, p.8). In this report, we estimate indicators of variability of congestion at the segment level and define variability as inconsistent speeds on that segment on different days. The indicators measure aspects of the statistical distribution of speeds during The analysis is done for the peak-time period on weekdays Standard deviation of speeds The standard deviation is a general measure of dispersion of the statistical distribution of speeds. We estimated this measure for each road segment in the five cities, aggregating speeds in the peak period in all days in To adjust for the mean speeds of each segment, the standard deviation values are presented as a percentage of the mean. The two cities where congestion is more intense (London and Paris) are also the ones where congestion is more variable, that is, where standard deviations of speeds are higher, both overall (Figure 37) and across all zones and road types (Table 20). In all cities, the variability decreases with distance from the city centre (Figure 38) and as we move from Central to Inner and then to Outer areas, and, in general, from roads with more to less importance (Table 20). In the Outer zone in Vienna and Copenhagen (and to a lesser extent, also in London), the most important roads (FRC1) have less variable speeds than the second most important ones (FRC2). The maps in Figure 39 show that in Paris, the speed in the major ring roads is uniformly and highly variable. In London the circular roads also have variable speeds but not in all of their length - some segments are lower variability. Table 20: Standard deviation of speeds (% of mean), by zone and functional road classification (2017) Zone Inner Outer Centre Road importance 1/2 3 4/ /5 London Paris Berlin Vienna Copenhagen Average Page 42 of 80 Del Version 1.0
44 Cumulative frequency Standard deviation of speed (as % of mean) Figure 37: Standard deviation of speeds (% of mean): cumulative distribution (2017) Figure 38: Standard deviation of speeds (% of mean), by distance from city centre (2017) 100% 50% 75% 40% 30% 50% 20% 25% 10% 0% 0% 10% 20% 30% 40% 50% 60% 70% 80% 90% 100% Standard deviation of speeds (as % of mean) 0% Distance from city centre (km) Figure 39: Standard deviation of speeds (% of mean): maps (2017) Page 43 of 80 Del Version 1.0
45 Cumulative frequency Interquartile range (as % of median) 5.2. Interquartile range The interquartile range is another usual indicator of dispersion of a statistical distribution. It measures the difference between the third and first quartile of the distribution, i.e. the middle 50% of the distribution. Unlike the standard deviation, it is not affected by the presence of outliers - in this case, moments (i.e. 5-minute periods) when the speeds are unusually very high or very low. The interquartile range was calculated for each road segment, aggregating speeds in the peak period in all days in To adjust for the median speeds, the values are presented as a percentage of the median (but at the end of this section we also discuss the results obtained with the absolute value). The patterns are not very different from the ones obtained for the standard deviation: the interquartile range of speeds is higher in London and Paris, overall (Figure 40) and across all zones and road types (Table 21). In all cities, the variability decreases with distance from the city centre (Figure 41) and as we move from Central to Inner and then to Outer areas, and, in general, from roads with more to less importance (Table 21). In the Outer zones in all cities except Paris, the FRC1 roads have less variable speeds than the FRC2 ones. The maps (Figure 42) also show clearer spatial patterns of speed variability in Paris than in London. Table 21: Interquartile range of speeds (% of median), by zone and functional road classification (2017) Zone Inner Outer Centre Road importance 1/2 3 4/ /5 London Paris Berlin Vienna Copenhagen Average Figure 40: Interquartile range of speeds (% of median): cumulative distribution (2017) Figure 41: Interquartile range of speeds (% of median), by distance from city centre (2017) 100% 50% 75% 40% 30% 50% 20% 25% 10% 0% 0% 10% 20% 30% 40% 50% 60% 70% 80% 90% 100% Interquartile range of speeds (as % of median) 0% Distance from city centre (km) Page 44 of 80 Del Version 1.0
 speed.")
46 Figure 42: Interquartile range of speeds (% of median): maps (2017) The table below shows the results of the absolute measure (i.e. not expressed as a ratio to the median). This indicator is relevant because drivers may be aware of the absolute differences in speeds from one day to another but not associate those differences with the expected (i.e. mean) speed. Using this indicator, London has the lowest speed variability in the Central zone. In other zones, the indicators do not differ much across cities, although for the most important roads, Paris has by far the roads with the most variable speed. Table 22: Interquartile range of speeds (% of free-flow speed), by zone and functional road classification (2017) Zone Inner Outer Centre Road importance 1/2 3 4/ /5 London Paris Berlin Vienna Copenhagen Average Page 45 of 80 Del Version 1.0
47 5.3. Skew The indicators of dispersion do not capture any possible skewness in the statistical distribution of speeds, i.e. the existence of higher variability of speeds either above or below the median. This is particularly relevant when analysing road congestion as travellers are usually more concerned with not arriving late rather than with not arriving early, and so the variability of speeds below the median is more important than the variability above the mean. We use a quantile-based indicator of skewness of speeds, defined as In words, this indicator assesses whether the median is more distant from the first quartile or from the third quartile. A value above 1 means that values are more dispersed below the median than above the median (excluding the most extreme values i.e. the first and fourth quartile). Variants of this indicator were also estimated, using the 5% vs. 95% and 10% vs. 90% pairs of quantiles. The main analysis in this report is for the 25% vs. 75% version as it is more consistent with the interquartile range, which uses the same quantiles. While the interquartile range measures the dispersion of the distribution as the distance between the second and fourth quantiles, our indicator of skew measures whether there is any imbalance in the parts of that distance that are below and above the median. We also present the results of the 5% vs. 95% version of the indicator at the end of this section. Almost all the zone/road type aggregated values are above 1 (Table 23) which shows that the distributions of speed are skewed to the left, i.e. there is more dispersion below than above the median. This may reflect the fact that in practice speeds are bound by the legal speed limits, so there is less variation above the median. The skewness is especially noticeable in the most important roads in outer areas and it tends to increase with distance from the city centre (Figure 44) but is not usually spatially concentrated (Figure 45) There are no major differences across cities (Figure 43). Table 23: Skew (25%/75% percentile version), by zone and functional road classification (2017) Zone Inner Outer Centre Road importance 1/2 3 4/ /5 London Paris Berlin Vienna Copenhagen Average Page 46 of 80 Del Version 1.0
48 Cumulative frequency Skew Figure 43: Skew: cumulative distribution (2017) Figure 44: Skew, by distance from city centre (2017) 100% % % % % Skew Distance from city centre (km) Figure 45: Skew: maps (2017) The table below shows the results of the version of the indicator using the distances from the median to the 5% and the 95% percentile. The results show an even higher degree of Page 47 of 80 Del Version 1.0
49 skewness than the 25%/75% version. In particular, the indicator reaches very high values in the FRC1 roads in Outer areas. Table 24: Skew (5%/95% percentile version), by zone and functional road classification (2017) Zone Inner Outer Centre Road importance 1/2 3 4/ /5 London Paris Berlin Vienna Copenhagen Average % percentile of speeds The interquartile range and the 25%-75% skew indicator exclude the extremes of the statistical distribution of speeds. However, the lower extreme (i.e. the lowest speeds) is also relevant as an indicator of congestion. Van Lint et al. (2008) point to the fact that the distribution of travel times tends to be skewed and in some peak periods "the 5% most 'unlucky drivers' incur almost five times as much delay as the 50% most fortunate travelers". We use the 5% percentile of speeds as an indicator of the lower limit of speeds for a segment (i.e. we still exclude the 5% lowest speeds - understood as outliers). The 5% percentile was calculated for each road segment, aggregating speeds in the peak period in all days in To adjust for the median speeds, the values are presented as a percentage of the median (but at the end of this section we also present the results as percentages of the free-flow speed and as absolute values). London and Paris have the lowest values for the 5% speed percentiles, both overall (Figure 46) and across almost all zones and road types. In all cities, the values tend to increase with distance from the city centre (Figure 47), and as we move from the Central to Inner and Outer areas and from roads with less importance to those with more importance (Table 25). In all cities, the major ring roads have the lowest values (Figure 48). Table 25: 5% percentile of speeds (% of median), by zone and functional road classification (2017) Zone Inner Outer Centre Road importance 1/2 3 4/ /5 London Paris Berlin Vienna Copenhagen Average Page 48 of 80 Del Version 1.0
 100% 100% 75% 90% 80% 50% 70% 25% 60% 0% 0% 10% 20% 30% 40% 50% 60% 70% 80% 90% 100% 5% percentile speed (as % of median) 50% 0 2 4 6 8 10 12 14 16 18 20 Distance")
50 Cumulative frequency 5% percentile speed (as % of median) Figure 46: 5% percentile of speeds (% of median): cumulative distribution (2017) Figure 47: 5% percentile of speeds (% of median), by distance from city centre (2017) 100% 100% 75% 90% 80% 50% 70% 25% 60% 0% 0% 10% 20% 30% 40% 50% 60% 70% 80% 90% 100% 5% percentile speed (as % of median) 50% Distance from city centre (km) Figure 48: 5% percentile of speeds (% of median): maps (2017) The two tables below present the results using different units. In London and Paris, in the Central zone and in major roads in the Inner zone, the 5% percentile is only slightly higher, or smaller than half of the free-flow speed (Table 26). In those cities, in the Central zone and in Page 49 of 80 Del Version 1.0
51 some roads of the Inner zone, the 5% percentile of speeds is also lower than the usual speed of buses and cyclists (15km/h) (Table 27). Table 26: 5% percentile of speeds (% of free-flow speed), by zone and functional road classification (2017) Zone Inner Outer Centre Road importance 1/2 3 4/ /5 London Paris Berlin Vienna Copenhagen Average Table 27: 5% percentile of speeds (km/h), by zone and functional road classification (2017) Zone Inner Outer Centre Road importance 1/2 3 4/ /5 London Paris Berlin Vienna Copenhagen Average Variability of congestion: synthesis The main conclusion of this section is that the cities, zones, and road types where congestion is more intense are also the ones where congestion is more variable. There is also evidence in all cities that the distributions of speed are skewed to the left, i.e. there is more dispersion below than above the median. Table 28 synthesises the zone/road type information results of this section. The values are the average of indicators of speed in the five cities, and come from Tables The indicators consistently show that central areas and major roads in Inner and Outer areas tend to have the highest variability of speeds, i.e. highest standard deviations and interquartile ranges, highest skew indicators, and lowest 5% percentile of speeds. Page 50 of 80 Del Version 1.0
52 Table 28: Indicators of variability of congestion: synthesis Zone Inner Outer Centre Road importance 1/2 3 4/ /5 Standard deviation % of mean Interquartile range %median km/h Skew (median-25perc)/(75perc-median) (median-5perc)/(95perc-median) % percentile %median %free-flow speed km/h Values are the five-city averages, from Tables Page 51 of 80 Del Version 1.0

53 6. Trip-based indicators The indicators analysed in the previous sections were calculated for individual roads segments, and then aggregated for zones and road types, giving a representation of the average conditions in those zones and road types. However, travellers can choose routes comprising different road types and across different zones. In this section we re-estimate the main indicators of the previous sections based on (hypothetical) trips. We assume trips to the city centre from points in a regular 800m grid covering the Inner and Outer zones, excluding points more than 800m away from any segment in the dataset. In a GIS, we computed the fastest routes to the city centre, first using free-flow speeds in all segments and then using the average peak-time speeds. We then calculated, for each point in the grid, the total route length and travel time, the average speed, and indicators of congestion: the proportions of travel time when speed is below 65% of the free-flow speed and below 15km/h, the average delay, and the excess travel time. Finally, we aggregated the results for all the points in the Inner and Outer zones and for both zones. Figure 49: Trips to city centre: origins and destinations (London) Table 29 shows averages of trip length and time for trips to the city centre, by zone where the trip starts. Differences in length reflect the size of the zones and the existence of fast road corridors to the city centre. The second column shows the averages of the deviations between the trip lengths (on the road network) and the respective straight line distances from the grid points to the city centre. The values vary from 18% in the Inner zone in London to 50% in the Outer zone in Paris, values within the intervals usually found in the literature. Differences in trip times reflect the same factors as the trip length and also congestion along the routes to the centre. Trips from the Inner zone to the centre in London and Paris take longer than in Copenhagen, even though the trip length is shorter. The ranking of the cities in terms of congestion is related to their size: trips in London and Paris (the largest cities) have lower peak-time speeds and higher indicators of congestion, both when we consider speeds (Table 30) and travel times (Table 31). In all cities, trips starting in Outer zones have higher average speeds and lower indicators of congestion than trips starting in Inner zones. These differences between Inner and Outer zones are not as marked as in the analysis in the previous sections, when the zonal indicators were based on the aggregation of segments located in those zones (in this section they are based on the segments used by trips starting in those zones and ending in the city centre). As trips starting Page 52 of 80 Del Version 1.0
54 in the Outer zones and ending in the city centre have to cross the Inner zones, where congestion is higher, the indicators for Outer areas are more similar to the ones in Inner areas, comparing with the previous analysis. Table 29: Trips to city centre: length and time, by zone and functional road classification (2017) Average trip length (km) Deviation from straight line (%) Average trip time (mins.) Zone Inner Outer All Inner Outer All Inner Outer All London Paris Berlin Vienna Copenhagen Average Table 30: Trips to city centre: speeds and speed-based indicators, by zone and functional road classification (2017) Average peak-time speeds (km/h) % of travel time When speed<65% free-flow speed % of travel time when speed<15km/h Zone Inner Outer All Inner Outer All Inner Outer All London Paris Berlin Vienna Copenhagen Average Table 31: Trips to city centre: travel time-based indicators, by zone and functional road classification (2017) Average delay (km/min) Excess travel time (%) Zone Inner Outer All Inner Outer All London Paris Berlin Vienna Copenhagen Average The maps in the following pages show the geographic distribution of three trip-related indicators: average trip time, average speed, and excess travel time. A wide ring of points in the Outer zone in London have travel times above 40 minutes, but in the case of Paris, that only happens in the extreme northeast part of that zone (Figure 50). No areas in Vienna and Copenhagen, and only a few areas in Berlin have travel times above 30 minutes. Page 53 of 80 Del Version 1.0


55 The patterns with average speed (Figure 51) are uniform in all cities, with higher average speeds closer, then decreasing with distance to the centre. However, there are some corridors in the Outer areas with higher average speeds than others. For example, the eastern and western corridors in London have higher average speeds than the northern and southern corridors. In Paris and Vienna, speeds are also generally higher in the areas east of the centre than the areas west of the centre. The map with the excess travel times (Figure 52) show generally higher values in London and Paris than in other cities. The lowest values occur in some areas near the centre in London, Paris, and Berlin, in contrast with Vienna and Copenhagen, where they appear farther from the centre. Figure 50: Trips to city centre: travel time (maps) Page 54 of 80 Del Version 1.0


")


56 Figure 51: Trips to city centre: average speeds (maps) Figure 52: Trips to city centre: excess travel time (maps) Page 55 of 80 Del Version 1.0
57 7. Further analysis: London This section furthers the previous analyses by relating the INRIX Roadway Analytics speeds dataset with additional datasets in London, using a GIS. The objective is to test if and how the results change by refining the methods and relaxing some of the assumptions of our indicators. The section is divided into five sub-sections, incorporating speed limits in the calculation of the indicators, weighting indicators by traffic volumes and then by census data, disaggregating the indicators by the movement and place function of the road segments, and finally investigating the impacts of an intervention to redesign a road Incorporating speed limits In practice, road speeds depend on legal speed limits, which have an influence on the way we measure congestion, and on the policy implications of the results. If indicators of congestion do not take into account the legal speed limits, the implication is that reducing speed limits increases the estimated level of congestion. As congestion is usually portrayed as a "problem", this will downplay the fact that the reduction of the speed limits achieves several important objectives such as reducing collisions. On the other hand, places or periods with a high incidence of speeds above the speed limit have a low estimated level congestion, despite the losses in terms of road safety. In the analysis that follows, we used publicly available data from Transport for London (TfL) on speed limits in all roads in London. This data was matched with the INRIX speeds dataset using GIS to relate the location of the two sets of line data. Adjustments were made to account for the fact that some of the INRIX segments are aggregated across junctions while in the speed limits dataset there is a separate value for each section of the road between junctions. The matched dataset allows us to compare speed limits with reference and peak-time speeds. Figure 53 shows the cumulative distribution of the average speeds in segments with different speed limits. A considerable proportion of segments with high speed limits (80 and 97 km/h) have free-flow speeds and peak-time speeds above the limit. This also happens in the case of segments with the lowest speed limits (32 km/h) but only for the free-flow speeds, not the peak-time speeds. Almost all the segments with 48 and 64 km/h have speeds below the limit. The figure also shows that the higher the speed limit, the higher the speeds, although the difference between the 32 km/h and 48km/h segments is small. Page 56 of 80 Del Version 1.0
58 Cumulative frequency Cumulative frequency Figure 53: Speed limits vs. free-flow and peak-time speeds: cumulative distribution (London, 2017) Free-flow speed Peak-time speed 100% 100% 75% 75% 50% 50% 25% 25% 0% % Free-flow speed (km/h) Peak-time speed (km/h) Legal speed limit Above speed limit Legal speed limit Above speed limit Looking at zone averages (Table 32), the average free-flow speeds and peak-time speeds are always below the speed limits, in all three zones. The speeds in the 32km/h segments are only significantly lower than the speeds in the 48km/h segments in the Outer zone. Table 32: Speed limits vs. average free-flow and peak-time speeds (London, 2017) Speed limit Free-flow Speed (km/h) Centre Inner Outer Peak-time speed (km/h) Free-flow Speed (km/h) Peak-time speed (km/h) Free-flow Speed (km/h) Peak-time speed (km/h) (20mph) 32km/h (30mph) 48km/h (40mph) 64km/h (50mph) 80km/h (60mph) 97km/h We can also use the information on speed limits to test two further variations to the indicator measuring the proportion of time spent in congestion, analysed in Sections 4.1 and 4.2. These variants measure the proportion of peak time when speed is below 65% of the speed limit, and the proportion where speed is below 65% of the free-flow speed capped at the speed limit. We found that in the first case, the estimated proportion of time spent in congestion is much higher than when using the original indicator (Table 33). Once again, the conclusion is that the magnitude of the estimated congestion (and its implicit political implications) is highly dependent of changes in a single assumption. In the second variant, there is no impact on the values of the indicator in the Central and Inner zones, but some reductions in the Outer zone. Page 57 of 80 Del Version 1.0
59 Table 33: Proportion of time in congestion: incorporating speed limits (London, 2017) Zone Inner Outer Centre Road importance 1/2 3 4/ /5 % peak time speed <65% speed limit % peak time speed <65% free-flow speed (capped at the speed limit) % peak time speed <65% free-flow speed Last row: from Table Weighting by traffic volumes The indicators of congestion presented in the previous sections capture the average conditions across the road network. In this section, we weight the segment-level indicators by the volumes of traffic using those segments. This allows us to capture the average conditions for vehicles using the road network. If we disaggregate the traffic by mode of transport, we can also compute indicators that capture the average conditions for different types of vehicles (cars, buses, light goods vehicles (LGVs) and heavy goods vehicles (HGVs)). This analysis uses publicly available data from the UK Department for Transport The dataset contains the average annual daily flows by type of vehicle in the London road network. This data was matched with the INRIX speeds data using GIS to relate the location of the two sets of line data. Only the road segments with data on both traffic volumes and speeds were retained for analysis. Adjustments were also made to account for the fact that the aggregation of segments across junctions is different in both datasets (with the DfT data being more aggregated than the INRIX data). The matched dataset allows us to estimate the proportion of time the users of each type of vehicle spent travelling at different speeds (Figure 54). The figure aggregates all zones of the city and takes into account only roads with FRC above 4, due to gaps in the coverage of FRC4/5 roads. Across all modes, more than a quarter of the time (28%) is spent travelling at speeds below 20km/h and more than half of the time (56%) is spent travelling at speeds below 30km/h. These proportions are higher in the case of bus users, which also spent lower proportion of times travelling at speeds higher than 50km/h, comparing with other users. This result is explained by the different sets of roads used by car and bus users, with the latter using slower roads, on average. Page 58 of 80 Del Version 1.0
60 Figure 54: Proportion of time travelling at different speeds (London, 2017) 100% 80% 60% 40% 20% >50km/h km/h km/h km/h km/h <10 km/h 0% All traffic Car Bus LGV HGV We can then estimate weighted versions of all the indicators analysed in the other sections. Here we present the results for one of the main indicators: the proportion of peak time when speed is below 65% of the free-flow speed. Table 34 compares the weighted indicators with the unweighted one (from Table 9). Table 34: Proportion of time in congestion: weighting by traffic volumes (London, 2017) Zone Inner Outer Centre Road importance 1/2 3 4/ /5 All vehicles Cars Buses LGVs HGVs Unweighted Unweighted indicator: from Table 9. The indicators weighted by all vehicles are higher than the unweighted indicators across almost all zones and road types. This shows that on average, vehicles tend to use more congested road segments more often than less congested ones. These results are reasonable because levels of congestion are an effect of high traffic volumes. The more vehicles use on a road segment the closer the segment is to capacity, and so the higher the congestion. If road segments of the same type (i.e. same FRC) have comparable capacities, then it follows that the segments with more vehicles are more congested than segments with fewer vehicles. The only exception to the general pattern are FRC1 roads in the Outer zone (i.e. the parts of the M25 motorway crossing the London boundaries), where the weighted indicator is slightly smaller than the unweighted one. Comparing the indicators for the different transport modes, the indicator of congestion for buses is smaller than for other modes in the Central zone and major roads in the Inner zone, which probably reflects the existence of bus lanes in these zones/road types. This does not Page 59 of 80 Del Version 1.0
61 happen in the major roads in Outer areas. There are only minor differences between congestion for cars, LGVs, and HGVs. Overall, the results suggest that the unweighted indicators estimated for the five cities in the previous sections are underestimates of the real experience of congestion for an average vehicle using the road network, especially for private cars, LGVs and HGVs Weighting by census data We can also weight the trip-based indicators of congestion by the characteristics of the areas where the trips originate. We use publicly available data from the latest population census ( at the smallest area for which data is available (lower super output areas). The census data is from 2011, while the other datasets are for 2017, which is a limitation of the analysis. The analysis in Section 6 was rerun using as origins the centroids of the 25,053 census units in London. This allows us to weight indicators by the adult population, number of private cars, and population groups, using different segmentations. We first segmented the adult population according to job status (not employed or employed), and for the employed population, also by car and bus commuters. The second segmentation was according the number of cars in the household (0, 1 or 2 or more). Then we segmented the adult population by socio-economic occupation. The second column of Table 35 shows the proportions of adult population, vehicles, and population segments that are in the centre (and so are not considered in the other indicators, which are based on trips to the city centre). The other columns show the average length and time of trips to the city centre on the road network, estimated using the same methods as in Section 6. Bus commuters and households with no cars have a higher propensity to live in the centre, and when they live outside, to have shorter trip lengths and durations to the centre, comparing with car commuters, and households with cars. Workers in occupations with higher socio-economic status have higher propensity to live in or closer to the centre. However, the average travel time to the centre is almost the same for all socio-economic groups. The last row of the table shows the unweighted values, i.e. the ones that were obtained using the grid-base approach in Section 6 (from Table 29). As expected, the proportion of gridpoints located in the centre is much higher than the proportion of population as much of the centre is non-residential. The proportion of population living in the centre is also higher than the proportion of vehicles, given the lower car ownership of residents in the centre. Trip lengths and times weighted by population are smaller than the ones based on the grid approach and lower than lengths and times weighted by vehicles. Table 36 shows peak-time speeds and indicators of congestion weighted by population, vehicles, and the different population groups. There are few differences. In particular, the proportion of time with speed below 65% of the free-flow speed, and the excess travel time indicator are virtually the same for all the different weights. Car commuters and individuals in households with cars travel at a slightly higher speed and face slightly smaller delays than bus commuters and individuals in 0-car households. The unweighted values in the last row come from Table 30 and Table 31. The unweighted peak-time speeds are higher than the Page 60 of 80 Del Version 1.0
62 Socio-economic occupation cars weighted ones, but the indicators of congestion are also higher, with the exception of the proportion of travel time with speed below 15km/h. It should be emphasized that differences among groups are explained by differences in patterns of residence location. For example, the results show that on average, bus users tend to live in areas where average speeds of trips to the city centre are smaller, on average, than average speeds of the same type of trips from the areas where car users live. This confirms the results of the previous section, which showed that on average, bus users use slower roads than car users. Table 35: Location in the centre, and length/ time of trips to the centre, weighted by census data (London) Centre (%) Trip to centre: Length (km) Trip to centre: Time (mins.) Population (>16) All vehicles Not employed Employed Bus commuter Car commuter Higher Managerial, Administrative and Professional Lower Managerial, Administrative and Professional Intermediate Small Employers and Own Account Workers Lower Supervisory and Technical Semi-Routine Routine Unweighted (grid) Unweighted indicators: from Table 30 Page 61 of 80 Del Version 1.0
 Excess travel time (%) Population (>16) 23.6 19 9 0.44 24 All vehicles 24.1 19 8 0.43 24 Not employed 23.6 19 9 0.43 24 Employed 23.6 19 9 0.44 24 Bus commuter 23.")


63 Socio-economic occupation cars Table 36: Peak-time speeds and indicators of congestion for trips to the centre, weighted by census data (London) Peak-time speeds (km/h) % of time speed <65% free-flow speed % of time speed< 15km/h Average delay (km/min) Excess travel time (%) Population (>16) All vehicles Not employed Employed Bus commuter Car commuter Higher Managerial, Administrative and Professional Lower Managerial, Administrative and Professional Intermediate Small Employers and Own Account Workers Lower Supervisory and Technical Semi-Routine Routine Unweighted (grid) Unweighted indicators: from Tables 30 and 31 The maps below show three of the trip-based indicators estimated at the census unit level, providing a more detailed representation of the geographic distribution of those indicators, compared with the grid-based maps shown in Figures A wide ring of points in the Outer zone in London have travel times above 40 minutes. Travel times increase and average speeds increase with distance to the centre, but this pattern is not uniform in all directions, as the increase is higher in the northern and southern corridors to the centre than in the western and eastern corridors. The pattern of excess time travel is less regular, however, with the lowest values occurring in Inner areas near the centre. Figure 55: Trip-based indicators, by census unit (London) Travel time (mins.) Average speed (km/h) Excess travel time (%) Page 62 of 80 Del Version 1.0

64 M1 MOVEMENT M2 M3 M1 M2 M Disaggregating by movement and place function of the road The analysis in the previous sections relied on a road classification which takes into consideration only the movement function of the roads. As it is clear from Table 2, the INRIX functional road classification (FRC) classifies roads on the basis of what they connect. However, in urban areas roads also have a "place" function, for example, for parking and loading, and as public spaces where people shop, relax, and socialize. To account for this function, Transport for London (TfL) developed a two-dimensional classification with 9 types of roads/streets according to their significance for the movement and place functions, each scored from 1 (local significance) to 3 (strategic significance). It is expected that the type of users and the speeds differ in those 9 types of roads/streets (Figure 56). Figure 56: The road/street type matrix: expected types of users and speeds (London) P1 P2 P3 Source: adapted from TFL: (2013, Chapter 2, part I, p.95) A GIS dataset with the classification of each road/street in London in the movement and place matrix was provided by TfL to the authors for the purposes of this report. This data was matched with the INRIX speeds data to relate the location of the two sets of line data. Adjustments were made to account for the fact that some of the INRIX segments are aggregated across junctions while in the movement and place dataset there is a separate value for each section of the road between junctions. As shown in the table below, only a small minority of the segments in the INRIX Roadway Analytics dataset have Place significance higher than 1 (the minimum level). Roads with Place Level 2 or 3 are particularly rare when the Movement significance is 1 (the minimum). Table 37: Number of road segments in London, by movement and place function (%) P1 P2 P3 PLACE Table 38 shows the free-flow and average peak-time speeds analysed in the previous sections but now aggregated according to their classification in the Movement and Place Page 63 of 80 Del Version 1.0
65 M1 M1 MOVEMENT M2 M3 MOVEMENT M2 M3 matrix. The results are given in km/h, to be comparable with the other results in this report, and also in miles per hour, to be comparable with the TfL indicative speeds shown in Figure 56. In roads with low place significance (Level 1), the free-flow and average peak-time speeds increase as the movement significance increase, especially when we go from Movement Level 2 to Level 3. This does not happen in roads with Place Levels 2 and 3. Both free-flow speed and average speeds decrease substantially when we move from Place Level 1 to 2, for all Movement levels, but not when we move from Place Level 2 to 3. Table 38: Speeds by movement and place function of the road (London, 2017) Free-flow speed P1 P2 P3 PLACE Average peak-time speed P1 P2 P3 PLACE 44 km/h (27 mph) 26 km/h (16 mph) 22 km/h (14 mph) 37 km/h (23 mph) 19 km/h (12 mph) 17 km/h (11 mph) 34 km/h (21 mph) 28 km/h (17 mph) 23 km/h (14 mph) 28 km/h (17 mph) 21 km/h (13 mph) 17 km/h (11 mph) 31 km/h (19 mph) 23 km/h (14 mph) 25 km/h (16 mph) 26 km/h (16 mph) 18 km/h (11 mph) 20 km/h (12 mph) These results are consistent with the hypothesis of a Stage 3 transport policy, if we consider that a higher level of service for movement implies faster speeds for motorised modes but a higher level of service for place implies slower speeds for motorised modes. There is extensive evidence that the place function is negatively affected by the presence of motorised vehicles moving at fast speeds, especially in the case of people using the streets for shopping, relaxing and socializing (Gehl 2010). The results in Table 38 suggest that the London road network provides a better level of service for movement (i.e. higher speeds for motorised traffic) in roads with higher significance of the movement function and no conflicts with the place function (i.e. when the place function has level 1). At the same time, the network provides a better level of service for place (i.e. lower speeds for motorised traffic) when the place function becomes more significant (i.e. when the place function has level higher than 1) regardless of the significance for movement. This suggests a priority for the place function, which is consistent with our hypothesis of a Stage 3 policy putting city life and wellbeing first. When comparing the results with the matrix in Figure 56, it is also clear that both the theoretical (i.e. free-flow) speeds and the actual peak-time speeds are always below the values suggested by TfL for the different types of roads. The priority to the place function has some impact on the indicators of congestion, as shown in Table 39. When the significance of the place function is higher than the minimum, congestion increases drastically, as measured by the proportions of peak time when the speed is below 65% of the free-flow and below 15kph. This shows that the city is willing to offer a lower level of provision for the movement of motorised modes (by increasing congestion) in exchange for a higher level of provision for place activities (by reducing speeds). The reduction of speeds can be understood here as a positive indicator of road performance, as it encourages the place function. In fact, in places with the higher place function (Levels 2 and 3), there is high proportion of time when motorised modes move at Page 64 of 80 Del Version 1.0
66 M1 M1 MOVEMENT M2 MOVEMENT M2 M3 M3 speeds below 15 kph, i.e. the speed of non-motorised modes such as bicycles. These results strengthen our view, developed in the previous report (Jones and Anciaes 2018) that road congestion is only one of the relevant indicators of the performance of the road network in Stage 3 cities, as it needs to be interpreted alongside indicators that assess the provision for the place function of roads. Table 39: Indicators of congestion by movement and place function of the road (London, 2017) Proportion of peak time when speed<65% free-flow speed P1 P2 P3 PLACE Proportion of peak time when speed<15 kph P1 P2 P3 PLACE Effect of road design on speeds The last section suggested that low speeds for motorised vehicles in some parts of London may be a result of policies to improve the conditions of pedestrians and cyclists, and encourage place-related activities, in other words, a result of "Stage 3 policies". This section looks at the evolution of speeds before and after a project to redesign a road in Central London: Blackfriars Road. This road is an important link for pedestrians (as it includes the Southwark underground station and connects with one of the bridges crossing the Thames) and for cyclists (as it carries the North-South Cycle Superhighway). There are also important place activities, such as waiting at bus stops. The road redesign project created new cycling infrastructure, separated from motorised traffic. This also benefited pedestrians as it reduced the incidence of cyclists encroaching on pedestrian space (left side of Figure 57). In some sections, conditions for pedestrians crossing the road were also improved, by adding a central reservation (right side of the figure). Overall, a large proportion of space was reallocated from motorised vehicles to non-motorised modes of transport. The main phase of the implementation of the project was from April 2015 to February Page 65 of 80 Del Version 1.0
 and on the other roads in Central London.")

.")

67 Sep.2017 May 2015 Figure 57: Blackfriars Road improvement: before and after Source of images: Google Maps Figure 58 and Figure 59 show the evolution of average peak-time speeds and the proportion of time when speeds were below 15km/h on Blackfriars Road, nearby roads (up to 1km away) and on the other roads in Central London. We include the set of nearby roads in the analysis to investigate any possible network effects from changes in the conditions on Blackfriars Road. The samples consist of 15 road segments in Blackfriars Road, 326 segments in nearby roads, and 1172 segments in the rest of Central London. The smaller charts in the bottom part of the two figures show the 3-month moving average of the same variables as in the top part, which allow for a better visualisation of the trends. Before the implementation of the project, the average peak-time speeds on Blackfriars Road and on nearby roads were higher than on other roads in Central London (Figure 58). During the implementation of the project, the speeds become lower on Blackfriars Road than in the rest of Central London (due to road works). During that period, speeds also decreased in Central London, but on Blackfriars Road they decreased even more. After the implementation, speeds increased slightly on Blackfriars Road, but at about the same rate as in the rest of Central London. In December 2017, speeds on Blackfriars Road were considerable lower than they were before the project. Speeds on roads near Blackfriars Road were only slightly higher than those in the rest of Central London in December 2017, while before the project was implemented they were much higher. This may reflects increased traffic on those roads, diverted from Blackfriars Road, decreasing speeds. Page 66 of 80 Del Version 1.0
World Leading Traffic Analysis
 World Leading Traffic Analysis Over the past 25 years, has worked closely with road authorities and traffic managers around the world to deliver leading traffic monitoring equipment. With products now
Neighborhood Influences on Use of Urban Trails
 Neighborhood Influences on Use of Urban Trails Greg Lindsey, Yuling Han, Jeff Wilson Center for Urban Policy and the Environment Indiana University Purdue University Indianapolis Objectives Present new
D2.1 Urban Congestion and Network Operation: Towards a Broader Set of Metrics for Assessing Performance
 Congestion Reduction in Europe: Advancing Transport Efficiency MG-5.3-2014 Tackling urban road congestion D2.1 Urban Congestion and Network Operation: Towards a Broader Set of Metrics for Assessing Performance
KC Scout Kansas City s Bi-State Transportation Management Center
 KC Scout Kansas City s Bi-State Transportation Management Center Operations Report May 216 This report contains statistical and operational data of activities at the Scout TMC for the period Sunday, May
Using GPS Data for Arterial Mobility Performance Measures
 Using GPS Data for Arterial Mobility Performance Measures Paul Czech, MnDOT Shawn Turner, TTI CTS Research Conference May 22, 2014 ~ St. Paul, MN Methodology & Results INRIX GPS Data + = Road Inventory
Appendix ELP El Paso, Texas 2003 Annual Report on Freeway Mobility and Reliability
 (http://mobility.tamu.edu/mmp) Office of Operations, Federal Highway Administration Appendix ELP El Paso, Texas 2003 Annual Report on Freeway Mobility and Reliability This report is a supplement to: Monitoring
TomTom South African Congestion Index
 TomTom South African Congestion Index Disclaimer All copyrights, commercial rights, design rights, trademarks and other elements considered intellectual property that are published in this report are reserved
A review of 2015 fatal collision statistics as of 31 December 2015
 A review of fatal collision statistics as of 31 December This report summarises the main trends in road fatalities that have emerged in. This has been prepared by the Road Safety Authority following analysis
Child Road Safety in Great Britain,
 Child Road Safety in Great Britain, 21-214 Bhavin Makwana March 216 Summary This short report looks at child road casualties in Great Britain between 21 and 214. It looks at how children travel, the geographical
Urban Transport Policy-making changing perspectives and consequences
 Urban Transport Policy-making changing perspectives and consequences Peter Jones, UCL ITLS, University of Sydney, 28 th March 2018 Overview Changing urban transport policy perspectives From car-based to
Bicycle Crashes. Number of Bike Crashes. Total Bike Crashes. are down 21% and severe bike crashes down 8% since 2013 (5 years).
.") Bicycle Crashes The City of Fort Collins is well known for its bike culture, and there is a strong focus on encouraging increased riding. Bike safety is an important component of supporting these efforts.
Bicycle Crashes The City of Fort Collins is well known for its bike culture, and there is a strong focus on encouraging increased riding. Bike safety is an important component of supporting these efforts.
KC Scout Kansas City s Bi-State Transportation Management Center
 KC Scout Kansas City s Bi-State Transportation Management Center Operations Report August- 215 This report contains statistical and operational data of activities at the Scout TMC for the period Saturday,
Auckland Transport Monthly Indicators Report 2018/19
 Attachment 1 Auckland Transport Monthly Indicators Report 218/19 August 218 Table of Contents Page 2. 1. Summary of indicators 1.1 SOI performance measures 1.2 AT Metro patronage breakdown 2. Monthly indicators
Chapter 5 FUNCTIONAL CLASSIFICATION
 Chapter 5 FUNCTIONAL CLASSIFICATION Functional classification is a system by which streets and roadways may be distinguished by types according to their function within the entire transportation network.
For Information Only. Pedestrian Collisions (2011 to 2015) Resolution. Presented: Monday, Apr 18, Report Date Tuesday, Apr 05, 2016
 Resolution. Presented: Monday, Apr 18, Report Date Tuesday, Apr 05, 2016") Presented To: Operations Committee For Information Only Pedestrian Collisions (0 to 0) Presented: Monday, Apr 8, 06 Report Date Tuesday, Apr 0, 06 Type: Correspondence for Information Only Resolution For
Presented To: Operations Committee For Information Only Pedestrian Collisions (0 to 0) Presented: Monday, Apr 8, 06 Report Date Tuesday, Apr 0, 06 Type: Correspondence for Information Only Resolution For
Understanding Rider Differences in Mileage and Riding Frequency through the MSF100 Motorcyclists Naturalistic Study.
 2/18/216 Understanding Rider Differences in Mileage and Riding through the MSF1 Motorcyclists Naturalistic Study January 13, 214 Mac McCall Shane McLaughlin Motorcycle Research Group 1 Overview Objective
Introduction. Bus priority system. Objectives. Description. Measure title: City: Malmo Project: SMILE Measure number: 12.7
 Bus priority system A Introduction To improve public transport in the urban and suburban area of Malmö bus priority systems were implemented in 42 intersections (appendix 12.7 Signal Map). The intersections
Appendix SEA Seattle, Washington 2003 Annual Report on Freeway Mobility and Reliability
 (http://mobility.tamu.edu/mmp) Office of Operations, Federal Highway Administration Appendix SEA Seattle, Washington 2003 Annual Report on Freeway Mobility and Reliability This report is a supplement to:
COMPARISON OF FIXED & VARIABLE RATES (25 YEARS) CHARTERED BANK ADMINISTERED INTEREST RATES - PRIME BUSINESS*
 CHARTERED BANK ADMINISTERED INTEREST RATES - PRIME BUSINESS*") COMPARISON OF FIXED & VARIABLE RATES (25 YEARS) Fixed Rates Variable Rates FIXED RATES OF THE PAST 25 YEARS AVERAGE RESIDENTIAL MORTGAGE LENDING RATE - 5 YEAR* (Per cent) Year Jan Feb Mar Apr May Jun Jul
COMPARISON OF FIXED & VARIABLE RATES (25 YEARS) Fixed Rates Variable Rates FIXED RATES OF THE PAST 25 YEARS AVERAGE RESIDENTIAL MORTGAGE LENDING RATE - 5 YEAR* (Per cent) Year Jan Feb Mar Apr May Jun Jul
Performance Measure Summary - San Jose CA. Performance Measures and Definition of Terms
 Performance Measure Summary - San Jose CA There are several inventory and performance measures listed in the pages of this Urban Area Report for the years from 1982 to 2014. There is no single performance
Performance Measure Summary - Chicago IL-IN. Performance Measures and Definition of Terms
 Performance Measure Summary - Chicago IL-IN There are several inventory and performance measures listed in the pages of this Urban Area Report for the years from 1982 to 2014. There is no single performance
Performance Measure Summary - Denver-Aurora CO. Performance Measures and Definition of Terms
 Performance Measure Summary - Denver-Aurora CO There are several inventory and performance measures listed in the pages of this Urban Area Report for the years from 1982 to 2014. There is no single performance
Traffic Safety Basic Facts 2008
 More than 5.000 people died in road traffic accidents involving HGVs in 2006 1 (EU-14 plus the Czech Republic, Estonia, Hungary Malta and Poland) Traffic Safety Basic Facts 2008 and Buses (HGVs) are defined
DUNBOW ROAD FUNCTIONAL PLANNING
 DUNBOW ROAD FUNCTIONAL PLANNING Final Report August 3, 216 #31, 316 5th Avenue NE Calgary, AB T2A 6K4 Phone: 43.273.91 Fax: 43.273.344 wattconsultinggroup.com Dunbow Road Functional Planning Final Report
KEY PERFORMANCE INDICATORS FOR URBAN ITS
 KEY PERFORMANCE INDICATORS FOR URBAN ITS I. Kaparias, M. Bell Imperial College London N. Eden, A. Gal-Tzur Technion Israel Institute of Technology A. Tsakarestos, M. Gerstenberger Technische Universität
1999 On-Board Sacramento Regional Transit District Survey
 SACOG-00-009 1999 On-Board Sacramento Regional Transit District Survey June 2000 Sacramento Area Council of Governments 1999 On-Board Sacramento Regional Transit District Survey June 2000 Table of Contents
Assessment of Guide Reporting & Preliminary Results of Lion Monitoring
 Assessment of Guide Reporting & Preliminary Results of Lion Monitoring Mara Predator Project December 21 Sara Blackburn Laurence Frank maralions@gmail.com lgfrank@berkeley.edu SUMMARY The Mara Predator
3 ROADWAYS 3.1 CMS ROADWAY NETWORK 3.2 TRAVEL-TIME-BASED PERFORMANCE MEASURES Roadway Travel Time Measures
 ROADWAYS Approximately 6 million trips are made in the Boston metropolitan region every day. The vast majority of these trips (80 to percent, depending on trip type) involve the use of the roadway network
Hard Shoulder Running is a valuable tool July 14, Dean H. Gustafson, PE, PTOE State Operations Engineer VDOT Operations Division
 Hard Shoulder Running is a valuable tool July 14, 2016 Dean H. Gustafson, PE, PTOE State Operations Engineer VDOT Operations Division Virginia 2 VDOT s Statewide Operations Program Operations Statistics
TomTom European Congestion Index
 TomTom European Congestion Index Disclaimer All copyrights, commercial rights, design rights, trademarks and other elements considered intellectual property that are published in this report are reserved
Truck Climbing Lane Traffic Justification Report
 ROUTE 7 (HARRY BYRD HIGHWAY) WESTBOUND FROM WEST MARKET STREET TO ROUTE 9 (CHARLES TOWN PIKE) Truck Climbing Lane Traffic Justification Report Project No. 6007-053-133, P 101 Ι UPC No. 58599 Prepared by:
95 Express Annual Operations Report: Fiscal Year
 95 Express Annual Operations Report: Fiscal Year 2014-2015 General The 95 Express Program completed its sixth full Fiscal Year of operations in June 2015. For the FDOT, its Fiscal Year (FY) is from July
Appendix LOU Louisville, Kentucky 2003 Annual Report on Freeway Mobility and Reliability
 (http://mobility.tamu.edu/mmp) Office of Operations, Federal Highway Administration Appendix LOU Louisville, Kentucky 2003 Annual Report on Freeway Mobility and Reliability This report is a supplement
Improving the Bus Network through Traffic Signalling. Henry Axon Transport for London
 Improving the Bus Network through Traffic Signalling Henry Axon Transport for London Improving the Bus Network through Traffic Signalling Introduction Transport for London (TfL) operates the most frequent
Appendix MSP Minneapolis-St. Paul, Minnesota 2003 Annual Report on Freeway Mobility and Reliability
 (http://mobility.tamu.edu/mmp) Office of Operations, Federal Highway Administration Appendix MSP Minneapolis-St. Paul, Minnesota 2003 Annual Report on Freeway Mobility and Reliability This report is a
Road Traffic Estimates
 Road Traffic Estimates Methodology Note An annual series of road traffic estimates are published by the Department for Transport, approximately 6 months after the end of the reference year. Data Collection
Appendix B: Forecasting and Traffic Operations Analysis Framework Document
 Existing Conditions Report - Appendix Appendix B: Forecasting and Traffic Operations Analysis Framework Document This document defines the methodology and assumptions that will be used in the traffic forecasting
Appendix PIT Pittsburgh, Pennsylvania 2003 Annual Report on Freeway Mobility and Reliability
 (http://mobility.tamu.edu/mmp) Office of Operations, Federal Highway Administration Appendix PIT Pittsburgh, Pennsylvania 2003 Annual Report on Freeway Mobility and Reliability This report is a supplement
2015 Victorian Road Trauma. Analysis of Fatalities and Serious Injuries. Updated 5 May Page 1 of 28. Commercial in Confidence
 2015 Victorian Road Trauma Analysis of Fatalities and Serious Injuries Updated 5 May 2016 Page 1 of 28 Commercial in Confidence VICROADS_n3445896_2015_Victorian_Trauma_Report_- _updated_may_2016.docx 2015
 Siła-Nowicka, K. (2018) Analysis of Actual Versus Permitted Driving Speed: a Case Study from Glasgow, Scotland. In: 26th Annual GIScience Research UK Conference (GISRUK 2018), Leicester, UK, 17-20 Apr
Auckland Transport Monthly Indicators Report 2018/19
 Attachment 1 Auckland Transport Monthly Indicators Report 218/19 October 218 Table of Contents Page 2. 1. Summary of indicators 1.1 SOI performance measures 1.2 AT Metro patronage breakdown 2. Monthly
2011 Origin-Destination Survey Bicycle Profile
 TRANS Committee 2011 Origin-Destination Survey National Capital Region December 2012 TRANS Committee Members: City of Ottawa, including OC Transpo Ville de Gatineau Société de transport de l Outaouais
Progress Report on the Design and Planning of an Infrastructure Improvement Project for the Sunnyside TIF District (Phase II)
") Presentation to the CNRC Board of Directors Regular Meeting March 11, 2015 1 Agenda Preferred Alternate Refinement for University Avenue, 3rd Street, and Beverly Avenue Intersection Improvements validate
Presentation to the CNRC Board of Directors Regular Meeting March 11, 2015 1 Agenda Preferred Alternate Refinement for University Avenue, 3rd Street, and Beverly Avenue Intersection Improvements validate
Danish gambling market statistics Third quarter, 2017
 Danish gambling market statistics Third quarter, Third Quarter, 7. december Third Quarter, Danish gambling market statistics 1 Indhold A. Introduction... 2 B. Quarterly market statistics for the Danish
Integrated Regional Traffic Management. Michael Aherne Technical Director POLIS Conference 2009
 Integrated Regional Traffic Management Michael Aherne Technical Director POLIS Conference 2009 M50 finish Public Transport and Pedestrians College Green The Spatial Perspective What Could has
Integrated Corridor Approach to Urban Transport. O.P. Agarwal World Bank Presentation at CODATU XV Addis Ababa, 25 th October 2012
 Integrated Corridor Approach to Urban Transport O.P. Agarwal World Bank Presentation at CODATU XV Addis Ababa, 25 th October 2012 What is the Integrated Corridor Approach for Urban Transport Public? Why
TRANSPORTATION ANALYSIS REPORT US Route 6 Huron, Erie County, Ohio
 TRANSPORTATION ANALYSIS REPORT US Route 6 Huron, Erie County, Ohio December 12, 2012 Prepared for: The City of Huron 417 Main Huron, OH 44839 Providing Practical Experience Technical Excellence and Client
Appendix PDX Portland, Oregon 2003 Annual Report on Freeway Mobility and Reliability
 (http://mobility.tamu.edu/mmp) Office of Operations, Federal Highway Administration Appendix PDX Portland, Oregon 2003 Annual Report on Freeway Mobility and Reliability This report is a supplement to:
2014 QUICK FACTS ILLINOIS CRASH INFORMATION. Illinois Emergency Medical Services for Children February 2016 Edition
 2014 QUICK FACTS ILLINOIS CRASH INFORMATION February 2016 Edition Illinois Emergency Medical Services for Children www.luhs.org/emsc Illinois Emergency Medical Services for Children TABLE OF CONTENTS
2012 QUICK FACTS ILLINOIS CRASH INFORMATION. Illinois Emergency Medical Services for Children September 2014 Edition
 2012 QUICK FACTS ILLINOIS CRASH INFORMATION September 2014 Edition Illinois Emergency Medical Services for Children www.luhs.org/emsc Illinois Emergency Medical Services for Children TABLE OF CONTENTS
MEMORANDUM. City Constituents. Leilani Schwarcz, Vision Zero Surveillance Epidemiologist, SFDPH
 MEMORANDUM TO: FROM: CC: City Constituents Leilani Schwarcz, Vision Zero Surveillance Epidemiologist, SFDPH Megan Wier, Co-Chair, San Francisco Vision Zero Task Force, SFDPH Commander Ann Mannix, Traffic
Existing Conditions. Date: April 16 th, Dan Holderness; Coralville City Engineer Scott Larson; Coralville Assistant City Engineer
 Date: April 16 th, 2015 To: From: Re: Dan Holderness; Coralville City Engineer Scott Larson; Coralville Assistant City Engineer Darian Nagle-Gamm, Traffic Engineering Planner Highway 6 (2 nd Street) /
CAPACITY ESTIMATION OF URBAN ROAD IN BAGHDAD CITY: A CASE STUDY OF PALESTINE ARTERIAL ROAD
 VOL. 13, NO. 21, NOVEMBER 218 ISSN 1819-668 26-218 Asian Research Publishing Network (ARPN). All rights reserved. CAPACITY ESTIMATION OF URBAN ROAD IN BAGHDAD CITY: A CASE STUDY OF PALESTINE ARTERIAL ROAD
Determining bicycle infrastructure preferences A case study of Dublin
 *Manuscript Click here to view linked References 1 Determining bicycle infrastructure preferences A case study of Dublin Brian Caulfield 1, Elaine Brick 2, Orla Thérèse McCarthy 1 1 Department of Civil,
Planning Daily Work Trip under Congested Abuja Keffi Road Corridor
 ISBN 978-93-84468-19-4 Proceedings of International Conference on Transportation and Civil Engineering (ICTCE'15) London, March 21-22, 2015, pp. 43-47 Planning Daily Work Trip under Congested Abuja Keffi
motor vehicle collisions
 motor vehicle collisions 2017 2017 QUICK FACTS City of Edmonton motor vehicle collisions 2017 legal note The City of Edmonton provides this information in good faith but gives no warranty, nor accepts
Bicycle and Pedestrian Level of Service Evaluation
 Bicycle and Pedestrian Level of Service Evaluation June 214 Florida Department of Transportation Bicycle and Pedestrian Evaluation Prepared by Sprinkle Consulting Cambridge Systematics For the Florida
Traffic Safety Plan Traffic Safety Plan 2015
 Traffic Safety Plan 2015 Purpose Airdrie s last Traffic Safety Plan was created in 2011. The 2015 Traffic Safety Plan is a revised model of the traffic operations for the City of Airdrie. The purpose of
100 Most Congested Roadways in Texas
 100 Most Congested Roadways in Texas 2017 EXECUTIVE SUMMARY In response to increased roadway congestion throughout the state, in 2009 the Texas Legislature mandated that the Texas Department of Transportation
WIM #36 MN 36 MP 15.0 LAKE ELMO APRIL 2014 MONTHLY REPORT
 WIM #36 MN 36 MP 15.0 LAKE ELMO APRIL 2014 MONTHLY REPORT In order to understand the vehicle classes and groupings, the MnDOT Vehicle Classification Scheme and the Vehicle Class Groupings for Forecasting
PUBLIC INQUIRY QUESTION
 M4 Corridor around Newport PUBLIC INQUIRY QUESTION REFERENCE NO. : PIQ/091 RAISED BY: Tim Gent of St Modwens DATE: 09/05/2017 RESPONDED BY: Bryan Whittaker and Stephen Bussell DATE: 15/05/2017 SUBJECT:
ENHANCED PARKWAY STUDY: PHASE 2 CONTINUOUS FLOW INTERSECTIONS. Final Report
 Preparedby: ENHANCED PARKWAY STUDY: PHASE 2 CONTINUOUS FLOW INTERSECTIONS Final Report Prepared for Maricopa County Department of Transportation Prepared by TABLE OF CONTENTS Page EXECUTIVE SUMMARY ES-1
SR 693 (Pasadena Avenue) Corridor Study from Shore Drive South to 66 th Street
 Corridor Study from Shore Drive South to 66 th Street") Welcome and Introduction Sign-in and comment sheets Restrooms and exits Meeting agenda and timeline Meeting goals / expectations Provide input to guide study recommendations Actively participate throughout
Welcome and Introduction Sign-in and comment sheets Restrooms and exits Meeting agenda and timeline Meeting goals / expectations Provide input to guide study recommendations Actively participate throughout
Danish gambling market statistics First quarter 2017
 Danish gambling market statistics First quarter 2017 6. juni 2017 Danish gambling market statistics 1 Introduction The Danish gambling market underwent a partial liberalisation in 2012, with the markets
12. School travel Introduction. Part III Chapter 12. School travel
 12. School travel 12.1 Introduction This chapter presents the evidence on changes in travel patterns for the journey to school in the three towns over the period of the Sustainable Travel Town project.
SWISS reports stable load factors
 SWISS Corporate Communications Phone: +41 (0)848 773 773 Fax: +41 (0)44 564 2127 communications@swiss.com SWISS.COM Media release Zurich Airport, October 10, 2008 SWISS reports stable load factors SWISS
Wilshire Boulevard Bus Rapid Transit Project
 Los Angeles County Metropolitan Transportation Authority Wilshire Boulevard Bus Rapid Transit Project COMMUNITY MEETINGS November 2008 Agenda Introduction Proposed Project Overview Participating Agencies
Traffic Safety Basic Facts 2012
 Urban areas Fatalities on urban roads were reduced by 39% between 2001 and 2010. In 2010, about 10.830 people died in traffic accidents on urban roads in the EU-19. This corresponds to 38% of all road
Central Oregon Intergovernmental Council
 Central Oregon Intergovernmental Council Regional Transit Master Plan (RTMP) Technical Advisory Committee Kick-Off Meeting May 16, 2012 Meeting Agenda Project Orientation Presentation of Survey Results
Using smartphones for cycle planning Authors: Norman, G. and Kesha, N January 2015
 Using smartphones for cycle planning Authors: Norman, G. and Kesha, N January 2015 Abstract There has been an inherent lack of information available to transport and urban planners when looking at cycle
Defining Purpose and Need
 Advanced Design Flexibility Pilot Workshop Session 4 Jack Broz, PE, HR Green May 5-6, 2010 Defining Purpose and Need In your agency s project development process, when do design engineers typically get
Laurier Segregated Bike Lane Pilot Project July 2013 update
 Laurier Segregated Bike Lane Pilot Project July 2013 update Presentation Overview Background Pilot Monitoring Results Mitigation Recommendations Next Steps Laurier 2 Background Laurier Avenue Segregated
ADOT Statewide Bicycle and Pedestrian Program Summary of Phase IV Activities APPENDIX B PEDESTRIAN DEMAND INDEX
 ADOT Statewide Bicycle and Pedestrian Program Summary of Activities APPENDIX B PEDESTRIAN DEMAND INDEX May 24, 2009 Pedestrian Demand Index for State Highway Facilities Revised: May 29, 2007 Introduction
Traffic Safety Basic Facts 2011
 Urban areas Fatalities on urban roads were reduced by 32% between 2000 and 2009. In 2009, about 12.300 people died in traffic accidents on urban roads in the EU-19. This corresponds to 38% of all road
WIM #37 I-94, MP OTSEGO, MN APRIL 2012 MONTHLY REPORT
 WIM #37 I-94, MP 200.1 OTSEGO, MN APRIL 2012 MONTHLY REPORT In order to understand the vehicle classes and groupings the Mn/DOT Vehicle Classification Scheme and the Vehicle Classification Groupings for
Transit Pre-Planning and Data Collection for Multi-Modal Corridor Studies
 Transit Pre-Planning and Data Collection for Multi-Modal Corridor Studies November 15 th, 2013 Topics Motivations Overview Results and findings Reactions and refinements Page 2 MOTIVATIONS The Problem
New Zealand Fisheries Assessment Research Document 98/21. Not to be cited without permission of the authork) Malcolm Clark
 Malcolm Clark") Not to be cited without permission of the authork) New Zealand Fisheries Assessment Research Document 98/21 A summary of commercial catch and effort information for orange roughy (Hoplostethus atlanticus)
Not to be cited without permission of the authork) New Zealand Fisheries Assessment Research Document 98/21 A summary of commercial catch and effort information for orange roughy (Hoplostethus atlanticus)
Review of Fatal Collisions
 Review of Fatal Collisions January to July 1 st 16 Review of 16 fatal collision statistics as of 1st July 16 Overview This report summarises the main trends in road fatalities that have emerged up to the
Congestion and Safety: A Spatial Analysis of London
 Congestion and Safety: A Spatial Analysis of London Robert B. Noland Mohammed A. Quddus Centre for Transport Studies Dept. of Civil and Environmental Engineering Imperial College London London SW7 2AZ
French Road Safety Observatory ONISR
 Road Safety in 2016 estimated as of January 23, 2017 Development of road traffic fatalities in France mainland : 3 469 persons are estimated to have died on the French mainland roads in 2016, representing
100 Most Congested Roadways in Texas
 100 Most Congested Roadways in Texas 2018 Report EXECUTIVE SUMMARY In response to increased roadway congestion throughout the state, in 2009 the Texas Legislature mandated that the Texas Department of
Operational Ranking of Intersections: A Novel Prioritization Methodology
 Operational Ranking of Intersections: A Novel Prioritization Methodology Reza Omrani, Ph.D. Transportation Engineer CIMA+ 3027 Harvester Road, Suite 400 Burlington, ON L7N 3G7 Reza.Omrani@cima.ca Pedram
Classification Criteria
 SCHEDULE D TO RECOMMENDED OFFICIAL PLAN AMENDMENT NO. 40 SCHEDULE C-4 Road Criteria Criteria Traffic Service Objective Land Service/Access Typical Daily Traffic Volume Flow characteristics Travel Speed
Accessibility, mobility and social exclusion
 Accessibility, mobility and social exclusion Dionisis Balourdos Kostas Sakellaropoulos Aim The aim of this paper is to present data from the four cities in the project SceneSusTech concerning the issues
Copy of my report. Why am I giving this talk. Overview. State highway network
 Road Surface characteristics and traffic accident rates on New Zealand s state highway network Robert Davies Statistics Research Associates http://www.statsresearch.co.nz Copy of my report There is a copy
GALLUP NEWS SERVICE GALLUP POLL SOCIAL SERIES: WORLD AFFAIRS
 GALLUP NEWS SERVICE GALLUP POLL SOCIAL SERIES: WORLD AFFAIRS -- FINAL TOPLINE -- Timberline: 937008 IS: 954 Princeton Job #: 17-02-002 Jeff Jones, Lydia Saad February 1-5, 2017 Results are based on telephone
SWISS Traffic Figures May 2004
 SWISS Traffic Figures May 2004 SWISS continues seat load factor improvement in May SWISS s load factor for May was 4.8 percentage points better than for the same period last year. Seat load factor for
Merging Traffic at Signalled Junctions
 Chris Kennett August 2015 Merging Traffic at Signalled Junctions Introduction Back in 2012, at the JCT Symposium, I presented a paper Modelling Merges at Signalled Junctions. In that paper I showed that
Temporal and Spatial Variation in Non-motorized Traffic in Minneapolis: Some Preliminary Analyses
 Temporal and Spatial Variation in Non-motorized Traffic in Minneapolis: Some Preliminary Analyses Spencer Agnew, Jason Borah, Steve Hankey, Kristopher Hoff, Brad Utecht, Zhiyi Xu, Greg Lindsey Thanks to:
GALLUP NEWS SERVICE GALLUP POLL SOCIAL SERIES: WORLD AFFAIRS
 GALLUP NEWS SERVICE GALLUP POLL SOCIAL SERIES: WORLD AFFAIRS -- FINAL TOPLINE -- Timberline: 937008 JT: 165 Princeton Job #: 18-02-002 Jeff Jones, Lydia Saad February 1-10, 2018 Results are based on telephone
Cycle journeys on the Anderston-Argyle Street footbridge: a descriptive analysis. Karen McPherson. Glasgow Centre for Population Health
 Cycle journeys on the Anderston-Argyle Street footbridge: a descriptive analysis Karen McPherson Glasgow Centre for Population Health March 2017 Key points: There were 116,334 cycle journeys made using
Evolution of urban transport policies: International comparisons
 Centre for Transport Studies Evolution of urban transport policies: International comparisons Prof Peter Jones Centre for Transport Studies, UCL Presentation to the IATSS GIFTS Workshop, November 2015
Public transport and town planning from a retroactive point of view C. Wallstrom, S. Johansson et al
 Public transport and town planning from a retroactive point of view C. Wallstrom, S. Johansson et al The aim of this project is to estimate the effect of town planning on traffic volumes and modal split
UK Integrated Behaviour Change Programmes
 UK Integrated Behaviour Change Programmes 17 th November 2009 ACT TDM Summit Conference Daniel Johnson, Transport for London Nicky Ward, Steer Davies Gleave Structure 1. UK travel behaviour change 2. An
International Journal of Innovative Research in Science, Engineering and Technology. (A High Impact Factor, Monthly, Peer Reviewed Journal)
") A Preliminary Study on Possible Alternate Roadways to Reduce Traffic Hazards at Velachery Township in Chennai Traffic Flow Minimization- a Prelimary Study Deepak R, Gangha G Department of Civil Engineering,
A Preliminary Study on Possible Alternate Roadways to Reduce Traffic Hazards at Velachery Township in Chennai Traffic Flow Minimization- a Prelimary Study Deepak R, Gangha G Department of Civil Engineering,
GALLUP NEWS SERVICE GALLUP POLL SOCIAL SERIES: WORK AND EDUCATION
 GALLUP NEWS SERVICE GALLUP POLL SOCIAL SERIES: WORK AND EDUCATION -- FINAL TOPLINE -- Timberline: 937008 IS: 786 Princeton Job #: 16-08-012 Jeff Jones, Lydia Saad August 3-7, 2016 Results are based on
MEASUREMENT OF RECURRING VERSUS NON-RECURRING CONGESTION
 Final Report Research Project T2695, Task 36 Congestion Measurement MEASUREMENT OF RECURRING VERSUS NON-RECURRING CONGESTION by John M. Ishimaru Senior Research Engineer Mark E. Hallenbeck Director Jennifer
21/02/2018. How Far is it Acceptable to Walk? Introduction. How Far is it Acceptable to Walk?
 21/2/218 Introduction Walking is an important mode of travel. How far people walk is factor in: Accessibility/ Sustainability. Allocating land in Local Plans. Determining planning applications. Previous
MYTH-BUSTING IN MELBOURNE Left-turn Vehicle vs. Pedestrian Crashes At Signalised Intersections
 MYTH-BUSTING IN MELBOURNE Left-turn Vehicle vs. Pedestrian Crashes At Signalised Intersections Presentation by Mark O Brien AITPM Thursday 21 September 2017 Assumed Common Wisdom Our study commenced over
Transportation Planning Division
 Transportation Planning Division Presentation Outline Study Tasks Recap of Previous Meetings Data Collected Focus Areas within Study Limits Design Principles Tool Box Recommended Concepts Schedule Moving