KEY PERFORMANCE INDICATORS FOR URBAN ITS
|
|
|
- Asher Parks
- 5 years ago
- Views:
Transcription


1 KEY PERFORMANCE INDICATORS FOR URBAN ITS I. Kaparias, M. Bell Imperial College London N. Eden, A. Gal-Tzur Technion Israel Institute of Technology A. Tsakarestos, M. Gerstenberger Technische Universität München Brussels, 11 October 2011
2 Aims and objectives Main output of CONDUITS: Coherent set of Key Performance Indicators (KPIs) for urban traffic management and ITS Objectives to define KPIs evaluation framework for identifying best practices and technologies to test the KPIs through application to Paris, Rome, Tel Aviv and Munich
3 Roles of KPIs Assess benefits Cost vs. benefit of investment Assess the usefulness of ITS as a whole Identify the limits of ITS Assist traffic managers to make decisions Contract monitoring Promote cities interests
4 Selection criteria for KPIs Make use of existing data, not collect new Measurability (costs, tools, accuracy) Easy to use and communicate to public Clarity (general public, policy makers, professionals) Consider individuality of cities Geographical scale (local-national-international) Control (ability to change characteristics)


5 Aspects of KPIs Mode red times at signalized junctions Exposure to congestion % of vehicles arriving to stations on time Spatial City-centre travel times Temporal Last 15 min travel times Suburban freeways travel times % trips % trips non Year obligated obligated Annual % trips return home 44.0


6 Aspects of KPIs Perspective Travel Times Modal split Tram delays Level of responsibility Gap time from call to repair Tolling system uptime Categories Distance to stations Travel times Number of fatalities


7 KPIs framework (1) Goal : Improve attractiveness of public transport Objective : Reduce public transport waiting times in junctions PI : Average waiting time at stop line PI : % of vehicles stopping at stop line Objective : Improve reliability of public transport PI : Variance of headway between consecutive vehicles at the station PI : % of vehicles arriving at the station on time Performance Measure : Vehicle s momentary location
8 KPIs framework (2)
9 Case studies Paris Implementation of a priority system to 3 bus lines Construction of a new tram line Rome General assessment of traffic efficiency Tel Aviv Implementation of new signal strategies Munich Application of speed feedback signs for drivers
10 Applied KPIs Paris Traffic efficiency: mobility for buses and tram Traffic safety: accidents for buses and tram Rome Traffic efficiency: mobility, reliability Tel Aviv Traffic efficiency: reliability Munich Traffic safety: direct impacts
")


11 Paris Bus priority (1) Priority on lines 26, 91, 96 Implementation in 2006 Anticipated travel time savings of the order of 30s per traveller on average, i.e. saving of one vehicle
12 Paris Bus priority (2) Supplied data Bus travel times on a number of specific segments of given length on the 3 bus lines, before and after Vehicle traffic speeds on a number of specific segments of given length, affected by the priority measures on the 3 bus lines, before and after Casualty numbers due to road traffic accidents on a number of specific segments affected by the priority measures on bus line 91, over given periods before and after Vehicle traffic flows on the given segments, before and after
13 Paris Bus priority (3) Traffic efficiency: Mobility index minutes/km, weighted for public and private transport Traffic safety: Accidents index casualties per million vehicles, weighted by severity
14 Paris Bus priority (4) Traffic efficiency: Mobility index Separately for public and private transport min/km Line 26 Line 91 Line 96 TOTAL Public transport mobility Private transport mobility Combined, with wpt = 0.7, wpv = 0.3 min/km Line 26 Line 91 Line 96 TOTAL IMOB
15 Paris Bus priority (5) Traffic safety: Accidents index For each severity level Line 91 Weight Cycles wheelers wheelers 0.15 Pedestrians 0.4 Casualties/million-vehicles Deaths Serious injuries Slight injuries Total, with wdead = 0.85, wser = 0.1, wsl = 0.05 casualties/ million-veh Line 91 IACD

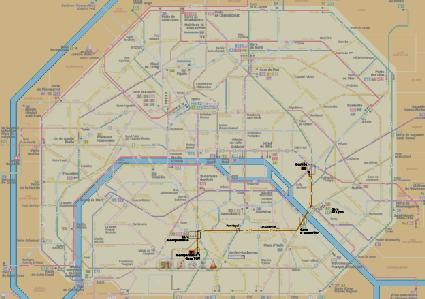
16 Paris Tramway (1) Construction of tramway line T3 in 2006 at Boulevards des Maréchaux It was anticipated to achieve the following goals: Average speed of 20km/h Daily traffic of 100,000 travellers Regularity of the line with a tram every 4 mins
17 Paris Tramway (2) Supplied data Tram travel times on the entire route, only after Vehicle traffic speeds on the entire route of the tram, before and after Casualty numbers due to road traffic accidents on the entire route, over given periods before and after Vehicle traffic flows on the entire route, before and after
18 Paris Tramway (3) Traffic efficiency: Mobility index Separately for public and private transport min/km Public transport mobility Private transport mobility N/A Tram T3 Combined, with wpt = 0.7, wpv = 0.3 min/km Tram T3 IMOB N/A 3.70
19 Paris Tramway (4) Traffic safety: Accidents index For each severity level Tram T3 Weight Cycles wheelers wheelers 0.15 Pedestrians 0.4 Casualties/million-vehicles Deaths Serious injuries Slight injuries Total, with wdead = 0.85, wser = 0.1, wsl = 0.05 casualties/ million-veh Tram T3 IACD

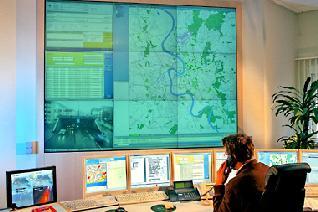
20 Rome General assessment (1) Several techniques and technologies, including ITS, are used for traffic management in the entire Greater Rome area Mobility Control Centre
21 Rome General assessment (2) Supplied data Travel times by private and public transport between all zones in the city, along with route lengths Occurrences of congestion and their average duration on a number of key routes on the road network over one year
22 Rome General assessment (3) Traffic efficiency: Mobility index minutes/km, weighted for public and private transport Traffic efficiency: Reliability index dimensionless, weighted by link and mode
23 Rome General assessment (4) Traffic efficiency: Mobility index Separately for public and private transport min/km Rome Public transport mobility Private transport mobility N/A 5.41 N/A 3.20 Combined, with wpt = 0.7, wpv = 0.3 min/km Rome IMOB N/A 4.75
")
24 Rome General assessment (5) Traffic efficiency: Reliability index Routes weighted equally (assumption) IREL =

25 Tel Aviv New signal strategies (1) Municipality incharge of mobility within the borders of the city of Tel Aviv Avivim Traffic management & Control System

26 Tel Aviv New signal strategies (2) Recurrent Congestion During the noon / Evening peak ~45 Hour of Congestion/Link/Month Deployment of new traffic management strategies
27 Tel Aviv New signal strategies (3) Supplied data Level of Service (LOS) of links in Ha Shalom arterial, along with link lengths and weights Duration of congestion of links in Ha Shalom arterial during the afternoon peak period Weighting methodology Timeframes: 5 timeframes to reflect the typical traffic demand patterns Link categories: arterials, local streets Direction categories: inbound, outbound (into and out of the city centre)


28 Tel Aviv New signal strategies (4) Traffic efficiency: Reliability index Weights Inbound Outbound Morning Peak noon Peak Off Peak Morning Peak noon Peak Off Peak Arterials Local streets The new strategies were implemented during the afternoon peak
29 Tel Aviv New signal strategies (5) Results: Comparing the index during afternoon peak hours 2 months before and 2 after the implementation of the new signal programmes: average increase of 36% in the reliability index Bigger decrease in congestion duration (~41%) General perception of representative travellers supported this figure Decreasing tendency of the index value stopped over the next few months; within one year the index value became stable


30 Munich Safety assessment (1) Installation of two feedback signs during a test period Measuring speeds at two urban streets (speed limit 50 and 30km/h) in both driving directions Shown flashing messages: if exceeding the speed threshold slow down!, else Thank you!
31 Munich Safety assessment (2) Supplied data Time and speed of each vehicle passing the location Daily traffic volume and the number of vehicles exceeding the speed limit Data available before implementation, during test period and after implementation of the feedback signs
32 Munich Safety assessment (3) Traffic Safety: direct safety impact number of shown warning messages/day average number for each time period: before implementation, during test period and after implementation
33 Munich Safety assessment (4) Traffic Safety: direct safety impact warnings/vehicle Test period 1 Paosostrasse (east) Paosostrasse (west) Friedenspromenade (north) Friedenspromenade (south) Combined, with wl1 = 0.2, wl2 = 0.2, wl3 = 0.3, wl4 = 0.3 IDS warnings/vehicle Munich (Paosostrasse & Friedenspromenade) Test period
34 Concluding remarks Implementation of KPIs requires consideration of several dimensions KPIs developed proved to reflect major phenomena KPIs as a predictive tool?
35 Thank you! For further enquiries:
CONDUITS DST-Tel Aviv-Yafo Case Study
 CONDUITS DST-Tel Aviv-Yafo Case Study Introduction The city of Tel Aviv-Yafo is the nucleus of the Tel Aviv metropolitan area and serves as the financial and cultural centre of Israel. With a population
Municipality of Sofia Traffic Master Plan. Intelligent Transport Systems Strategy Andrew Walsh
 Municipality of Sofia Traffic Master Plan Intelligent Transport Systems Strategy Andrew Walsh Introduction Presentation to describe an ITS Strategy for Sofia developed as part of the Sofia Traffic Master
How to achieve fluid traffic
 Kanton Basel-Stadt How to achieve fluid traffic Objectives, instruments and limits of traffic management Alain Groff, Office for Mobility, Canton of Basel-Stadt Overview Some figures about Basel Tools
2. Context. Existing framework. The context. The challenge. Transport Strategy
 Transport Strategy Providing quality connections Contents 1. Introduction 2. Context 3. Long-term direction 4. Three-year priorities 5. Strategy tree Wellington City Council July 2006 1. Introduction Wellington
Developing a Birmingham Transport Space Allocation policy. David Harris Transport Policy Manager Economy Directorate Birmingham City Council
 Developing a Birmingham Transport Space Allocation policy David Harris Transport Policy Manager Economy Directorate Birmingham City Council Birmingham s Sustainable Urban Mobility Plan Birmingham Connected
Regional Bus Priority
 Regional Bus Priority Recommendation(s) That the Board: i) Notes the systematic review for bus priority measures on the proposed Frequent Transit Network (FTN). Executive summary The New Network public
Safety impacts of pedestrian crossing configurations and other features of signalized junctions on public transport routes
 Advancements in planning and operation of public transport Workshop 4.7.16, TRI, Technion Safety impacts of pedestrian crossing configurations and other features of signalized junctions on public transport
Integrated Corridor Approach to Urban Transport. O.P. Agarwal World Bank Presentation at CODATU XV Addis Ababa, 25 th October 2012
 Integrated Corridor Approach to Urban Transport O.P. Agarwal World Bank Presentation at CODATU XV Addis Ababa, 25 th October 2012 What is the Integrated Corridor Approach for Urban Transport Public? Why
Background. The scale of the problem. The scale of the problem. Road Safety in London, the statistics. 280 Fatalities from road crashes in 2002
 Impacts: 8th Intercontinental Conference - Geneva Thursday, 13 November 23 European Road Safety Programme Implementation by Cities AN OVERVIEW OF THE LONDON PICTURE Lukman Agboola Senior Road Safety Engineer
Integrated Regional Traffic Management. Michael Aherne Technical Director POLIS Conference 2009
 Integrated Regional Traffic Management Michael Aherne Technical Director POLIS Conference 2009 M50 finish Public Transport and Pedestrians College Green The Spatial Perspective What Could has
Using GPS Data for Arterial Mobility Performance Measures
 Using GPS Data for Arterial Mobility Performance Measures Paul Czech, MnDOT Shawn Turner, TTI CTS Research Conference May 22, 2014 ~ St. Paul, MN Methodology & Results INRIX GPS Data + = Road Inventory
Multi-criteria Evaluation of Traffic Signal Control Manfred Boltze and Wei Jiang 1
 Multi-criteria Evaluation of Traffic Signal Control Manfred Boltze and Wei Jiang Transport Planning and Traffic Engineering, Technische Universität Darmstadt Future City 2017: Urban Sustainable Development
The FLOW Congestion Assessment Methodology
 The FLOW Congestion Assessment Methodology Frederic Rudolph FLOW Webinar 30 th January 2017 Funded by the Horizon 2020 Framework Programme of the European Union 2 Agenda 1 2 3 4 Definition of congestion/transport
Automatisch rijden, het gedrag van bestuurders en verkeersstromen
 Automatisch rijden, het gedrag van bestuurders en verkeersstromen Bart van Arem EVU Symposium, 9 september 2016, Postillion Hotel Amersfoort Veluwemeer Rivium Buses (Rotterdam) 2013: DAVI on the road 2016:
Congestion Management in Singapore. Assoc Prof Anthony TH CHIN Department of Economics National University of Singapore
 Congestion Management in Singapore Assoc Prof Anthony TH CHIN Department of Economics National University of Singapore anthonychin@nus.edu.sg Introduction 2 Introduction and What is Traffic Congestion?
Konstantin Glukhenkiy Economic Affairs Officer
 Konstantin Glukhenkiy Economic Affairs Officer Rapid growth of urban areas Very rapid increase in motorisation Substantial increases in traffic congestion Relative decline of public transport usage and
March, 2017 Christophe Najdovski, Deputy Mayor of Paris for transport, street network, mobility and public space. Roads and Mobility Parisian Policy
 March, 2017 Christophe Najdovski, Deputy Mayor of Paris for transport, street network, mobility and public space Roads and Mobility Parisian Policy Part 1 - Background Paris and its agglomeration, institutionnal
Measuring and Communicating Mobility:
 Measuring and Communicating Mobility: The District Mobility Project Stephanie Dock, District Department of Transportation TRB Transportation Issues in Major Cities Committee May 2, 2017 Deconstructing
Overview of the CONDUITS framework
 Overview of the CONDUTS framework CONDUTS training workshop 26 November 2014 Madrid oannis Kaparias, City University London Niv Eden, Technion srae nstitute of Technoogy Outine CONDUTS KPs framework Requirements
This objective implies that all population groups should find walking appealing, and that it is made easier for them to walk more on a daily basis.
 Walking for life The Norwegian Walking Strategy Guro Berge Norwegian public Roads Administration "Walking for life" is the slogan for the National Walking Strategy that is now being formulated in Norway.
Some interesting questions of traffic signal control
 Some interesting questions of traffic signal control HELMI and Public Transport Priority functions (skipped, discussed already on lectures) Joker signals Low cost traffic controil in the city of Helsinki
Improving the Bus Network through Traffic Signalling. Henry Axon Transport for London
 Improving the Bus Network through Traffic Signalling Henry Axon Transport for London Improving the Bus Network through Traffic Signalling Introduction Transport for London (TfL) operates the most frequent
EUROPEAN TRANSPORT CONFERENCE 2006 ROAD SAFETY IN LONDON PAST SUCCESSES AND FUTURE INNOVATIONS
 EUROPEAN TRANSPORT CONFERENCE 26 ROAD SAFETY IN LONDON PAST SUCCESSES AND FUTURE INNOVATIONS Mr Chris Lines Head of the London Road Safety Unit, Transport for London 1. PAST SUCCESSES Road safety is a
Delivering Accident Prevention at local level in the new public health system
 1 Safety issue accidents don t have to happen Delivering Accident Prevention at local level in the new public health system Part 2: Accident prevention in practice Raise awareness Fact Sheet Road casualties
TRANSPORTATION STUDY REPORT DRAFT - APRIL 2015 A BLUEPRINT FOR HOW WE CAN GET AROUND GREATER SUDBURY, FROM NOW UNTIL 2031
 TRANSPORTATION STUDY REPORT DRAFT - APRIL 2015 A BLUEPRINT FOR HOW WE CAN GET AROUND GREATER SUDBURY, FROM NOW UNTIL 2031 A summary of what s there, what more is needed, how to find information about your
Cycling and risk. Cycle facilities and risk management
 Cycling and risk Cycle facilities and risk management Failure to recognize possibilities is the most dangerous and common mistake one can make. Mae Jemison, astronaut 6/11/2010 York Regional Council Cycling
Evaluation of bus lanes in central urban areas through the use of modelling techniques
 Evaluation of bus lanes in central urban areas through the use of modelling techniques S. Basbas Dept. of Transportation and Hydraulics Engineering, Faculty of Rural and Surveying Engineering, School of
Mill Hill Broadway Capacity Improvement
 1 16 MARCH 2016 Mill Hill Broadway Capacity Improvement Presentation to Barnet Members and Mill Hill Residents Association 2 Background A1 is one of 23 Transport for London Road Network (TLRN) Strategic
Road Congestion Measures Using Instantaneous Information From the Canadian Vehicle Use Study (CVUS)
") Proceedings of Statistics Canada Symposium 2016 Growth in Statistical Information: Challenges and Benefits Road Congestion Measures Using Instantaneous Information From the Canadian Vehicle Use Study (CVUS)
Proceedings of Statistics Canada Symposium 2016 Growth in Statistical Information: Challenges and Benefits Road Congestion Measures Using Instantaneous Information From the Canadian Vehicle Use Study (CVUS)
Mobility measures in Vitoria-Gasteiz
 CIVITAS Study Tour in Vitoria-Gasteiz, Spain 19 & 20 June 2014 Palacio Zulueta Public Space and Nature Environment Service, Paseo de la Senda 2, Vitoria-Gastez Giving back the public space to the people
Planning Committee STAFF REPORT March 7, 2018 Page 2 of 4 The following MTSOs are being used across the five subregions: Intersection Level of Service
 Planning Committee STAFF REPORT Meeting Date: March 7, 2018 Subject Summary of Issues Recommendations Financial Implications Options Attachments Changes from Committee Review Draft 2017 Multimodal Transportation
9. Parking Supporting Statement
 9. Parking Supporting Statement Content 1. Setting the Scene 2. Vision 3. Parking and the Shared Priorities 4. Issues 5. Delivery Programme in the first Plan Period 2001/02 2005/06 6. Good Practice 7.
UNIT V 1. What are the traffic management measures? [N/D-13] 2. What is Transportation System Management (TSM)? [N/D-14]
![UNIT V 1. What are the traffic management measures? [N/D-13] 2. What is Transportation System Management (TSM)? [N/D-14]](/thumbs/87/95571671.jpg "UNIT V 1. What are the traffic management measures? [N/D-13] 2. What is Transportation System Management (TSM)? [N/D-14]") UNIT V 1. What are the traffic management measures? [N/D-13] Some of the well-known traffic management measures are: a) Restrictions on turning movements b) One - way streets c) Tidal - flow operations
UNIT V 1. What are the traffic management measures? [N/D-13] Some of the well-known traffic management measures are: a) Restrictions on turning movements b) One - way streets c) Tidal - flow operations
Speed Limits in the Hoddle Grid
 Speed Limits in the Hoddle Grid Recent History of speed limits March 2013 Docs # 7738485 1 Introduction Muncipalities have power to Erect speed limit signs BUT Municipalities DO NOT have the power to approve
City of Ottawa s Complete Streets Approach to Transportation Projects
 City of Ottawa s Complete Streets Approach to Transportation Projects Presentation to Stakeholders Date: May 5, 2015 Presentation Overview Purpose of the study Proposed definition of Complete Streets for
Operational Comparison of Transit Signal Priority Strategies
 Operational Comparison of Transit Signal Priority Strategies Revision Submitted on: November, 0 Author: Adriana Rodriguez, E.I Assistant Engineer Parsons Brinckerhoff 0 South Orange Avenue, Suite 00 Orlando,
Healthy and Environmental Friendly Transport in the City Region
 Healthy and Environmental Friendly Transport in the City Region Reindert Augustijn Team manager traffic and transport Arnhem Nijmegen City Region www.polisnetwork.eu/2014conference #polis14 Fact and figures
Mathematics of Planet Earth Managing Traffic Flow On Urban Road Networks
 Mathematics of Planet Earth Managing Traffic Flow On Urban Road Networks Adrian George Manager Network Improvements Anthony Fitts Manager Signal Design Melbourne s transport demands are growing 5m people
ROAD TRAFFIC INJURY DATA SYSTEMS IN GHANA: The key to safety improvement and control
 ROAD TRAFFIC INJURY DATA SYSTEMS IN GHANA: The key to safety improvement and control A paper presented at the African Road Safety Conference held at the Kwame Nkrumah Conference Centre, Accra, Ghana from
A location model for pedestrian crossings in arterial streets
 A location model for pedestrian crossings in arterial streets B. Amini¹ & H. Ghahramani² ¹Department of Civil Engineering, International University of Imam Khomeini, Iran ²Iran University of Science and
Using Farecard Data to Suggest Cycling Policies in Singapore. Ashwani Kumar Viet Anh Nguyen Kwong Meng Teo Amedeo Odoni
 Using Farecard Data to Suggest Cycling Policies in Singapore Ashwani Kumar Viet Anh Nguyen Kwong Meng Teo Amedeo Odoni Based on our paper published in the journal Annals of Operations Research in April
Purpose and Need. Chapter Introduction. 2.2 Project Purpose and Need Project Purpose Project Need
 Chapter 2 Purpose and Need 2.1 Introduction The El Camino Real Bus Rapid Transit (BRT) Project (Project) would make transit and other transportation improvements along a 17.6-mile segment of the El Camino
Mobility and Congestion
 Technical Memorandum Mobility and Congestion Prepared for: Prepared by: September 25, 2013 1 Table of Contents 1. Introduction... 1 2. Congestion Forecasting Process... 1 2.1 Mobility and Congestion Terms...
Highway 217 Corridor Study. Phase I Overview Report
 Highway 217 Corridor Study Phase I Overview Report November 3, 24 BACKGROUND AND OVERVIEW Study purpose The Highway 217 Corridor Study is developing multi-modal transportation solutions for traffic problems
Corporate. Report COUNCIL DATE: June 26, 2006 NO: C012 COUNCIL-IN-COMMITTEE. TO: Mayor & Council DATE: June 22, 2006
 Corporate NO: C012 Report COUNCIL DATE: June 26, 2006 COUNCIL-IN-COMMITTEE TO: Mayor & Council DATE: June 22, 2006 FROM: General Manager, Engineering FILE: 0410-20(MoT/Gate) SUBJECT: Surrey Response on
Implementing Complete Streets in Ottawa. Project Delivery Process and Tools Complete Streets Forum 2015 October 1, 2015
 Implementing Complete Streets in Ottawa October 1, 2015 The Essentials Complete Streets Implementation Framework will become part of the routine delivery of City transportation projects Approach uses every
Traffic Congestion in Houston. Presented by Bill King
 Traffic Congestion in Houston Presented by Bill King www.billkinghouston.com The Travel Time Index Defined 1.36 30 Minute Trip = 41 Minute Trip (+ 36%) The History of Congestion in Houston Growing Congestion
Impact Assessment of a new parking pricing scheme in Madrid City Centre
 Impact Assessment of a new parking pricing scheme in Madrid City Centre Andres Monzon Professor of Transportation Transport Research Centre Universidad Politecnica de Madrid Spain María E. López-Lambas,
Existing Conditions. Date: April 16 th, Dan Holderness; Coralville City Engineer Scott Larson; Coralville Assistant City Engineer
 Date: April 16 th, 2015 To: From: Re: Dan Holderness; Coralville City Engineer Scott Larson; Coralville Assistant City Engineer Darian Nagle-Gamm, Traffic Engineering Planner Highway 6 (2 nd Street) /
Congestion Evaluation Best Practices
 Congestion Evaluation Best Practices Todd Litman Victoria Transport Policy Institute Presented International Transportation and Economic Development Conference 10 April 2014 Congestion Indicators Indicator
TRAFFIC IMPACT ANALYSIS
 TRAFFIC IMPACT ANALYSIS FOR THE CHAMPAIGN UNIT#4 SCHOOL DISTRICT PROPOSED HIGH SCHOOL (SPALDING PARK SITE) IN THE CITY OF CHAMPAIGN Final Report Champaign Urbana Urbanized Area Transportation Study 6/24/2014
Introduction. Bus priority system. Objectives. Description. Measure title: City: Malmo Project: SMILE Measure number: 12.7
 Bus priority system A Introduction To improve public transport in the urban and suburban area of Malmö bus priority systems were implemented in 42 intersections (appendix 12.7 Signal Map). The intersections
New Strategic Road Safety Plan Risk assessment as alternative for (lack of) accident data?
 accident data?") New Strategic Road Safety Plan 2016-2021 Risk assessment as alternative for (lack of) accident data? Eric de Kievit senior advisor Traffic & Transport Research e.de.kievit@amsterdam.nl 18 November 2016
New Strategic Road Safety Plan 2016-2021 Risk assessment as alternative for (lack of) accident data? Eric de Kievit senior advisor Traffic & Transport Research e.de.kievit@amsterdam.nl 18 November 2016
20mph. We want to make Edinburgh a better and safer place to live, work and play.
 20mph CREATING A BETTER SAFER EDINBURGH We want to make Edinburgh a better and safer place to live, work and play. That s why on 13 January 2015 Councillors approved a new speed limit network for Edinburgh
Sustainable Transport in Vienna
 Sustainable Transport in Vienna and Graz Banja Luka, 25 th of November, 2011 simone.feigl@global2000.at Need for Sustainable Transport Air Pollution Particulate matter CO 2 -emissions Limited Resources
Moving Cambridge. City of Cambridge Transportation Master Plan Public Consultation Centre. March 7, :00 8:00 PM.
 City of Cambridge Transportation Master Plan Public Consultation Centre March 7, 2018 5:00 8:00 PM Region of Waterloo City of Cambridge Transportation Master Plan Public Consultation Centre March 7, 2018
SAFETY EVALUATION OF AN UNCONTROLLED
 SAFETY EVALUATION OF AN UNCONTROLLED INTERSECTION USING SURROGATE SAFETY MEASURES By S. Shekhar Babu Research scholar (Ext) IITB Asso Prof CME Pune Prof. P. Vedagiri Asst Prof Dept of civil Engg IIT Bombay
3 ROADWAYS 3.1 CMS ROADWAY NETWORK 3.2 TRAVEL-TIME-BASED PERFORMANCE MEASURES Roadway Travel Time Measures
 ROADWAYS Approximately 6 million trips are made in the Boston metropolitan region every day. The vast majority of these trips (80 to percent, depending on trip type) involve the use of the roadway network
Tallinn Region Sustainable Urban Mobility Plan 2035
 Estonian Road Administration Tallinna Transport Department Tallinn Region Sustainable Urban Mobility Plan 2035 Mari Jüssi, SUMP expert Estonian Road Administration/ Tallinn Transport Department FESM Steering
Auckland Transport Monthly Indicators Report 2018/19
 Attachment 1 Auckland Transport Monthly Indicators Report 218/19 August 218 Table of Contents Page 2. 1. Summary of indicators 1.1 SOI performance measures 1.2 AT Metro patronage breakdown 2. Monthly indicators
RUE DE L AVENIR FRANCE TRAFFIC CALMING IN FRANCE. MAKING CITIES WALKABLE: the French case RUE DE L AVENIR FRANCE
 ICTCT WORKSHOP OLOMOUC 26-27/10/2017 ANNE FAURE, Created in 1988 after a context of cities dominated by car objective of 70s to adapt the cities to cars but to protect vulnerable users? The 80s : new way
Polish-Nordic Road Forum/3rd 26/10/2017 Vilnius
 Polish-Nordic Road Forum/3rd 26/10/2017 Vilnius LITHUANIAN STEPS IN IMPLEMENTING ZERO VISION 4-6/June/2018 SOPOT Dovilė Krasauskaitė Head of Traffic Safety and Environmental Protection Division Lithuanian
THE DEVELOPMENT OF MALAYSIAN HIGHWAY RAIL LEVEL CROSSING SAFETY SYSTEMS: A PROPOSED RESEARCH FRAMEWORK. Siti Zaharah Ishak
 THE DEVELOPMENT OF MALAYSIAN HIGHWAY RAIL LEVEL CROSSING SAFETY SYSTEMS: A PROPOSED RESEARCH FRAMEWORK Siti Zaharah Ishak Transport System Centre, School of Natural & Built Environments, University Of
1. UK policy context
 1. UK policy context 2. Political leadership The Mayor s Vision My vision to create Healthy Streets aims to reduce traffic, pollution and noise, create more attractive, accessible and people-friendly streets
BLACK SPOTS MANAGEMENT - SLOVENIAN EXPERIENCE
 BLACK SPOTS MANAGEMENT - SLOVENIAN EXPERIENCE PhD Marko Renčelj, Assoc. Prof. Matjaž Šraml, University of Maribor, Faculty for Civil Engineering X International Symposium "ROAD ACCIDENTS PREVENTION 2010"
Pedestrian Safety in Cities
 Pedestrian Safety in Cities Priorities for India Geetam Tiwari MoUD Chair Professor, Coordinator, TRIPP Indian Institute of Technology Delhi, India URBAN MOBILITY INDIA 2013 IIT Delhi 2013 RTI in Urban
Roadways. Roadways III.
 Introduction 97 Roadway Design Principles 98 Safe Speeds 99 Optimizing of Street Space 00 Minimum Lane Widths in the City of Boston 02 Design Features that Reduce Operating Speeds 05 Travel Lanes Transit
Integrated Urban Mobility
 Integrated Urban Mobility The Berlin Experience Forum Urba 2015 Conference Montreal, 23 th March 2011 Maria Krautzberger Permanent Secretary of State, Senate Department for Urban Development, Berlin The
Simulating Street-Running LRT Terminus Station Options in Dense Urban Environments Shaumik Pal, Rajat Parashar and Michael Meyer
 Simulating Street-Running LRT Terminus Station Options in Dense Urban Environments Shaumik Pal, Rajat Parashar and Michael Meyer Abstract The Exposition Corridor transit project is a light rail project
The Belgian experience An actual view on mobility policy towards workplaces in Flanders (Belgium)
") The Belgian experience An actual view on mobility policy towards workplaces in Flanders (Belgium) Technical Conferences Plans for Transportation to Workplaces. Experiences and Good Practices Madrid, May
The Belgian experience An actual view on mobility policy towards workplaces in Flanders (Belgium) Technical Conferences Plans for Transportation to Workplaces. Experiences and Good Practices Madrid, May
MONTGOMERY COUNTY PLANNING DEPARTMENT THE MARYLAND-NATIONAL CAPITAL PARK AND PLANNING COMMISSION
 MONTGOMERY COUNTY PLANNING DEPARTMENT THE MARYLAND-NATIONAL CAPITAL PARK AND PLANNING COMMISSION MCPB Item No. 3 Date: 01-19-12 Worksession: Countywide Transit Corridors Functional Master Plan Larry Cole,
The City. Population of BH. Population of RMBH. 2.4 million inhabitants. 5.7 million inhabitants. 6.3 million trips a day
 Implementing sustainable mobility solutions Rogério Carvalho Silva Architect President Adviser BHTRANS Belo Horizonte, Brazil The City Population of BH 2.4 million inhabitants Population of RMBH 5.7 million
Inspiration toolkit. Toulouse: key facts EUROCITIES members Cities in action: grasping Berlin - shaping Berlin... 4
 Inspiration toolkit Mobility forum Innovative mobility for better urban spaces 16-18 October 2017, Toulouse Table of Contents Toulouse: key facts... 2 EUROCITIES members... 4 Cities in action: grasping
National Transport Awards Cambridge Park & Ride
 National Transport Awards Cambridge Park & Ride What Cambridgeshire has achieved q An award winning scheme focussed on quality. q Four sites, with a fifth site due to be built later this year. q 950,000
Frequently asked questions (FAQ) about a borough-wide 20 mph speed limit
 about a borough-wide 20 mph speed limit") Frequently asked questions (FAQ) about a borough-wide 20 mph speed limit February 2013 1. Is it safer to drive at 20 mph? Yes. According the Royal Society for Prevention of Accidents (RoSPA) if a pedestrian
Frequently asked questions (FAQ) about a borough-wide 20 mph speed limit February 2013 1. Is it safer to drive at 20 mph? Yes. According the Royal Society for Prevention of Accidents (RoSPA) if a pedestrian
Highway Engineering, second edition: Martin Rogers 2008 by Blackwell Publishing Ltd
 Question 2.1 Office workers within a residential development have a choice of the following work destinations: Urban Centre A, 150 minutes travel time away, with 7 million m 2 of office space Urban Centre
Attractive, Sustainable and Healthy Mobility
 Attractive, Sustainable and Healthy Mobility Transport Policy in Berlin THE PEP 2011 SYMPOSIUM Genéve, 16 th November 2011 Burkhard Horn Senate Department for Urban Development, Berlin Overview 1. What
Defining Purpose and Need
 Advanced Design Flexibility Pilot Workshop Session 4 Jack Broz, PE, HR Green May 5-6, 2010 Defining Purpose and Need In your agency s project development process, when do design engineers typically get
Measuring the Distribution and Costs of Congestion. Tim Lomax Texas Transportation Institute
 Measuring the Distribution and Costs of Congestion Tim Lomax Texas Transportation Institute http://mobility.tamu.edu The Congestion Measurement Story Travel time, variations, compare to goals WHAT? WHY?
9 Leeming Drive Redevelopment Ottawa, ON Transportation Brief. Prepared By: Stantec Consulting Ltd.
 9 Leeming Drive Redevelopment Ottawa, ON Transportation Brief Prepared By: Stantec Consulting Ltd. TIA GUIDELINES CHECKLIST Report Context Municipal Address Comment: Section 1.1 Location relative to major
Clackamas County Comprehensive Plan
 ROADWAYS The County s road system permits the movement of goods and people between communities and regions, using any of a variety of modes of travel. Roads provide access to virtually all property. They
Auckland Transport Monthly Indicators Report 2018/19
 Attachment 1 Auckland Transport Monthly Indicators Report 218/19 October 218 Table of Contents Page 2. 1. Summary of indicators 1.1 SOI performance measures 1.2 AT Metro patronage breakdown 2. Monthly
Understanding changing travel demand in Greater Manchester
 Understanding changing travel demand in Greater Manchester Which aspects of travel demand have changed in ways which have not been anticipated by traditional forecasting approaches in the past twenty years?
Making active mobility everyone s business: Taking the Healthy Streets Approach in London
 Making active mobility everyone s business: Taking the Healthy Streets Approach in London Lucy Saunders FFPH Specialist in Public Health Transport for London 1 Why do we need more active mobility? London
May Canal Cordon Report 2017
 May 2018 Canal Cordon Report 2017 Report on trends in mode share of vehicles and people crossing the Canal Cordon to 2017 2 Analysis of trends in mode share of people crossing the canal cordon - 2017 Contents
TRANSIT SIGNAL PRIORITY The Toronto Experience
 TRANSIT SIGNAL PRIORITY The Toronto Experience July 27, 2004 July 27, 2004 1 Warning This presentation contains graphic images depicting serious violations to the coordination of traffic signals and may
Camosun College Modal Split
 2010 Camosun College Modal Split How Does the College Community Get to Campus? Shannon Craig & Julie Higginson Camosun College 1/21/2011 Contents Introduction... 3 Methodology... 3 Results... 6 Mode Share
SAFETY AND ACCIDENT REDUCTION
 SAFETY AND ACCIDENT REDUCTION TRANSPORT TEACHING MATERIAL Transparencies 2003 EU-funded Urban Transport Research Project Results www.eu-portal.net OVERVIEW Introduction Safety and Accident Reduction Engineering
Appendix C. NORTH METRO STATION AREA TRAFFIC IMPACT STATEMENT 88th Avenue Station
 Appendix C NORTH METRO STATION AREA TRAFFIC IMPACT STATEMENT 88th Avenue Station Prepared for: Regional Transportation Department and URS Corporation as part of the North Metro EIS David Evans and Associates,
B9 Junctions - Right of way
 DRIVING IN JUNCTIONS 1 / 14 Order of the traffic situations are very simple. Do all training in e-autokoulu and theory test training in ajokaista.com. Driving in junctions Driving order Equal Yield sign
modes, the increased roadway capacity is the implied solution, which, in turn, has been shown to lead to more driving (induced demand).
.") CONGESTION MANAGEMEN T PROGRAM DECEMBER, 201 7 EXECUTIVE SUMMARY A. Introduction Every two years, the San Francisco County Transportation Authority (SFCTA) prepares the San Francisco Congestion Management
CONGESTION MANAGEMEN T PROGRAM DECEMBER, 201 7 EXECUTIVE SUMMARY A. Introduction Every two years, the San Francisco County Transportation Authority (SFCTA) prepares the San Francisco Congestion Management
SANTA CLARA COUNTYWIDE BICYCLE PLAN August 2008
 SANTA CLARA COUNTYWIDE BICYCLE PLAN August 2008 To assist VTA and Member Agencies in the planning, development and programming of bicycle improvements in Santa Clara County. Vision Statement To establish,
Extracting Maximum Benefit from Parking Policy - 10 Years Experience in Perth, Australia. By Emmerson Richardson Sinclair Knight Merz
 Extracting Maximum Benefit from Parking Policy - 10 Years Experience in Perth, Australia By Emmerson Richardson Sinclair Knight Merz Snapshot of Perth > Metropolitan Area Population 1.7 million > 3.5 million
Scaling up of ADAS Traffic Impacts to German Cities
 10th ITS European Congress, Helsinki, Finland 16 19 June 2014 TP 0220 Scaling up of ADAS Traffic Impacts to German Cities Judith Geßenhardt 1*, Oliver Fakler 2, Tobias Schendzielorz 3, Fritz Busch 1 1.
MULTIMODAL INJURY RISK ANALYSIS OF ROAD USERS AT SIGNALIZED AND NON- SIGNALIZED INTERSECTIONS
 MULTIMODAL INJURY RISK ANALYSIS OF ROAD USERS AT SIGNALIZED AND NON- SIGNALIZED INTERSECTIONS PhD Candidate: Jillian Strauss Supervisor: Luis Miranda-Moreno 24th Canadian Multidisciplinary Road Safety
CITY PLANNING ADMINISTRATION. The walkable city. Michael Erman, City of Stockholm Vienna/CORP 2012, 15 May 2012
 CITY PLANNING ADMINISTRATION The walkable city the concept of Stockholm Michael Erman, City of Stockholm Vienna/CORP 2012, 15 May 2012 2012-06-18 SIDAN 2 Stockholm The capital of Scandinavia Stockholm
MILTON ROAD ~ MITCHAM'S CORNER PARAMICS MODEL INITIAL OPTION TESTING
 MILTON ROAD ~ MITCHAM'S CORNER PARAMICS MODEL INITIAL OPTION TESTING NOVEMBER 216 MILTON ROAD ~ MITCHAM'S CORNER PARAMICS MODEL INITIAL OPTION TESTING Cambridgeshire County Council Type of document (version)
Revision of maintenance quality requirements to promote cycling in the city of Kuopio. Winter Cycling Congress , Oulu Timo Perälä
 Revision of maintenance quality requirements to promote cycling in the city of Kuopio Winter Cycling Congress 13.2.2013, Oulu Timo Perälä The city of Kuopio 98 000 inhabitants Cycling modal split of 10
Public Transport as a Necessity for Active Transport
 03.05.2017 Seite 1 Public Transport as a Necessity for Active Transport Manfred Breithaupt Urban Transport Consultant to GIZ Active Transport requires an attractive Public Transport System and its Integration
Most Important Part of any Plan
 Most Important Part of any Plan Objectives must be evaluated to determine if they have been achieved Achievement of Objectives: 10 of 13 Objectives Achieved 1 not achieved 2 not due yet Transportation