CHL ERDC/CHL HF-HG. Total Dissolved Gas Exchange at Chief Joseph Dam. Post Spillway Flow Deflectors, April 28-May 1, Michael L.
|
|
|
- Austen Moody
- 5 years ago
- Views:
Transcription


1 ERDC/CHL HF-HG Total Dissolved Gas Exchange at Chief Joseph Dam Post Spillway Flow Deflectors, April 28-May 1, 2009 Michael L. Schneider CHL Approved for public release; distribution is unlimited.
2
3 ERDC/CHL April 2012 Total Dissolved Gas Exchange at Chief Joseph Dam Post Spillway Flow Deflectors, April 28-May 1, 2009 Michael L. Schneider Coastal and Hydraulic Laboratory U.S. Army Engineer Research and Development Center 3909 Halls Ferry Rd. Vicksburg,MS Final report Approved for public release; distribution is unlimited. Prepared for U.S. Army Corps of Engineers, Seattle District Monitored by Coastal and Hydraulics Laboratory U.S. Army Engineer Research and Development Center 3909 Halls Ferry Road, Vicksburg, MS
4 ERDC/ CHL HF-HG ii Abstract: The purpose of this field study was to quantify total dissolved gas exchange during spillway operations at Chief Joseph Dam with the completed spillway flow deflectors on all 19 spill bays. The interaction of powerhouse and spillway releases was quantified and the TDG loading measured for a range of operating conditions. Alternative spill patterns were investigated to quantify both hydraulic and TDG generation processes. The results from this test were compared to the TDG exchange performance observed during the 1999 TDG exchange study of pre-deflector conditions at Chief Joseph Dam and conclusions drawn regarding the effectiveness of the flow deflector design. This study helped identify operating conditions which will meet the Washington state water quality standards for Total Dissolved Gas supersaturation on the Columbia River. The findings from this study were also used to document the TDG abatement at Chief Joseph Dam which is consistent with the recommendations developed in the Total Maximum Daily Load for TDG on the mid-columbia River. This study was used to update an operating policy for joint operation of Chief Joseph and Grand Coulee Dam for the management of TDG levels in the mid-columbia River. A model of TDG exchange at Chief Joseph Dam was developed from this study and incorporated in the SYSTDG model of TDG in the Columbia River. The study will also address the adequacy and interpretation of data collected at the fixed monitoring stations. DISCLAIMER: The contents of this report are not to be used for advertising, publication, or promotional purposes. Citation of trade names does not constitute an official endorsement or approval of the use of such commercial products. All product names and trademarks cited are the property of their respective owners. The findings of this report are not to be construed as an official Department of the Army position unless so designated by other authorized documents. DESTROY THIS REPORT WHEN NO LONGER NEEDED. DO NOT RETURN IT TO THE ORIGINATOR.
5 ERDC/ CHL HF-HG iii Contents Figures and Tables... v Preface...xi Unit Conversion Factors... xii 1 Executive Summary Introduction Background Objectives Site Characterization Structural Configuration Columbia River from CHJ to WEL Properties and Process TDG Properties TDG Exchange Processes Study Design Study Approach Instrumentation and Monitoring Operating Conditions Spill Magnitude Spill Pattern Schedule Results Flow Field Visual Patterns Acoustic Doppler Current Profiling Forebay Elevation Tailwater Elevation Water Temperature Local Atmospheric Pressure Total Dissolved Gas Pressure Transect T Transect T Transect T Transect T Transect T
6 ERDC/ CHL HF-HG iv Transect Wells Dam Dissolved Oxygen Data Analyses and Discussion TDG Exchange Pre- and Post Spillway Flow Deflector TDG Exchange at Chief Joseph Dam Spill Discharge Lateral Distribution Spill Pattern Tailwater Elevation Powerhouse Entrainment Tailwater Fixed Monitoring Station TDG loading or cross-sectional average TDG Spill Management TDG Exchange Model Formulation Wells Pool Model Simulation Conclusions Recommendations References Figures Appendix A: Total Dissolved Gas Field Studies: Methodology Water Quality Instrument Calibration, Maintenance, and Precision Appendix B: Photos of Spill Events Appendix C: Flow Field Summary Appendix D: Photos of Spill Closure Appendix E: Dissolved Oxygen and Cumulative Flow Figures Report Documentation Page
7 ERDC/ CHL HF-HG v Figures and Tables Figures Figure 1 Columbia River and Chief Joseph Dam Site Map Figure 2 Aerial Photograph of Chief Joseph Dam, Rufus Woods Lake, and the Columbia River Figure 3 Spillway and Stilling Basin Profile Section with Type II Flow Deflectors for Chief Joseph Dam Figure 4 Tailwater Channel Bed Elevations below Chief Joseph Dam Figure 5 Chief Joseph Dam Spillway Flow Deflectors during low tailwater elevations, April Figure 6 Spillway Flow Passing Under a Tainter Gate at Chief Joseph Dam Figure 7 Change in the Trajectory of Spill by the Spillway Flow Deflector at Chief Joseph Dam Figure 8 Highly Aerated Flow on the Spillway and Stilling Basin at Chief Joseph Dam Figure 9 Deflector Performance Curve and submergence of deflectors during uniform events with low powerhouse and high powerhouse flows Figure 10 Aerated Spillway Flow in the Columbia River below Chief Joseph Dam for a uniform spill of 142 kcfs Figure 11 Aerated Spillway Flow in the Columbia River below Chief Joseph Dam for uniform spill of 18, 58, 98, and 142 kcfs Figure 12 Total Dissolved Gas monitoring stations in the Columbia River at Chief Joseph Dam (Transects T0, T1, T2, T4, T5, Wells Dam) Figure 13 Total Dissolved Gas monitoring stations in the Columbia River at Chief Joseph Dam (Transects T0, T1, T2, T4 Mobile Sampling on Transect with yellow line) Figure 14 Total Dissolved Gas monitoring stations in the Columbia River at Chief Joseph Dam (Transects T0, T1, T2 Mobile sampling on yellow line) Figure 15 Total Dissolved Gas monitoring stations in the Columbia River at Chief Joseph Dam (Transects T4) Figure 16 Total Dissolved Gas monitoring stations in the Columbia River at Chief Joseph Dam (Transects T0, T1, T2, T4) Figure 17 Total Dissolved Gas monitoring stations in the Columbia River at Chief Joseph Dam (Forebay Wells Dam) Figure 18 Spill patterns for events 1-12 during the TDG exchange study April 28-May 1, 2009 (Label= total spill discharge kcfs, uniform or bulk pattern, * low tailwater elevation) Figure 19. Mobile Acoustic Doppler Current Profile sampling transects during April 28- May 1, Figure 20. Depth Averaged Velocity on Transects T3 and T4 for Spill Event 6 Bulk Spill of 100 kcfs, Total River Flow 204 kcfs (Trials 47, 51) Figure 21. Depth Averaged Velocity on Transects T3 and T4 for Spill Event 12 Uniform Spill of 99 kcfs, Total River Flow 185 kcfs (Trials 102 and 105)
8 ERDC/ CHL HF-HG vi Figure 22. Depth Average Velocity near proposed Hatchery Entrance for Spill Event 8, Uniform spill 18 kcfs, Total River Flow 159 kcfs (Trial 68) Figure 23. Average Cross Sectional Velocities on Transects T2 and T4 as a function of total river flow Figure 24. Columbia River Stage in the forebay of Chief Joseph Dam, April 27-May 2, Figure 25 Columbia River Stage in the forebay of Chief Joseph Dam, April 30, Figure 26 Columbia River flow and water surface elevations from Wells to Chief Joseph Dam, April 27-May 2, (note: U13 = Turbine unit 13 powerhouse tailwater) Figure 27 Columbia River flow and water surface elevations from Wells to Chief Joseph Dam, April 30, (note: U13 = Turbine unit 13 powerhouse tailwater, Arrows indicate wave propagation U13 tot5 to Wells) Figure 28 Columbia River water surface elevation from Wells to Chief Joseph Dam, Spill Events 1-4, 7, 10. (note: Qt=Total river flow at Chief Joseph Dam) Figure 29. Chief Joseph Dam tailwater elevation as a function of project discharge, blue symbols and during spill testing 4/27-5/2, 2009-pink symbols (note: steady flow duration of 3 hours and longer) Figure 30 Deflector Performance Curve and submergence of deflectors during Uniform Events with low powerhouse and high powerhouse flows Figure 31 Chief Joseph Operations, Tributary Flows, and associated water temperatures at selected sampling stations, April 27-May 1, Figure 32 Chief Joseph Operations, Tributary Flows and associated water temperatures at selected sampling stations, April 30, Figure 33 Chief Joseph Operations, Tributary Flows, and associated water temperatures at selected sampling stations featuring Transect T5, April 27-May 1, Figure 34. Lateral Distribution of Water Temperature and Dissolved Oxygen in the Columbia River on Transect T4, Sample 56 (Right Bank based on downstream orientation) Figure 35. Time history of project operations and Total Dissolved Gas Pressures in the Columbia River at Transect T0 and selected monitoring stations, April 28-May 1, 2009 (note: AP@CHQW=Atmospheric Pressure at tailwater fixed monitoring station) Figure 36 Time history of project operations and Total Dissolved Gas Saturation in the Columbia River at Transect T0 and selected monitoring stations, April 28-May 1, Figure 37. Columbia River at Chief Joseph Dam Qgen=80 kcfs, Qspill=98 kcfs uniform Spillway Closure May :51:45 pm Figure 38. Columbia River at Chief Joseph Dam Qgen=80 kcfs, Qspill=67 kcfs uniform Spillway Closure May :03:05 pm (Not: initial spill discharge was 98 kcfs prior to gate closure) Figure 39 Time history of project operations and Total Dissolved Gas Pressures in the Columbia River on Transect T1 and selected monitoring stations, April 28-May 1, 2009 (note: spill event label discharge+spill pattern uniform or bulk with * indicating low tailwater conditions) Figure 40 Time history of project operations and Total Dissolved Gas Saturation in the Columbia River on Transect T1 and selected monitoring stations, April 28-May 1, 2009 (note: spill event label discharge+spill pattern uniform or bulk with * indicating low tailwater conditions)
9 ERDC/ CHL HF-HG vii Figure 41 Time history of project operations and Total Dissolved Gas Saturation in the Columbia River on Transect T1 and selected monitoring stations, April 28-May 1, 2009 (note: spill event label discharge+spill pattern uniform or bulk with * indicating low tailwater conditions) Figure 42 Time history of project operations and Total Dissolved Gas Saturation in the Columbia River on Transect T2 and selected monitoring stations, April 28-May 1, 2009 (note: spill event label discharge+spill pattern uniform or bulk with * indicating low tailwater conditions) Figure 43. Time history of project operations and Total Dissolved Gas Pressures in the Columbia River on Transect T2 and selected monitoring stations, April 28-May 1, 2009 (note: spill event label discharge+spill pattern uniform or bulk with * indicating low tailwater conditions) Figure 44 Time history of project operations and Total Dissolved Gas Pressures in the Columbia River on Transect T4 and selected monitoring stations, April 28-May 1, 2009 (note: spill event label discharge+spill pattern uniform or bulk with * indicating low tailwater conditions) Figure 45 Time history of project operations and Total Dissolved Gas Saturation in the Columbia River on Transect T4 and selected monitoring stations, April 28-May 1, 2009 (note: spill event label discharge+spill pattern uniform or bulk with * indicating low tailwater conditions) Figure 46 Time history of project operations and Total Dissolved Gas Pressures in the Columbia River on Transect T4 and selected monitoring stations, April 28, 2009 (note: spill event label discharge+spill pattern uniform or bulk with * indicating low tailwater conditions) Figure 47 Time history of project operations and Total Dissolved Gas Pressures in the Columbia River on Transect T4 and selected monitoring stations, April 29, 2009 (note: spill event label discharge+spill pattern uniform or bulk with * indicating low tailwater conditions) Figure 48 Time history of project operations and Total Dissolved Gas Pressures in the Columbia River on Transect T4 and selected monitoring stations, April 30, 2009 (note: spill event label discharge+spill pattern uniform or bulk with * indicating low tailwater conditions) Figure 49 Time history of project operations and Total Dissolved Gas Pressures in the Columbia River on Transect T4 and selected monitoring stations, May 1, 2009 (note: spill event label discharge+spill pattern uniform or bulk with * indicating low tailwater conditions) Figure 50. Time history of project operations and Total Dissolved Gas Pressures in the Columbia River on Transect T5 and selected monitoring stations, April 28-May 1, 2009 (note: spill event label discharge+spill pattern uniform or bulk with * indicating low tailwater conditions) Figure 51 Time history of project operations and Total Dissolved Gas Saturation in the Columbia River on Transect T5 and selected monitoring stations, April 28-May 1, 2009 (note: spill event label discharge+spill pattern uniform or bulk with * indicating low tailwater conditions) Figure 52. Time history of project operations and Total Dissolved Gas Pressures in the Columbia River at Wells Dam forebay and selected monitoring stations, April 28-May 2, (note: Tracking of Event 100u* and 144b TDG plumes at transects T4, T5, and Wells Forebay) Figure 53 Time history of project operations and Total Dissolved Gas Saturations in the Columbia River at Wells Dam forebay and selected monitoring stations, April 28-May 2,
10 ERDC/ CHL HF-HG viii (note: Tracking of Event 100u* and 144b TDG plumes at transects T4, T5, and Wells Forebay) Figure 54. Time history of project operations and Total Dissolved Gas Pressures in the Columbia River at Wells Dam forebay and selected monitoring stations, April 28-May 4, (note: Qwel=Total Discharge at Wells Dam, Qspill=Spillway Discharge at CHJ, Qchj=total discharge at CHJ) Figure 55. Time history of project operations and Total Dissolved Gas and Dissolved Oxygen Saturation in the Columbia River at station T1P2, April 28-May 1, 2009 (note: spill event label discharge+spill pattern uniform or bulk with * indicating low tailwater conditions) Figure 56. Time history of project operations and Total Dissolved Gas and Dissolved Oxygen Saturation in the Columbia River at station T4P7, April 28-May 1, 2009 (note: spill event label discharge+spill pattern uniform or bulk with * indicating low tailwater conditions) Figure 57. Time history of project operations and Total Dissolved Gas and Dissolved Oxygen Saturation in the Columbia River at station T4P7, April 30, 2009 (note: spill event label discharge+spill pattern uniform or bulk with * indicating low tailwater conditions) Figure 58. Total Dissolved Gas Pressure versus Dissolved Oxygen Concentration at Station T1P2 during spillway flows, April 28-May 1, Figure 59. Total Dissolved Gas Pressure versus Dissolved Oxygen Concentration at Station T4P7 during spillway flows, April 28-May 1, Figure 60. Lateral Dissolved Oxygen Distribution on Transect T4 during bulk spill of 58 kcfs, total river flow 203 kcfs, May 1, Figure 61. Total Dissolved Gas Saturation in spillway flows as a function of the specific spillway discharge with and without spillway flow deflectors Figure 62 Total Dissolved Gas Saturation in spillway flows as a function of the specific spillway discharge with and without spillway flow deflectors at station T1P1 ( 1999 data without spillway flow deflectors, 2009 with spillway flow deflectors) Figure 63 Observed and Estimated Total Dissolved Gas Saturation as a function of total spill discharge at Chief Joseph Dam (Estimated TDG response from Dissolved Gas Abatement Study (NWS, 2000) green dashed line, Observed 2009 red symbols) Figure 64 Station and Event averaged Total Dissolved Gas pressure in the Columbia River below Chief Joseph at selected sampling stations in spillway releases Figure 65. Station and Event averaged Total Dissolved Gas pressure in the Columbia River below Chief Joseph For Transect T1 (Spill Event Label: spill discharge kcfs ###, Spill pattern uniform or bulk, * low tailwater event) Figure 66. Station and Event averaged Total Dissolved Gas Saturation in the Columbia River below Chief Joseph For Transect T1 (Spill Event Label: spill discharge kcfs ###, Spill pattern uniform or bulk, * low tailwater event) Figure 67 Station and Event averaged Total Dissolved Gas pressure in the Columbia River below Chief Joseph For Transect T2 (Spill Event Label: spill discharge kcfs ###, Spill pattern uniform or bulk, * low tailwater event) Figure 68 Station and Event averaged Total Dissolved Gas Saturation in the Columbia River below Chief Joseph For Transect T2 (Spill Event Label: spill discharge kcfs ###, Spill pattern uniform or bulk, * low tailwater event) Figure 69 Station and Event averaged Total Dissolved Gas pressure in the Columbia River below Chief Joseph For Transect T4 (Spill Event Label: spill discharge kcfs ###, Spill pattern uniform or bulk, * low tailwater event)
11 ERDC/ CHL HF-HG ix Figure 70 Station and Event averaged Total Dissolved Gas Saturation in the Columbia River below Chief Joseph For Transect T4 (Spill Event Label: spill discharge kcfs ###, Spill pattern uniform or bulk, * low tailwater event) Figure 71 Observed cumulative flow and dissolved oxygen concentration distribution on Transect T4 during spill event 2, uniform spill of 58 kcfs, powerhouse flow 60 kcfs (Multiple Trials 12-15) Figure 72 Chief Joseph tailwater fixed monitoring station and communication platform for Total Dissolved Gas Saturation (CHQW) Figure 73 Total Dissolved Gas Saturation comparison for paired stations CHQW and CHQW-Dup located at the Chief Joseph tailwater fixed monitoring site at 1, 2, and 2:45 hrs into spill event. (CHQW in conduit, CHQW-Dup on channel bottom) Figure 74 Observed Delta Total Dissolved Gas Pressure in Spillway Flows as a function of spillway discharge for uniform and bulk spill events on Transects T1, T2, and T Figure 75 Observed Total Dissolved Gas Saturation in Spillway Flows as a function of spillway discharge for uniform and bulk spill events on Transects T1, T2, and T Figure 76 Frequency summary of hourly Total River Flow and Forebay TDG saturation for the Columbia River at Chief Joseph Dam, Figure 77 Observed and Calculated Delta Total Dissolved Gas Pressure as a function of unit spillway discharge for uniform and bulk spill events (note: weighted unit spillway discharge, exponential function model) Figure 78 Observed and Calculated Delta Total Dissolved Gas Pressure as a function of unit spillway discharge for uniform and bulk spill events (note: weighted unit spillway discharge, power function model) Figure 79. Observed and Calculated Total Dissolved Gas Pressure on Transect T4 and Chief Joseph Dam operations April 28-May 1, 2009 (power function model Equation 8) Figure 80 Observed and Calculated Total Dissolved Gas Pressure on Transect T4 as a function Chief Joseph Dam operations for April 28-May 1, 2009 (exponential function model) Figure 81 Calculated and Observed TDG saturation in the forebay of Wells Dam, April 28- May 1, Tables Table 1. Sampling Station Coordinates Washington State Plane North NAD Table 2 Chief Joseph Total Dissolved Gas Exchange Study Operating Conditions Table 3 Photo and Video reference for spill events, April 28-May 1, Table 4. Columbia River Water Surface Elevation during Spill Events 1-12, April 28-May 1, Table 5 Event averaged Total Dissolved Gas Pressure for sampling station in Columbia River at Chief Joseph Dam (Transects T1-T4) Table 6 Event averaged Total Dissolved Gas Saturation for sampling station in Columbia River at Chief Joseph Dam (Transects T1-T4) Table 7 Summary of observed flow, dissolved oxygen concentration, and estimated entrainment discharge for manual sampling trial Table 8 Flow Weighted Coefficients for Cross Sectional Average Estimates on Transect T Table 9 Event Averaged Total Dissolved Gas Pressure and Flow Weighted Cross Sectional Average on Transect T
12 ERDC/ CHL HF-HG x Table 10 Event summary data for TDG exchange model determination
13 ERDC/ CHL HF-HG xi Preface The U.S. Army Engineer District Seattle (NWS) funded the work described in this report. The authors would like to thank the following Seattle District personnel for their assistance in planning, and implementing this study: Kent Easthouse, Amy Reese, Julie Allen, Jeff Laufle, and Carolyn Fitzgerald. The project staff at Chief Joseph Dam also deserves recognition for the successful completion of this study by providing access to facilities and records maintained at the powerhouse. The authors also would like to thank the assistance of contractors Dr. Joe Carroll, and Mr. Mark Gunter for their support in planning, executing, and compiling the detailed water quality and hydraulic data collected in this study. The report was prepared by Mr. Mike Schneider, U.S. Army Engineer Research and Development Center, Coastal and Hydraulic Laboratory (ERDC-CHL), and Ms. Laurin Yates, (ERDC- CHL). Dr. Steve Wilhelms (ERDC-CHL) provided technical review of this plan of study and data analyses of the TDG exchange observations. The following draft document represents a summary of the total dissolved gas exchange study conducted at Chief Joseph Dam on the Columbia River during April 28-May Any questions or comments regarding this document can be addressed to Mike Schneider
14 ERDC/ CHL HF-HG xii Unit Conversion Factors Multiply By To Obtain acres 4, square meters acre-feet 1,233.5 cubic meters angstroms 0.1 Nanometers atmosphere (standard) Kilopascals bars 100 Kilopascals British thermal units (International Table) 1, Joules centipoises pascal seconds centistokes 1.0 E-06 square meters per second cubic feet cubic meters cubic inches E-05 cubic meters cubic yards cubic meters degrees (angle) Radians degrees Fahrenheit (F-32)/1.8 degrees Celsius fathoms Meters feet Meters foot-pounds force Joules gallons (U.S. liquid) E-03 cubic meters hectares 1.0 E+04 square meters horsepower (550 foot-pounds force per second) Watts inches Meters inch-pounds (force) newton meters kilotons (nuclear equivalent of TNT) Terajoules knots meters per second microinches Micrometers microns 1.0 E-06 Meters miles (nautical) 1,852 Meters miles (U.S. statute) 1, Meters miles per hour meters per second mils Millimeters
15 ERDC/ CHL HF-HG xiii Multiply By To Obtain ounces (mass) Kilograms ounces (U.S. fluid) E-05 cubic meters pints (U.S. liquid) E-04 cubic meters pints (U.S. liquid) Liters pounds (force) Newtons pounds (force) per foot newtons per meter pounds (force) per inch newtons per meter pounds (force) per square foot Pascals pounds (force) per square inch Kilopascals pounds (mass) Kilograms pounds (mass) per cubic foot kilograms per cubic meter pounds (mass) per cubic inch E+04 kilograms per cubic meter pounds (mass) per square foot kilograms per square meter pounds (mass) per square yard kilograms per square meter quarts (U.S. liquid) E-04 cubic meters slugs Kilograms square feet square meters square inches E-04 square meters square miles E+06 square meters square yards square meters tons (force) 8, Newtons tons (force) per square foot Kilopascals tons (long) per cubic yard 1, kilograms per cubic meter tons (nuclear equivalent of TNT) E+09 Joules tons (2,000 pounds, mass) Kilograms tons (2,000 pounds, mass) per square foot 9, kilograms per square meter yards Meters
16 ERDC/ CHL HF-HG 14 1 Executive Summary An investigation of the Total Dissolved Gas (TDG) exchange at Chief Joseph Dam with spillway flow deflectors across the entire spillway was conducted during the period of April 28-May 1, This study was designed to quantify the hydraulic and TDG exchange performance of the spillway flow deflectors in the tailwater channel of Chief Joseph Dam. A secondary objective was to determine the transport, mixing, and dissipation of the TDG pressures contained in project releases through the Columbia River to Wells Dam. A total of twelve spill events were scheduled during this four day period with spillway discharges ranging from 18 to 144 thousand cubic feet per second (kcfs). The influence of both uniform and non-uniform spill patterns were evaluated as was the influence of a range of tailwater elevations. The TDG exchange was determined from an array of logging fixed position TDG sondes positioned in the Columbia River both above and below the dam. Supplemental data was gathered during mobile velocity and dissolved oxygen sampling during each test spill condition. The prominent findings from this investigation are listed below. The addition of spillway flow deflectors at Chief Joseph Dam has significantly reduced the exchange of TDG pressures during spillway operations when compared to the original spillway design. For spillway flows over 38 kcfs the magnitude of reduction in TDG saturation approached 15 percent saturation with spillway flow deflectors. Prior to the addition of spillway flow deflectors at Chief Joseph Dam, a spillway discharge of as little as 36 kcfs resulted in TDG saturations greater than 120 percent saturation. With spillway flow deflectors, a uniform spill of 142 kcfs was sustained with TDG levels remaining slightly below 120 percent saturation. The magnitudes of the total dissolved gas pressures observed in spillway releases were found to be a function of the spillway discharge, spill pattern, and tailwater elevation. The twelve spill events scheduled during this study resulted in TDG saturations in spillway flows measured near the tailwater fixed monitoring station ranging from 108 percent for a uniform spill of 18 kcfs to 120 percent during a non-uniform spill of 98 kcfs. The spillway discharge resulting in a TDG saturation of 110 percent was found
17 ERDC/ CHL HF-HG 15 to occur for spillway flows near 18 kcfs. The encroachment of the mixing zone at the tailwater fixed monitoring station during these small spillway discharges may also influence the resultant TDG saturations. The TDG exchange observed during this study approached but did not exceed 120 percent of saturation as observed at the tailwater fixed monitoring stations for a uniform spillway discharge up to 142 kcfs. The TDG pressures measured just downstream of the stilling basin experienced the highest levels observed during this study of 125 percent saturation during a uniform spill of 142 kcfs. The TDG exchange study of the original spillway in 1999 measured peak TDG pressures in this area of 174 percent during a spill of just 48.4 kcfs over 9 spill bays. These peak TDG pressures were observed within the zone of highly aerated flow and were not representative of the TDG levels observed downstream of the aerated flow. The non-uniform spill pattern was found to consistently produce higher TDG pressures in spillway flows when compared to a similar spill discharge using a uniform spill pattern. The non-uniform or bulk spill patterns generated TDG pressures that were 20 to 40 mm Hg higher than observed during a uniform spill at the same spill discharge. A uniform spill pattern is recommended for future operations of the Chief Joseph spillway to minimize TDG exchange. In cases where two levels of spill gate openings are required to meet total spill discharge requirements, the location of the higher gate openings should be evenly distributed across the spillway. The presence of higher tailwater elevations resulted in higher TDG pressures in spillway flows for the three paired spill events during this study. The higher TDG pressures result from the additional stilling basin depth of flow and the trajectory of the spill jets throughout the stilling basin. In general, lower lake levels were maintained throughout the Wells pool during this study causing lower than normal tailwater conditions at Chief Joseph Dam.
18 ERDC/ CHL HF-HG 16 The TDG pressures observed across the Columbia River at the tailwater fixed monitoring station reflect the development of a mixing zone between powerhouse and spillway releases. The entrainment of powerhouse flows into highly aerated flow conditions below the spillway were small during most of the spillway operations scheduled during this study period. Nonuniform spill patterns can generate return currents into the stilling basin containing powerhouse flows. The observed TDG pressures from the tailwater fixed monitoring station CHQW were not representative of conditions in the river during spillway releases during this investigation and were not used to characterize the TDG exchange in spillway operations. The slow and attenuated TDG response at this sampling station was consistent with restricted exchange of water between the river and the instrument deployment conduit. The trial deployment of the tailwater fixed monitoring instrument outside of the housing conduit is recommended until repairs can be made to this site. The average TDG loading in the Columbia River below Chief Joseph Dam was found to be closely approximated by a conservation statement where the powerhouse flows contain the TDG content observed in the forebay and spillway flows contain the TDG levels observed at the tailwater fixed monitoring station. The average travel time for TDG plume passage from Chief Joseph Dam to Wells was estimated to be about 1 day during the four days of testing. The TDG levels arriving to Wells Dam are consistent with the TDG levels releases from Chief Joseph Dam when accounting for dilution from tributary flows, reaeration, dispersion, and net heat exchange during passage. There was no evidence of tailwater elevations surging during the spill test. The tailwater elevations were both highly dynamic and correlated with total river discharge. The tailwater elevation was observed to increase in elevation from 775 to 787 ft in a little over a 15 minute period during the study period. The water temperatures in the Columbia River were weakly related to the TDG pressures observed in the tailwater of Chief Joseph Dam. The water temperatures in the Columbia River experienced a 1 degree Celsius increase during the transit to Wells Dam during this study period that can induce a measurable impact on the observed TDG pressures.
19 ERDC/ CHL HF-HG 17 The dissolved oxygen concentrations were found to be highly correlated with TDG pressures at sampling stations located in the tailwater channel below Chief Joseph Dam during the spill test events. The dissolved oxygen measurements during mobile sampling provided detailed estimates of the lateral distribution of dissolved oxygen, properties of the mixing zone at the tailwater fixed monitoring station, and TDG loading of the Columbia River. The flow field generated by spillway releases with spillway flow deflectors has altered the hydrodynamic conditions in the stilling basin and adjoining tailwater channel. The spillway deflectors generate a surface oriented jet that both entrains air and transports the bubble plume downstream of the stilling basin for moderate to high spill rates. The presence of a well defined surface jet also generates an upstream return current near the channel bed that can entrain flow, and transport debris and sediment into the stilling basin.
20 ERDC/ CHL HF-HG 18 2 Introduction The spillway at Chief Joseph Dam was originally designed to efficiently dissipate energy during spillway releases within the stilling basin by creating a plunging spill jet and hydraulic jump. These flow conditions were also responsible for the generation of total dissolved gas supersaturation caused by the entrainment of air bubbles into this plunging spill jet resulting in the transfer of gases into solution at depth in the stilling basin. Biological studies have concluded that elevated TDG levels can result in gas bubble trauma in aquatic organisms. In addition, the Washington State and Colville Tribe water quality standard for TDG is 110 percent. However, the state of Washington allows TDG criteria to be adjusted in the Snake and Columbia rivers when spilling water at dams is necessary to aid fish passage. The Washington TDG criteria adjustment limits TDG saturations to 115 percent at the forebay of next downstream dam, 120 percent at the tailwater, and a maximum one hour TDG saturation of 125 percent. The Seattle District Corps of Engineers studied the TDG abatement alternatives at Chief Joseph Dam and identified spillway flow deflectors as the preferred structural alternative to reduce TDG levels during spill (USACE, 2000). The joint operation of Grand Coulee and Chief Joseph Dams was also identified as an effective and efficient means of reducing TDG loading of the Columbia River. A Type II spillway flow deflector at elevation 776 ft was identified in scaled sectional and general models of Chief Joseph Dam as the best design to limit TDG exchange during spills up to 175 kcfs (Davis, 2004). The construction of nineteen spillway flow deflectors across the entire spillway at Chief Joseph Dam, completed during the winter of 2009, were available for use during the spill test in the spring of This document describes the results of a field study of TDG exchange at Chief Joseph Dam conducted during April 28-May 1, 2009 designed to evaluate the TDG exchange performance of the spillway with flow deflectors over a range of spillway operations. Background A detailed investigation of TDG exchange at Chief Joseph Dam with the original spillway was conducted in 1999 (Schneider and Carroll, 1999). This investigation determined the TDG exchange in spillway flows ranged from 111 to 134 percent and were a direct function of the specific spillway
21 ERDC/ CHL HF-HG 19 discharge. The maximum TDG saturation observed in the aerated spillway release during this study was 174 percent of saturation. The maximum TDG threshold produced during spillway flows was also found to be a function of the tailwater depth of flow. This process was responsible for spillway flow to generate significantly higher TDG saturation than observed during the spill test in Objectives The construction of two spillway flow deflectors on Bays 12 and 13 were completed by April of 2007 and the TDG exchange properties were evaluated during scheduled spillway operations on April 22-23, 2007 for spill ranging from 3.9 to 31.2 kcfs. The interpretation of both visual and hydraulic flow conditions together with direct measurements of TDG pressure generated during spill over bays 12 and 13 with a type II flow deflector at elevation 776 ft supported the conclusion that the deflector design effectively reduced the generation of TDG supersaturation during spillway discharges over a wide range of operations at Chief Joseph Dam (Schneider, 2008). A linear relationship between spill discharge and TDG Saturation was observed during the two bay spill tests with the resultant maximum TDG saturation outside of aerated flow conditions less than 120 percent for all but the highest discharge event. The size of the entrainment discharge associated with the two bay spill patterns moderated the observed TDG saturation. The purpose of the field study was to quantify total dissolved gas exchange during spillway operations at Chief Joseph Dam with the completed spillway flow deflectors on all 19 spill bays. The interaction of powerhouse and spillway releases was quantified and the TDG loading measured for a range of operating conditions. The spillway discharges were scheduled to encompass a full range of operating conditions and included spill levels generating TDG levels in excess of 120% of saturation. Alternative spill patterns were investigated to quantify both hydraulic and TDG generation processes. The results from this study were compared to the TDG exchange performance observed during the 1999 TDG exchange study of the original spillway at Chief Joseph Dam and conclusions drawn regarding the effectiveness of the flow deflector design. This study will also help identify operating conditions which will meet the Washington state water quality standards for Total Dissolved Gas supersaturation on the Columbia River. The findings from this study will be used to document the TDG abatement at Chief Joseph Dam which is consistent with the recommenda-
22 ERDC/ CHL HF-HG 20 tions developed in the Total Maximum Daily Load for TDG on the mid- Columbia River (WDOE, 2004). This study will also be used to update an operating policy for joint operation of Chief Joseph and Grand Coulee Dam for the management of TDG levels in the mid-columbia River. A model of TDG exchange at Chief Joseph Dam was developed from this study and incorporated in the SYSTDG model of TDG in the Columbia River to support spill and TDG management decisions. The study also addressed the adequacy and interpretation of data collected at the forebay and tailwater fixed monitoring stations. The multiple objectives of the spill test are outlined in greater detail below: Performance Validation: Spillway deflectors have not been installed on a dam with as high a head as Chief Joseph Dam or one with the spillway and powerhouse orientation that exists at Chief Joseph. As such, there are a number of aspects of this design that cannot be studied by the hydraulic model or by the experience of other projects. Spillway flow deflectors significantly change the hydrodynamic and TDG exchange properties in the stilling basin and tailwater channel. A controlled spill test at Chief Joseph Dam is required to verify that the deflectors achieve the TDG reduction expected and that there are no significant hydraulic concerns that were not previously identified along the powerhouse and tailwater channel which must be pro-actively addressed. Understand Spill Patterns necessary to minimize TDG levels: The spill test will aid in the determination of the spill pattern (uniform spill vs. bulked spill toward center) that minimizes TDG production in the Columbia River for varying spill volumes. This information cannot be implied from the performance of other projects nor can this information be observed in a physical or numerical model. Understand Joint Operations necessary to minimize TDG levels: The spill test is needed to develop a joint operating policy between Grand Coulee and Chief Joseph to maximize power generation and minimize system wide TDG loading in the Columbia River. Spill under Controlled Conditions: For data to be scientifically sound and defensible, field measurements require controlled operations that allow for the development of equilibrated conditions (as opposed to involuntary spill). Involuntary changes in spill and powerhouse volumes may result in poor data quality or limited range of operations.
23 ERDC/ CHL HF-HG 21 Water Quality: Information obtained from the spill test will help ensure the Chief Joseph Dam Project s best ability to be in compliance with the Clean Water Act by meeting the TMDL for TDG. The spill test will also help identify the best location for the fixed tailwater monitoring station to represent TDG loading to Columbia River as outlined in TMDL. Environmental/ Fisheries: The spill test will establish the optimal spill pattern and joint operation of spill, which will maximize system-wide TDG reduction in Columbia River from Chief Joseph Dam and Grand Coulee Dam and minimize adverse impacts to fisheries resources. Evaluation of Hydraulic Conditions and Dam Safety Impacts: Spillway flow deflectors have significantly changed the hydraulic conditions on the spillway, stilling basin, and throughout the tailwater channel and the effects of this change should be evaluated in a full-scale field test. The hydraulic model identified a number of significant dam safety concerns, including waves and turbulence along the powerhouse, debris entrainment and surging, that the Corps felt could be managed operationally but should be evaluated in the field and monitored closely. The spill test can provide field verification that there are no adverse effects to the powerhouse that were not identified by the hydraulic model. Testing can verify that the surging condition identified in the hydraulic model at higher spill flows does not occur at lower spill levels and that wave run-up, spray, and turbulence is within expectations. It also can evaluate effects on the relief tunnel, and determine potential for increased erosion in the stilling basin. The test will also provide valuable information to the continued study of the uplift problem at CJD that may develop during prolonged spillway operation. Supports the planning, design, and operation of the Chief Joseph Fish Hatchery: Findings from the spill test will provide critical information to the planning, design, and operation of the Chief Joseph Dam Fish Hatchery. The Colville Confederated Tribes, a valued partner of the Corps of Engineers, views this project as well as the gas abatement project as critically important.
24 ERDC/ CHL HF-HG 22 3 Site Characterization Structural Configuration Chief Joseph Dam stretches over one mile across the Columbia River at river mile Behind the dam, lies Rufus Woods Lake which extends 51 miles upstream to Grand Coulee Dam as shown in Figure 1. Chief Joseph Dam discharges into Lake Pateros which extends 29.5 miles to Wells Dam. Designed, constructed and operated by the U.S. Army Corps of Engineers, Chief Joseph Dam is the Corps' largest power-producing dam. The dam rises 236 feet from bedrock to its crest. The powerhouse consists of 27 main generators with a hydraulic capacity of 219 kcfs and a nameplate capacity of 2069 MW. The Chief Joseph powerhouse is oriented in an eastwest direction about 90 degrees to the spillway as shown in Figure 2. The spillway at Chief Joseph Dam has a total length of 980 ft and consists of 19 radial gate-controlled bays, each about 49 ft wide. Piers, 13 ft in maximum width, separate the bays. The spillbays are numbered from 1 to 19 from north to south. The elevation of the spillway crest is ft. The Chief Joseph Dam spillway was originally designed with normal full pool at el 946 ft and to pass the spillway design flood with a surcharged pool elevation of ft. During the 1970 s, additional storage was provided on the Columbia River system by construction of upstream dams. The additional storage permitted expansion of the Chief Joseph hydropower generation capability from 16 to 27 turbine-generators with a raise in normal full pool from el to ft. To accommodate the pool raise, the piers, between the spillway gates, were widened by 4.0 ft, which narrowed the spillway bays. As a result, narrower and higher gates were fabricated and installed. The 980-foot-long 19-bay spillway is designed to pass 1.25 million cfs at a head of approximately 54 ft on the crest. The mean tailwater elevation immediately downstream from the dam is approximately elevation 780 ft. Therefore, the head differential from upper pool to tailwater is about 176 ft. The year-round operating pool ranges from elevation 950 to 956 ft. The tailwater elevation typically ranges between elevations of 780 to 790 ft depending upon the total river flow and Lake Pateros pool elevation. The
25 ERDC/ CHL HF-HG 23 stilling basin at Chief Joseph Dam has a length of 167 ft and a stepped end sill with a height of 11 ft. Energy dissipation is provided by a series of baffle blocks located near the end of the stilling basin with a height of 11 ft as shown in Figure 3. The invert elevation of the stilling basin apron is at 743 ft resulting in a typical depth of flow about ft. An end wall extending the length of the stilling basin bounds the north side of the spillway adjacent to bay 1. The tailwater channel bed elevation varies in elevation downstream of the end sill ranging in elevation from 740 downstream of bays 6 and 7 to elevation of 755 ft downstream of bays 9 through 19 as shown in Figure 4. Other prominent topographic features include a depression in the channel bottom to elevation 725 ft downstream of the end sill below bay 7. The channel bed elevation gradually rises in elevation downstream of the spillway to an elevation of about 755 ft downstream of the powerhouse. A 12.5 ft deflector was completed across the entire spillway with a horizontal elevation of 776 ft. A 10 ft. toe curve provides the transition from the face of the spillway to the deflector. The deflector length was defined as the horizontal distance from the downstream vertical surface to where the projected horizontal surface intersects the spillway. The details of the flow deflector are provided in Figure 3 and a photograph of the spillway flow deflector across the entire spillway is shown in Figure 5. Columbia River from CHJ to WEL The Columbia River extends from Chief Joseph Dam to Wells Dam a distance of 29.5 miles and contains two major tributaries, the Okanogan and Methow Rivers as shown in Figure 1. The Columbia River channel is narrow below Chief Joseph Dam ranging in width between 800 and 1000 ft until reaching the Brewster flats area where the channel width is over 1.5 miles. The bridge at Brewster WA is at river mile or about half way between Chief Joseph and Wells Dams. The Columbia River continues to head in an easterly direction before turning 90 degrees to the south at the confluence with the Methow River. The channel gradually widens downstream of the confluence with the Methow River reaching an average width of about one-half mile in the forebay of Wells Dam.
26 ERDC/ CHL HF-HG 24 4 Properties and Process TDG Properties The TDG pressure in water is composed of the sum of the partial pressures of atmospheric gases dissolved in the water. The primary gases making up TDG pressure in water are Oxygen, Nitrogen, Argon, and Carbon Dioxide and the atmospheric composition of these gases are 20.95, , 0.93, and 0.03 percent, respectively. Henry s Law is an equation of state that relates the solubility of a given gas to the partial pressure. The constant of proportionality is called Henry s constant or the Bunsen coefficient. This equation relates the mass of a constituent gas to the partial pressure at equilibrium. The constant of proportionality is a function of barometric pressure, temperature, and salinity. The mass of dissolved gases in water can be determined from estimates of the TDG pressure, water temperature, and barometric pressure assuming atmospheric composition of gases in solution. For constant temperature and pressure conditions, the total dissolved gas can be represented as either a concentration or pressure in conservation statements. The solubility of a gas in water is dependent on the total pressure, water temperature, and salinity. The total pressure in the water column is composed of the barometric pressure and hydrostatic pressure. The solubility of gas in water doubles at a depth of about 33 ft in response to a doubling of the total pressure. The compensation depth is where the saturation concentration is equal to the ambient concentration in the water. The solubility of gas in water is inversely proportional to the temperature. For example, if the total concentration of dissolved gases is 30 mg/l, an increase in temperature of 1 o C will result in a reduction in the saturation concentration and an increase in the TDG saturation of 2.2 percent. TDG Exchange Processes This section describes processes governing TDG exchange at spillways and powerhouses, based on studies at main-stem dams on the Columbia and Snake rivers. Similarities are drawn between these general processes and
27 ERDC/ CHL HF-HG 25 the existing TDG exchange properties at Chief Joseph Dam. The gas exchange characteristics of a structure are closely coupled to the project hydrodynamics and entrainment of air. Without the entrainment of air bubbles, the exchange of atmospheric gases at a hydraulic structure is restricted to the water surface where gas exchange tends toward equilibrium at 100 percent of saturation. With aerated flow at a dam due to surface aeration, plunging action, or induced aeration, the gas exchange process can quickly become dominated by the entrained bubbles (Wilhelms and Gulliver 1994). If bubbles are transported to depth (even as little as three to four feet), the hydrostatic pressure compresses the bubbles thereby increasing their gas concentrations above atmospheric. This allows the transfer between entrained air and the water column to levels above atmospheric, causing TDG supersaturation. These elevated total dissolved gas pressures cannot be maintained in a non-aerated flow environment, where gas transfer at the water surface tends to reduce supersaturated conditions back to equilibrium at 100 percent saturation. However, at depth the gas remains in solution due to hydrostatic pressure, resulting in the retention of elevated TDG levels in the river. The following description of TDG exchange at different regions of a project is based in part on the near-field TDG studies conducted during the dissolved gas abatement study conducted for federal dams on the Columbia and Snake rivers (USACE 2002). This discussion focuses upon the hydrodynamic and gas exchange characteristics in four regions: forebay, spillway/turbine passage, stilling basin, and tailwater channel. Forebay. The TDG properties in the immediate forebay of a dam are generally uniform, when no thermal stratification or surface warming is present, although they can change rapidly in response to operations of upstream projects, tributary inflows, and meteorological and limnological conditions. A small vertical temperature gradient of 3 to 4 o F can limit the influence of gas exchange at the water surface to the near-surface layers of a pool by inhibiting vertical circulation. Additionally, heating of surface water can cause TDG pressure responses that result in changes to supersaturated conditions because the solubility of a gas in water decreases as water temperature increases (Colt 1984). Although not likely a significant component in the Columbia River at Chief Joseph Dam, biological activity involving the production or consumption of oxygen may also influence TDG pressure. Thus, under stratified conditions, the initial TDG pressure
28 ERDC/ CHL HF-HG 26 of spillway releases may be different from those associated with hydropower releases, depending upon the level of withdrawal. The flow under a spillway gate or into a turbine intake may spawn vortices or other local hydraulic conditions that provide a vehicle for air entrainment. In general, however, TDG contributed by these local phenomena is insignificant. Spillway. The depth of flow and water velocities change rapidly as flow passes under the spillway gate onto the face of the spillway. At Chief Joseph Dam, highly aerated flow develops rapidly on the spillway as flow passes under the tainter gates as shown in Figure 6. The entrainment of air causes a bulking of the depth of flow particularly in the region next to the spillbay piers. The depth of flow increases with distance traveled down the spillway as water droplets begin to separate from the main spillway discharge. The ribbed flow generated by the spillway piers can attain depths greater than 10 ft and produces a considerable amount of spray and standing waves in the stilling basin. These flow conditions likely increase the air entrainment on the face of the spillway; however, the physical exchange processes in the stilling basin and tailrace that is, the forcing into solution of entrained air in the stilling basin and the stripping of dissolved gas in the tailrace dominate the TDG levels in spillway discharges, making the ultimate release of TDG independent of TDG levels in the forebay or generated on the face of the spillway. The main spillway jet encounters the spillway flow deflectors at the base of the spillway and rapidly is redirected with a horizontal velocity component. The redirection of the spillway jet at the spillway flow deflector can be seen during a spillway discharge of 3 kcfs/bay and 7 kcfs/bay in Figure 7. The impact of two adjoining spillway jets in the wake of the spillway piers causes the formation of a vertical jet of water or rooster-tail that becomes more prominent at higher discharges. The formation of this flow feature can be seen in Figure 7 where the expanding jets from adjoining bays intersect resulting in the propulsion of a vertical wall of water. The dispersion of this vertical component of spillway discharge can contribute to a shower of water onto the adjoining river bank areas which can flood local drains or scour loose material over time. The vertical extent of these flow features can be seen in Figure 8.
29 ERDC/ CHL HF-HG 27 Powerhouse Flows. There is little opportunity for entrained air to be introduced into the confined flow path through a turbine, except during inefficient turbine settings at low discharges, when air is aspirated into the turbine (Wilhelms, Schneider, and Howington 1987). During normal turbine operation, there is essentially no change in TDG pressure as power generation flows pass through the powerhouse. Since turbine discharges typically do not entrain air, it has generally been observed that generation discharges pass forebay TDG pressures to the downstream pool (CENPD 1998). The proximity of powerhouse releases to the high-energy environment in the stilling basin can result in a strong interaction of these project discharges. If the powerhouse flows are sufficiently isolated from the stilling basin action, then the fate of powerhouse releases is to dilute (due to lateral downstream mixing) TDG pressures produced by spillway releases. However, if the powerhouse releases are completely or partially entrained into the highly aerated flow conditions of the stilling basin, then this flow may experience TDG exchange processes similar to those experienced by spill and thereby reducing or eliminating the potential for downstream dilution. Observations during the April 2007 spillway test at Chief Joseph Dam conclusively demonstrated that considerable discharge from the powerhouse was redirected into the aerated flow in the stilling basin and adjoining tailwater channel. This return flow was promoted by the recirculation cells that developed downstream of inactive spill bays. Stilling Basin. The flow conditions in the stilling basin are highly threedimensional and are shaped by tailwater elevation, project head, spillway geometry, and the presence of spillway piers, sidewalls, baffle blocks, and end sill. In general, however, the flow conditions downstream of the original spillway at Chief Joseph Dam were characterized by highly aerated flow plunging to the bottom of the stilling basin. A bottom current directs flow out of the stilling basin, while a surface roller returns flow back to the plunge point. The baffle blocks and end sill redistribute the bottomoriented discharge current throughout the water column. Because of the high air entrainment and the transport of air to full stilling basin depth, a rapid and substantial absorption of atmospheric gases takes place in the stilling basin. These flow conditions result in the maximum TDG pressures experienced below the dam.
30 ERDC/ CHL HF-HG 28 The TDG in the stilling basin, as well as downstream of the tailrace is dependent upon the specific discharge of the spillway. Previous studies have suggested that stilling basin TDG levels at very low specific discharges may be relatively low, around 120 percent, but rapidly climb with increasing discharge to asymptotically approach a maximum, that depends upon the stilling basin depth. The peak levels of TDG observed during the 1999 TDG exchange study at Chief Joseph Dam near the exit of the stilling basin exceeded 170 percent of saturation. In previous studies of spillway flow deflectors, hydraulic performance was classified into several hydraulic flow regimes or categories depending upon the flow conditions in the stilling basin. Plunging flow includes aerated plunging flow, which occurred when the underside of the surface jet was vented at the downstream end of the deflector; unstable aerated plunging flow, which occurred when the underside venting of the surface was inconsistent and non-aerated plunging flow, which occurred when the underside aeration ceased. Unstable or surging flow occurred with the flow alternately attempting to ride the surface of the tailwater, but then plunging to the stilling basin floor with tailwater surging over the plunging flow. Skimming flow or surface jet occurred when the spillway jet remained along the surface of the tailwater with a relatively flat water surface with no plunging action and little down welling. Undulating flow or an undulating surface jet occurred when the spillway jet coming off the deflector would ride over the downstream water surface forming an undulating surface with standing waves. Ramped surface jet occurred when the spillway jet coming off the deflector would ramp up steeply on the downstream water surface forming an undulating surface with significant down welling at the standing waves. Surface jump occurred when a hydraulic roller formed at the deflector, resulting in a hydraulic jump that was elevated off the stilling basin floor. This includes an unstable surface jump, which occurs when the sloping upstream face of the surface jet attempts to break over into a surface jump, but retreats and starts again. Submerged surface jump occurred when, with higher tailwater, the surface jump was inundated on the deflector, resulting in a submerged hydraulic jump that was elevated off the stilling basin floor. A surface jet has been identified as the preferred flow regime or performance category to help minimize potential plunging action and the resulting elevation of dissolved gas levels. The performance of the Chief Joseph spillway and deflectors has been analyzed in a section physical model of
31 ERDC/ CHL HF-HG 29 the structure as a function of the deflector submergence and the specific spillway discharge or discharge per spill bay. Deflector submergence was defined as the difference between tailwater elevation and deflector elevation. The highest levels of TDG exchange with spillway flow deflectors in place are associated with the plunging flow regime at low deflector submergences and high specific discharges. It was the intent of this investigation of TDG exchange at Chief Joseph Dam to avoid the plunging flow regime for all test conditions by maintaining sufficient deflector submergence. The spillway jet flow regimes determined in the physical model studies of Chief Joseph Dam are shown in Figure 9. Tailwater Channel. A rapid and substantial desorption of supersaturated dissolved gas takes place in the tailwater channel immediately downstream of the stilling basin (Schneider and Wilhelms 1996). As the entrained air bubbles are transported downstream, air bubbles rise above the compensation depth 1 in the shallow tailwater channel. Above the compensation depth, the air bubbles strip dissolved gas from the water column. The entrained air content decreases as the flow moves downstream, and the air bubbles rise and escape to the atmosphere. Dissolved gas desorption appears to be quickly arrested by the loss of entrained air within 200 to 500 hundred feet of the stilling basin. The depth of the tailwater channel appears to be a key parameter in determining TDG levels entering the downstream pool. If a large volume of air is entrained for a sufficient time period, the TDG saturation will approach equilibrium conditions dictated primarily by the depth of flow. Thus, mass exchange in the tailwater channel has a significant influence on TDG levels delivered to the downstream pool during high spill discharges. The aerated flow conditions in the stilling basin and adjoining tailwater channel for a uniform spill of 142 kcfs are shown in Figure 10 from the roadway above the spillway. The flow conditions for four different uniform spills are shown together in Figure 11 as viewed from the visitors overlook located on the hill side on the north bank opposite the powerhouse. The region of aerated flow extends uniformly downstream from the spillway in all four conditions. The zone of aerated flow begins to encroach on the east end of the powerhouse for a spill discharge of 98 kcfs. 1 Compensation depth is the depth at which the ambient TDG concentration would be at 100 percent saturation relative to the absolute pressure at that depth. For example, for TDG = 110 percent, relative to atmospheric pressure, the compensation depth is approximately 1 meter, where the absolute pressure is about 1.1 atmospheres.
32 ERDC/ CHL HF-HG 30 The rapid exchange of TDG pressures ceases downstream of the zone of bubbly flow. The exchange of atmospheric gasses continues at the airwater surface driving conditions toward 100 percent of saturation. The TDG pressures generated at a dam can also change rapidly throughout a downstream river reach as the mixing zone develops. As discussed previously, hydropower releases entrained into the aerated spillway flows will often be exposed to similar levels of TDG exchange as experienced by spillway releases, thus influencing the amount of hydropower flow available for downstream dilution in the mixing zone. An understanding of the development of the mixing zone is critical to the interpretation of point observations of TDG pressure in the river. In regions where the mixing between powerhouse and spillway releases are incomplete, lateral gradients in TDG pressure will be present and point observations of TDG pressure will reflect some degree of mixing of project flows. The properties of the mixing zone will be dependent upon the tailwater channel features, the location of powerhouse and spillway structures, hydrodynamic conditions in the river, spillway and powerhouse operations, and the entrainment of powerhouse flows into the aerated spillway flows. There are a number of processes that can further influence the TDG characteristics in a river reach below a dam. The mass exchange process in the river will continue to restore TDG levels toward 100 percent of saturation. The mass exchange at the water surface can be greatly accelerated where surface waves increase the air-water interface, entrain bubbles, and promote the movement of water to the surface layer. The roughening of the water surface can be generated by surface winds or channel features such as rapids or local flow obstructions. The inflow from tributaries to the main stem can change the water quality properties in the study area through transport and mixing processes. The heat exchange within the river systems can result in rising and falling water temperatures that influence TDG pressures. The interaction of nutrients, algae, and dissolved oxygen (DO) can impact TDG concentrations in a river. The diurnal cycling of photosynthesis and respiration is chiefly responsible for fluctuations in DO concentrations. These in-river processes influence how rapidly TDG levels are altered from conditions generated during spillway operations.
33 ERDC/ CHL HF-HG 31 5 Study Design Study Approach The TDG exchange at Chief Joseph Dam during spillway operations was quantified over a wide range of project operations defined by spill discharge, spill pattern, tailwater elevation, and powerhouse discharge. The spatial and temporal patterns of TDG pressures were investigated in the region upstream and downstream of the Chief Joseph spillway using an array of automated remote logging TDG instruments. Spillway discharges were systematically varied during the test based on spill bay unit discharges of 1, 2, 3, 5, and 7 kcfs/bay over the entire spillway for both uniform and non-uniform spill patterns. A series of test conditions were also designed to quantify the influence of tailwater stage on the TDG exchange conditions at Chief Joseph Dam. The duration of each spill was 3 hours to allow for steady conditions to develop across the sampling array in the tailwater area. The tailwater stage and velocity field were monitored throughout the study period to identify the lateral flow distribution in the Columbia River below the dam and the appearance of transient flow conditions that can cause the tailwater elevation to oscillate and adversely impact project operations. The spillway and powerhouse operations were held constant to the extent possible during each of the test conditions. The specific timing and duration of spill events were discussed with the action agencies to accommodate water regulation and power generation concerns during four days of testing on April 28-May 1, Instrumentation and Monitoring The spatial and temporal patterns of TDG gas pressures were investigated in the region downstream of the Chief Joseph spillway using an array of 25 automated remote logging TDG instruments. Three of the stations correspond with the fixed monitoring stations at the forebay of Chief Joseph Dam (CHJ), the tailwater of Chief Joseph Dam (CHQW), and the forebay of Wells Dam (WEL). The Seattle District Corps of Engineers staffs and maintains the monitoring station at Chief Joseph Dam. Douglas County Public Utility District staffs and maintains the monitoring stations at Wells Dam. The general locations of water quality transects from Chief Joseph Dam to Wells Dam are shown in Figures A summary of TDG sam-
34 ERDC/ CHL HF-HG 32 pling station locations based on a hand held GPS were recorded during deployment and retrieval as shown in Table 1. The station locations at deployment and retrieval were averaged to estimate the sampling location during the study. The water quality instruments were calibrated before testing using the methodology outlined in Appendix A. The calibration of each instrument was evaluated at the end of the testing period to determine if any sensor drift occurred during the study period. Monitoring instruments were programmed to measure and log data at 15 minute intervals. Data collected will include total dissolved gas (TDG), dissolved oxygen (DO at selected stations), temperature (T), and Depth (Z). Fixed position TDG stations were located in the forebay, powerhouse draft tube deck, stilling basin, and tailwater channel to sample the TDG properties in the Columbia River. The proposed sampling plan involving 25 fixed TDG stations located on six main transects. The basic challenge of the sampling design was to obtain a direct measure of the TDG pressures in the spill jet outside of the zone of aeration and prior to dilution with powerhouse releases for a wide range of operating conditions. The TDG pressures in the forebay were measured at stations labeled CHJFB located near the spillway and at CHJ the forebay fixed monitoring station as shown in Figure 13. A sampling station was also located near the east end of the powerhouse (CHJPH) to document the TDG pressures exiting the powerhouse. Transect T1 consisted of three stations (T1P1-T1P3) spanning the channel width about 600 ft downstream of the spillway. This transect is located close to the spillway but outside the influence of powerhouse releases as shown in Figure 14. These stations were enveloped by aerated conditions during the higher spillway flow events. The stations on Transect T1 are similar to locations used in the 1999 TDG field study which experienced the highest TDG conditions observed during the original TDG exchange study. The Transect T2 consisted of four stations located about 2400 ft below the stilling basin and near the exit of Foster Creek. The proposed location of the adult fish ladder for the Chief Joseph Fish Hatchery is also near this transect on the right channel bank. The zone of bubbly flow will not extend to the stations located on Transect T2 for any spill event. This transect was impacted by both powerhouse and spillway flows and experienced a wide range of TDG pressures. The velocity distribution and mobile sam-
35 ERDC/ CHL HF-HG 33 pling of DO and TDG was also conducted on this transect throughout the study period when suitable flow conditions were encountered. Table 1. Sampling Station Coordinates Washington State Plane North NAD 1927 Station x-deploy y-deploy x-retrieve y-retrieve x-avg y-avg Sector* chj chjfb chqw chqwdup chjdtd t1p t1p t1p t2p t2p t2p t2p t4p t4p t4p t4p t4p t4p t4p t4p t5p t5p t5p welfb wel *Transects T2 and T4 were divided into 5o uniformly spaced sectors with sector 1 residing at the left bank and sector 50 residing at the right bank (downstream orientation) A third sampling transect T3 located mid-way between Foster Creek and the Highway 17 Bridge was used for supplemental mobile TDG, DO, and
36 ERDC/ CHL HF-HG 34 velocity sampling. This is a legacy velocity transect used in the 1999 spill test and adjoins the location of the proposed Chief Joseph Fish Hatchery. The forth sampling transect T4 was located at the tailwater fixed monitoring station (CHQW) and contained the largest number of fixed TDG monitoring stations (T4P1-P8) as shown in Figure 15. Mobile DO, TDG, and velocity sampling were conducted on transect T4 throughout the study period to establish the TDG loading generated by project operations. The velocity field was integrated with instantaneous DO observations to determine the dissolved oxygen loading of the Columbia River on this Transect. The instantaneous DO concentrations have been found to be highly correlated with TDG pressures in previous TDG studies. The fixed position TDG stations were used to validate the mobile TDG observations. The fate of the TDG loading as it passes through the Columbia River from Chief Joseph to Wells Dam was be measured at a mid-reach location at the Highway 173 Bridge located near Brewster, WA. A total of three TDG stations were located at the Highway 173 Bridge (T5P1, T5p2, and T5P3). The location of instrument on Transect T5 are shown in Figure 16. The residual TDG levels reaching Wells Dam were measured at the Douglas County forebay fixed monitoring station (WEL) and at a second auxiliary station labeled WELFB as shown in Figure 17. Operating Conditions Spill Magnitude The spill test consisted of 12 spill events three hours in duration at five spill discharges ranging from 18 to 142 kcfs. A uniform and bulk or nonuniform spill pattern were scheduled during this field study to investigate the influence of spillway flow distribution on TDG generation. A low tailwater and normal tailwater operation were also scheduled for uniform spill patterns to investigate the influence of tailwater level on TDG exchange. The low tailwater conditions were achieved through limiting the powerhouse discharge to 60 kcfs. The percent spillway discharge ranged from a low of 11.4 percent to a high of 63.2 percent. Manual sampling of dissolved oxygen, total dissolved gas pressure, water temperature, and flow velocity were conducted at stationary and mobile transects to sup-
37 ERDC/ CHL HF-HG 35 plement the data from the fixed instrument array. The operating conditions for the twelve spill events are summarized in Table 2. Table 2 Chief Joseph Total Dissolved Gas Exchange Study Operating Conditions for events Event Name 18U* 57U* 100U* 38U 38B 98B 144B 18U 142U 58U 58B 97U Q total Q spill Q ph Q sp /Q total Flow 1 (kcfs) Spill Pattern 2 (kcfs) (%) q sp 3 (Kcfs/bay) q spfw 4 (kcfs/bay) TWE 5 (ft) Q sp Q sp Q sp Q sp Q sp Q sp Q sp Q sp Q sp Q sp Q sp Q sp Q sp Q sp Q sp Q sp Q sp Q sp Q sp Project flow for powerhouse (ph), Spillway (sp), and total river flow (total) 2 Spill pattern by event, bays Specific spillway discharge (Qsp/19) 4 Specific spillway discharge flow weighted (Qsp/nbay-eff) 5 Tailwater Elevation (ft)
38 ERDC/ CHL HF-HG 36 Spill Pattern The spill patterns used during this study were restricted to gate opening in increments of 1 foot. The uniform spill patterns involved spill gate openings for all 19 gates of 1, 2, 3, 5, and 7 ft. The final spill event 12 began with all 19 bays opened to 5 ft but was forced to open bays 9 and 10 to 6 ft to maintain the total spill discharge. The non-uniform or bulk spill pattern maintained the largest gate opening in the middle of the spillway and stepped down the gate openings on the outside gates. Each non-uniform pattern contained only three different gate openings in a three foot range. A graphical depiction of the spill pattern for the twelve spill events is shown in Figure 18. Schedule The spill test was initiated on April 28 at 7:00 am with a uniform spill pattern using a 1 foot opening with a discharge of 18 kcfs. Three test spill events were scheduled on four consecutive days ending on May 1 at 6:00 pm. The high spill events of 144 kcfs for uniform and bulk spill patterns were both scheduled on April 30. One unexpected outcome of the large variability in Chief Joseph discharges during the testing period was the drawdown of the Wells pool to provide additional storage and reregulation of these river flows. These lower pool conditions resulted in slightly lower tailwater conditions at Chief Joseph Dam.
39 ERDC/ CHL HF-HG 37 Flow Field 6 Results Visual Patterns The surface flows and entrained air conditions were observed and recorded on video and still photography during all of the spill events. A series of videos and still photographs were taken from the visitors overlook on the north shore opposite the powerhouse and can be accessed through the links provided in Table 3 (web link required to view videos). A series of photographs taken from the visitors overlook on the right bank opposite from the powerhouse are found in Appendix B. Table 3 Photo and Video reference for spill events, April 28-May 1, Qtotal Qspill Qph TWE Photo Video Event Name (kcfs) (kcfs) (kcfs) (ft) 1 18U* Figure B U* Figure B U* Figure B U Figure B B Figure B B Figure B B Figure B U Figure B U Figure B U Figure B B Figure B U Figure B9 The spillway flow deflectors effectively redirected the spill jet to a horizontal orientation for all test conditions. This redirection of the bulk flow away from a plunging trajectory was responsible for reducing the effective depth of entrained air and magnitude of TDG supersaturation. The interaction of the spillway jet just downstream of the flow deflectors resulted in an undular hydraulic jump and considerable spray attributed to the ride up of flow along the spillway piers as shown in the following video (
40 ERDC/ CHL HF-HG 38 The downstream extent of highly aerated flow conditions was a function of both spillway discharge and spill pattern. The uniform spill pattern events resulted in aerated flow extending downstream equal distances across the entire spillway. For the bulk or non uniform spill patterns, the extent of highly aerated flow conditions was related to the discharge per bay with bubbly flow extending much further downstream below the center section of the spillway than on either end. The extent of highly aerated flow conditions encroaches upon the powerhouse for flows of 58 kcfs and higher. Downstream of the aerated flow conditions, the transport of water during uniform spill events moved downstream at a consistent velocity and direction. The powerhouse flows forced the spillway waters to move towards and along the right channel bank. The spillway waters contains foam markers generated in the highly turbulent environment in the stilling basin. For the non-uniform spill patterns, the flow velocities and patterns were more complex with upstream movement of powerhouse flows observed during the 38B and 58b conditions along the east end of the powerhouse. The higher unit discharges in the middle of the spillway seemed to draw water in from the adjacent spill bays with less flow. The spillway releases during these nonuniform spill events were also transported away from the powerhouse to the northern half of the tailwater channel. The acceleration of channel flows were associated with the channel constriction near Foster Creek where flows released from the west end of the powerhouse are forced to make a 90 degree turn. The flow separates from this sharp change in the orientation of the channel forcing most of the river flow to reside in the northern half of the channel. Acoustic Doppler Current Profiling The mobile sampling of the velocity field with an Acoustic Doppler Current Profiler (ADCP) was used to quantify the three dimensional velocity field and associated circulation patterns. The ADCP sampling was restricted to regions with no residual air bubbles along Transects T2, T3 and T4. Several mobile samples were collected on Transect T1 for the first spill event of 18 kcfs. In addition to mobile transecting, velocities were collected along the proposed location entrance of the fish hatchery (FH). A total of
41 ERDC/ CHL HF-HG mobile velocity transects were conducted during the first twelve spill events and the location of these mobile velocity samples are show in Figure 19. A statistical summary of the 105 independent velocity transects are listed in Appendix C, Table C1 which contains the time of sample, location, event, average velocity,depth of flow, and total discharge. This velocity equipment does not work well in aerated flow conditions and the signal strength dropped below acceptable levels when encountering these conditions resulting in missing velocity records. The highest velocities were encountered on Transect T2 located near the mouth of Foster Creek. The depth-averaged velocity fields were derived for multiple sampling transects during all twelve spill events. The velocity magnitude and direction along Transects T2 and T4 during Event 6 are shown in Figure 20. The depth averaged velocities as high as 12 fps were observed along Transect T2 with the highest velocities located along the northern half of the channel. The depth averaged velocities on Transect T4 were as high as 10 fps with the largest velocities also located in the northern half of the channel. The velocity magnitude and direction along Transects T3 and T4 during Event 12 are shown in Figure 21. The depth averaged velocities on Transect T3 also contain velocities approaching 12 fps with the highest velocities located along the northern half of the channel. A duel peaked depth averaged velocities profile on Transect T4 was observed for Event 12 with velocities above 10 fps located both at two points on the transect. The slightly lower velocities in the central portion of the transect was associated with the wake from the bridge pier located upstream of this sampling location. The depth averaged velocities located near the proposed fish hatchery entrance were sheltered by channel features and contained velocities ranging from 3 to 6 fps. The depth averaged velocity vectors along the northern bank near the proposed fish hatchery are shown in Figure 22 during spill Event 8. The depth averaged velocities on Transect T2 were consistently higher than observed on Transect T4 throughout the study period. The average cross sectional velocities were computed on Transect T2 and T4 for all the events and displayed in Figure 23 as a function of the total river flow. The average cross sectional velocities increase with increasing total river flow
42 ERDC/ CHL HF-HG 40 with Transect T2 velocities ranging from about 4 to 10 fps. The average cross sectional velocities on Transect T4 were generally from 1 to 2.5 fps less than observed on Transect T2. Forebay Elevation The scheduling of the widely varying flow events during the study period resulted in utilizing all the active storage in Rufus Woods s reservoir. These operations resulted in forebay elevations ranging from to 956 ft as shown in Figure 24. The forebay elevation estimated at the spillway (CHJFB) on a 15 minute frequency was very similar to the forebay elevation observed upstream of the powerhouse at stations PP_02 and PP_03 (5 minute frequency) throughout this study. The variation in forebay elevation has a direct impact on the spillway discharge during the course of a spill event. The spillway rating curve was used to estimate the individual spill bay discharge and resultant total spill discharge throughout the study period. The total spillway discharge varied from at the beginning of spill event 9 to kcfs near the end of this event due to the forebay water surface elevation falling from 953 to ft. Transient gravity waves with a fundament period of about 30 minutes and a maximum amplitude of 0.4 ft were observed in the forebay during the spill test. These perturbations in forebay stage can be seen in the time history of forebay elevations shown in Figure 25 for April 30, The drawdown of the forebay elevation during changes in operations involving river flows of greater than 200 kcfs occurred uniformly across the powerhouse and spillway of Chief Joseph. Tailwater Elevation The tailwater elevation at Chief Joseph Dam during the study spill events can influence the TDG exchange characteristics by influencing the type of jet flow regime and the associated available depth of aerated flow below the spillway. The tailwater elevation is influenced by the water regulation operations at Wells Dam. The maintenance of lower pool elevations at Wells Dam will translate to lower tailwater conditions at Chief Joseph Dam. The behavior of the tailwater elevation may also have related im-
43 ERDC/ CHL HF-HG 41 pacts on dam safety and turbine operation. The development of a transient surging of the tailwater elevation during high river flow conditions has been noted in physical models of Chief Joseph Dam that may cause periodic fluctuations in the total project head and cause uneven turbine operation. This type of variation in tailwater elevation may also cause an overtopping of the training walls and roadways and allow water to enter protected areas. The spillway jets can also launch water into an airborne trajectory commonly called rooster tails that dump water onto the adjoining channel banks. These flow features are generated by the interaction of spillway jets riding up on the spill bay piers and impacting with the tailwater pool. The abrupt change in tailwater elevation caused by changing project flows can also generate long period waves that propagate downstream and influence water surface fluctuations throughout the Columbia River from Wells Dam to Chief Joseph Dam. This impact on water surface elevations may influence water management decisions, dewater shallow near shore areas, and impact water recreation activities. The Chief Joseph Dam tailwater elevation is a function of the total project discharge and downstream pool elevation influenced by Wells Dam operations. For higher project discharges, the influence of the downstream pool elevation at Wells Dam diminishes and the resultant tailwater stage becomes highly dependent on the Chief Joseph project discharge. The characteristics of the backwater surface profile from Wells to Chief Joseph Dam form the details of the tailwater response at Chief Joseph Dam. During lower flow conditions, the influence of pool level changes at Wells Dam became the dominant determinant of the tailwater elevation at Chief Joseph Dam. The water slope of the Columbia River approaches zero during these very low flow conditions and any change to river storage will determine the tailwater elevation below Chief Joseph Dam. The normal operating pool for Wells dam ranges from 771 to 781 ft. The observed Chief Joseph tailwater elevations and Columbia River water surface elevations were derived from TDG instrument depth observations on a 15 minute frequency during the study period. The deployed elevation of the instruments were estimated from the depth observations during low flow conditions when the water surface slope between Wells and Chief Joseph Dam approached zero on April 30. These estimated deployment elevations were used with observed depths measurements to estimate the Columbia River water surface elevation during the study period. Chief Joseph Dam maintains forebay and tailwater elevation observations on a
44 ERDC/ CHL HF-HG 42 one-minute frequency. The tailwater elevation records corresponding with turbines unit 13 and 23 were used in this analysis of tailwater stage. The tailwater elevation at Chief Joseph ranged from to ft during the study period dewatering the flow deflectors during the early morning hours on April 30 and May 1. The time history of water surface elevation across the TDG sampling stations (Transects T1, T2, T4, T5, Wells FB, U13-TWE at CHJ powerhouse unit 13) during the period of April 27 through May 2 are shown in Figure 26 along with the Chief Joseph spillway (Qsp-chj) and total project flows (Qchj) and Wells Dam releases (Qwells). The Wells pool was drafted prominently during the nighttime hours and allowed to fill during the higher flows associated with scheduled spillway releases from Chief Joseph Dam. These operations resulted in lower tailwater elevations at Chief Joseph Dam when compared to normal water regulation operations where Wells pool elevation are generally maintained much closer to 780 ft. The relationship between Wells forebay elevation and Chief Joseph tailwater elevation during high flow conditions is shown during the 58 kcfs spill operations on May 1 when Wells pool increased over 4 ft during these constant 200 kcfs releases from Chief Joseph Dam. The tailwater elevation at the powerhouse was observed to rise less than ½ foot during this same period (U13) and the water surface elevation on transect T1 remained nearly constant during this period. Conversely, the strong influence of Wells pool elevation on tailwater pool conditions during low flow conditions is evident during the early morning hours on May 1 where a 3 ft drop in the pool elevation at Wells Dam resulted in a 3 ft drop in tailwater elevation at Chief Joseph Dam. There were no transient tailwater fluctuations observed during the project operations associated with the highest spillway flows. The observed tailwater elevations for April 30, 2009 shown in Figure 27 at station U13 (turbine 13) during the peak spill discharges demonstrate a small variance, fast response to changes in operations, and uniform trend during constant flow conditions. Abrupt changes in operation can generate gravity waves that propagate downstream as either positive or negative displacements in the water surface (increased flow-positive wave, decreased flow-negative wave). The abrupt flow increase on April 30 at 0600 hrs resulted in a 12 ft increase in tailwater stage over a 20 minute period. The crest of this wave was observed to arrive at Transect T5 (15 miles downstream) shortly after
45 ERDC/ CHL HF-HG hrs and at Wells Dam shortly before 800 hrs (30 miles downstream). The abrupt decrease in flow at April 30 at 1800 generated a negative wave that can be seen to propagate downstream to Wells Dam with a total travel time of about 1.5 hours. These observations of surface wave generation and transport are generally consistent with the theory describing the celerity of gravity waves. The presence of these transient long period waves can impact water management operations, impact boating safety on the pool, and quickly dewater or inundate shallow reaches of the pool. The water surface profile throughout the Columbia River between Wells Dam and Chief Joseph Dam was estimated during the study period indicating a steep gradient in the channel reach just downstream of Chief Joseph Dam. On average, 45 percent of the total river water surface rise in the Wells pool (Chief Joseph tailwater stage minus Wells forebay stage) is located in the reach between the Chief Joseph Dam and the tailwater fixed monitoring station Transect T4 (1.7 mile reach). The average water surface profile in the Columbia River between Chief Joseph and Wells Dam is shown in Figure 28 for 6 spill events associated with constant total project flows at Chief Joseph Dam ranging from 77 kcfs to 227 kcfs. The event averaged water surface elevation at selected sampling stations are listed in Table 4 along with the deflector submergence. The water surface profiles indicate as much as a 5.5 ft differential between the water surface elevation at the powerhouse of Chief Joseph Dam and Transect T4 located about 1.7 miles downstream. This steep gradient in the water surface is likely a consequence of limited channel conveyance properties in this river reach and resulted in high channel velocities observed during the ADCP sampling. The lower pool elevation at Wells Dam also contributed to the steep water surface slope during these flow events. This water surface rise or setup in the tailwater channel will also influence the TDG exchange properties associated with spillway operations and power generation. The influence of the lower Wells pool conditions on the Chief Joseph tailwater during the study period can be estimated by comparing observed tailwater levels with the historic tailwater stage-discharge response at Chief Joseph Dam tailwater. The hourly tailwater elevation at Chief Joseph Dam as a function of total river flow were summarized from for steady flows with a duration of 3 hours or longer as shown in Figure 29 The observed tailwater elevation during the 12 spill events is also displayed on this figure (pink symbols) and generally falls below the median tailwater response of the historic data. The tailwater elevation
46 ERDC/ CHL HF-HG 44 during the 2009 study period were generally 1-2 ft lower than more typical tailwater elevations observed during normal operations. These lower tailwater elevations may bias the resultant observed TDG pressures observed during this study. Table 4. Columbia River Water Surface Elevation during Spill Events 1-12, April 28-May 1, 2009 Event Spill Jet Flow 3 Q total 3 Q spill River Mile / Transect ΔWSE 4 ΔWSE 4 Def Pattern/ Regime 2 (kcfs) (kcfs) T1- T1-T4 Sub 5 Tailater 1 T1 T2 T4 T5 Wells Wells (ft) (ft) (ft) (ft) (ft) (ft) (ft) (ft) 1 U/L UN U/L RM U/L SK U/H RM B/H B/H B/H U/H RM U/H SK U/H SK/UN B/H U/H SK/UN Spill Pattern Bulk or Uniform/Tailwater High or Low 2 Jet Flow Regime SK=skimming, UN=undular, RM=Ramped 3 Q total and Q spill for Chief Joseph Dam 4 ΔWSE = Change in water surface elevation for referenced stations 5 Def Sub= Spillway flow deflector submergence (WSE T1-776) The spill jet flow regime as determined in scale physical model studies of the spillway flow deflectors at Chief Joseph Dam were a function of the unit spillway discharge (cfs/bay) and deflector submergence (ft). The jet flow regimes were determined for each of the 8 uniform spill events by determining the unit discharge per spill bay and deflector submergence based on the estimated tailwater elevation on Transect T1. The flow regime determination is shown in Figure 30 where Events 9 and 3 fall into the skimming flow regime, Events 12 and 10 fall near the transition between skimming to undular surface jet, Event 1 falls in the undular jet designation extended, and Events 2, 4, and 8 were identified as ramped surface jets. The surface skimming jet conditions are viewed as the optimal condition from a TDG exchange standpoint. The plunging surface jet flow
47 ERDC/ CHL HF-HG 45 regime has been identified as generating higher rates of TDG exchange. The spill events were setup to investigate the influence of tailwater elevation on TDG exchange for three sets of paired spill events: 1 and 8, 2 and 10, 3 and 12. Water Temperature The average water temperatures during the study period in the Columbia River at Chief Joseph Dam gradually increased from 5.5 C on April 28 to just above 6.0 C on May 1. This variation in temperature was unlikely to introduce a measurable bias in TDG exchange in the aerated flow below the spillway. The time history of project operations and water temperatures at selected sampling stations are shown in Figure 31 for the period of April 27-May 1. The lateral temperatures in the Columbia River were small during the study period. The increase in water temperature was observed to peak during the afternoon hours and declined during the nighttime hours as shown in Figure 32. The change in water temperature inroute to Wells Dam driven by meteorologic conditions and the influence of tributary inflows can have a measurable impact on TDG pressures in the Columbia River. There are a couple of noteworthy water temperatures features in the Columbia River that were apparent during the study period. The water temperatures in the Columbia River at Wells Dam were about 1 C warmer than observed at Chief Joseph Dam when accounting for the time of travel between these projects. The gross travel time of the TDG plumes in the river reach from Chief Joseph to Wells Dam was estimated to range from hours. This time of travel allows the registration of water leaving Chief Joseph Dam with the approximate arrival time at Wells Dam a day later. The weather conditions on April 30 and May 1 were considerably warmer than during the first two days of the spill test as shown by water temperature changes in Figure 33. These warmer weather conditions resulted in a greater increase in water temperatures during the latter portion of the sampling period. An increase in water temperature will result in an increase in TDG pressure assuming the mass concentration remains constant. A 1 C increase in water temperature initially containing a TDG pressure of 820 mmhg at 6 C will cause a 20 mm Hg increase in pressure (3.4% saturation) assuming the mass concentration is constant and atmospheric gasses are present in standard ratios 6 C, 7 C).
48 ERDC/ CHL HF-HG 46 The heat exchange (increase or decrease in water temperature) in waters released from Chief Joseph Dam will have a measurable impact on the TDG levels observed at Wells Dam based on these conditions. The water temperatures of the Methow and Okanogan Rivers were considerably warmer than the Columbia River during the study period. The hourly water temperatures in the Okanogan River at Malott (USGS station ) are shown in Figure 31 during the study period and ranged from 10.1 to 14.0 C. The grab sample water temperatures in the Methow and Okanogan Rivers on April 29 and May 2 are also shown in this figure. The water temperature in the Methow River was observed to be about 2.5 C cooler than conditions in the Okanogan but considerably warmer than temperatures in Columbia River. The overall impact of warmer tributary temperatures was generally small during the study period since the average flow in the Okanogan River was 2.1 kcfs and Methow River was 1.7 kcfs compared with the average Columbia River flow of kcfs. However, the influence of warmer tributary inflows can be seen at the sampling transect T5 located downstream of the Okanogan River and Brewster Flats during low flow periods. During low discharge periods at Chief Joseph Dam, the contribution of these tributaries to mainstem flows can be considerable. For instance, during the early morning hours on May 1 the releases from Chief Joseph Dam fell below 40 kcfs for up to 6 hours. The combined tributaries inflows during this low flow period constituted over 10 percent of the inflow to the Columbia River and were responsible for creating warmer pockets of water near the tributary confluences. The passage of these warmer pockets of water were observed on Transect T5 as shown in Figure 33 at stations T5P2, T5P1, and T5P3. In general, the observance of short durations of warmer water temperatures at station T5P2 correspond with periods of low Chief Joseph Dam releases when accounting for time of travel from the Okanogan River. For example, on May 1 the water temperatures increased over 1 C shortly before 9 am at station T5P2 before quickly returning to 5.8 C. This appearance of a pocket of warm water developed at the confluence of the Okanogan and Columbia Rivers during the period of very low releases from Chief Joseph Dam during the first 6 hours of the day. There was consistent evidence that water temperatures released from the spillway were slightly warmer (0.1 C) than being passed through the powerhouse. The manual sampling of DO and temperature at transect T2
49 ERDC/ CHL HF-HG 47 and T4 consistently resulted in warmer right bank water temperatures when compared to left bank temperatures. The lateral temperature difference was generally about 0.1 C during spillway releases as shown in Figure 34. Although this temperature difference was small during this spring study period, the larger atmospheric heat flux during the summer months may contribute to larger vertical gradients in water temperatures in the forebay and more prominent lateral temperature gradients in the tailwater channel during periods of spillway operation. Local Atmospheric Pressure The local atmospheric pressure as measured at the tailwater fixed monitoring station ranged from 740 to 750 mm Hg during the study period from April 28-May 1, The time history of the local atmospheric pressure at the tailwater station CHQW along with project operations are shown in Figure 35. The local atmospheric pressure at station CHQW was used to calculate the TDG saturation at all stations downstream from CHJ dam. The average atmospheric pressure at station CHQW during the 2009 sampling season was mm Hg with a standard deviation of 5 mm Hg. Therefore, it is important to view the summary TDG saturation observations from this study in light of the relatively high local atmospheric pressures that were present during this investigation. A spill event generating a TDG pressure of 898 mm Hg when the local atmospheric pressure was 750 mm Hg will yield a TDG saturation of %. The same event producing a TDG pressure of 898 mm Hg during low pressure conditions of 730 mm Hg will generate a TDG saturation of 123.0%.
50 ERDC/ CHL HF-HG 48 Total Dissolved Gas Pressure Transect T0 The background TDG pressure defined on Transect T0 during this investigation remained nearly constant throughout the study period ranging from 780 to 790 mm Hg as measure at sampling stations CHJ and CHJFB located in the forebay above the powerhouse and spillway respectively. There were also no lateral gradients in forebay TDG pressures during this study as shown in Figure 35 and TDG saturation is shown in Figure 36. The absence of spillway operations upstream at Grand Coulee Dam limited the elevation of background TDG pressures during this investigation. These background TDG saturations averaging 105% were typical for early spring river conditions. The TDG pressure at a sampling station located directly in powerhouse releases (CHJDTD) from turbine units 22 and 23 is also contained in Figure 35 and closely tracks the background TDG pressures observed in the forebay. There are two notable exceptions to this observation on May 1 from 0200 to 0500 hrs and during the increase in TDG pressures on May 1 just after 1800 hrs. The elevated TDG pressures during the morning hours on May 1 correspond with low flow operation of turbine 1 at discharges of less than 3 kcfs. Turbines operating at an inefficient setting can result in low hub pressures that can induce aspiration of air through the vacuum breaker system. The incorporation of air into turbine units at high pressures relative to atmosphere pressure can result in a net increase in TDG pressure above background levels. There is additional corroborating evidence of powerhouse related TDG exchange presented in the review of TDG pressures observed on Transect T2. The abrupt increase in TDG pressures on May 1 at 1800 at station CHJDTD occurred during the closure sequence of a uniform spill of 98 kcfs (5 ft gate opening). The aerated flow conditions below the spillway prior to shutting down the spillway is shown in Figure 37 where the aerated spillway flow just over runs the powerhouse releases from the east end of the powerhouse and the extent of aerated flow is similar below the entire spillway. The closure sequence involved lowering spillway gates sequentially starting with bays 1-3, and 17-19, followed by bays 3-7, and 13-16, and lastly gates A series of photographs capturing the surface flow conditions taken from the visitors overlook located on the hillside on the north side of the river tailwater reach can be found in Appendix D.
51 ERDC/ CHL HF-HG 49 The powerhouse was loaded up to about 80 kcfs during this sequence with units 1, 3-14, and 16 in operation. The duration of this closure sequence was about 19 minutes and was initiated about 1755 hrs and completed at 1814 hrs. The closure of spill bays allowed the development of a strong return current along the left bank drawing powerhouse flows upstream into the stilling basin and into the aerated spillway jet as shown in Figure 38. This entrainment of powerhouse flows was strong enough to capture the entire 80 kcfs powerhouse discharge for a short duration prior to the complete closure of all spill gates. The high TDG levels at station CHJDTD are the consequence of a recirculation pattern setup during the spillway closure operations that included the entrainment of water recently exposed to aerated flow conditions. Elevated TDG pressures were also observed at downstream monitoring stations T2P1, and T4P1 located near the left channel bank as a consequence of these flow conditions. The added discharge to the spillway jet resulted in the extension of the aerated flow regime below the spillway clearly shown in Figure 38. The downstream extent of the highly aerated flow conditions was more than doubled during this change in operation and net reduction in spillway discharge. Transect T1 The nearest downstream sampling stations to the spillway and stilling basin were located on Transect T1 and were intended to capture the TDG exchange prior to encountering powerhouse flows. The limitation of these sampling stations involves falling within the zone of highly aerated flow conditions during higher discharge spillway flows. The time history of TDG pressures and saturations for the three sampling stations on Transect T1 are shown in Figures 39 and 40, respectively during the study period. The three stations remained operational throughout the study period with the exception of the temporary loss of power at station T1P1 during event 8 on May 30. The highest TDG pressures of 960 mm Hg were observed at station T1P2 during the bulk spill of 142 kcfs (Event 7). The TDG pressures generally attained peak TDG pressure within 15 to 30 minutes after steady spillway discharge conditions were established. For most of the spill events, the observed TDG pressure remained relatively constant. The difference in steady state TDG pressures across this transect was generally small for the uniform pattern spill events. The bulk spill patterns consistently resulted
52 ERDC/ CHL HF-HG 50 in much larger lateral differences in TDG pressure with the lowest pressure consistently occurring at station T1P1 which was closest to the powerhouse. The lower TDG pressures at T1P1 were likely due to the entrainment of powerhouse flows moving upstream along the left bank. These recirculation patterns were observed in surface currents and were facilitated by the lower unit discharges in spill bays 18 and 19 for the bulk spill patterns. The high TDG levels were retained on Transect T1 after spillway flows were terminated and were observed to slowly decline due to slow dilution by powerhouse flows. The zone of highly aerated flow was observed to extend beyond Transect T1 for spill flows of 98 kcfs and higher. The TDG pressures observed on Transect T1 for these higher spillway flows should be interpreted as provisional measures within the zone of active TDG exchange. In general, the peak TDG pressures on Transect T1 were higher for the bulk spill pattern when compared to the uniform pattern. There was very little difference in the peak TDG pressures between bulk and uniform spill pattern for a spill discharge of 37 kcfs. The 98 kcfs bulk spill pattern generated peak TDG pressures of 957 compared with only 918 for the uniform pattern. The peak TDG pressures observed on Transect T1 during the uniform spill pattern were higher during the high tailwater events relative to the low tailwater events. During the uniform spill of 18 kcfs, the high tailwater conditions (18u) yielded peak TDG pressures on Transect T1 about 25 mm Hg higher than observed during the low tailwater conditions (18u*). During the uniform 58 kcfs spill, the high tailwater event (58u) yielded TDG pressures that were on average about 10 mm Hg higher relative to the low tailwater event (58u*). For the uniform still at 98 kcfs, the high tailwater event yielded TDG pressures that were slightly higher than the low tailwater event on two of the three sampling station on Transect T1. Transect T2 The sampling stations located on Transect T2 provided a description of TDG pressures downstream of the zone of highly aerated flow but containing water from both spillway and powerhouse releases. Three of the four stations were located in the northern half of the channel to characterize the elevated TDG pressures associated with spillway flows. The time history of the TDG pressure on Transect T2 are shown in Figure 41 along with Chief Joseph operations from April 28-May 1, 2009 while TDG saturations
53 ERDC/ CHL HF-HG 51 are shown in Figure 42. The instrument at station T2P4 malfunctioned on April 30 at 1500 hrs and records were not obtained for the remainder of the study period. The instruments on Transect T2 were removed immediately after the completion of the final spill event on May 1 causing the TDG pressures to drop to local atmospheric pressure. The largest TDG pressure observed on transect T2 was 905 mm Hg during the bulk spill event of 98 kcfs. The peak TDG pressure of 900 mm Hg associated with the bulk spill pattern at 142 kcfs was slightly less than observed during the bulk 98 kcfs spill. The high TDG pressures observed on Transect T2 during the bulk spill of 98 kcfs were likely attributed to the entrainment of flow from bays with a lower discharge into the flow from bays with the highest discharge causing higher velocities, greater retention of entrained air, and higher rates of TDG exchange. In general, the variance in TDG pressures associated with spillway flows at stations T2P2, T2P3, and T2P4 were small during the uniform spill events compared with the bulk spill events. The TDG response on Transect T2 during non-spill operations does support the conclusion that selected powerhouse operations can elevate TDG pressures during certain turbine operations. The average turbine discharge (Qtavg kcfs/unit) and minimum turbine discharge (Qt-min) of operating units is shown in Figure 43 along with the time history of TDG pressures on Transect T2. When the minimum turbine discharge approaches 5 kcfs/unit or less the TDG pressures associated with powerhouse releases generally increase above background levels. The increase in TDG pressures above background levels ranged from 0 to about 20 mm Hg and is comparable in size with the increase in TDG pressures associated with minimal spillway discharges of 18 kcfs. The clearest indication of the TDG uptake associated with powerhouse operation is shown during the hours before and after midnight on April 29 where unit turbine flows in the absence of spill, increased abruptly and the TDG levels dropped off during these operational changes (Figure 43) compared to background levels. There may be an impact of tailwater stage on the extent of TDG uptake during lower specific discharge operations at Chief Joseph Dam due to the backpressures on units (higher tailwater stages would allow for lower rates of air aspiration and lower TDG uptake). The bulk spill pattern consistently generated higher TDG pressures on Transect T2 when compared to the same spill discharge for a uniform pat-
54 ERDC/ CHL HF-HG 52 tern. This observation was consistent with TDG observations on Transect T1. The four spillway flows of 37, 58, 98, and 142 kcfs, the bulk spill patterns resulted in higher TDG pressures by 17, 21, 29, and 3 mm Hg when compared with the uniform pattern. The smaller difference in TDG pressure between the bulk and uniform pattern during spill discharges of 142 percent was likely attributed to the relatively smaller degree of nonuniformity at these high flow rates. The influence of tailwater elevation on TDG pressures on Transect T2 were small with the higher tailwater spill events generating slightly higher TDG pressures. The average TDG pressures on Transect T2 during the high tailwater spills of 18, 37, and 98 kcfs were 6, 11, and 3 mm Hg higher, respectively, than the same spill conditions at lower tailwater elevations. These estimates of TDG pressure differential were based on event average TDG pressure at relevant sampling stations (T2P1 was excluded since this station generally was located in powerhouse releases). Transect T4 The 10 TDG sampling stations located on Transect T4 were designed to provide the primary description of TDG exchange during the 12 spill events at Chief Joseph Dam and support the interpretation of TDG pressures observed at the tailwater fixed monitoring station. An auxiliary station labeled CHQW-Dup (Dup-for Duplicate) was added adjacent to the FMS CHQW on April 30 when data from CHQW were noted to be inconsistent with TDG levels from the manual sampling activities. The auxiliary station was located on channel bottom within 30 ft of the housing pipe used to deploy the tailwater fixed monitoring station and in a near shore recirculation current. The maximum TDG pressure observed on Transect T4 of 900 mm Hg (~120 % saturation) was observed during the bulk spill of both 98 and 142 kcfs suggesting the attainment of an upper threshold of TDG exchange during these spill events. The time history of the TDG pressures on Transect T4 are shown in Figure 44 and corresponding TDG saturations in Figure 45 along with Chief Joseph operations from April 28-May 1, Detailed daily displays of the observed TDG pressures on Transect T4 are shown in Figures 46 to 49. The initial detection and establishment of steady TDG pressures on Transect T4 associated with spillway flows was dependent on the total river
55 ERDC/ CHL HF-HG 53 flow. For low flow conditions associated with spill event 1, the initial elevation of TDG pressures on Transect T4 was observed about 30 minutes after the spill was started and the establishment of steady TDG pressures was reached about 2 hours into the spill event. During high river flows, the first detection of elevated TDG pressures at Transect T4 were observed after about 15 minutes of spill operation and the establishment of steady condition observed about 1 hour into a given spill event. These observations do not apply to the TDG observations at the tailwater fixed monitoring station CHQW. There were prominent gradients in TDG pressure observed across Transect T4 consistent with powerhouse flows tracking along the left side of the channel and spillway flows oriented along the right side of the channel. A mixing zone containing TDG pressures impacted by both powerhouse and spillway flow was also a prominent component of the lateral TDG distribution. The location and extent of the mixing zone on Transect T4 was dependent upon the ratio of spillway to total river flow. The TDG pressures observed at the tailwater fixed monitoring station (CHQW) were not consistent with observations at nearby sampling stations and should be considered erroneous for describing the TDG exchange properties at Chief Joseph Dam during this study period. The time of response of TDG pressures observed at station CHQW compared to nearby stations was slow and peak TDG pressures were attenuated by as much as 50 mm Hg. The time of response to steady conditions at CHWQ was 3 hours and longer with the steady peak TDG pressures consistently less than observed at CHQW-Dup. A post-study evaluation of the water quality sonde deployed at CHQW during the study indicated the instrument was properly calibrated and working properly. The attenuated TDG response at station CHQW was consistent with restricted water exchange between the free flowing river and the housing conduit for the instrument. The accumulation of sediment and debris restricting water exchange between the river and the conduit housing the water quality sonde has been observed at other fixed monitoring stations with similar impacts on the TDG pressure response. The peak TDG pressures were located away from the right channel bank at stations T4P6-P8 for spillway flows of 98 kcfs and 142 kcfs. The maximum cross sectional TDG pressures for the high spill discharge events were found to range from 0-10 mm Hg higher than the TDG pressures observed
56 ERDC/ CHL HF-HG 54 at the station CHQW-Dup. For spill discharges of 58 kcfs and less the peak TDG pressures on Transect T4 were consistently located near the right channel bank in the region of the tailwater fixed monitoring station. The bulk spill pattern events consistently resulted in higher TDG pressures when compared to the uniform spill pattern on Transect T4. A consistent increase in TDG pressure were observed at all sampling stations in waters impacted by spillway flows on Transect T4 when changing from the uniform to bulk spill pattern during spillway releases of 37 kcfs and 58 kcfs on April 29 and May 1. The impacts of higher tailwater elevations on TDG pressures on Transect T4 were mixed. The lower tailwater elevations were achieved during lower powerhouse flows resulting in higher percent spill operations. These operations effectively shift the location of the mixing zone between spillway and powerhouse flows as a function of the ratio of spill to total river flow. The different locations of the mixing zone will result in high TDG pressures for selected sampling stations which is not related directly to determination of the TDG content in spillway releases. There was a tendency for slightly higher TDG pressures to be present during the higher tailwater spill events at stations on Transect T4 located outside of the mixing zone. The TDG pressures were observed to be above background levels below the powerhouse at stations T4P1-T4P3 on several occasions associated with entrainment of powerhouse flows during spill closure operations and during lower unit turbine operations. The elevation of TDG pressures at station T4P1-P3 above background levels were observed after the spillway closure operations for events 3 (98u*), 6 (98b), and 12 (98u) and were caused by the short term entrainment of powerhouse flows into spillway releases. The small lateral gradient in TDG pressures on Transect T4 above background levels during periods of no spill corresponding with low unit turbine discharges typically associated with the lower numbered units. Transect T5 The mid-pool Transect T5 located downstream of Brewster flats was designed to measure the fate of elevated TDG pressures generated during spillway operations. The impacts of dispersion (differential transport),
57 ERDC/ CHL HF-HG 55 degassing (exchange of atmospheric gasses at the water surface), heat exchange, and dilution with tributary inflows was captured at these sampling stations. The time history of project operations and TDG pressures on Transect T5 are shown in Figure 50 and TDG saturations on Figure 51. The data labeled T4avg represent pressures estimated from the integrated TDG pressures observed on Transect T4. The highest TDG pressure observed on Transect T5 of 860 mm Hg was observed at station T5P2 and associated with the bulk spill of 142 kcfs on April 30. The peak TDG pressures observed at the companion stations (T5P1 and T5P3) were lagged 1-2 hours and attenuated when compared to the response in the middle of the channel. The different TDG responses on Transect T5 was likely caused by the slower transport or dispersion of spill events during passage through the shallow Brewster flats channel reach and dilution from the Okanogan River. The longer travel time and shallower flow conditions associated with bank oriented flows through this reach resulted in warmer water temperatures, and promoted greater mixing and exchange of Columbia River flows. The TDG pressures at the middle station (T5P2) typically provided observations of the main content of the spill events lagged by the travel time of 7-9 hours. This gross travel time translates to an average event transport velocity of 1.8 mph (2.7 fps) over this 14.7 mile reach. This travel time will vary as a function of river flows and Wells pool stage conditions. The average TDG pressure on Transect T4 was computed and provides an estimate for the TDG saturation once powerhouse and spillway flows become well mixed. The computed average TDG saturation on Transect T4 compared favorably with the TDG pressures observed at station T5P2 during passage of spill events some 7-9 hours later as shown in Figure 50. The TDG saturation at station T5P2 was generally slightly less than the computed average TDG saturation on T4 and supports the observation that the attenuation in peak TDG pressures at mid-pool is primarily a consequence mixing of powerhouse and spillway flows and not the loss of mass due to off gassing to the atmosphere. Transect Wells Dam The TDG pressures in the forebay of Wells Dam were measured at two stations: the forebay fixed monitoring station (WEL) and a station (WELFB) added to the east side of the dam. The TDG saturations in the forebay at
58 ERDC/ CHL HF-HG 56 Wells dam represent a compliance location for the Washington State TDG standards of 115% based on a moving 12 hour average of hourly observations. The time history of Chief Joseph operations and TDG pressures observed in the forebay of Wells Dam during the study period is shown in Figure 52 and TDG saturations in Figure 53. The maximum TDG pressure observed in the Wells forebay was 830 mm Hg (112.2%) on May 1 which fell below the WDOE TDG standard of 115%. The TDG pressures observed at Wells Dam began to rise above the background TDG levels observed in the forebay of Chief Joseph Dam on April 29 at 0600 about 24 hours after spill was initiated at Chief Joseph Dam. The ability to track distinct spill events arriving at Wells dam was difficult due to the dispersed nature of TDG pressures in the Columbia River. Several spill events causing a rise and fall of forebay TDG pressures can be seen in the pressure time history in the forebay at Wells Dam. The passage of these spill events were consistent with timing of elevated TDG levels upstream as shown for spill events 98u* and 142b in Figure 52. The total travel time for these events was estimated to range from hours resulting in an average transport velocity of 1.3 mph. A grab sample of TDG pressures in the Methow and Okanogan rivers were taken on April 29 and May 2 and indicated the TDG pressures in these tributaries were below background conditions in the Columbia River at Chief Joseph Dam. The relatively small flow contribution from these rivers to total Columbia River flows will minimize the TDG impacts from these tributaries. The time history of TDG pressures observed at station WELFB was delayed by several hours when compared to the fixed monitoring station WEL. The slightly longer response time to spill operations at CHJ dam at the auxiliary station WELFB is consistent with the lagged response at the mid-pool station T5P1 located near the left channel bank. The differences in TDG pressure noted in the forebay of Wells dam will be lessened when calculating the moving 12 hr average TDG saturations used for compliance determination. The impacts of spill at Chief Joseph Dam on TDG pressures observed in the forebay of Wells Dam were examined through an extended period to May 4, 2009 as shown in Figure 54. The TDG levels at Wells Dam forebay
59 ERDC/ CHL HF-HG 57 remained elevated above background levels at Chief Joseph Dam for over two days after spill was stopped. This period of elevated TDG pressures was likely associated with lower river flows, dispersion of TDG events, and a general warming of water in this reach. Dissolved Oxygen The dissolved oxygen concentrations were collected at stations T1P2, T4P4, T4P5, T4P7, and CHQW-Dup throughout the study period with a Hach LDO luminescent dissolved oxygen sensor. This sensor measures the response time of a luminescent material to a light source that is correlated to dissolved oxygen concentration. This measure of dissolved gas is nearly instantaneous in contrast to the TDG pressure sensor that can take up to one hour to reach steady conditions. The dissolved oxygen was also used during manual mobile transecting of the river at transects T2, T3, and T4 during spill events in conjunction with velocity field sampling. The Total Dissolved Gas pressure was found to be highly correlated with the dissolved oxygen concentration at all the fixed position sampling stations during active spillway releases. The time history of the dissolved oxygen saturation and total dissolved gas saturation throughout the study period at station T1P2 are shown in Figure 55. The saturation of TDG and DO respond similarly to changes in spillway flow throughout the study period with the TDG saturation consistently falling from 3 to 5 percent higher than the DO saturation during spillway flows. A short period when the TDG saturation departed from the DO saturation trend occurred on April 28 after the second spill event (57U*) where the TDG saturation was observed to spike for a short period. The disturbance of the TDG membrane by hydraulic forces during a closure sequence could have caused the erratic response of this measure. The DO response provides additional insight into the shorter term exchange of atmospheric gasses that cannot be detected by the slower responding TDG sensor. The observation of abrupt changes in the DO saturation associated with changes in spillway gate opening was evident on multiple occasions at station T1P2. The time history of dissolved oxygen and TDG saturation for a station removed from the highly aerated flow condition in the stilling basin at station T4P7 is shown in Figure 56. The saturation of DO and TDG are nearly equivalent during spillway flows at this station. The variance in the DO
60 ERDC/ CHL HF-HG 58 saturations was smaller at the Transect T4 stations when compared to conditions on Transect T1. The different time of response between the two sensors is clearly shown in Figure 57 where the DO saturation was observed to reach steady state conditions about 30 minutes prior to the TDG pressure sensor. The correlation between the DO concentration and TDG pressure was found to be very strong during the 12 spill events at stations T1P2 and T4P7 as shown in Figure 58 and 59. The correlation coefficient between DO concentration and TDG pressure was estimated to be 0.99 at both stations for a subset of paired observations observed after one-hour of constant operations for each spill event. The differences in the relationships as defined by the intercept constant in the linear regression equations relating DO concentration and TDG pressure at stations T1P2 and T4P7 was likely related to the calibration of the DO sensors. These observations confirm the ability to use DO concentrations as a reliable surrogate in manual mobile sampling of the lateral distribution of DO in the Columbia River. The DO saturations were generally within 1 percent of the observed TDG saturations during spill events supporting the conclusion that the exchange of oxygen occurs at a similar rate as the composite of atmospheric gases. The lateral distribution of discharge and dissolved oxygen were collected during mobile sampling activities for each of the 12 spill events on Transects T2-T4 provided that the signal strength of the ADCP was sufficient to obtain a continuous flow field. The boat tracks during these manual transects varied considerably from track to track because of the severity of the flow field and the desire to concentrate samples in the mixing zone region between powerhouse and spillway flows. In many cases, the path of the sampling vessel doubled back on the transect to provide additional samples in the mixing zone region as shown. The lateral distribution for dissolved oxygen concentrations on Transect T4 during spill event 11 (58b) is shown in Figure 60. The observed DO concentration is indicated by the symbols and the lateral position of the DO observation has been normalized between 0 (left bank) and 1 (right bank). In most cases multiple passes on a Transect were conducted to provide replicate observations of the DO and velocity fields on these transects. The summary of the lateral dissolved oxygen concentrations on the sampling transects is shown in Appendix E for all twelve spill events.
61 ERDC/ CHL HF-HG 59 7 Data Analyses and Discussion TDG Exchange Pre- and Post Spillway Flow Deflector A detailed investigation of TDG exchange at Chief Joseph Dam was conducted in 1999 (Schneider and Carroll, 1999). This investigation determined the TDG exchange in spillway flows ranged from 111 to 134 percent and were a direct function of the specific spillway discharge. The maximum TDG saturation observed in the aerated spillway release during this study was 174 percent of saturation. The TDG saturation was found to be an exponential function of the specific discharge reaching an upper asymptote of 134 percent for unit discharges of 4 kcfs/bay (76 kcfs) and higher. A review of the TDG saturation at the tailwater fixed monitoring station revealed that TDG levels in excess of 140 percent have been observed below Chief Joseph Dam. The observation of TDG levels in excess of the asymptote of 134 percent determined during the 1999 field study was attributed to tailwater elevation contributions. Higher tailwater elevations associated with higher total river flow conditions result in larger stilling basin depths of flow and subsequently higher TDG pressures during spillway operations. A statistical summary of the TDG pressures observed during the 2009 spill study were generated for sampling stations on Transects T1-T4. The TDG observations were pooled for each flow event with duration of 1 hour and longer to exclude transitional observations of TDG pressure. The tabular summary of the observed TDG pressures and saturations by each event are listed in Table 5 and 6 respectively for observations on Transect T1-T4 and background conditions in the forebay. The TDG content in spillway flows observed on Transect T4 for with flow deflectors were considerably less than observed without flow deflectors in the 1999 field investigation. The TDG pressures in spillway flow as a function of unit spillway discharge are shown in Figure 61 for the pre- and post-deflector structure. The TDG pressures associated with spillway flows outside the mixing zone with powerhouse flows were based on observations on Transect T4 as supported by observations upstream on Transect T1 and T2. In cases where the percent spill was greater than 30%, the TDG pressures associated with spillway flows were determined by averaging stations T4P6-P8, CHQW-Dup. For the spill events constitut-
62 ERDC/ CHL HF-HG 60 ing less than 30% of the total project discharge, the TDG pressures closest to the fixed monitoring station were used as the best estimate of the TDG content in spillway flows. In cases where the spillway flows were less than 30% of the total river flow the TDG pressures were found to drop off rapidly near the right channel bank in response to the development of the mixing zone. For these conditions, observations of TDG pressure near the right bank on Transect T4 were consistent with the TDG observations on Transect T2 and T1 supporting the conclusion that these TDG observations are consistent with spillway flows and were not impacted by dilution with powerhouse flows. The reduction in TDG pressures associated with spillway flow deflectors extended over the entire range of spillway flows and remained above 15 percent saturation for unit discharges of 4 kcfs/unit and higher. For example, the TDG pressure associated with a unit spillway discharge of 5 kcfs/bay (95 kcfs) was 134 percent prior to the addition of the spillway flow deflectors compared to percent with flow deflectors based on the least squared trend curve through all the data. The capacity of spill subject to the TDG water quality standards criterion of 120% was increased by a factor of 3 or more with the addition of the flow deflectors. The interpolated spill discharge resulting in a TDG saturation of 120% pre-deflector was about 1.7 kcfs/bay ( 32 kcfs) compared to about 100 kcfs or higher post-deflector. The evaluation of the spill capacity as limited by TDG standards under existing conditions will be evaluated in greater detail in the section on spill management. The reduction in TDG exchange was also very prominent in the Columbia River directly below the stilling basin that often encounters highly aerated flow conditions. The TDG pressures at station T1P1 were compared for both pre- and post-deflector spillway operations as defined by the unit spillway discharge as shown in Figure 62. The variance in the observed TDG saturations at this near-field sampling station was considerably greater than at stations well downstream for this zone of aerated flow. However, the degree of reduction in TDG saturation was even larger than observed at comparable downstream stations with peak TDG pressures falling from 153 percent pre-deflector to 125 percent for current conditions. Estimates of the anticipated TDG exchange associated with the proposed spillway flow deflectors were proposed in the Chief Joseph Dissolved Gas
63 ERDC/ CHL HF-HG 61 Abatement Project (NWS, 2000) and were used to estimate the water quality enhancement for the proposed spillway modification. The estimated TDG exchange curve applied in this study (green dashed line) along with the observed TDG saturations from this study are shown in Figure 63. The observed TDG production curve closely follow the estimates used in the planning study of water quality benefits for spillway releases from 0 to 140 kcfs. In some cases, the observed TDG exchange properties during lower tailwater conditions were better than expectations used during the planning studies. Table 5 Event averaged Total Dissolved Gas Pressure for sampling station in Columbia River at Chief Joseph Dam (Transects T1-T4) Event No Label 18U* 57U* 100U* 38U 38B 98B 144B 18U 142U 58U 58B 97U Q total Q spill Q spill /Q total q sp q sp-wt TWE CHQW-AP CHJ CHJFB CHJDTD T1P T1P T1P T2P T2P T2P T2P T4P T4P T4P T4P T4P T4P T4P T4P CHQW-Dup CHQW CHQW- End* * CHQW-END The TDG saturation at the end of the spill event was listed because of the TDG response at this station.
64 ERDC/ CHL HF-HG 62 Table 6 Event averaged Total Dissolved Gas Saturation for sampling station in Columbia River at Chief Joseph Dam (Transects T1-T4) Event No Label 18U* 57U* 100U* 38U 38B 98B 144B 18U 142U 58U 58B 97U Q total Q spill Q spill /Q total q sp q sp-wt TWE CHQW- AP CHJ CHJFB CHJDTD T1P T1P T1P T2P T2P T2P T2P T4P T4P T4P T4P T4P T4P T4P T4P CHQW- Dup CHQW CHQW- End* TDG Exchange at Chief Joseph Dam Spill Discharge The volume of spill has been one of the most important independent variables used in determining TDG exchange in spillway discharges. In general, the spillway discharge has been found to be directly related to TDG
65 ERDC/ CHL HF-HG 63 exchange. The event averaged TDG pressure at selected sampling stations located in spillway flows (near right bank) are shown as a function of total spill discharge in Figure 64. The relationship between TDG pressure and spillway discharge follows an exponential trend where the slope (ΔTDGP/ΔQ sp ) of the response surface decreases for increasing spillway flows. The variance in TDG pressures for a spill discharge is related to the spill pattern, tailwater elevation, and local atmospheric pressures during the different events. The highest TDG pressures on the selected stations were observed during the highest spillway discharge of 144 kcfs at station T1P3. The location of this station was within the zone of highly aerated flow and departed significantly from the observed TDG pressures located downstream. These TDG observations on Transect T1 for the higher spill events should be considered provisional within the zone of active exchange and therefore do not reflect the final TDG exchange associated with aerated spillway flows. The impacts of an increasingly shallow bubble plume downstream of the stilling basin have been shown to strip TDG pressures from the water column. The highest TDG pressures outside of the aerated flow region were observed during spill flows near 100 kcfs. Lateral Distribution The lateral distribution of TDG pressures in the tailwater channel are important for the determination of the TDG loading, identifying potential entrainment of powerhouse flows, and TDG management. The event averaged TDG pressures and saturations were determined for sampling station below Chief Joseph Dam as shown for Transect T1 in Figures 65 and 66. The spill events are labeled on the x-axis according to the spill discharge (### kcfs), spill pattern (u=uniform, b=bulk), and tailwater condition (*=low tailwater). The spill event label of 100U* refers to a spillway discharge of 100 kcfs uniformly distributed over 19 bays during low tailwater conditions. In general, the TDG pressures on Transect T1 increased for higher spill discharges, bulk spill patterns, and higher tailwater conditions. The bulk spill patterns resulted in much larger variances in TDG pressures on Transect T1 with the lowest levels associated with station T1P1. The bulking of spill in the middle of the spillway induced upstream movement of powerhouse flows that likely contributed to the lower TDG pressures on station T1P1. The lateral distribution of TDG pressures and saturations on Transect T2 indicates both influences from powerhouse and spillway flows as shown in Figure 67 and 68. In general, the three station T2P2-P4 were in waters di-
66 ERDC/ CHL HF-HG 64 rectly influenced by spillway flows for all but the 18u event. The near bank TDG pressures at T2P4 were less than observed at stations T2P3 and T2P2 for spills of 57 kcfs and higher. The TDG pressure differential across the three stations in spillway releases tended to increase for higher spill discharges and was likely impacted by the non-uniform bulk spill patterns. The lateral distribution of TDG pressures on Transect T4 will inform the interpretation of TDG levels from the tailwater fixed monitoring station for routine TDG monitoring of spillway flows. The event averaged TDG pressures and saturations on Transect T4 are shown on Figure 69 and 70. It should be noted that the TDG pressures at the tailwater fixed monitoring station CHQW were not contained in this data summary because of the erroneous response observed at this station. A more detailed discussion of the response at this station will follow. The lateral TDG pressures on Transect T4 range from conditions retaining TDG pressures released from the powerhouse near the left channel bank (T4P1) to TDG pressures associated with spillway flows near the right channel bank (CHQW-dup, T4P8). The mixing zone defines the transitional TDG pressures between these two extreme conditions. For spillway flows up to 58 kcfs, the TDG pressures increased continuously from left to right (T4P1-T4P8,CHQWdup). For spill events 97u and 142u the TDG pressure declined 7 and 8 mm Hg at the CHQW-dup station compared with the maximum TDG pressures observed on transect T4. Reliable TDG data near the tailwater fixed monitoring was missing for the bulk spill events of 98b and 144b when strong near shore TDG gradients were observed at Transect T2. Spill Pattern A total of four paired spill event were scheduled to investigate the sensitivity of the spill pattern to the TDG exchange during spillway operations at Chief Joseph Dam. A uniform spill pattern consisting of all 19 bays set at 2, 3, 5, and 7 ft were scheduled during normal tailwater conditions and were labeled 38u, 58u, 97u, and 142u. Alternative spill patterns where the gate setting ranged from 1-3, 2-4, 4-6, and 6-8 ft crowned in the middle and tapering off to the smallest opens at each end of the spillway constitute spill events labeled, 38B, 58B, 98B, and 144B. In three of the four paired test conditions, the bulk spill pattern generated significantly higher TDG pressures when compared to the uniform pattern. The fourth paired spill events of 142u and 144B the TDG pressure difference was mixed. The event average TDG saturation on Transect T4 are shown in Figure 70 as grouped by the bulk and uniform spill patterns. The difference in TDG
67 ERDC/ CHL HF-HG 65 saturation for the three lower spill events ranged from 2 to 4 percent saturation. The degree of non-uniformity in spill diminishes for higher discharges and the resultant differences in TDG exchange was observed to also diminish. The non-uniform spill patterns were found to generate measurably higher TDG pressures when compared to spillway discharges uniformly distributed over the spillway. The specific spillway discharge or discharge per spill bay for a given spill event was proposed as a means of distinguishing between uniform and non-uniform spill patterns. The spillway discharge was estimated from the spillway rating curve for each bay as a function of the forebay elevation and gate opening. The total spill discharge varied over the spill event due to changes in forebay elevation. During spill event 12, changes in the spill gate openings were made to increase the spill discharge when the forebay elevation reached minimum pool conditions. The specific discharge or discharge per bay was formulated using two measures as listed below in Equation 1: arithmetic average and flow weight average. The arithmetic average specific discharge or flow per active spill bay was determined by dividing the total spill discharge by the number of active spill bays. A second flow weighted estimate of the specific discharge involved weighting the spillway discharge. The arithmetic specific discharge does not distinguish between a uniform spill pattern and a nonuniform spill pattern. The flow-weighted specific discharge will place a greater importance on higher unit discharges and reflects the entrainment of lower spill bay discharges into adjoining spillbay releases with high discharges. q sp n i 1 Q c i n i 1 Q c 1 i (1) q sp = specific discharge (kcfs/bay) Q i = Spillway discharge for bay i (kcfs) n = number of active spill bays (max 19) c = weighting coefficient (1=arithmetic average, >1 flow weighting)
68 ERDC/ CHL HF-HG 66 Tailwater Elevation The purpose of scheduling the first three uniformly distributed spill events at lower powerhouse flows was to maintain lower tailwater elevations. These three spill events were repeated during normal powerhouse operations at significantly higher tailwater conditions allowing the influence of tailwater stage on TDG exchange to be evaluated. The paired events of interest included uniform spill of 18 (events 1 and 8), 58 (events 2 and 10), and 98 kcfs (events 3 and 12). The average tailwater elevations for these paired events are listed in Table 6. The tailwater elevation during event 1 and 8 (18 kcfs spill) were and ft respectively with a corresponding deflector submergence of 3.1 and 6.7 ft. The average tailwater elevation for events 2 and 10 (58 kcfs spill) were and ft respectively with a corresponding deflector submergence of 4.8 and 9.4 ft. The paired spill events 3 and 12 (98 kcfs spill) experienced tailwater elevations of and ft respectively with a corresponding deflector submergence of 7.7 and 10.2 ft. The total stilling basin depth of flow for these spill events ranged from 36.1 to 43.2 ft where a stage change of 3 ft represents roughly a 7 percent change in available depth. The event averaged TDG saturation was determined for each of these six spill events on Transects T1, T2, and T4 as listed in Table 6. The graphical presentation of these finding are shown in Figures where evidence of a consistent tailwater effect is mixed. On Transect T1, a higher TDG response (0.5 to 1.3%) was seen during the higher tailwater spill events for all three spill discharges. The TDG response at stations in spillway releases on Transect T2 also supports the conclusion that higher tailwater conditions tend to result in higher TDG exchange. The TDG observations on Transect T4 most clearly demonstrates the direct relationship between TDG exchange and tailwater elevation as all three events during the higher tailwater conditions yielded higher TDG pressures (1.5 to 3%). The direct relationship between tailwater elevation and TDG exchange was noted at Chief Joseph Dam prior to the construction of spillway flow deflectors. The higher stilling basin depths provide larger hydrostatic pressures to be applied during the TDG exchange process when the entrained air is transported throughout the full extent of the stilling basin. Additionally, for the spillway with flow deflectors, the shallower deflector submergences may also generate more favorable surface skimming trajectories for the entrained air when compared to the higher tailwater flow regimes. The flow regimes determined in the scaled section model of the
69 ERDC/ CHL HF-HG 67 Chief Joseph spillway and stilling basin are shown in Figure 30 along with the conditions associated for all the uniform spill events. Powerhouse Entrainment The fate of powerhouse flows released into the tailwater channel below Chief Joseph Dam provides an important component in estimating the TDG loading to the Columbia River. The TDG content of powerhouse releases generally reflects the background TDG levels observed in the forebay. However, the operation of the powerhouse at Chief Joseph Dam can result in a small uptake of TDG pressures when unit turbine flows are small and the tailwater elevation is low. The entrainment of powerhouse releases into the highly aerated flow conditions in the stilling basin can result in additional exchange of TDG pressures. This entrainment of powerhouse flows containing low TDG pressures into the aerated flow conditions below the spillway can result in a measurable increase in the TDG loading to the Columbia River. The mixing of powerhouse releases with spillway flows downstream of the aerated zone will dilute the higher TDG pressures in spillway flows and lower the average cross sectional TDG pressures in the Columbia River. The presence of highly aerated flow conditions were seen to encroach upon the east end of the powerhouse for the higher spillway discharges. During the non-uniform spill events, the generation of an upstream circulation cell was evident from both visual observations of surface currents and the observation of lower TDG pressures at station T1P1. One means of estimating the effective entrainment discharge of powerhouse releases into the highly aerated flow conditions during spillway operations is to formulate a simple mass balance of TDG pressure where the product of the total river flow and average cross sectional TDG pressure is equal to the product of spillway discharge and TDG pressure in spillway flows summed with the powerhouse discharge and TDG pressures in powerhouse flows. The entrainment of powerhouse flows into the highly aerated flow conditions will reduce the available powerhouse flows and add to the effective spillway discharge as shown in Equation 2. ( Qsp Qph) Cavg ( Qsp Qent) Csp ( Qph Qent) Cph 2 Where
70 ERDC/ CHL HF-HG 68 Q sp = Spillway Discharge (cfs) Q ph = Powerhouse Discharge (cfs) Q ent =Effective powerhouse entrainment discharge (cfs) C avg =TDG pressure (mm Hg) C sp =TDG pressure in spillway flows (mm Hg) C ph =TDG pressure in powerhouse flows (mm Hg) The unknown entrainment discharge in Equation 3 can be estimated given the flows for spillway and powerhouse operations are know, and the TDG pressures/concentrations for cross sectional average, spillway, and powerhouse releases can be determined as shown in Equation 3. ( Qsp Qph) Cavg Qsp Csp Qph Cph Qent ( ) Csp Cph (3) This methodology provides meaningful estimates of the effective powerhouse entrainment when the TDG uptake in entrained powerhouse flows is similar to the TDG uptake experienced by spillway flows and the TDG differential between powerhouse and spillway flows is significant and verifiable. The small TDG differential between powerhouse and spillway flows resulting from the 18 kcfs spill limits the applicability of this approach to this flow conditions. The data collected during the mobile velocity and dissolved oxygen sampling on Transect T4 was used to estimate the entrainment discharge in Equation 4. The dissolved oxygen concentration is used as a surrogate for the TDG pressure in this equation. The average dissolved oxygen concentration in spillway flows, powerhouse flow, and all flows was determined by conducting the integration shown in Equation 4 which determines the flow weighted dissolved oxygen concentration in regions of the transect.
71 ERDC/ CHL HF-HG 69 C avg v c da v da (4) Where v = local velocity normal to boat path (fps) da = cross sectional area (ft 2 ) c = Dissolved oxygen concentration (mg/l) C avg = Flow weighted DO concentration for i=avg, i=sp, i=ph. The lateral distribution of discharge and oxygen were collected during mobile sampling activities for each of the 12 spill events on Transects T2- T4 provided that the signal strength of the ADCP was sufficient to obtain a continuous flow field. The boat tracks during these manual transects varied considerably from track to track because of the severity of the flow field and the desire to concentrate samples in the mixing zone region between powerhouse and spillway flows. In most cases multiple passes on a Transect were conducted to provide replicate observations of the DO and velocity fields on these transects. The cumulative flow and dissolved oxygen concentration distribution along Transect T4 was determined along 50 equally spaced sectors of the channel cross section for spill event 2 as shown in Figure 71. The green line in Figure 71 identifies the delineation between spillway and powerhouse flows based on the cumulative flow distribution. The dashed green lines approximate the location of the mixing zone where DO concentrations are influenced by both spillway and powerhouse flows. The dashed black lines in Figure 71 represent of location of the TDG sampling stations. For the conditions displayed for Event 2, the DO concentration in undiluted powerhouse flows was estimated as mg/l, the DO concentration in undiluted spillway flow was estimated as mg/l, the average DO concentration was estimated as mg/l, and the average entrainment discharge was calculated to equal 6.5 kcfs.
72 ERDC/ CHL HF-HG 70 The complete graphical summary of the lateral distribution of DO for each spill event on Transects 2, 3, and 4 are contained in Appendix E. The DO concentrations when integrated with the flow field allow the estimation of the total DO flux associated with each event. This information can then be used to evaluate the extent powerhouse flows are entrained into the highly aerated flow conditions generated during spillway releases. The comparison for DO distributions between different Transects provides a description of the development of the mixing zone and gradients present in the spillway zone of the channel. These DO observations also provide conformation for the TDG pressures observed across the fixed position sampling array. The calculation of the entrainment discharge is sensitive to the estimates of powerhouse and spillway dissolved oxygen concentrations. For many of the spill events with smaller spillway discharges, the mixing zone appears to encroach upon the north shore of the channel. In these cases, the maximum DO concentration along the north shore was used to approximate the spillway DO concentration. This assumption is supported by the similarity in maximum TDG pressures observed across sampling transects T1, T2, and T4 for these spill events. The entrainment estimation also assumes that the spillway DO concentration is representative of all spillway flows. The ability to estimate the entrainment discharge requires a reliable difference between powerhouse and spillway DO conditions. The entrainment discharge should be treated as an effective entrainment discharge or an added mass discharge and does not necessary represent an observable flow volume. The fate of powerhouse flows encountering aerated flow conditions will likely experience DO exchange outcomes ranging from very little uptake to full integration and exchange conditions of spillway flows.
73 ERDC/ CHL HF-HG 71 Table 7 Summary of observed flow, dissolved oxygen concentration, and estimated entrainment discharge for manual sampling trial. Event SP 1 Trial No. Q total (kcfs) Q spill (kcfs) Q total 2 (kcfs) Error Q total (kcfs) PH Sp DO- DO- DOavg Q ent (kcfs) Q ent - avg (kcfs) (mg/l) (mg/l) (mg/l) 1 u u u u u u u u u u u u u u u u u b b b b b b b b b u u u u u u u u u b b b u u u u SP=Spill Pattern, u=uniform, b=bulk or non-uniform 2 Q total =Total River Flow as determined from ADCP sampling.
74 ERDC/ CHL HF-HG 72 The estimated entrainment discharge were small for nearly all test conditions. Table 7 summarizes the calculation of the entrainment discharge during each test spill event with the event averaged entrainment discharge listed in the last column. The entrainment estimates were not conducted for spill events 1 and 8 because of the small DO gradients between background and spillway DO concentrations. The limited extent of the aerated spillway conditions also minimizes the opportunity for powerhouse flow to encounter aerated flow conditions. The entrainment discharge was estimated to be less than 7.6 kcfs for all flow conditions. The negative entrainment flows determined for events 6 and 9 were associated with single trial computations that resulted in excessively large negative entrainment discharges that are of questionable reliability. The uniformly small estimated entrainment discharges imply the fate of most if not all of the powerhouse releases will act to dilute the dissolved gas content generated in aerated spillway flows. The application of an entrainment discharge of zero can be used to estimate the flow weighted dissolved gas levels in the Columbia River in project releases. Tailwater Fixed Monitoring Station The tailwater fixed monitoring station CHQW is located in a conduit in shallow water near the right channel bank about 1.7 miles downstream from Chief Joseph Dam. The conduit provides protection for the water quality sonde against flow, debris and sediment while allowing sufficient depth of deployment. This type of setup allows for the equipment to have access to power and communications facilities. The water quality instrumentation can be accessed from shore to provide calibration and maintenance servicing. A photograph of the location and conduit housing the station CHQW is shown in Figure 72. The TDG pressures registered during the spill study at the fixed monitoring station CHQW were slow to respond to changes in river conditions and attenuated in magnitude. As shown in Figure 44, the TDG pressures recorded at CHQW were slow to respond to increases in TDG conditions in the river associated with spillway releases and generally never reached steady conditions over the three hour spill event. A similar delayed response was observed when lower TDG pressures returned to the area after spillway flows were terminated. The elevated TDG pressure lingered much
75 ERDC/ CHL HF-HG 73 longer at this sampling station when compared to the nearby TDG stations. A direct comparison of TDG pressures from the stations CHQW and CHQW-Dup indicate an underestimation of TDG levels were observed at the official tailwater fixed monitoring stations (CHQW). The degree of inaccuracy was a function of the duration of the spill event with large differences noted one hour into the event followed by decreasing differences as the spill event proceeded. The underestimation of TDG saturation at station CHQW ranged from 1 to 3 percent saturation at the end of each event as shown in Figure 73. The evaluation of the water quality sonde at CHQW after the spill testing did not reveal any equipment failure or mis-calibration. The most likely cause for the TDG response at CHQW was impaired water exchange between the housing conduit and the free flowing river. The slow water exchange may be caused by sediment and debris accumulation in the conduit. TDG loading or cross-sectional average The flow weighted cross sectional average TDG saturation in the Columbia River was determined for each of the test spill conditions by integrating the velocity field with the TDG data collected on Transect T4. The normalized cumulative flow distribution was determined for each of the 12 spill events based on a cross section subdivided into 50 equal sectors. The normalized cumulative flow distributions were similar for all the spill events due to importance of the channel cross section in determining the conveyance. An average of all 12 flow events was calculated to arrive at a common normalized flow distribution to apply to the event averaged TDG pressures at each of the 9 sampling stations on Transect T4. The weighting coefficient applied for sampling station T4P1-T4P8, and CHQW-Dup are shown in Table 8.
76 ERDC/ CHL HF-HG 74 Table 8 Flow Weighted Coefficients for Cross Sectional Average Estimates on Transect T4. Stations on TransectT4 Sector Left to Right 0-50 Weighting Coefficient (discharge) T4P T4P T4P T4P T4P T4P T4P T4P CHQW-Dup The average flow weighted cross sectional average TDG pressures were calculated using the weighting coefficients listed in Table 8 and the event averaged TDG pressures at all the sampling station on Transect T4. The observed TDG pressures were averaged during each event with a duration of greater than one hour to allow equilibrium conditions to develop. The observations at station CHQW-Dup were available only for events For the first 7 events the TDG pressures at T4P8 were assumed to equal conditions at CHQW-Dup. The results from this flow weighted estimate are listed in Table 9 for each of the 12 spill events in the row labeled T4- avg (T4P#). The flow weighted average TDG pressures on Transect T4 ranged from to mm Hg, or less than 115 percent saturation. The higher percent spill events resulted in higher average TDG pressures on Transect T4 when comparing events with similar spillway discharges. A second flow weighted average TDG pressure was computed assuming powerhouse flows retained the TDG pressures observed at the forebay station (CHJ) and the observed tailwater TDG pressures near fixed monitoring station (CHQW) represented spillway flows. The observations at CHQW-Dup or T4P8 were used to reflect conditions near the tailwater FMS since data at CHQW were judged unreliable during the study period. The results from this simplified flow weighted average are listed in Table 9 for each of the 12 spill events in the row labeled T4-avg (FMS).
77 ERDC/ CHL HF-HG 75 The differences between the 9 station flow weighted cross sectional average TDG pressure T4-avg (T4P#) and the simplified flow weighted cross sectional average based on the observations at the fixed monitoring station CHJ and CHQW were similar throughout the study period as shown in Table 9. The differences between the two estimated listed in the last row of Table 9 (Difference T4-avg) averaged only 2.7 mm Hg and ranged from a maximum difference of 8.8 mm Hg to a minimum difference of -1.5 mm Hg. The event with the highest T4-avg difference (Event 5-38B) experienced TDG pressures along the left channel bank of transect T4 of 783 mm Hg compared with 780 mm Hg observed in the forebay. The use of powerhouse TDG pressures of 783 mm Hg instead of the conditions in the forebay will reduce the difference to 6.5 mm Hg. In summary, the simple flow weighted average TDG pressure using observations from the forebay and tailwater fixed monitoring stations together with spillway and powerhouse flows will closely approximate the average TDG pressures in the river using the nine sampling stations on Transect T4 together with the corresponding flow distribution as determined from the mobile velocity sampling on this transect. Table 9 Event Averaged Total Dissolved Gas Pressure and Flow Weighted Cross Sectional Average on Transect T4. Event Averaged Total Dissolved Gas Pressure (mm Hg) Event No Name 18U* 57U* 100U* 38U 38B 98B 144B 18U 142U 58U 58B 97U CHJ T4P T4P T4P T4P T4P T4P T4P T4P CHQW- Dup na na na na na na na T4-avg 1 (T4P#) T4-avg 2 (fms) Difference T4-avg Flow weighted average of stations T4p1-T4P8,CHQW-Dup (Table 8, weighting coefficients) 2 Flow weighed average using fixed monitoring stations (CHJ, CHQW) and spillway and powerhouse Flows.
78 ERDC/ CHL HF-HG 76 TDG Spill Management The TDG exchange at Chief Joseph Dam was measured for a range of project operating condition for relatively low and constant background TDG levels. The spillway releases from all twelve spill events increased the TDG loading in the Columbia River as background TDG saturations hovered around 105 percent. One general observation derived from TDG exchange studies at other Columbia River projects is the TDG content in spillway flows are independent of the initial conditions in the forebay and effectively reset the TDG pressures in waters encountering highly aerated conditions. The TDG exchange process in highly aerated flow conditions in spillway releases can be considered an equilibrium process and not an additive process independent of the initial TDG levels in the forebay. The initial TDG state of spillway flows in the forebay becomes overwhelmed by the sheer magnitude of the surface area of entrained air and the available hydrostatic pressures imposed on the bubble plume throughout the stilling basin. Therefore, the TDG exchange properties observed during this study in spillway releases should also apply to similar spillway operations with different background TDG levels. A second consequence of the equilibrium dominated TDG exchange process in Chief Joseph Dam spillway flows is the potential for increasing, decreasing, or not changing the TDG content in the Columbia River depending upon the background TDG saturations and the TDG levels created in spillway releases. Grand Coulee Dam can be a prominent source of TDG supersaturation when regulating outlets are used and these elevated TDG loading will be sustained into the forebay of Chief Joseph Dam. The relationship between the spillway discharge and TDG saturation as observed on transect T4 at the tailwater fixed monitoring station illustrates the wide variance of TDG outcomes among the 12 test spill events. These relationships also can provide estimates for spill management conditions constrained by different TDG saturation criteria. The TDG pressure and saturation is shown as a function of spill discharge for all 12 spill events in Figure 74 and 75. The figure can be used to estimate the ranges of spill discharge resulting in certain TDG levels by extrapolating between the results associated with a uniform spill pattern. The range of spillway flows resulting in a TDG saturation of 110 percent was estimated to range from 18 to 35 kcfs. Alternatively, the range of spillway flows resulting in a TDG saturation of 115 percent ranged from about 50 to 83 kcfs. The uniform spill events evaluated in this study do not allow for a reasonable es-
79 ERDC/ CHL HF-HG 77 timate of spillway flows resulting in 120 percent of saturation because the 120 percent condition was not achieved during this study and the uncertainty associated with extrapolating study results. The transference of background TDG levels at Chief Joseph Dam to the downstream river are delivered through powerhouse releases provided the mixing of powerhouse and spillway flows occurs outside of the zone of bubbly flow. The estimation of average cross section TDG pressures in project releases can be reliably estimated by flow weighting the TDG content in powerhouse and spillway releases. Spill management decisions should consider the consequences to the net TDG loading of the Columbia River composed of both powerhouse and spillway flows. A lengthy record of forebay TDG saturations is available at Chief Joseph Dam in the CROHMS database. The hourly TDG pressures in the forebay and total river flow at Chief Joseph Dam from were used to describe the probability distribution of both TDG saturation and river flows. The month of June was selected for detailed evaluation because the highest TDG saturations were often experienced during this period. During the month of June ( ) the likelihood of forebay percent TDG exceeding 110 was about two-thirds of the time. Similarly, the likelihood of the percent TDG exceeding 115 and 120 percent saturation in June was 28 percent and 9 percent respectively as shown in Figure 76. For background TDG levels above 110% there will be a range of spillway flows at Chief Joseph Dam that will reduce the TDG loading in the river and a second range of spillway flows that will add to the TDG loading in the river. The spillway operation that does not change the TDG loading in the river will be referenced as the No Change (NC) spillway discharge or Qsp-nc. The identification of the NC spillway discharge will be influenced by a number of factors such as spill pattern, tailwater elevation, background percent TDG, and local atmospheric pressure. Assuming that a uniform spill pattern will be used and the median TDG response surface shown in Figure 77 is applicable, the NC spillway discharges associated with 110 percent, 115 percent, and 118 percent can be determined as 24 kcfs, 67 kcfs, and 120 kcfs, respectively. A spillway discharge resulting in 120% saturation in spillway flows was not identified in this study and is difficult to estimate through extrapolation given the wide variance in TDG levels
80 ERDC/ CHL HF-HG 78 measured in this study. When the forebay percent TDG condition is 115 percent, spillway flows less than 67 kcfs will reduce the TDG levels in the Columbia River while spillway flows above 67 kcfs will increase the TDG levels in the river below Chief Joseph Dam. The degree of change in average TDG levels will be a function of the both the spillway and powerhouse discharge. If the sustained flow weighted average TDG saturations released from Chief Joseph Dam exceeds 115 percent, the likelihood of TDG levels arriving at the forebay of Wells Dam exceeding 115 percent will also increase. The change in TDG levels during passage through the Wells pool will be a function of the reaeration rates, dilution from tributaries, dispersion of TDG plumes, and thermally induced pressure changes. Typical reduction rates of TDG saturation from Chief Joseph to Wells Dam have been observed to be small (less than 1 percent) when tributary flows are also small. The SYSTDG model of these processes can be used to support spillway operations decision making at Chief Joseph Dam. During low background TDG levels (<110%) at Chief Joseph Dam, spill way operations will increase the TDG levels in the Columbia River and may need to be limited to meet downstream TDG criteria at Wells Dam. Alternatively, during high background TDG levels (>120%) in the forebay of Chief Joseph Dam, spillway operations will likely decrease the TDG levels in the Columbia River and scheduling increasingly higher spillway flow at Chief Joseph Dam will result in greater reductions to the TDG loading. The third case involves moderate TDG levels ( %) in the forebay of Chief Joseph Dam. During these conditions, the spillway discharges above the NC spill will add to the TDG loading and spillway discharge falling below the NC spill will reduce the TDG loading. The scheduling of spill operations at Chief Joseph Dam may also involve spill for power tradeoffs with Grand Coulee Dam. Under certain lack of load conditions, it is advantageous to avoid almost any regulating outlet spill at Grand Coulee Dam. The TDG exchange relationships developed in this study can be used to formulate optimal joint operations for both Chief Joseph and Grand Coulee Dams where additional spill is scheduled at Chief Joseph Dam in exchange for added generation at Grand Coulee Dam.
81 ERDC/ CHL HF-HG 79 TDG Exchange Model Formulation The TDG exchange properties at Chief Joseph Dam prior to the addition of the spillway flow deflectors were approximated by an empirically based regression model based on observed TDG pressures in the Columbia River at the dam. The model of TDG exchange was used in the SYSTDG model of TDG pressures in the Columbia River and supported spill management decisions. The TDG exchange model expressed the delta pressure increase in TDG (ΔP) as a function of the tailwater depth (TWE-743) and specific spillway discharge (q s ) as listed in Equation 5. P ( TWE 743)( e 0.48 qd ) (5) An updated model of TDG exchange was developed from the data collected during the 2009 TDG exchange study to approximate the new structure and operation. This model was based on data pooled from both the uniform and non-uniform spill pattern events for a total of 12 independent observations. The influence of both tailwater elevation and the effective specific spillway discharge were used to estimate the delta total dissolved gas pressure in spillway flows. The model also considers the fate of powerhouse releases in a conservation statement for TDG pressures released from both the powerhouse and spillway. An entrainment coefficient was applied to account for the transport of a portion of powerhouse releases into the highly aerated flow below the spillway. The remaining portion of powerhouse flows were assumed to retain the background TDG pressures in the forebay and dilute the elevated TDG pressures associated with spill releases as releases move away from the dam. The development of a TDG exchange model in the Columbia River at Chief Joseph Dam was based on a nonlinear multivariate regression equation fit to the 12 events scheduled during the study. The empirical equation describing the TDG exchange in spillway flows was based upon the relationship between the delta total dissolved gas pressure, the depth of flow and specific spillway discharge. The delta TDG pressure was calculated by subtracting the local atmospheric pressure from the TDG pressure. The tailwater depth of flow was based on the stilling basin depth determined from observations of tailwater stage below the powerhouse. The specific spill-
82 ERDC/ CHL HF-HG 80 way discharge was estimated from the ratio of the total spillway discharge and number of effective spill bays. To differentiate between uniform and non-uniform spill patterns, a parameter reflecting the number of effectively operating spill bays was proposed. This approach of calculating the effective number of spill bays was based on the assumption that bays with higher discharges will be more influential in determining the TDG exchange than spill bays with lower discharges. The study of non-uniform spill patterns in general physical models indicates the entrainment or focusing of spillway flow into spill bays with higher velocities and turbulence. The number of effective spill bays will range from 1 to 19 at Chief Joseph Dam and is estimated by Equation 6 where Q i is the discharge in bay i, nbays is 19 at Chief Joseph, and C w is the spill pattern weighting coefficient. If C w =1, the equation of effective bays will not distinguish between a uniform or non-uniform pattern. As C w becomes large, the number of effective bays will approach the ratio of total spill discharge to maximum spill bay discharge max(q i ). The spill pattern weighting coefficient was determined in the non-linear regression equation estimation. N bays Nbay 1 Q i Nbay 1 Q Cw 1 i Nbay 1 Q Cw i (6) The data used in the determination of the TDG exchange model was based on the TDG pressures in core spillway flow undiluted from powerhouse flows as observed on Transect T4 at the tailwater fixed monitoring station. For spill events where the percent river spilled was greater than 30%, the event averaged TDG pressures from station T4P6-8, CHQW-Dup were used to represent the undiluted spillway discharge. For spill events where the percent river was less than 30 percent, the TDG pressure at the station closest to the right channel bank (downstream orientation) on Transect T4 was used to represent the undiluted spillway discharge. In general, during the small percent river spilled events the TDG pressures observed near the right channel bank on Transect T4 were consistent with observations on Transect T2 and T1. The event averaged data was based on observations after one hour of operation for each event or data collected during the second and third hour of the spill event. The project spillway discharge was determined from estimates of the spillway rating curve that was a function of gate opening and forebay elevation. The spill patterns were noted from powerhouse records of spill gate opening. The tailwater eleva-
83 ERDC/ CHL HF-HG 81 tion was taken from near the powerhouse at unit 13. A summary of the data used in the TDG exchange model determination are listed in Table 10 for the 12 spill events. Table 10 Event summary data for TDG exchange model determination. Event No Event Label Q total (kcfs) Q spill (kcfs) TWE (ft) Atm Pressure (mm Hg) TDG Pressure T4 (mm Hg) TDG Sat (%) Spill Pattern N bays Eff q s (kcfs/bay) 1 18u* U u* U u* U u U b B b B b B u U u U u U b B u U The relationship between TDG pressure and spillway discharge was estimated from observed TDG levels collected during the 2009 TDG exchange study at Chief Joseph Dam as shown in Equation 7 using a non-linear least squares estimation routine. P 3.27( TWE 743)(1 e 0.58q s ) ( mmhg) (7)
84 ERDC/ CHL HF-HG 82 r 2 = 0.91 Std Error = 10.6 mm Hg Where Qsp qs (kcfs/ft) N eff N eff = Effective number of active spill bays 1-19 (equation 2). Q sp = Total spill discharge (kcfs) TWE = Tailwater surface elevation (ft) TDG sat = (P atm +ΔP)/P atm x 100 Total Dissolved Gas Saturation (%) P atm = Local Atmospheric Pressure ( mm Hg) = 15.5 Spill pattern weighting coefficient c w The large value of the weighting coefficient C w will cause the specific discharge to approach the discharge of the highest spill bay. The observed and calculated delta pressure using Equation 7 are shown in Figure 77 as a function of the specific spillway discharge. The standard error for Equation 7 was 10.6 mm Hg with the largest predictive errors associated with the bulk spill of 58 and 98 kcfs. The responsiveness of the estimated TDG uptake to changes in tailwater stage and spillway flows in spillway releases can be explored using Equation 7. The sensitivity of TDG exchange as a function of a change in the tailwater stage from 780 to 781 ft will result in an increase in TDG pressure of 3.2 mm Hg during a specific spillway discharge of 6 kcfs/bay. Alternatively, an increase in the specific spillway discharge from 5 to 6 kcfs/bay will result in a 3.0 mm Hg increase in TDG pressure for a tailwater elevation of 780 ft. The exponential form of Equation 7 will result in large increases in TDG exchange for incremental changes at lower specific discharges reaching an upper limit at higher specific spillway flows. This formulation can also illustrate the influence of spill in a limited number of bays. A total spillway discharge of 50 kcfs uniformly distributed over 19 spill bays will result in a TDG pressure of mm Hg (112.7%) at a tailwater elevation of 780 ft and barometric pressure of 745 mm Hg. The same 50 kcfs spilled uniformly over 10 bays will result in a TDG pressure of mm Hg ( 115.3%) for an increase in TDG saturation of 2.5% over the uniform 19 bay spill pattern. An alternative formulation for the delta pressure uptake in spillway releases involving a power function of the two independent variables was also
85 ERDC/ CHL HF-HG 83 generated using a non-linear regression procedure as shown in Equation 8. This form of equation has been used successfully to describe at TDG exchange at Ice Harbor Dam. This equation has no upper threshold for the pressure uptake and is more sensitive to changes in the specific discharge than the exponential equation listed in Equation 8. P ( TWE 743) 1.16 ( q s ) ( mm Hg) r 2 = 0.79 Std Error = 9.3 mm Hg (8) Where Qsp qs (kcfs/ft) N eff N eff = Effective number of active spill bays 1-19 (Equation 2). Q sp = Total spill discharge (kcfs) TWE = Tailwater surface elevation (ft) TDG sat = (P atm +ΔP)/P atm x 100 Total Dissolved Gas Saturation (%) P atm = Local Atmospheric Pressure ( mm Hg) = 16.0 Spill pattern weighting coefficient c w The non-linear regression determined a large value of the weighting coefficient C w causing the specific discharge to approach the discharge of the highest spill bay. The observed and calculated delta pressure using Equation 8 are shown in Figure 78 as a function of the specific spillway discharge. The standard error for Equation 8 was 9.3 mm Hg with the largest predictive errors associated with the bulk spill of 58 and 98 kcfs. The responsiveness of the power function TDG exchange model listed in Equation 8to changes in the independent variables can be helpful in identifying key model inputs. The sensitivity of TDG exchange as determined from Equation 8 for a change in the tailwater stage from 780 to 781 ft will result in an increase in TDG pressure of 3.1 mm Hg during a specific spillway discharge of 6 kcfs/bay. Alternatively, an increase in the specific spillway discharge from 5 to 6 kcfs/bay will result in a 5.5 mm Hg increase in TDG pressure for a tailwater elevation of 780 ft. The power function form of Equation 8 will result in large increases in TDG exchange for incremental changes in specific discharges throughout the range of spillway discharges explored in this study. This formulation can also illustrate the influence of spill in a limited number of bays. A total spillway discharge of
86 ERDC/ CHL HF-HG kcfs uniformly distributed over 19 spill bays will result in a TDG pressure of mm Hg (110.6%) at a tailwater elevation of 780 ft and barometric pressure of 745 mm Hg. The same 50 kcfs spilled uniformly over 10 bays will result in a TDG pressure of mm Hg ( 112.9%) for an increase in TDG saturation of 2.3% over the uniform 19 bay spill pattern. Caution should be used in applying the TDG exchange equations outside of the range of conditions from which it was developed (Table 10). The limited number of observations used to develop this empirically based TDG exchange equation will result in a degree of uncertainty when applied to conditions outside of these test conditions. A multitude of non-uniform spill patterns can be formulated based on equipment failure to dam safety concerns, which depart from conditions evaluated in this investigation. The TDG exchange was found to be highly sensitive to the type of spill pattern employed. Therefore, the TDG exchange equation should be revisited and updated when appropriate, based on routinely scheduled spillway releases that occur each year. The average flow weighted TDG saturation below Chief Joseph Dam was determined for each spill event using a simple mass conservation statement as shown in Equation 2. The entrainment discharge was set equal to zero for each of these flow conditions. The TDG properties of powerhouse flows were assumed to retain forebay TDG characteristics. The TDG levels in spillway flows were estimated using Equation 8. These assumptions allow the estimation for the cross sectional average TDG pressure. The observed average TDG pressure on Transect T4 was determined by flow weighting the observations from the 8-9 operating stations on this river reach. The observed and calculated TDG pressures for spillway and average cross sectional conditions are shown in Figure 79. The observed (black line) and calculated (black symbol) average cross sectional TDG pressure remained close throughout the study period. The larger predictive errors are generally associated with bulk spill patterns. The calculated TDG content in spill also closely follows the observed TDG pressures on Transect T4 below the spillway. Wells Pool Model Simulation The fate of project releases from Chief Joseph Dam on TDG conditions in the Columbia River were simulated using the SYSTDG model from April
87 ERDC/ CHL HF-HG to May 3. The SYSTDG model estimates the TDG exchange at Chief Joseph Dam based on a set of empirical equations and routes these releases to Wells Dam using a hydrologic routing formulation with dispersion. Additional tributary flows, degassing at the air/water interface, and the influence of thermal exchange are also simulated by the model. The spillway TDG exchange model listed in Equation 7 was used in this SYSTDG model simulation. The spill patterns used during the test spills of 2009 involved both uniform and non-uniform conditions. The observed tributary flows from the Methow and Okanogan Rivers were incorporated into this simulation assuming a TDG content of 102% of saturation. The calculated TDG content in spillway flows and cross sectional average TDG pressures at the tailwater Transect T4 closely approximated observed conditions throughout the study period. The observed cross sectional average TDG pressures were based on a flow weighted average of observations at stations T4P1-P8, CHQW-Dup using the weighting coefficients in Table 8. The time history of observed and calculated TDG conditions below Chief Joseph Dam are shown in Figure 80 for this simulation. The calculated TDG content in spillway flows labeled (TDGsp-Calculated) generally predicted the observed conditions. The calculated spillway TDG pressures over estimated conditions during the 38U and 38b conditions. It should be noted that the TDG pressures at the tailwater FMS were not available during these events and were likely higher pressures than observed at stations T4P8. The TDG estimates also underestimated conditions during the 58U and 58B events on May 1 by 10 to 15 mm Hg. The calculated cross sectional average TDG pressure closely approximated the observed average conditions throughout the spill study. The observed cross sectional TDG pressures at Transect T4 are labeled as t4-avg in Figure 80 and the SYSTDG calculated average conditions are labeled T4-avgcal. The small differences in the cross sectional average TDG pressures are in part caused by using the observed TDG content in the forebay of Chief Joseph Dam to represent the content in spillway flows in the SYSTDG simulations. The cross sectional average TDG pressures were the largest during the 142U and 144B spill events where over 63 percent of the river was spilled and the TDG content in spillway flow was near 900 mm Hg. The hourly project releases were routed through the Wells pool subject to reareation, dispersion, and dilution with tributary flows from the Methow and Okanagon Rivers. The calculated and observed TDG pressures in
88 ERDC/ CHL HF-HG 86 Wells Dam forebay from April 28-May 3 are shown in Figure 81. The estimated Wells forebay TDG pressures closely reproduced both the shape and magnitude of these observed TDG events arriving at Wells Dam. The retention of elevated TDG pressures well after the completion of the spill test was also captured in the model simulations. The high spill conditions during Event 3 on April 28 with an average cross sectional TDG saturation of percent ( mm Hg) on transect T4 arrived at Wells Dam about one day later with a peak TDG saturation of 108 percent. In a similar manner, the highest spill events on April 30 of 144B and 142U experienced cross sectional average TDG saturations of and percent on Transect T4. These events upon arrival at Wells Dam forebay retained a TDG saturation of 111 and 112 percent, respectively. The reduction in the peak cross sectional average TDG saturations ranged from 2 to 4 percent during this test condition. Because of the short duration of these test events, this reduction in peak TDG pressures should not be construed as solely a degassing rate. The generally good agreement between observed and calculated TDG pressures both in the tailwater of Chief Joseph Dam and forebay of Wells Dam supports the use of this SYSTDG model for spill management and TDG loading analyses.
89 ERDC/ CHL HF-HG 87 8 Conclusions The Seattle District, US Army Corps of Engineers has been active in developing a water quality management plan to meet applicable water quality standards in the State of Washington for Total Dissolved Gas (TDG) supersaturation in the Columbia River at Chief Joseph Dam. Total dissolved gas supersaturation is generated in the Columbia River during spillway flows at Chief Joseph Dam and has been found to range as high as 145 percent of saturation. The Seattle District Corps of Engineers have studied the TDG abatement alternatives at Chief Joseph Dam and identified spillway flow deflectors as the preferred structural alternative to reduce TDG levels during spill. A Type II spillway flow deflector at elevation 776 ft was identified in scaled sectional and general models of Chief Joseph Dam as the best design to limit TDG exchange during forced spills up to 175 kcfs. The construction of spillway flow deflectors across the entire spillway was completed during the winter of 2009 and the TDG exchange properties were evaluated during scheduled spillway operations on April 28-May 1, The prominent findings from this study are as follows: The addition of spillway flow deflector at Chief Joseph Dam has significantly reduced the exchange of TDG pressure during spillway operations when compared to the original spillway design. The reduction in total dissolved gas saturation in spillway flows caused by the flow deflectors increases with discharge and reaches 15 percent saturation and higher for spillway flows over 38 kcfs. The magnitude of TDG pressures exchange in spillway releases were found to be a function of the spillway discharge, spill pattern, and tailwater elevation. The 12 spill events scheduled during this study resulted in TDG saturations in spillway flows ranging from 108 percent for a uniform spill of 18 kcfs to 120 percent during a non-uniform spill of 98 kcfs. The highest spill event of 144 kcfs resulted in a TDG saturation of 119 percent saturation in the river near the tailwater fixed monitoring station. The TDG pressures measured just downstream of the stilling basin experienced the highest levels observed during this study of 125 percent satura-
90 ERDC/ CHL HF-HG 88 tion during a uniform spill of 142 kcfs. The TDG exchange study of the original spillway in 1999 measured peak TDG pressures in this area of 174 percent during a spill of just 48.4 kcfs over 9 spill bays. These peak TDG pressures were observed within the zone of highly aerated flow and were not representative of the resultant conditions downstream of the aerated flow conditions. The non-uniform spill pattern was found to consistently produce higher TDG pressures in spillway flows when compared to a similar spill discharge using a uniform spill pattern. The bulk spill patterns generated TDG pressures that were 20 to 40 mm Hg higher than observed during a uniform spill at the same spill discharge. A uniform spill pattern is recommended for future operations of the Chief Joseph spillway to minimize TDG exchange. In cases where two levels of spill gate openings are required to meet total spill discharge requirements, the location of the higher gate openings should be distributed across the spillway. The presence of higher tailwater elevations resulted in higher TDG pressures in spillway flows for the three paired spill events during this study. The influence of tailwater elevation on TDG exchange was of smaller significance than the impacts of the spill pattern with higher tailwater levels producing from 4 to 30 mm Hg compared to the paired lower tailwater spill event. Higher TDG pressures result from higher tailwater elevations because of the additional stilling basin depth of flow and the trajectory of the spill jets throughout this region. A much wider range of spillway operations at Chief Joseph Dam can now be considered with spillway flow deflectors in place subject to Washington water quality standards for TDG saturation. The spillway capacity as limited by the 120 percent saturation observed at the tailwater fixed monitoring station was not clearly delineated during this study. The nonuniform spill patterns of 98 and 142 kcfs spill and the uniform spill of 144 kcfs all resulted in peak TDG levels reaching the 120 percent saturation level on the transect adjacent to the fixed monitoring station but not at the fixed monitoring station. The uniform spill events of 100 kcfs resulted in TDG levels at the tailwater fixed monitoring station well below the 120 percent saturation level. In contrast, during the testing of the original spillway, the spillway capacity estimated to result in a tailwater TDG saturation of 120 percent was only 32 kcfs. Therefore the spillway flow deflec-
91 ERDC/ CHL HF-HG 89 tor have resulted in a 3 to 4 fold increase in the spillway capacity as limited by the tailwater TDG criteria of 120 percent saturation. The TDG saturation in spillway flows was found to be directly related to spill magnitude for spillway discharges. The rate of increase in TDG saturation was observed to decrease for higher spillway discharges and tends towards an upper threshold level near 120 percent saturation for the flow conditions monitored during this test. The presence of a higher than normal atmospheric pressures and lower than normal tailwater elevations at Chief Joseph Dam contributed to lower TDG saturations observed during this study. The return of more normal atmospheric pressures to 740 mm Hg will result in higher TDG saturations observed below Chief Joseph Dam during comparable spillway operations. The spillway discharge resulting in a TDG saturation of 110 percent was found to occur for spillway flows between 18 and 36 kcfs (1 and 2 feet of gate opening). The spill capacity will also vary with the local atmospheric pressure and development of the mixing zone during high river flows. The TDG pressures observed in the Columbia River at the tailwater fixed monitoring station reflect the development of a mixing zone between powerhouse and spillway releases. During low percent river spill operations the mixing zone can encroach upon the tailwater fixed monitoring station resulting in both powerhouse and spillway flows influencing the observed TDG conditions. The TDG content in spillway releases will be reflected in observed conditions at the tailwater monitoring station for higher spill discharge operations. The lateral distribution of TDG pressures in the core spillway flows unaltered by powerhouse releases became non-uniform for spill discharges of 100 kcfs and higher. These spillway flow conditions resulted in the peak TDG pressures being located away from the right channel bank and the tailwater fixed monitoring station location. The peak cross sectional TDG pressures ranged from 6 to 13 mm Hg higher than the observed TDG pressures near the right channel bank.
92 ERDC/ CHL HF-HG 90 The TDG observations at the tailwater fixed monitoring station CHQW in a conduit housing on the right bank 1.3 miles downstream of the spillway were significantly less than observed at a duplicate station located on the channel bottom in free flow near the conduit. The TDG records at the CHQW station were not used to characterize the TDG exchange in spillway operations during this study. The slow and attenuated TDG response at this sampling station (CHQW) was consistent with restricted exchange of water between the river and the instrument deployment conduit. The spatial distribution of TDG pressures throughout the tailwater of Chief Joseph Dam were shaped by the aerated spillway releases and interaction of powerhouse releases. The highest TDG pressures observed during the spring spill test were observed within the bubbly flow zone for spill discharges of 142 kcfs. The highest TDG pressures downstream of the bubbly flow zone were located at or near the right channel bank (downstream orientation). The peak TDG pressures in the Columbia River at the location of the fixed monitoring station were observed in deeper waters away from the FMS for higher spill discharges. The peak TDG levels in the Columbia River continuously declined as a function of distance from the dam as a consequence of mixing zone development, dispersion of the TDG front, mixing with tributary inflows, and off-gassing to the atmosphere. The peak TDG levels observed at sampling stations in Wells pool on Transect T5 and at Wells Dam were considerably less than observed in the tailwater of Chief Joseph Dam due to the development of the mixing zone, dispersion of TDG events, and mixing with tributary flows. The maximum TDG saturation observed at Well Dam was 112 percent compared to the peak level of 120 percent in the tailwater of Chief Joseph Dam. The time of travel of TDG events through Wells Pool was about one day. The entrainment of powerhouse flows into highly aerated flow conditions below the spillway were small during most of the spillway operations scheduled during this study period. Non-uniform spill patterns can generate strong upstream transport of powerhouse flows into the stilling basin resulting in the incorporation of these waters in the highly aerated flow conditions. The entrainment of powerhouse flows into the stilling basin during spillway releases will increase the TDG loading of the Columbia River during lower background TDG levels and should be avoided. However, during conditions of elevated forebay TDG pressures emanating from upstream sources, the entrainment of powerhouse flow into aerated spill-
93 ERDC/ CHL HF-HG 91 way flows can result in a net reduction in the TDG loading of the Columbia River when the TDG exchange below the spillway results in TDG pressures less than background levels. The interaction of powerhouse releases with aerated spillway flows will influence the TDG loading of the Columbia River and development of the mixing zone downstream of the dam. The mixing zone extends through the tailwater fixed monitoring station and influences the spatial distribution of TDG pressure in this reach of the river. The TDG content in powerhouse releases were similar to forebay levels for most operating conditions. There was evidence during low turbine discharges less than 5000 kcfs/unit, of small increases of 1 to 2 percent saturation above background levels associated with powerhouse releases. An empirical model of TDG exchange at Chief Joseph Dam was developed from the twelve spill events scheduled during this study. The delta TDG pressure was found to be an exponential function of the unit spillway discharge and stilling basin depth of flow as shown in Equation 7. This formulation provides for an upper TDG threshold as a function of the tailwater elevation. The non-uniform spill patterns were incorporated into this model through the use of a flow-weighted specific spillway discharge formulation. This TDG exchange formulation provided reasonable estimates of both the TDG content in spillway flows and cross sectional average TDG pressures. This model should be updated in the future to incorporate a wider range of operating conditions than experienced in this study. The TDG model SYSTDG was updated with the TDG exchange model at Chief Joseph Dam and used to simulate the transport, mixing, and dissipation of TDG pressures in the Columbia River from Chief Joseph to Wells Dam. This model accurately simulated the transport of these 12 distinct spill events through this 29.5 mile river reach to Wells Dam with a predictive standard error of 4.2 mm Hg. The average travel time through this reach was estimated to be about 1 day during the four days of testing. The updated description of TDG exchange at Chief Joseph Dam can be used to update the joint operating policy for spill management between Chief Joseph and Grand Coulee Dams as prescribed in the TDG abatement program. This policy should consider both regulating outlet and spillway operations at Grand Coulee Dam during a range of background TDG pressures and total river flows.
94 ERDC/ CHL HF-HG 92 The Columbia River stage at Chief Joseph Dam was found to be a function of total river flow and the downstream water stage maintained at Wells Dam. The influence of downstream stage at Wells Dam on the tailwater stage at Chief Joseph Dam diminishes as the total river discharge increases. Large changes in the tailwater elevation, as much as 12 feet over a 20 minute interval, were observed during operational changes at Chief Joseph Dam. Transient short duration fluctuations or surging of the tailwater stage at Chief Joseph Dam were not observed during sustained spillway and powerhouse operations. Long period gravity waves were generated and propagated through the Wells pool reach of the Columbia River during abrupt changes to the total river flow. On average, about 45 percent of the total stage differential in the Columbia River from Wells Dam to Chief Joseph Dam were located in the 1.7 mile reach below Chief Joseph Dam during test conditions. The tailwater elevations during the spill testing at Chief Joseph Dam were lower than normal conditions due to the lowering of the Wells pool water surface elevation during the nighttime. The water temperatures in the Columbia River were weakly related to the TDG pressures observed in the tailwater of Chief Joseph Dam. The water temperatures in the Columbia River experienced a 1 degree Celsius increase during the transit to Wells Dam during this study period that can induce a measurable impact on the observed TDG pressures. A weak lateral variation in water temperatures was observed where spillway releases were warmer than powerhouse flows during the daylight hours. This lateral gradient will likely become more prominent during the summertime period. The dissolved oxygen concentrations were found to be highly correlated with TDG pressures at sampling stations located in the tailwater channel below Chief Joseph Dam during the spill test events. The dissolved oxygen measurements during mobile sampling provided detailed estimates of the lateral distribution of dissolved oxygen and properties of the mixing zone at the tailwater fixed monitoring station. The integration of dissolved oxygen and the velocity fields provided accurate estimates of the dissolved oxygen loading of the Columbia River and allowed the estimation of the degree of powerhouse entrainment into aerated flow conditions generated by spillway releases. The flow field generated by spillway releases onto the flow deflectors has altered the hydrodynamic conditions in the stilling basin and adjoining
95 ERDC/ CHL HF-HG 93 tailwater channel. The spillway deflectors generate a high energy surface oriented jet that both entrains air and transports the bubble plume downstream of the stilling basin for moderate to high spill rates. This surface jet does not dissipate energy as effectively as the original spillway design and can deliver higher velocities into the adjoining tailwater channel. The presence of a well defined surface jet also generates an upstream return current near the channel bed that can entrain and transport debris and sediment into the stilling basin. This material can contribute to the scour and erosion of the stilling basin and adjoining end sill. The collision or intersection of two adjoining spillway jets in the wake of the spillway piers causes the formation of a vertical jet of water or rooster-tail that becomes more prominent at higher discharges. The dispersion of this vertical component of spillway discharge can contribute to a shower of water onto the adjoining river bank areas which can flood local drains or scour loose material over time. The flow field at Foster Creek contains the highest sustained velocities outside of the stilling basin because of the constriction in the channel and cross channel orientation of approaching powerhouse releases. An eddy located against the right channel bank can develop just downstream of the Foster Creek location in response to the cross channel momentum contained by powerhouse flows. The average channel velocities can exceed 9 feet per second for river flows of 200 kcfs and peak velocities can reach 14 feet per second. The shallow channel features in the right half of the channel upstream of the highway bridge limits the channel conveyance and adds to the steep gradient in the water surface slope in this area. The velocities in the tailwater channel below Foster Creek are influenced by channel friction and form. The velocities near the channel banks drop off quickly due to the increase in both friction and form losses. The irregularities of the channel bank can form small recirculating flow eddies such as occurs at the tailwater fixed monitoring station. The TDG pressures at the tailwater fixed monitoring transect generally reached steady conditions about 1 hour after the initiation of spill. The exception to this observation occurred during low spill conditions (18 kcfs spill) when a longer period of time was required (1.5 hours) for steady conditions to develop at this sampling transect. The average time of travel of elevated TDG plumes to the sampling station at Brewster, WA ranged
96 ERDC/ CHL HF-HG 94 from 8 to 10 hours during the spring testing events. The time of travel of distinct TDG fronts generated at CHJ Dam to Wells Dam was about 24 hours during the spring spill test. The simple TDG conservation statement associating the forebay TDG pressures with powerhouse releases and the tailwater fixed monitoring station TDG pressures with spillway releases provides an accurate estimate of average cross section TDG pressures in the Columbia River downstream of Chief Joseph Dam. The entrainment of the powerhouse releases into the highly aerated spillway flow was found small and assumed to be zero for all spill events.
97 ERDC/ CHL HF-HG 95 9 Recommendations The tailwater fixed monitoring instrument should be deployed outside of the tailwater fixed monitoring station conduit until the reliability of these measurements can be assured. The deposition of sediment in and around the conduit is likely causing the delayed and attenuated response at this station. One of the major findings from this spill study was the sensitivity of TDG exchange to the spill pattern where non-uniform spill patterns generated significantly higher TDG pressures than a comparable uniform spill pattern. A uniform spill pattern should be used during spillway operations at Chief Joseph Dam in order to minimize the TDG exchange during spillway operations when background TDG pressures are less than the TDG content in spillway releases. If gate opening of even increments are required, the spill bays with larger opening should be distributed across the spillway and not grouped together. For example, if a spillway discharge requires 9 bays at 1 ft opening and 9 bays at 2 ft opening, a spill pattern calling for even numbered bays of 1 ft and odd numbered bays at 2 ft should be scheduled. If fractional gate opens are feasible, a truly uniform spill pattern should be scheduled where all bays are assigned the same opening. A formal spill pattern table should be developed that outlines the spill bay opening for all 19 bays as a function of total spill discharge. The spill pattern table would provide for consistency in operation of the spillway and minimize operator discretion associated with gate changes. As noted in the discussion on spill management, there may be times when the background TDG pressures will exceed the TDG pressures generated in spillway flows at Chief Joseph Dam. The development of alternative spill patterns that promote the entrainment of powerhouse flows into the aerated spillway releases should be considered as a mechanism to further reduce the TDG loading in the Columbia River below Chief Joseph Dam.
98 ERDC/ CHL HF-HG References CEERDC 2003, Total Dissolved Gas Exchange at Lower Granite Dam, 2002 Spill Season, Memorandum for Record, June 16, 2003, US Army Engineer Research and Development Center, Vicksburg MS CENPD Total Dissolved Gas Annual Report, US Army Corps of Engineers, Northwestern Division, North Pacific Region. CENWD-NWS Chief Joseph Dam Columbia River, Washington CENWP-NWW Dissolved Gas Abatement Study Phase I, Technical Report, US Army Engineer Districts-Portland and Walla Walla, Portland, OR and Walla Walla, WA, respectively Colt, John Computation of dissolved gas concentrations in water as functions of temperature, salinity, and pressure, American Fisheries Society Special Publication No. 14. Davis, Glenn, Model Study of Chief Joseph Dam, Spillway Flow Deflector Performance, MFR dated 22 November, US Army Engineer Waterways Experiment Station, Vicksburg MS. GAS ABATEMENT STUDY General Reevaluation Report, US Army Engineer District-Seattle. MWH Gas Abatement Techniques at Rocky Reach Hydroelectric Project, Prepared for Chelan County Public Utility District No. 1. Orlins, J. J. and Gulliver, J. S Dissolved gas supersaturation downstream of a spillway. II: Computational model, Journal of Hydraulic Research, 38(2), Rindels, A. J., and Gulliver, J. S Measurements of Oxygen Transfer at Spillways and Overfalls, St. Anthony Falls Hydraulic Laboratory Project Report No. 226, University of Minnesota, Minneapolis, MN Schneider, M. L. and Carroll, J.C "TDG exchange during spillway releases at Chief Joseph Dam, near-field study, June 6-10, 1999," CE-ERDCCR-F, US Army Engineer Waterways Experiment Station, Vicksburg MS. Schneider, M. L. and Wilhelms, S.C "Near-Field Study of Total Dissolved Gas in the Dalles Spillway Tailwater, CEWES-CS-L Memorandum for Record, December 16, 1996, US Army Engineer Waterways Experiment Station, Vicksburg MS. Schneider, M. L. and Wilhelms, S.C "Documentation and Analysis of the Near- Field Ice Harbor Tailwater Study, June 27-28, 1996," CEWES-HS-L Memorandum
99 ERDC/ CHL HF-HG 97 for Record, January 27, 1997, US Army Engineer Waterways Experiment Station, Vicksburg MS. Schneider, M. L. and Wilhelms, S.C. 1998a. "Total dissolved gas exchange during spillway releases at Little Goose Dam, February 20-22, 1998," CEWES-HS-L Memorandum for Record, December 10, 1998, US Army Engineer Waterways Experiment Station, Vicksburg MS. Schneider, M. L., Chief Joseph Dam: Post-Deflector Field Investigation of Total Dissolved Gas Exchange During Spill over Bays 12 and 13, US Army Engineer Research and Development Center, Vicksburg MS. Washington Department of Ecology Total Maximum Daily Load for Total Dissolved Gas in the Mid-Columbia River and Lake Roosevelt Submittal Report, Olympia WA.
100 ERDC/ CHL HF-HG Figures


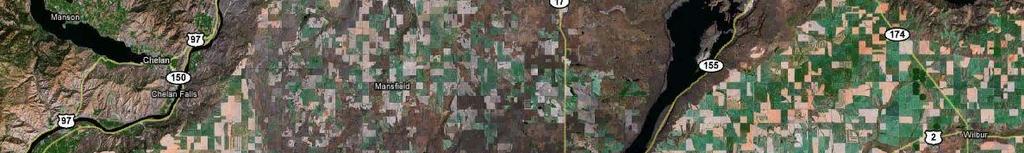
101 Seattle Wa. Chief Joseph Dam Portland Or. Chief Joseph Dam Grand Coulee Dam Wells Dam Figure 1. Columbia River and Chief Joseph Dam Site Map 99
102 Rufus Woods Lake Bay 1 Spillway Bays 12,13 Bay 19 Chief Joseph Dam turbine 1 Powerhouse turbine 27 Columbia River Foster Creek Figure 2. Aerial Photograph of Chief Joseph Dam, Rufus Woods Lake, and the Columbia River. 100
103 Figure 3. Spillway and Stilling Basin Profile Section with Type II Flow Deflectors for Chief Joseph Dam. 101
104 Spillway Chief Joseph Dam Columbia River Powerhouse Figure 4. Tailwater Channel Bed Elevations below Chief Joseph Dam. (5-foot elevation contours, ft) 102


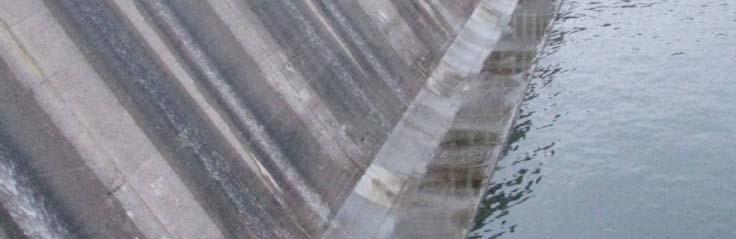
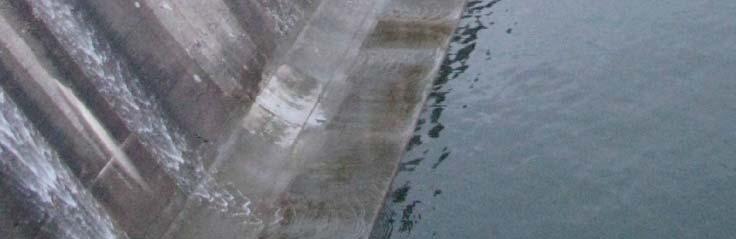
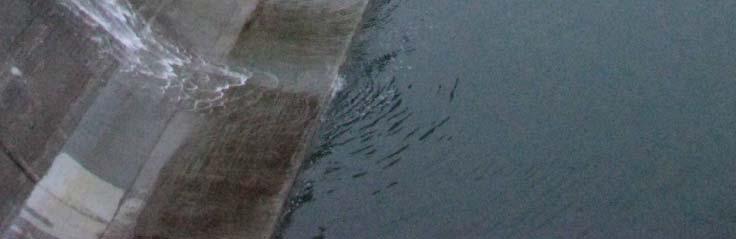
105 Figure 5. Chief Joseph Dam Spillway Flow Deflectors during low tailwater elevations, April
106 Figure 6. Spillway Flow Passing Under a Tainter Gate at Chief Joseph Dam. 104


107 A. Spill jet transition during 3 kcfs/bay B. Spill jet transition during 7 kcfs/bay Figure 7. Change in the Trajectory of Spill by the Spillway Flow Deflector at Chief Joseph Dam. 105
108 Figure 8. Highly Aerated Flow on the Spillway and Stilling Basin at Chief Joseph Dam. 106
109 Uniform Pattern Spill Events Deflector Performance 12.5 ft Deflector at Elevation 776 F E Subm ergence, ft G F High Tailwater 10% Exceedance 90% Exceedance D C B A Low Tailwater ater A Plunging Jet B Unstable Plunging Jet C Skimming Surface Jet D Undular Surface Jet E Ramped Surface Jet F Surface Jump G Submerged Surface Jump Discharge per Bay, cfs Figure 9. Deflector Performance Curve and submergence of deflectors during uniform events with low powerhouse and high powerhouse flows (Davis, 2004) 107
110 Figure 10. Aerated Spillway Flow in the Columbia River below Chief Joseph Dam for a uniform spill of 142 kcfs. 108


111 A. Aerated Spillway Flow during 18 kcfs Uniform pattern B. Aerated Spillway Flow during 58 kcfs uniform pattern.. C. Aerated Spillway Flow during 98 kcfs uniform pattern. D. Aerated Spillway Flow during 142 kcfs uniform pattern. Figure 11. Aerated Spillway Flow in the Columbia River below Chief Joseph Dam for uniform spill of 18, 58, 98, and 142 kcfs. 109


112 Brewster, WA Columbia River CHQW Chief Joseph Dam Wells Dam Figure 12 Total Dissolved Gas monitoring stations in the Columbia River at Chief Joseph Dam (Transects T0, T1, T2, T4, T5, Wells Dam) 110
113 CHQW CHQW-Dup Transect T3 Columbia River Powerhouse Chief Joseph Dam Figure 13 Total Dissolved Gas monitoring stations in the Columbia River at Chief Joseph Dam (Transects T0, T1, T2, T4 Mobile Sampling on Transect with yellow line) 111


114 Columbia River Figure 14 Total Dissolved Gas monitoring stations in the Columbia River at Chief Joseph Dam (Transects T0, T1, T2 Mobile sampling on yellow line) 112


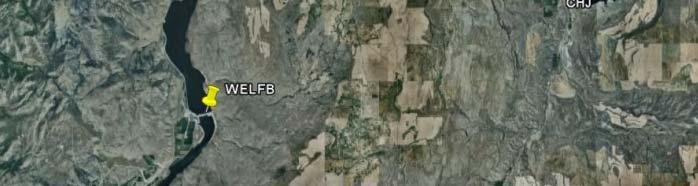
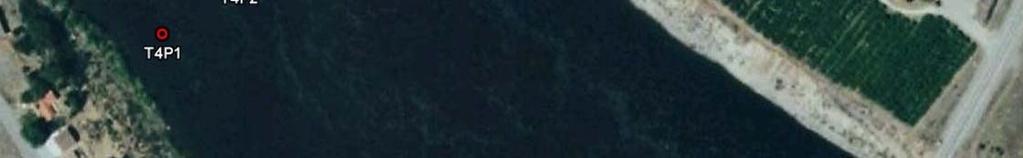


115 CHQW CHQW-Dup Columbia River Figure 15 Total Dissolved Gas monitoring stations in the Columbia River at Chief Joseph Dam (Transects T4) 113


116 Columbia River Figure 16 Total Dissolved Gas monitoring stations in the Columbia River at Chief Joseph Dam (Transects T5) 114


117 Columbia River WEL WELFB WELL Dam Figure 17 Total Dissolved Gas monitoring stations in the Columbia River at Wells Dam 115
118 April 28 April 29 April 30 May 1 e (cfs) Discharge Discharge (cfs) Discharge (cfs) e (cfs) Event 1, 18u* 8000 Event 2, 58u* 8000 Event 3, 100u* Spillbay Spillbay Spillbay (cfs) Discharge Event 4, 38u 8000 Event 5, 38b 8000 Event 6, 98b Spillbay Spillbay Spillbay Event 8, 18u Event 7, 144b Event 9, 142u Spillbay Spillbay Spillbay Event 10, 58u Event 11, 58b Event 12, 99u Spillbay Spillbay Spillbay Discharge Discharge (cfs) Discharge (cfs) e (cfs) Discharge (cfs) Discharge Discharge (cfs) Discharge (cfs) cfs) Discharge (c Figure 18. Spill patterns for events 1-12 during the TDG exchange study April 28-May 1, 2009 (Label= total spill discharge kcfs, uniform or bulk pattern, * low tailwater elevation) 116


119 Velocity Sample Location Right Bank Reference Transect T Columbia River Transect T3 Transect T2.5 FH Transect T2 Transect T Chief Joseph Dam Figure 19. Mobile Acoustic Doppler Current Profile sampling transects during April 28-May 1,


120 Figure 20. Depth Averaged Velocity on Transects T2 and T4 for Spill Event 6 Bulk Spill of 100 kcfs, Total River Flow 204 kfs (Trials 47, 51) 118


121 Figure 21. Depth Averaged Velocity on Transects T3 and T4 for Spill Event 12 Uniform Spill of 99 kcfs, Total River Flow 185 kfs (Trials 102 and 105) 119


122 Figure 22. Depth Average Velocity near proposed Hatchery Entrance for Spill Event 8, Uniform spill 18 kcfs, Total River Flow 159 kcfs (Trial 68) 120
123 Transect T4 Transect T2 Linear (Transect T4) Linear (Transect T2) 9 tional Velocity (fp ps) Ave erage Cross Sect Total River Flow (kcfs) Figure 23. Average Cross Sectional Velocities on Transects T2 and T4 as a function of total river flow. 121
124 evation (ft) Forebay El u* 57u* 100 0u* 38u 38b 98 8b 14 44b 18u 142u 58u 58b 97 7u Flow (kcfs) /27 4/28 4/29 4/30 5/1 5/2 5/ PP_02 PP_03 U9 CHJFB Qtotal-CHJ Qspill-CHJ Qtotal-GCL Figure 24. Columbia River Stage in the forebay of Chief Joseph Dam, April 27-May 2,
125 b 142u Flow (kcfs) evation (ft) Forebay El u /30/09 0:00 4/30/09 6:00 4/30/09 12:00 4/30/09 18:00 5/1/09 0: PP_02 PP_03 U9 CHJFB Qtotal-CHJ Qspill-CHJ Qtotal-GCL Figure 25. Columbia River Stage in the forebay of Chief Joseph Dam, April 30,
126 Flow (kcfs) (ft) Water Su urface Elevation ( u* 57 7u* 100u* 38 8u 38 8b 98b 144b 18u 142u 58u 58b 97u /27/09 0:00 4/28/09 0:00 4/29/09 0:00 4/30/09 0:00 5/1/09 0:00 5/2/09 0:00 5/3/09 0: Transect T5 U13 Transect T2 Transect T3 Wells FB Transect T1 Qchj Qsp-chj Qwells Figure 26. Columbia River flow and water surface elevations from Wells to Chief Joseph Dam, April 27-May 2, (note: U13 = Turbine unit 13 powerhouse tailwater) 124
127 Flow (kcfs) b 142u 100 (ft) Water Su urface Elevation ( u U13 T5 Wel U13 T5 Wel U13 T5 Wel U13 T5 Wel /30/09 0:00 4/30/09 6:00 4/30/09 12:00 4/30/09 18:00 5/1/09 0: Transect T5 U13 Transect T2 Transect T3 Wells FB Transect T1 Qchj Qsp-chj Qwells Figure 27. Columbia River flow and water surface elevations from Wells to Chief Joseph Dam, April 30, (note: U13 = Turbine unit 13 powerhouse tailwater, Arrows indicate wave propagation U13 tot5 to Wells) 125
128 Water Surfa ace Elevation (ft) Wells Dam Event 1, Qt=77.1 kcfs Event 2, Qt=117.5 kcfs Event 3, Qt=159.3 kcfs Event 4, Qt=187.1 kcfs Event 10, Qt=202 kcfs Event 7, Qt=227.4 kcfs Transect T5 Transect T4 Chief Joseph Dam Transect T River Mile Figure 28. Columbia River water surface elevation from Wells to Chief Joseph Dam, Spill Events 1-4, 7, 10. (note: Qt=Total river flow at Chief Joseph Dam) 126
129 Tailwater Elevation (ft) CHJ-TWE CHJ-TWE /27-5/ Columbia River Flow at CHJ (kcfs) Figure 29. Chief Joseph Dam tailwater elevation as a function of project discharge, blue symbols and during spill testing 4/27-5/2, 2009-pink symbols (note: steady flow duration of 3 hours and longer) 127
130 Uniform Pattern Spill Events Deflector Performance 12.5 ft Deflector at Elevation 776 F E Subm ergence, ft G F High Tailwater 9 Low Tailwater ater 10% Exceedance 90% Exceedance D C B A A Plunging Jet B Unstable Plunging Jet C Skimming Surface Jet D Undular Surface Jet E Ramped Surface Jet F Surface Jump G Submerged Surface Jump Discharge per Bay, cfs Figure 30. Deflector Performance Curve and submergence of deflectors during Uniform Events with low powerhouse and high powerhouse flows (note: event number listed near uniform spill condition) 128
131 Water Temperature (C C) * 18u* 57u* 100 0u* 38u 38b 98 8b 1 44b 18u 142u Grabl Sample Okanogan River 58u 58b 97u Flow (kcfs) 8 Grab Sample Methow River /27/09 0:00 4/28/09 0:00 4/29/09 0:00 4/30/09 0:00 5/1/09 0:00 5/2/09 0:00 CHQW T4P1 T4P7 T4P8 CHJ WEL T5P2 Tmp-Okanogan Q-Methow Qspill Qtotal Q-Methow+Okanogan Figure 31. Chief Joseph Operations, Tributary Flows, and associated water temperatures at selected sampling stations, April 27-May 1,
132 b 142u 100 Water Temperature (C C) u Flow (kcfs) /30/09 0:00 4/30/09 6:00 4/30/09 12:00 4/30/09 18:00 5/1/09 0:00 CHQW T4P1 T4P7 T4P8 CHJ WEL T1P3 Tmp-Okanogan Q-Methow Qspill Qtotal Q-Methow+Okanogan Figure 32. Chief Joseph Operations, Tributary Flows and associated water temperatures at selected sampling stations, April 30,
133 Water Te emperature (C) u* 57u* 100u* 38u 38b 98b 144 4b 18u 14 42u 58u 58b 97u Flo ow (kcfs) /27/09 0:00 4/28/09 0:00 4/29/09 0:00 4/30/09 0:00 5/1/09 0:00 5/2/09 0:00 T5P3 T5P2 WEL T5P1 Tmp-Okanogan Q-Methow T4P4 Qspill Qtotal Q-Methow+Okanogan Figure 33. Chief Joseph Operations, Tributary Flows, and associated water temperatures at selected sampling stations featuring Transect T5, April 27-May 1,
134 Spillway Flow Mixing Zone Powerhouse flow DO (m mg/l) Temp (C) Docon tmp Distance From Right Bank Figure 34. Lateral Distribution of Water Temperature and Dissolved Oxygen in the Columbia River on Transect T4, Sample 56 (Right Bank based on downstream orientation) 132
135 (kcfs) Flow Gas Pressure (m mmhg) u* 57u* 100u* 38u 38b 98b 144b 18u 142u 58u 58b 97u Total Dissolved /28/09 4/29/09 4/30/09 5/1/09 5/2/09 CHJ CHJDTD CHJFB AP@CHJW Qspill Qtotal Figure 35 Time history of project operations and Total Dissolved Gas Pressures in the Columbia River at Transect T0 and selected monitoring stations, April 28-May 1, 2009 (note: AP@CHJW=Atmospheric Pressure at tailwater fixed monitoring station) 133
136 (kcfs) Flow Total Dissolv ved Gas Saturatio on (%) u* 57u* 100u* 38u 38b 98b 144b 18u 142u 58u 58b 97u /28/09 4/29/09 4/30/09 5/1/09 5/2/ CHJ CHJDTD CHJFB Qspill Qtotal Figure 36. Time history of project operations and Total Dissolved Gas Saturation in the Columbia River at Transect T0 and selected monitoring stations, April 28-May 1,
137 Figure 37. Columbia River at Chief Joseph Dam Qgen=80 kcfs, Qspill=98 kcfs uniform Spillway Closure May :51:45 pm 135
138 Figure 38. Columbia River at Chief Joseph Dam Qgen=80 kcfs, Qspill=67 kcfs uniform Spillway Closure May :03:05 pm (Not: initial spill discharge was 98 kcfs prior to gate closure) 136
139 ) Flow (kcfs as Pressure (mm mhg) u* 57u* 100u* 38u 38b 98b 144b 18u 142u 58u 58b 97u To otal Dissolved G /28/2009 4/29/2009 4/30/2009 5/1/2009 5/2/2009 CHJDTD T1P1 T1P2 T1P3 Qtotal Qspill Figure 39 Time history of project operations and Total Dissolved Gas Pressures in the Columbia River on Transect T1 and selected monitoring stations, April 28-May 1, 2009 (note: spill event label discharge+spill pattern uniform or bulk with * indicating low tailwater conditions). 137
140 cfs) Flow (k Total Disso olved Gas Satura ation (%) u* 57u* 100u* 38u 38b 98b 144b 18u 142u 58u 58b 97u /28/2009 4/29/2009 4/30/2009 5/1/2009 5/2/2009 CHJDTD T1P1 T1P2 T1P3 Qtotal Qspill Figure 40 Time history of project operations and Total Dissolved Gas Saturation in the Columbia River on Transect T1 and selected monitoring stations, April 28-May 1, 2009 (note: spill event label discharge+spill pattern uniform or bulk with * indicating low tailwater conditions). 138
141 Flow (kc cfs) Gas Pressure (m mmhg) u* 57u* 100u* 38u 38b 98b 144b 18u 142u 58u 58b 97u Total Dissolved /28/09 4/29/09 4/30/09 5/1/09 5/2/09 T2P3 T2P2 T2P1 T2P4 CHJDTD Series7 Series8 Figure 41 Time history of project operations and Total Dissolved Gas Pressures in the Columbia River on Transect T2 and selected monitoring stations, April 28-May 1, 2009 (note: spill event label discharge+spill pattern uniform or bulk with * indicating low tailwater conditions). 139
142 Flow (kc cfs) Total Dissolv ved Gas Saturatio on (%) u* 57u* 100u* 38u 38b 98b 144b 18u 142u 58u 58b 97u /28/09 4/29/09 4/30/09 5/1/09 5/2/ T2P3 T2P2 T2P1 T2P4 CHJDTD Qtotal Qspill Figure 42 Time history of project operations and Total Dissolved Gas Saturationin the Columbia River on Transect T2 and selected monitoring stations, April 28-May 1, 2009 (note: spill event label discharge+spill pattern uniform or bulk with * indicating low tailwater conditions). 140
143 To otal Dissolved Ga as Pressure (mm mhg) 18u* 57u* 100u* 38u 38b nit) b 144b 18u 142u 58u 58b 97u Flow (kcfs/u /28/09 4/29/09 4/30/09 5/1/09 5/2/09 T2P3 T2P2 T2P1 T2P4 CHJ Qt-avg Qtmin qs-fw Figure 43. Time history of unit project operations and Total Dissolved Gas Pressures in the Columbia River on Transect T2 and selected monitoring stations, April 28-May 1, 2009 (note: spill event label discharge+spill pattern uniform or bulk with * indicating low tailwater conditions).. 141
144 (kcfs) Flow (mm Hg) Total Dissolved Gas Pressure ( u* 57u* 100u* 38u 38b 98b 144b 18u 142u 58u 58b 97u /28/09 4/29/09 4/30/09 5/1/09 5/2/09 CHJ CHQW-Dup CHJW-Dup CHQW T4P1 T4P2 T4P3 T4P4 T4P5 T4P6 T4P7 T4P8 Qtotal Qspill Figure 44. Time history of project operations and Total Dissolved Gas Pressures in the Columbia River on Transect T4 and selected monitoring stations, April 28-May 1, 2009 (note: spill event label discharge+spill pattern uniform or bulk with * indicating low tailwater conditions). 142
145 Flow (kcfs) tion (%) Total Disso olved Gas Saturat u* 57u* 100u* 38u 38b 98b 144b 18u 142u 58u 58b 97u /28/09 4/29/09 4/30/09 5/1/09 5/2/09 CHJ CHQW-Dup CHJW-Dup CHQW T4P1 T4P2 T4P3 T4P4 T4P5 T4P6 T4P7 T4P8 Qtotal Qspill Figure 45. Time history of project operations and Total Dissolved Gas Saturation in the Columbia River on Transect T4 and selected monitoring stations, April 28-May 1, 2009 (note: spill event label discharge+spill pattern uniform or bulk with * indicating low tailwater conditions). 143
146 (kcfs) Flow (mm Hg) Total Dissolved Gas Pressure ( u* 57u* 100u* /28/09 0:00 4/28/09 6:00 4/28/09 12:00 4/28/09 18:00 4/29/09 0:00 CHJ CHQW-Dup CHJW-Dup CHQW T4P1 T4P2 T4P3 T4P4 T4P5 T4P6 T4P7 T4P8 Qtotal Qspill Figure 46. Time history of project operations and Total Dissolved Gas Pressures in the Columbia River on Transect T4 and selected monitoring stations, April 28, 2009 (note: spill event label discharge+spill pattern uniform or bulk with * indicating low tailwater conditions). 144
147 (kcfs) Flow (mm Hg) Total Dissolved Gas Pressure ( u 38b 98b /29/09 0:00 4/29/09 6:00 4/29/09 12:00 4/29/09 18:00 4/30/09 0:00 CHJ CHQW-Dup CHJW-Dup CHQW T4P1 T4P2 T4P3 T4P4 T4P5 T4P6 T4P7 T4P8 Qtotal Qspill Figure 47. Time history of project operations and Total Dissolved Gas Pressures in the Columbia River on Transect T4 and selected monitoring stations, April 29, 2009 (note: spill event label discharge+spill pattern uniform or bulk with * indicating low tailwater conditions). 145
148 Flow (kc cfs) m Hg) Total Dissolved Gas Pressure (m b 18u 142u /30/09 0:00 4/30/09 6:00 4/30/09 12:00 4/30/09 18:00 5/1/09 0:00 CHJ CHQW-Dup CHJW-Dup CHQW T4P1 T4P2 T4P3 T4P4 T4P5 T4P6 T4P7 T4P8 Qtotal Qspill Figure 48. Time history of project operations and Total Dissolved Gas Pressures in the Columbia River on Transect T4 and selected monitoring stations, April 30, 2009 (note: spill event label discharge+spill pattern uniform or bulk with * indicating low tailwater conditions). 146
149 Flow (kc cfs) Total Dissolved Gas Pressure (mm m Hg) u 58b 97u /1/09 0:00 5/1/09 6:00 5/1/09 12:00 5/1/09 18:00 5/2/09 0:00 CHJ CHQW-Dup CHJW-Dup CHQW T4P1 T4P2 T4P3 T4P4 T4P5 T4P6 T4P7 T4P8 Qtotal Qspill Figure 49. Time history of project operations and Total Dissolved Gas Pressures in the Columbia River on Transect T4 and selected monitoring stations, May 1, 2009 (note: spill event label discharge+spill pattern uniform or bulk with * indicating low tailwater conditions). 147
150 Flow (kcfs) Hg) Tot tal Dissolved Ga s Pressure (mm u* 1 57u* 100u* 38u 38b 98b 144b 8u 1 142u 58u 58b 97u Methow River Okanogan River /28/09 4/29/09 4/30/09 5/1/09 5/2/09 T4P8 T5P1 T5P2 T5P3 T4avg Qtotal Qspill Figure 50. Time history of project operations and Total Dissolved Gas Pressures in the Columbia River on Transect T5 and selected monitoring stations, April 28-May 1, 2009 (note: spill event label discharge+spill pattern uniform or bulk with * indicating low tailwater conditions). 148
151 ) Flow (kcfs) Total Dissolv ved Gas Saturatio on (%) 18u* 57u* 100u* 38u 38b 98b 144b 18u 142u 58u 58b 97u /28/09 4/29/09 4/30/09 5/1/09 5/2/ T4P8 T5P1 T5P2 T5P3 T4avg Qtotal Qspill Figure 51. Time history of project operations and Total Dissolved Gas Saturation in the Columbia River on Transect T5 and selected monitoring stations, April 28-May 1, 2009 (note: spill event label discharge+spill pattern uniform or bulk with * indicating low tailwater conditions). 149
152 To otal Dissolved Ga as Pressure (mm m Hg) u* 1 57u* 100u* 38u 38b Event 100u* 98b T4 T5 Wells 144b 18u 142u Event 144b T4 T5 Wells 58u 58b 97u Flow (kcfs) Methow River Okanogan River Methow River Okanogan River /28/09 04/29/09 04/30/09 05/01/09 05/02/ /03/09 T4P8 T5P2 WELFB WEL T4avg CHJ Qspill Qtotal Figure 52. Time history of project operations and Total Dissolved Gas Pressures in the Columbia River at Wells Dam forebay and selected monitoring stations, April 28-May 2, (note: Tracking of Event 100u* and 144b TDG plumes at transects T4, T5, and Wells Forebay)
153 u 58u 58b 142u 144b 18u b 50 38u 38b 57u* 130 Flow (kcfs) u* u* Total Dissolv ved Gas Saturati on (%) Event 144b E Event t u** T4 T5 T4 Wells Wells T /28/09 04/29/09 T4P8 T5P2 04/30/09 WELFB WEL 05/01/09 T4avg CHJ 05/02/09 Qspill Qchjl 05/03/09 Qwel Figure 53. Time history of project operations and Total Dissolved Gas Saturations in the Columbia River at Wells Dam forebay and selected monitoring stations, April 28-May 2, (note: Tracking of Event 100u* and 144b TDG plumes at transects T4, T5, and Wells Forebay) 151
154 To otal Dissolved Ga as Pressure (mm m Hg) u* 57u* 100u* 38u 38b 98b 144b 18u 142u 58u 58b 97u Flow (kcfs) /28/09 04/29/09 04/30/09 05/01/09 05/02/09 05/03/09 05/04/09 05/05/09 T4P8 T5P2 WELFB WEL T4avg ag CHJ Qspill Qchjl Qwel Figure 54. Time history of project operations and Total Dissolved Gas Pressures in the Columbia River at Wells Dam forebay and selected monitoring stations, April 28-May 4, (note: Q wel =Total Discharge at Wells Dam, Q spill =Spillway Discharge at CHJ, Q chj =total discharge at CHJ) 152
155 ssolved Gas and Dissolved Oxyg gen Saturation (% %) u* 57u* 100u* 38u 38b 98b 144b 18u 142u 58u 58b 97u Flow (k kcfs) Total Di /28/09 4/29/09 4/30/09 5/1/09 5/2/09 LDO-sat TDGsat Qtotal Qspill Figure 55. Time history of project operations and Total Dissolved Gas and Dissolved Oxygen Saturation in the Columbia River at station T1P2, April 28-May 1, 2009 (note: spill event label discharge+spill pattern uniform or bulk with * indicating low tailwater conditions). 153
156 Total Diss solved Gas and Dissolved Oxyge n Saturation (%) u* 57u* 100u* 38u 38b 98b 144b 18u 142u 58u 58b 97u Flow (kcf fs) /28/09 4/29/09 4/30/09 5/1/09 5/2/09 LDO-sat TDGsat Qtotal Qspill Figure 56. Time history of project operations and Total Dissolved Gas and Dissolved Oxygen Saturation in the Columbia River at station T4P7, April 28-May 1, 2009 (note: spill event label discharge+spill pattern uniform or bulk with * indicating low tailwater conditions). 154
157 Total Diss solved Gas and Dissolved Oxyge n Saturation (%) b 18u 142u Flow (kcf fs) /30/09 0:00 4/30/09 6:00 4/30/09 12:00 4/30/09 18:00 5/1/09 0:00 LDO-sat TDGsat Qtotal Qspill Figure 57. Time history of project operations and Total Dissolved Gas and Dissolved Oxygen Saturation in the Columbia River at station T4P7, April 30, 2009 (note: spill event label discharge+spill pattern uniform or bulk with * indicating low tailwater conditions). 155
158 16 15 Dissolved Oxygen (mg/l) 14 y = x R 2 = DO-mg/l Linear (DO-mg/l) TDG Pressure (mm Hg) Figure 58. Total Dissolved Gas Pressure versus Dissolved Oxygen Concentration at Station T1P2 during spillway flows, April 28-May 1,
159 16 15 Dissolved Ox xygen (mg/l) 14 y = x R 2 = DO-mg/l Linear (DO-mg/l) TDG Pressure (mm Hg) Figure 59. Total Dissolved Gas Pressure versus Dissolved Oxygen Concentration at Station T4P7 during spillway flows, April 28-May 1,
160 Dissolved Oxyge en Concentration (m mg/l) Distance Normalized (0 Left, 1 Right) Figure 60. Lateral Dissolved Oxygen Distribution on Transect T4 during bulk spill of 58 kcfs, total river flow 203 kcfs, May 1,
161 d Gas Saturation (%) Total Dissolve with deflectors 1999 without deflectors Poly. (2009 with deflectors) Unit Spillway Discharge (kcfs/bay) Figure 61. Total Dissolved Gas Saturation in spillway flows as a function of the specific spillway discharge with and without spillway flow deflectors. 159
162 Total Diss solved Gas Saturation (%) with deflectors 1999 without deflectors Poly. (2009withdeflectors) Log. (1999 without deflectors) Unit Spillway Discharge (kcfs/bay) Figure 62. Total Dissolved Gas Saturation in spillway flows as a function of the specific spillway discharge with and without spillway flow deflectors at station T1P1 ( 1999 data without spillway flow deflectors, 2009 with spillway flow deflectors). 160
163 2009 Figure 63. Observed and Estimated Total Dissolved Gas Saturation as a function of total spill discharge at Chief Joseph Dam (Estimated TDG response from Dissolved Gas Abatement Study (NWS, 2000) green dashed line, Observed 2009 red symbols) 161
164 950.0 Bulk Spill Pattern TDG Pr ressure (mm Hg) Spillway Discharge (kcfs) T4P8 CHQW-Dup T2P3 T1P3 CHJ Figure 64. Station and Event averaged Total Dissolved Gas pressure in the Columbia River below Chief Joseph at selected sampling stations in spillway releases. 162
165 Total Dissolved Gas Pressure (m mm Hg) U* 18U 38U 38B 57U* 58U 58B 100U* 97U 98B 142U 144B Spill Event CHJDTD T1P1 T1P2 T1P3 Figure 65. Station and Event averaged Total Dissolved Gas pressure in the Columbia River below Chief Joseph For Transect T1 (Spill Event Label: spill discharge kcfs ###, Spill pattern uniform or bulk, * low tailwater event) 163
166 Total Dissolved Gas Pressure (m mm Hg) U* 18U 38U 38B 57U* 58U 58B 100U* 97U 98B 142U 144B Spill Event CHJDTD T1P1 T1P2 T1P3 Figure 66. Station and Event averaged Total Dissolved Gas Saturation in the Columbia River below Chief Joseph For Transect T1 (Spill Event Label: spill discharge kcfs ###, Spill pattern uniform or bulk, * low tailwater event) 164
167 Total Dissolved Gas Pressure (m mm Hg) U* 18U 38U 38B 57U* 58U 58B 100U* 97U 98B 142U 144B Spill Event CHJDTD T2P1 T2P2 T2P3 T2P4 Figure 67. Station and Event averaged Total Dissolved Gas pressure in the Columbia River below Chief Joseph For Transect T2 (Spill Event Label: spill discharge kcfs ###, Spill pattern uniform or bulk, * low tailwater event) 165
168 Total Dissolv ved Gas Saturatio on (%) U* 18U 38U 38B 57U* 58U 58B 100U* 97U 98B 142U 144B Spill Event CHJDTD T2P1 T2P2 T2P3 T2P4 Figure 68. Station and Event averaged Total Dissolved Gas Saturation in the Columbia River below Chief Joseph For Transect T2 (Spill Event Label: spill discharge kcfs ###, Spill pattern uniform or bulk, * low tailwater event) 166
169 Gas Pressure (m mm Hg) Total Dissolved U* 18U 38U 38B 57U* 58U 58B 100U* 97U 98B 142U 144B Spill Event T4P1 T4P2 T4P3 T4P4 T4P5 T4P6 T4P7 T4P8 CHJW-Dup Figure 69. Station and Event averaged Total Dissolved Gas pressure in the Columbia River below Chief Joseph For Transect T4 (Spill Event Label: spill discharge kcfs ###, Spill pattern uniform or bulk, * low tailwater event) 167
170 ion (%) lved Gas Saturati Total Dissol U* 18U 38U 38B 57U* 58U 58B 100U* 97U 98B 142U 144B Spill Event T4P1 T4P2 T4P3 T4P4 T4P5 T4P6 T4P7 T4P8 CHJW-Dup Figure 70. Station and Event averaged Total Dissolved Gas Saturation in the Columbia River below Chief Joseph For Transect T4 (Spill Event Label: spill discharge kcfs ###, Spill pattern uniform or bulk, * low tailwater event) 168
171 Powerhouse Mixing Zone Spillway D issolved Oxygen Co oncentration (mg/l) Flow (cfs) Distance Normalized (0 Left, 50 Right) Figure 71. Observed cumulative flow and dissolved oxygen concentration distribution on Transect T4 during spill event 2, uniform spill of 58 kcfs, powerhouse flow 60 kcfs (Multiple Trials 12-15) 169
172 CHQW Figure 72. Chief Joseph tailwater fixed monitoring station and communication platform for Total Dissolved Gas Saturation (CHQW) 170
173 120 1:00 hours 2:00 hours 2:45 CHQW (%) 115 TDG Saturation TDG CHQW-Dup (%) Figure 73. Total Dissolved Gas Saturation comparison for paired stations CHQW and CHQW-Dup located at the Chief Joseph tailwater fixed monitoring site at 1, 2, and 2:45 hrs into spill event. (CHQW in conduit, CHQW-Dup on channel bottom) 171
174 T1-sp T2-sp T4-sp (uniform) T4-sp (bulk) Poly. (T4-sp (uniform)) Gas Pressure (mm m Hg) Delta Total Dissolved u 38b 38u 58b 58u 58u* 98b 99u 100u* 144b 142u 50 18u* Spillway Discharge (kcfs) Figure 74. Observed Delta Total Dissolved Gas Pressure in Spillway Flows as a function of spillway discharge for uniform and bulk spill events on Transects T1, T2, and T4. 172
175 T1-sp T2-sp T4-sp p( (uniform) T4-sp (bulk) Log. (T4-sp (uniform)) Total Dissolve ed Gas Saturation (%) b 58b 58u 58u* 98b 99u 100u* 144b 142u u 38u 18u* Spillway Discharge (kcf s) Figure 75. Observed Total Dissolved Gas Saturation in Spillway Flows as a function of spillway discharge for uniform and bulk spill events on Transects T1, T2, and T4. 173
176 Flow (kcfs) Columbia River Forebay TDG Sa aturation (%) Columbia River Flow (kcfs) CHJ Forebay TDG Saturation (%) Percentile in June ( ) 100 Figure 76. Frequency summary of hourly Total River Flow and Forebay TDG saturation for the Columbia River at Chief Joseph Dam,
177 De elta Total Dissolv ved Gas Pressure e (mm Hg) u 18u* 38u 38b 58u 58u* 58b 100u* 99u 98b Delta TDG-Calculated P=3.27(TWE-743)(1.0-exp(-0.58q s )) TDG sat =( P+BP)/BP*100 N=12 R 2 =0.91 Std Error=10.6 mm Hg P=TDG Pressure BP (mm Hg) q s = Q sp /N bay = Unit Spillway Discharge (kcfs/bay) Q sp =Total Spillway Discharge (kcfs) N bay =Q sp Q 14.5 i / Q 15.5 i i=1, 19 BP = Barometric Pressure (mm Hg) TWE= Tailwater Elevation (ft) TDG sat =Total Dissolved Gas Saturation (%) 142u Bulk (T4-sp) 144b Uniform (T4-sp) DeltaTDG-Cal DeltaTDG-Cal (TWE=780) DeltaTDG-Cal (TWE=783) DeltaTDG-Cal (TWE=786) Residual lerror Unit Spillway Discharge (kcfs/bay) ror (mm Hg) Residual Err Figure 77. Observed and Calculated Delta Total Dissolved Gas Pressure as a function of unit spillway discharge for uniform and bulk spill events (note: weighted unit spillway discharge, exponential function model) 175
178 De elta Total Dissolv ved Gas Pressure e (mm Hg) u 18u* 38u 38b 58u 58u* 58b 99u 100u* 98b Delta TDG-Calculated P=(TWE-743) 1.16 (q s ) 0.30 TDG sat =( P+BP)/BP*100 N=12 R 2 =0.79 Std Error=9.3 mm Hg P=TDG Pressure BP (mm Hg) q s = Q sp /N bay =Unit Spillway Discharge (kcfs/bay) Q sp =Total Spillway Discharge (kcfs) N bay =Q sp Q 15.1 i / Q 16.1 i BP = Barometric Pressure (mm Hg) TWE= Tailwater Elevation (ft) TDG sat =Total Dissolved Gas Saturation (%) 142u Bulk (T4-sp) 144b Uniform (T4-sp) DeltaTDG-Cal DeltaTDG-Cal (TWE=780) DeltaTDG-Cal (TWE=783) DeltaTDG-Cal (TWE=786) Residual lerror Unit Spillway Discharge (kcfs/bay) ror (mm Hg) Residual Err Figure 78. Observed and Calculated Delta Total Dissolved Gas Pressure as a function of unit spillway discharge for uniform and bulk spill events (note: weighted unit spillway discharge, power function model) 176
179 Flow (kcfs s) To otal Dissolved Ga as Pressure (mm Hg) u* 1 58u* 100u* 38u 38b 98b 144b 8u 1 142u 58u 58b 99u /28/09 0:00 4/29/09 0:00 4/30/09 0:00 5/1/09 0:00 5/2/09 0:00 CHJ CHQW-Dup CHJW-Dup TDGsp-Calculated T4P1 T4P2 T4P3 T4P4 T4P5 T4P6 T4P7 T4P8 t4-avg T4-Avg-Cal Qtotal Qspill Figure 79. Observed and Calculated Total Dissolved Gas Pressure on Transect T4 and Chief Joseph Dam operations April 28-May 1, 2009 (power function model Equation 8) 177
180 fs) Flow (kcf To otal Dissolved Ga as Pressure (mm m Hg) u* 1 57u* 100u* 38u 38b 98b 144b 8u 1 142u 58u 58b 97u /28/09 0:00 4/29/09 0:00 4/30/09 0:00 5/1/09 0:00 5/2/09 0:00 CHJ CHQW-Dup CHJW-Dup TDGsp-Calculated T4P1 T4P2 T4P3 T4P4 T4P5 T4P6 T4P7 T4P8 t4-avg T4-Avg-Cal Qtotal Qspill Figure 80. Observed and Calculated Total Dissolved Gas Pressure on Transect T4 as a function Chief Joseph Dam operations for April 28-May 1, 2009 (exponential function model) 178


181 Figure 81. Calculated and Observed TDG saturation in the forebay of Wells Dam, April 28-May 1,
Total Dissolved Gas Properties and Processes. by Mike Schneider US Army Corps of Engineers Engineer Research and Development Center
 Total Dissolved Gas Properties and Processes by Mike Schneider US Army Corps of Engineers Engineer Research and Development Center TDG Properties and Processes Scope of Discussion Physical Properties of
Chief Joseph Dam 2012 Two Bay Uplift Spill Test: Total Dissolved Gas Exchange
 U.S. Army Corps of Engineers Seattle District Chief Joseph Dam 2012 Two Bay Uplift Spill Test: Total Dissolved Gas Exchange Prepared by Kent B. Easthouse U.S. Army Corps of Engineers, Seattle District
Libby Dam 2011 Sluiceway Release Study: Total Dissolved Gas and Temperature Monitoring
 U.S. Army Corps of Engineers Seattle District Libby Dam 2011 Sluiceway Release Study: Total Dissolved Gas and Temperature Monitoring Prepared by Kent B. Easthouse U.S. Army Corps of Engineers, Seattle
Session C9: Priest Rapids Fish Bypass: A Case Study from Start to Finish
 University of Massachusetts - Amherst ScholarWorks@UMass Amherst International Conference on Engineering and Ecohydrology for Fish Passage International Conference on Engineering and Ecohydrology for Fish
Hydraulic Modeling to Aid TDG Abatement at Boundary and Cabinet Gorge Dams
 Hydraulic Modeling to Aid TDG Abatement at Boundary and Cabinet Gorge Dams Joe Orlins, P.E., Ph.D. NWHA Technical Seminar May 15, 2014 Boundary and Cabinet Gorge Dams The Problem: Too Much Gas Boundary
DAIVÕES DAM SPILLWAY: A NOVEL SOLUTION FOR THE STILLING BASIN
 DAIVÕES DAM SPILLWAY: A NOVEL SOLUTION FOR THE STILLING BASIN Elsa Alves *, Felix Hernando and Rafael Chacón * Laboratório Nacional de Engenharia Civil (LNEC) Av. do Brasil, 101, 1700-066 Lisboa, Portugal
Options for Reducing Total Dissolved Gas at the Long Lake Hydroelectric Facility. Northwest Hydraulic Consultants Inc, Seattle, Washington, USA
 Options for Reducing Total Dissolved Gas at the Long Lake Hydroelectric Facility Ed Zapel 1, Hank Nelson 2, Brian Hughes 3, Steve Fry 4 1 Northwest Hydraulic Consultants Inc, Seattle, Washington, USA 2
USING A LABYRINTH WEIR TO INCREASE HYDRAULIC CAPACITY. Dustin Mortensen, P.E. 1 Jake Eckersley, P.E. 1
 USING A LABYRINTH WEIR TO INCREASE HYDRAULIC CAPACITY Dustin Mortensen, P.E. 1 Jake Eckersley, P.E. 1 Plum Creek Floodwater Retarding Structure No. 6 is located in an area of Kyle, Texas, that is currently
Packwood Lake Intake Screen Velocity Test Report for Energy Northwest's Packwood Lake Hydroelectric Project FERC No Lewis County, Washington
 for Energy Northwest's Packwood Lake Hydroelectric Project FERC No. 2244 Lewis County, Washington Submitted to P.O. Box 968 Richland, Washington 99352-0968 Submitted by EES Consulting 1155 North State
NUMERICAL AND PHYSICAL MODELING
 POINTE DU BOIS GENERATING STATION SPILLWAY REPLACEMENT PROJECT NUMERICAL AND PHYSICAL MODELING Kara Hurtig, Northwest Hydraulic Consultants, North Vancouver, BC, Canada David S. Brown, KGS Group, Winnipeg,
Advanced Hydraulics Prof. Dr. Suresh A. Kartha Department of Civil Engineering Indian Institute of Technology, Guwahati
 Advanced Hydraulics Prof. Dr. Suresh A. Kartha Department of Civil Engineering Indian Institute of Technology, Guwahati Module - 4 Hydraulic Jumps Lecture - 1 Rapidly Varied Flow- Introduction Welcome
Currents measurements in the coast of Montevideo, Uruguay
 Currents measurements in the coast of Montevideo, Uruguay M. Fossati, D. Bellón, E. Lorenzo & I. Piedra-Cueva Fluid Mechanics and Environmental Engineering Institute (IMFIA), School of Engineering, Research
STRUCTURE S-65 PURPOSE SPILLWAY OPERATION
 STRUCTURE S-65 This structure is a reinforced concrete, gated spillway with discharge controlled by three cable operated, vertical lift gates, and a reinforced concrete lock structure with two pairs of
Appendix I. Portland District TDG Report Prepared by the USGS (Includes The Dalles, John Day, and Bonneville Dams)
") Appendix I Portland District TDG Report Prepared by the USGS (Includes The Dalles, John Day, and Bonneville Dams) Prepared in cooperation with the U.S. Army Corps of Engineers Total Dissolved Gas and
Appendix I Portland District TDG Report Prepared by the USGS (Includes The Dalles, John Day, and Bonneville Dams) Prepared in cooperation with the U.S. Army Corps of Engineers Total Dissolved Gas and
The Hydraulic Design of an Arced Labyrinth Weir at Isabella Dam
 Utah State University DigitalCommons@USU International Symposium on Hydraulic Structures Jun 28th, 1:30 PM The Hydraulic Design of an Arced Labyrinth Weir at Isabella Dam E. A. Thompson Sacramento District
APPENDIX A STRUCTURE DESCRIPTIONS AND RATING CURVES
 3 4 5 6 7 8 9 0 3 APPENDIX A STRUCTURE DESCRIPTIONS AND RATING CURVES Kissimmee River Vol December 005 Version Draft 4 3 4 5 6 7 8 9 0 3 4 5 6 7 8 9 0 3 4 5 6 7 8 9 30 3 3 33 34 35 36 37 38 39 40 4 4 43
SUBMERGED VENTURI FLUME. Tom Gill 1 Robert Einhellig 2 ABSTRACT
 SUBMERGED VENTURI FLUME Tom Gill 1 Robert Einhellig 2 ABSTRACT Improvement in canal operating efficiency begins with establishing the ability to measure flow at key points in the delivery system. The lack
CTB3365x Introduction to Water Treatment
 CTB3365x Introduction to Water Treatment D4b Aeration Doris van Halem Did you know that there are not just gasses in your glass of sparkling coke, but also in the tap water you drink? Welcome to the water
Nearshore Placed Mound Physical Model Experiment
 Nearshore Placed Mound Physical Model Experiment PURPOSE: This technical note describes the migration and dispersion of a nearshore mound subjected to waves in a physical model. The summary includes recommendations
Management Plan for the Obey River Trout Fishery
 Management Plan for the Obey River Trout Fishery 28-214 By: James Travis Scott Jack Swearengin Walter Scott Webb D.W. Young Tennessee Wildlife Resources Agency January 28 Management Plan for the Obey River
HYDRAULIC JUMP AND WEIR FLOW
 HYDRAULIC JUMP AND WEIR FLOW 1 Condition for formation of hydraulic jump When depth of flow is forced to change from a supercritical depth to a subcritical depth Or Froude number decreases from greater
Cabinet Gorge Dam Spillway Modifications for TDG Abatement - Design Evolution and Field Performance
 Utah State University DigitalCommons@USU International Symposium on Hydraulic Structures Jun 29th, 1:30 PM - 3:30 PM Cabinet Gorge Dam Spillway Modifications for TDG Abatement - Design Evolution and Field
Greenup Lock Filling and Emptying System Study
 Fourth LACCEI International Latin American and Caribbean Conference for Engineering and Technology (LACCET 2006) Breaking Frontiers and Barriers in Engineering: Education, Research and Practice 21-23 June
APPENDIX J HYDROLOGY AND WATER QUALITY
 APPENDIX J HYDROLOGY AND WATER QUALITY J-1 Technical Report on Airport Drainage, Northern Sector Airport and Ordinance Creek Watershed / Preliminary Creek Constructed Natural Channel Culvert J-2 Preliminary
Rock Ramp Design Guidelines. David Mooney MS Chris Holmquist-Johnson MS Drew Baird Ph.D. P.E. Kent Collins P.E.
 Rock Ramp Design Guidelines David Mooney MS Chris Holmquist-Johnson MS Drew Baird Ph.D. P.E. Kent Collins P.E. Rock Ramp Design Guidelines OUTLINE Local and System Interactions with Rock Ramps Ramp Geometry
Marine Kit 4 Marine Kit 4 Sail Smooth, Sail Safe
 Marine Kit 4 Marine Kit 4 Sail Smooth, Sail Safe Includes Basic ship Terminologies and Investigation Check list Index 1. Ship Terminology 03 2. Motions of a Floating Body...09 3. Ship Stability.10 4. Free
Exercise (3): Open Channel Flow Rapidly Varied Flow
: Open Channel Flow Rapidly Varied Flow") Exercise (3): Open Channel Flow Rapidly Varied Flow 1) A hydraulic jump exists in a trapezoidal channel having a bed width of 7 m and side slope of 1:1. The flowing discharge is 25 m 3 /sec. Construct
Exercise (3): Open Channel Flow Rapidly Varied Flow 1) A hydraulic jump exists in a trapezoidal channel having a bed width of 7 m and side slope of 1:1. The flowing discharge is 25 m 3 /sec. Construct
Designing Labyrinth Spillways for Less than Ideal Conditions Real World Application of Laboratory Design Methods
 Designing Labyrinth Spillways for Less than Ideal Conditions Real World Application of Laboratory Design Methods Gregory Richards, P.E., CFM, Gannett Fleming, Inc. Blake Tullis, Ph.D., Utah Water Research
Plan B Dam Breach Assessment
 Plan B Dam Breach Assessment Introduction In support of the Local Sponsor permit applications to the states of Minnesota and North Dakota, a dam breach analysis for the Plan B alignment of the Fargo-Moorhead
Scott Dam Spillway Comparing Physical Model Study Results
 Scott Dam Spillway Comparing Physical Model Study Results Darren Hinton, P.E., Ph.D., Seattle Laboratory Manager, Northwest Hydraulic Consultants, USA Brian Hughes, M.A.Sc., P.E., Principal, Northwest
EXAMPLES (OPEN-CHANNEL FLOW) AUTUMN 2018
 AUTUMN 2018") EXAMPLES (OPEN-CHANNEL FLOW) AUTUMN 2018 Normal and Critical Depths Q1. If the discharge in a channel of width 5 m is 20 m 3 s 1 and Manning s n is 0.02 m 1/3 s, find: (a) the normal depth and Froude number
EXAMPLES (OPEN-CHANNEL FLOW) AUTUMN 2018 Normal and Critical Depths Q1. If the discharge in a channel of width 5 m is 20 m 3 s 1 and Manning s n is 0.02 m 1/3 s, find: (a) the normal depth and Froude number
Undertow - Zonation of Flow in Broken Wave Bores
 Lecture 22 Nearshore Circulation Undertow - Zonation of Flow in Broken Wave Bores In the wave breaking process, the landward transfer of water, associated with bore and surface roller decay within the
Ermenek Dam and HEPP: Spillway Test & 3D Numeric-Hydraulic Analysis of Jet Collision
 Ermenek Dam and HEPP: Spillway Test & 3D Numeric-Hydraulic Analysis of Jet Collision J.Linortner & R.Faber Pöyry Energy GmbH, Turkey-Austria E.Üzücek & T.Dinçergök General Directorate of State Hydraulic
Water Quality Guidelines for Total Gas Pressure: First Update
 Water Quality Water Quality Guidelines for Total Gas Pressure: First Update Overview Report Prepared pursuant to Section 2(e) of the Environment Management Act, 1981 Approved: Date Assistant Deputy Minister
Modeling of Oxygen Injection Experiment in Savannah Harbor
 593 Modeling of Oxygen Injection Experiment in Savannah Harbor S. Davie 1, H. Moorer 2, H. Rodriguez 1, Y. Plis 1 1 Tetra Tech, Inc., 2110 Powers Ferry Road, Suite 202, Atlanta, GA 30339, PH (770) 850-0949;
Request Number IR1-12: Flow Passage. Information Request
 Request Number IR1-12: Flow Passage Information Request Provide additional information about the 100 metre flow passage channel scenario between the Westshore Terminals and the proposed Project terminal
An underwater explosion is an explosion where the point of detonation is below the surface of the water.
 Underwater Explosion 1 Introduction An underwater explosion is an explosion where the point of detonation is below the surface of the water. Underwater explosion are categorized in accordance with their
STUDY REPORT W&AR-03 RESERVOIR TEMPERATURE MODEL ATTACHMENT B DON PEDRO RESERVOIR BATHYMETRIC STUDY REPORT
 STUDY REPORT W&AR-03 RESERVOIR TEMPERATURE MODEL ATTACHMENT B DON PEDRO RESERVOIR BATHYMETRIC STUDY REPORT DON PEDRO RESERVOIR BATHYMETRIC STUDY REPORT Prepared for: TURLOCK IRRIGATION DISTRICT MODESTO
Instruction Sheet. Important Note: Information that requires special emphasis. Note: Information that supplements points in the main text.
 Hach LDO Sensor Instruction Sheet 00745589 Safety Precautions Please read this entire instruction sheet before operating this sensor. Pay particular attention to all danger and caution statements. Failure
Wind Flow Validation Summary
 IBHS Research Center Validation of Wind Capabilities The Insurance Institute for Business & Home Safety (IBHS) Research Center full-scale test facility provides opportunities to simulate natural wind conditions
and B.J. Burke National Marine Fisheries Service (NOAA Fisheries) 2725 Montlake Blvd, East, Seattle, Washington for
 2725 Montlake Blvd, East, Seattle, Washington for") Technical Report 6-1 DRAFT FISHWAY ENTRANCE USE AND PASSAGE TIMES OF ADULT SPRING SUMMER CHINOOK SALMON AT LOWER MONUMENTAL DAM, WITH AN EMPHASIS ON EFFECTS OF SPILLWAY DEFLECTORS: -4 by M.L. Keefer, C.A.
Technical Report 6-1 DRAFT FISHWAY ENTRANCE USE AND PASSAGE TIMES OF ADULT SPRING SUMMER CHINOOK SALMON AT LOWER MONUMENTAL DAM, WITH AN EMPHASIS ON EFFECTS OF SPILLWAY DEFLECTORS: -4 by M.L. Keefer, C.A.
AN EXPERIMENTAL INVESTIGATION OF SPILLING BREAKERS
 AN EXPERIMENTAL INVESTIGATION OF SPILLING BREAKERS Prof. James H. Duncan Department of Mechanical Engineering University of Maryland College Park, Maryland 20742-3035 phone: (301) 405-5260, fax: (301)
Undertow - Zonation of Flow in Broken Wave Bores
 Nearshore Circulation Undertow and Rip Cells Undertow - Zonation of Flow in Broken Wave Bores In the wave breaking process, the landward transfer of water, associated with bore and surface roller decay
Advanced Hydraulics Prof. Dr. Suresh A. Kartha Department of Civil Engineering Indian Institute of Technology, Guwahati
 Advanced Hydraulics Prof. Dr. Suresh A. Kartha Department of Civil Engineering Indian Institute of Technology, Guwahati Module - 4 Hydraulics Jumps Lecture - 4 Features of Hydraulic Jumps (Refer Slide
ENTRANCES USED AND PASSAGE THROUGH FISHWAYS FOR ADULT CHINOOK SALMON AND STEELHEAD
 ENTRANCES USED AND PASSAGE THROUGH FISHWAYS FOR ADULT CHINOOK SALMON AND STEELHEAD Part III of Final Report for MIGRATION OF ADULT CHINOOK SALMON AND STEELHEAD PAST DAMS AND THROUGH RESERVOIRS IN THE LOWER
Application Worksheet
 Application Worksheet All dimensions are nominal. Dimensions in [ ] are in millimeters. Service Conditions Medium Through Valve: Required C v : Temperature Maximum: Minimum: Normal: Flow Maximum: Minimum:
Drilling Efficiency Utilizing Coriolis Flow Technology
 Session 12: Drilling Efficiency Utilizing Coriolis Flow Technology Clement Cabanayan Emerson Process Management Abstract Continuous, accurate and reliable measurement of drilling fluid volumes and densities
SPILLWAY REPLACEMENT PROJECT NUMERICAL AND PHYSICAL MODELING. Kara Hurtig, Water Resources Engineer, Northwest Hydraulic Consultants, BC, Canada
 POINTE DU BOIS GENERATING STATION SPILLWAY REPLACEMENT PROJECT NUMERICAL AND PHYSICAL MODELING Kara Hurtig, Water Resources Engineer, Northwest Hydraulic Consultants, BC, Canada David S. Brown, Senior
DEAD-ENDCHANNELFLUSHINGINHARBORS
 DEAD-ENDCHANNELFLUSHNGNHARBORS PURPOSE: The purpose of this technical note is to present some design con- siderations which benefit dead-end channel flushing. Some of these factors can also be used to
Abrupt marine boundary layer changes revealed by airborne in situ and lidar measurements
 Abrupt marine boundary layer changes revealed by airborne in situ and lidar measurements David A. Rahn 1, Thomas R. Parish 2, and David Leon 2 1 Univeristy of Kansas 2 Univeristy of Wyoming Precision Atmospheric
Broadly speaking, there are four different types of structures, each with its own particular function:
 3 The selection of structures 3.1 Introduction In selecting a suitable structure to measure or regulate the flow rate in open channels, all demands that will be made upon the structure should be listed.
Courses of Instruction: Controlling and Monitoring of Pipelines
 Courses of Instruction: Controlling and Monitoring of Pipelines Date December 2010 Dr. Peter Eschenbacher Partner Angergraben 4 85250 Altomünster Germany Tel. +49-(0)8254 / 99 69 57 Fax +49-(0)8254 / 99
847 NE 19 th Avenue, #250, Portland, OR Phone: (503) Fax: (503) us at
 Fax: (503) us at") FISH PASSAGE CENTER 847 NE 19 th Avenue, #250, Portland, OR 97232 Phone: (503) 833-3900 Fax: (503) 232-1259 www.fpc.org/ e-mail us at fpcstaff@fpc.org MEMORANDUM TO: Charlie Morrill (WDFW) FROM: Michele
FISH PASSAGE CENTER 847 NE 19 th Avenue, #250, Portland, OR 97232 Phone: (503) 833-3900 Fax: (503) 232-1259 www.fpc.org/ e-mail us at fpcstaff@fpc.org MEMORANDUM TO: Charlie Morrill (WDFW) FROM: Michele
Gas Saturation and Sensitivity Analysis Using CRiSP
 Gas Saturation and Sensitivity Analysis Using CRiSP by Pam Shaw Center for Quantitative Science University of Washington Introduction The Army Corps of Engineers began the Gas Abatement Study in order
STRUCTURE 65-B PURPOSE SPILLWAY OPERATION
 STRUCTURE 65-B This structure is a reinforced concrete, gated spillway with discharge controlled by three cable operated vertical lift gates and a reinforced concrete lock structure with two pairs of sector
Wind Flow Model of Area Surrounding the Case Western Reserve University Wind Turbine
 Wind Flow Model of Area Surrounding the Case Western Reserve University Wind Turbine Matheus C. Fernandes 1, David H. Matthiesen PhD *2 1 Case Western Reserve University Dept. of Mechanical Engineering,
CROSS-SHORE SEDIMENT PROCESSES
 The University of the West Indies Organization of American States PROFESSIONAL DEVELOPMENT PROGRAMME: COASTAL INFRASTRUCTURE DESIGN, CONSTRUCTION AND MAINTENANCE A COURSE IN COASTAL DEFENSE SYSTEMS I CHAPTER
BC Ministry of Forests. March Fish Stream Crossing Guidebook. Forest Practices Code of British Columbia.
 FRST 557 Lecture 7c Bridges and Culverts: Water Velocity and Discharge Lesson Background and Overview: The previous two lessons presented methods for estimating water volume flow at a particular site and
VACUUM TESTING PRECAST CONCRETE MANHOLES
 1 OF 5 testing is a quick, safe and practical way to validate manhole system integrity. Manhole sections can be tested at the precast concrete plant prior to delivery or on site prior to backfilling. Here
Packwood Hydroelectric Project Barrier Analysis December 12, 2006
 Packwood Hydroelectric Project Barrier Analysis December 12, 2006 Study Area Natural barriers to upstream fish passage on Lake Creek at RM 1.03 and RM 1.95 Snyder Creek culvert under the Project tailrace
The activated sludge process
 The activated sludge process Most wastewater treatment plants are using the activated sludge process. The heart of such a process mainly consists of an aeration tank, a sedimentation tank or clarifier
International Journal of Technical Research and Applications e-issn: , Volume 4, Issue 3 (May-June, 2016), PP.
, PP.") DESIGN AND ANALYSIS OF FEED CHECK VALVE AS CONTROL VALVE USING CFD SOFTWARE R.Nikhil M.Tech Student Industrial & Production Engineering National Institute of Engineering Mysuru, Karnataka, India -570008
DESIGN AND ANALYSIS OF FEED CHECK VALVE AS CONTROL VALVE USING CFD SOFTWARE R.Nikhil M.Tech Student Industrial & Production Engineering National Institute of Engineering Mysuru, Karnataka, India -570008
2. RAPIDLY-VARIED FLOW (RVF) AUTUMN 2018
 AUTUMN 2018") 2. RAPIDLY-VARIED FLOW (RVF) AUTUMN 2018 Rapidly-varied flow is a significant change in water depth over a short distance (a few times water depth). It occurs where there is a local disturbance to the
2. RAPIDLY-VARIED FLOW (RVF) AUTUMN 2018 Rapidly-varied flow is a significant change in water depth over a short distance (a few times water depth). It occurs where there is a local disturbance to the
CLAIBORNE LOCK AND DAM PERTINENT DATA
 CLAIBORNE LOCK AND DAM PERTINENT DATA GENERAL Location Clarke, Monroe, & Wilcox Counties, Alabama; Alabama River, river mile 72.5 Drainage area Millers Ferry to Claiborne sq. mi. 836 Total drainage area
WOODFIBRE LNG VESSEL WAKE ASSESSMENT
 Woodfibre LNG Limited WOODFIBRE LNG VESSEL WAKE ASSESSMENT Introduction Woodfibre LNG Limited (WLNG) intends to build a new LNG export terminal at Woodfibre, Howe Sound, British Columbia. WLNG has engaged
Study on Distribution Characteristics and Mitigation Measures of Dissolved Oxygen Super-saturation in the Lower Reaches of High Dam
 Study on Distribution Characteristics and Mitigation Measures of Dissolved Oxygen Super-saturation in the Lower Reaches of High Dam WANG Lei, ZHANG Jun-peng (China Three Gorges Corporation, Chengdu 610041,
ANNUAL INSPECTION BY A QUALIFIED PROFESSIONAL ENGINEER ALL CCR IMPOUNDMENTS CCR Rule Section (b)
") ANNUAL INSPECTION BY A QUALIFIED PROFESSIONAL ENGINEER ALL CCR IMPOUNDMENTS ASBURY POWER PLANT 21133 Uphill Lane Asbury, Missouri 64832 January 18, 2017 EMPIRE DISTRICT ELECTRIC COMPANY Prepared by: Rachel
ANNUAL INSPECTION BY A QUALIFIED PROFESSIONAL ENGINEER ALL CCR IMPOUNDMENTS ASBURY POWER PLANT 21133 Uphill Lane Asbury, Missouri 64832 January 18, 2017 EMPIRE DISTRICT ELECTRIC COMPANY Prepared by: Rachel
ANSWERS TO QUESTIONS IN THE NOTES AUTUMN 2018
 ANSWERS TO QUESTIONS IN THE NOTES AUTUMN 2018 Section 1.2 Example. The discharge in a channel with bottom width 3 m is 12 m 3 s 1. If Manning s n is 0.013 m -1/3 s and the streamwise slope is 1 in 200,
Monitoring the Behavior of Acoustically Tagged Chinook and Steelhead Smolts Approaching Rocky Reach Dam on the Columbia River
 Presented at Waterpower XII, July 9-11, 2001, Salt Lake City, Utah, USA Monitoring the Behavior of Acoustically Tagged Chinook and Steelhead Smolts Approaching Rocky Reach Dam on the Columbia River ABSTRACT
APPENDIX A STRUCTURE DESCRIPTIONS AND RATING CURVES. Lake Okeechobee & EAA Vol 3 A-i December 2005 Version 1 Draft 4
 1 1 1 1 1 1 1 1 0 1 0 1 0 APPENDIX A STRUCTURE DESCRIPTIONS AND RATING CURVES Lake Okeechobee & EAA Vol A-i December 00 1 1 1 1 1 1 1 1 0 1 from the drainage area served, under a design head of. feet pool
Redd Dewatering and Juvenile Salmonid Stranding in the Lower Feather River,
 Redd Dewatering and Juvenile Salmonid Stranding in the Lower Feather River, 2005-2006 Interim Report for NOAA Fisheries Prepared by: California Department of Water Resources Division of Environmental Services
Technical Report Culvert A Hydraulic Analysis
 DATE: November 3, 2011 Technical Report Culvert A Hydraulic Analysis TO: FROM: RE: Jim Reiser, P.E. Project Manager Parsons Brinckerhoff, Inc. Kurt Killian, P.E., CFM Parsons Brinckerhoff, Inc. Design
Little Spokane River Stream Gage Report: Deadman Creek, Dragoon Creek, and the West Branch of the Little Spokane River
 Little Spokane River Stream Gage Report: Deadman Creek, Dragoon Creek, and the West Branch of the Little Spokane River June 2010 Spokane County Conservation District N. 210 Havana St. Spokane, WA 99202
Air Eliminators and Combination Air Eliminators Strainers
 Description Air Eliminators and Combination Air Eliminator Strainers are designed to provide separation, elimination and prevention of air in piping systems for a variety of installations and conditions.
FLOW CONSIDERATIONS IN INDUSTRIAL SILENCER DESIGN
 FLOW CONSIDERATIONS IN INDUSTRIAL SILENCER DESIGN George Feng, Kinetics Noise Control, Inc., 3570 Nashua Drive, Mississauga, Ontario Vadim Akishin, Kinetics Noise Control, Inc., 3570 Nashua Drive, Mississauga,
Technical Report 99-6 EVALUATION OF RUNNING TURBINE 1 AT MAXIMUM CAPACITY ON PASSAGE OF ADULT SALMON AND STEELHEAD AT JOHN DAY DAM
 Technical Report 99-6 EVALUATION OF RUNNING TURBINE 1 AT MAXIMUM CAPACITY ON PASSAGE OF ADULT SALMON AND STEELHEAD AT JOHN DAY DAM - 1997 A report for Project MPE-P-95-1 by T.C. Bjornn, C.A. Peery, K.R.
COST EFFECTIVE STORAGE CAPACITY INCREASE FOR ALUMINA TAILINGS DISPOSAL AREA THROUGH SPILLWAY OPTIMISATION
 COST EFFECTIVE STORAGE CAPACITY INCREASE FOR ALUMINA TAILINGS DISPOSAL AREA THROUGH SPILLWAY OPTIMISATION Abstract Lonie I * Tailings and Dams, GHD Brisbane, QLD, Australia Queensland Alumina Limited operates
Spillway Deflector Design Using Physical and Numerical Models
 Utah State University DigitalCommons@USU International Symposium on Hydraulic Structures Jun 28th, 4:00 PM Spillway Deflector Design Using Physical and Numerical Models M. Politano University of Iowa,
PROFILE OF SACRAMENTO RIVER, FREEPORT TO VERONA, CALIFORNIA,
 PROFILE OF SACRAMENTO RIVER, FREEPORT TO VERONA, CALIFORNIA, FLOOD OF FEBRUARY 1986 By J.C. Blodgett and J.B. Lucas U.S. GEOLOGICAL SURVEY Open-File Report 88-82 CO CM I m r-h CM Sacramento, California
APPENDIX C VEGETATED EMERGENCY SPILLWAY. VERSION 1.0 March 1, 2011
 APPENDIX C VEGETATED EMERGENCY SPILLWAY VERSION 1.0 March 1, 2011 [NOTE: Could use a better photo more clearly showing the emergency spillway in the context of the dam.] SECTION C-1: DESCRIPTION OF PRACTICE
Aalborg Universitet. Published in: Proceedings of Offshore Wind 2007 Conference & Exhibition. Publication date: 2007
 Aalborg Universitet Design Loads on Platforms on Offshore wind Turbine Foundations with Respect to Vertical Wave Run-up Damsgaard, Mathilde L.; Gravesen, Helge; Andersen, Thomas Lykke Published in: Proceedings
IMPROVING PLANT AERATION USING GAS INFUSION TECHNOLOGY
 IMPROVING PLANT AERATION USING GAS INFUSION TECHNOLOGY AERATION IN WASTEWATER Municipal sewer collection systems-odor Mgmt. Lift and transfer stations Lagoons / Retention Ponds BOD / COD treatment Enhanced
This test shall be carried out on all vehicles equipped with open type traction batteries.
 5.4. Determination of hydrogen emissions page 1 RESS-6-15 5.4.1. This test shall be carried out on all vehicles equipped with open type traction batteries. 5.4.2. The test shall be conducted following
Dissolved Oxygen Guide
 Educat i onser i es Di ssol vedoxygengui de Dissolved Oxygen Guide Introduction Dissolved oxygen probes provide a convenient approach to essentially direct measurement of molecular oxygen. The membrane
Study of Passing Ship Effects along a Bank by Delft3D-FLOW and XBeach1
 Study of Passing Ship Effects along a Bank by Delft3D-FLOW and XBeach1 Minggui Zhou 1, Dano Roelvink 2,4, Henk Verheij 3,4 and Han Ligteringen 2,3 1 School of Naval Architecture, Ocean and Civil Engineering,
Scale Factor Study for 1:30 Local Scour Model
 Scale Factor Study for 1:30 Local Scour Model by Jeremy A. Sharp, Ronald E. Heath, Howard E. Park, and Tate O. McAlpin PURPOSE: This Coastal and Hydraulics Engineering Technical Note (CHETN) contains a
TRANSPORT OF NEARSHORE DREDGE MATERIAL BERMS
 Proceedings of the 6 th International Conference on the Application of Physical Modelling in Coastal and Port Engineering and Science (Coastlab16) Ottawa, Canada, May 10-13, 2016 Copyright : Creative Commons
Gas Gathering System Modeling The Pipeline Pressure Loss Match
 PETROLEUM SOCIETY CANADIAN INSTITUTE OF MINING, METALLURGY & PETROLEUM PAPER 2005-230 Gas Gathering System Modeling The Pipeline Pressure Loss Match R.G. MCNEIL, P.ENG. Fekete Associates Inc. D.R. LILLICO,
Water Hammer In Irrigation Systems 1
 CIR828 1 G. A. Clark and D. Z. Haman 2 Irrigation system design includes pump sizing and selection, valve sizing and selection, and pipe sizing as well as the proper selection and placement of many other
An experimental study of internal wave generation through evanescent regions
 An experimental study of internal wave generation through evanescent regions Allison Lee, Julie Crockett Department of Mechanical Engineering Brigham Young University Abstract Internal waves are a complex
Distribution Restriction Statement Approved for public release; distribution is unlimited.
 CECW-EH Engineer Regulation 1110-2-1451 Department of the Army U.S. Army Corps of Engineers Washington, DC 20314-1000 Engineering and Design ACQUISITION OF LANDS DOWNSTREAM FROM SPILLWAYS FOR HYDROLOGIC
Passage Key Inlet, Florida; CMS Modeling and Borrow Site Impact Analysis
 Passage Key Inlet, Florida; CMS Modeling and Borrow Site Impact Analysis by Kelly R. Legault and Sirisha Rayaprolu PURPOSE: This Coastal and Hydraulics Engineering Technical Note (CHETN) describes the
Investigation of Suction Process of Scroll Compressors
 Purdue University Purdue e-pubs International Compressor Engineering Conference School of Mechanical Engineering 2006 Investigation of Suction Process of Scroll Compressors Michael M. Cui Trane Jack Sauls
Gases and Pressure. Main Ideas
 Gases and Pressure Key Terms pressure millimeters of mercury partial pressure newton atmosphere of pressure Dalton s law of partial pressures barometer pascal In the chapter States of Matter, you read
Large-scale Field Test
 Vaskinn 1 Large-scale Field Test Kjetil Arne Vaskinn kav@trh.statkraftgroner.no Statkraft Grøner AS SUMMARY The objective the controlled failure of large-scale embankment is to monitor and record the failure
SECTION 2 HYDROLOGY AND FLOW REGIMES
 SECTION 2 HYDROLOGY AND FLOW REGIMES In this section historical streamflow data from permanent USGS gaging stations will be presented and discussed to document long-term flow regime trends within the Cache-Bayou
Exploring Localized Mixing Dynamics During Wet Weather in a Tidal Fresh Water System
 Exploring Localized Mixing Dynamics During Wet Weather in a Tidal Fresh Water System Ramona McCullough & Phil Duzinski Delaware Estuary Science & Environmental Summit January 27, 2015 Background and objectives
Structure and discharge test cases
 Chapter 28 Structure and discharge test cases 28.1 Introduction Three test case have been implemented to test the performance and applicability of the structures and discharges modules. drythin Simulates
WASHINGTON CONSERVATION DISTRICT STANDARD OPERATING PROCEDURE (S.O.P.)
") Page 1 of 18 Water Monitoring Program WASHINGTON CONSERVATION DISTRICT STANDARD OPERATING PROCEDURE (S.O.P.) No. 1 FLOW MONITORING Page 2 of 18 Water Monitoring Program Standard Operating Procedure No.
Page 1 of 18 Water Monitoring Program WASHINGTON CONSERVATION DISTRICT STANDARD OPERATING PROCEDURE (S.O.P.) No. 1 FLOW MONITORING Page 2 of 18 Water Monitoring Program Standard Operating Procedure No.
DIRECT AND INVERTED PENDULUMS. Model DP & RP. Roctest Limited, All rights reserved.
 INSTRUCTION MANUAL DIRECT AND INVERTED PENDULUMS Model DP & RP Roctest Limited, 2006. All rights reserved. This product should be installed and operated only by qualified personnel. Its misuse is potentially