Wake-Up Call. DC: The WalkUP. The Nation s Capital As a National Model for Walkable Urban Places. By Christopher B. Leinberger
|
|
|
- Claribel Golden
- 5 years ago
- Views:
Transcription


1 DC: The WalkUP Wake-Up Call The Nation s Capital As a National Model for Walkable Urban Places By Christopher B. Leinberger The George Washington University School of Business 1
2 The Center for Real Estate and Urban Analysis Table of Contents I. Introduction... 3 II. WalkUPs Defined... 5 The Rise of the WalkUP... 6 Form Meets Function... 7 The 6 Types of WalkUPs III. WalkUPs in Metro D.C The 43 WalkUPs Geographic Findings Product Findings IV. WalkUP Trends The Last Three Real Estate Cycles Metro DC: A Model for the Country V. WalkUP Rankings Economic Rankings Social Equity Rankings Thanks to: VII. Next Steps Conclusions & Recommendations Further Study VII. Appendices Methodology Endnotes Acknowledgments DC: The WalkUp Wake-Up Call The George Washington University School of Business 2012
3 I. Introduction Welcome to the Future. There is a game-changing shift underway in real estate. New research reveals how walkable urban places and projects will drive tomorrow s real estate industry and the economy and what actions are needed to take advantage of these market trends. What was perceived as a niche market is becoming the market. This research takes a deep look at Washington, D.C., a national pioneer in walkable urban places, to identify where development has and will take place and the economic and social impact it will have. >>>>>>>>>>>>>>>>>>>>>>>>>> 3
4 Introduction This research challenges real estate developers, investors, regulators, managers, academics and citizens to rethink the way we manage the 35 percent of our nation s wealth that is invested in real estate and infrastructure, the built environment. 1 This is an important recalibration that affects how most of us live, work and are entertained. To ignore this structural change would be akin to ignoring the impact roads and cars had on the built environment more than a half-century ago. This new development model is walkable urban development. Metropolitan Washington, D.C., stands at the vanguard of this trend in the nation. For decades, real estate practitioners, observers and scholars have looked through an urban-versus-suburban lens. This can be traced to the U.S. Census, which serves as the platform for much of the research on the built environment. The Census separates its data into Walkable Urban: This form of development has much higher density, employs multiple modes of transportation that get people and goods to walkable environments and integrates many different real estate products in the same place. Drivable sub-urban and walkable urban forms of development have market support and appeal and, despite their names, each are found in both cities and suburbs. In the case of metropolitan D.C., drivable sub-urban development is located in the District s Palisades neighborhood and in Virginia s Prince William County subdivisions. Likewise, D.C. s Dupont Circle takes a walkable urban form, as does Reston Town Center in Fairfax County, Virginia. Drivable sub-urban has long been the dominant approach to real estate development. Today, that is reversing; the pendulum is swinging back to walkable urban development. Market demand for industry: place management. This new field develops the strategy and provides the day-to-day management for walkable urban places (referred to in shorthand as WalkUPs), creating a distinctive could only be here place in which investors and residents seem willing to invest for the long term. This new research defines for the first time where most existing WalkUPs are in the metropolitan D.C. region. It shows specific locations, the physical size of the places, the product mix, the transportation options and so forth. This study then ranks performance for these WalkUPs, based on two criteria: economics and social equity. The economic performance metrics help determine where different kinds of investors should put their capital and how these WalkUPs stack up against one another. The social equity performance metrics demonstrate whether a broad cross-section of metropolitan residents can live in or have transit access to WalkUPs. Walkable urban development calls for radically different approaches to urban design and planning, regulation, financing and construction. Most importantly, it also requires the introduction a new industry: place management. principal city and outlying counties. It is not unlike the classic social science joke about the tipsy guest who drops his keys at the front door as he leaves a party. While searching under a streetlight at the curb, he is asked, Why aren t you looking where you lost the keys? He replies, This is where the light is. We have watched and analyzed the urban/suburban debate where the light was, even if that meant using the wrong approach with the wrong datasets. In recent decades in our market-based world, there have been two broad forms of metropolitan development: 2 Drivable Sub-urban: This development has the lowest development density in metropolitan history. It is car/truck driven and features standalone real estate products and socially and racially segregated development. drivable sub-urban development, which has become overbuilt and was the primary market cause of the mortgage meltdown that triggered the Great Recession, is on the wane. Meanwhile, there is such pent-up demand for walkable urban development as demonstrated by rental and sales price premiums per-square-foot and capitalization rates that it could take a generation of new construction to satisfy. This shift is extremely good news for the beleaguered real estate industry and the economy as a whole. It will put a foundation under the economy as well as government tax revenues, much like drivable sub-urban development benefited the economy and selected jurisdictions in the second half of the 20th century. Walkable urban development calls for dramatically different approaches to urban design and planning, regulation, financing and construction. Most importantly, it also requires the introduction of a new WalkUps are the outcome of smart growth policies that have been debated for the last two decades. The time for debate is over. The market has spoken. It is now time for the public sector to encourage, the real estate industry to build and place management to be strengthened or be put in place to give the market what it wants. This first attempt at quantifying the economics and social equity of WalkUPs is based on research methodology, titled Walk This Way 3, that Dr. Mariela Alfonzo and I developed at the Brookings Institution. Over time, I expect the results to be modified and improved. This is not only anticipated, but it is encouraged as the field of urbanism and the real estate industry make strides in better understanding how to build and manage great places. Sincerely, Christopher B. Leinberger Charles Bendit Distinguished Scholar and Research Professor of Urban Real Estate George Washington University School of Business 4 DC: The WalkUp Wake-Up Call The George Washington University School of Business 2012

5 II. WalkUPs Defined 5


6 WalkUPs Defined The Rise of the WalkUP The move toward WalkUPs started nearly two decades ago in U.S. metropolitan areas. Today they promise to be a powerful driver of the economy. During the second half of the 20th century, the dominant development model has been the familiar drivable sub-urban approach. Most real estate developers and investors, government regulators and financiers have come to understand this model extremely well, turning it into a successful development formula and economic driver. However, starting in the mid-1990s, the pendulum has been slowly moving back toward building WalkUPs, which was the approach embraced by the Washington, D.C., metro area and virtually every other metropolitan area prior to World War II. In recent years, real estate developers, investors, government regulators and financiers in the metropolitan D.C. area have become quite comfortable developing and managing walkable urban projects distinguishing the nation s capital region from most other metro areas that have not yet recognized the importance of WalkUPs in their future development. In fact, metropolitan Washington, D.C., has emerged as the model for how the nation should develop the built environment, according to a 2007 Brookings Institution study, 4 as will be expanded on in this report. Share of Income Property in WalkUPs Over the Last 3 Real Estate Cycles Income Property = Office, Retail, Apartment and Hotel % 2009-Present 34% 48% 6 DC: The WalkUp Wake-Up Call The George Washington University School of Business 2012
7 Form Meets Function Regionally significant WalkUPs will be the primary location of economic growth in metropolitan D.C. For most other U.S. metropolitan areas, regionally significant WalkUPs will also play a significant role in the future. In metropolitan areas, land use is functionally categorized as either regionally significant or local serving. Regionally significant places have concentrations of employment (export or base and regional employment), civic centers, institutions of higher education, major medical centers and regional retail, as well as cultural, entertainment and sports assets. Local-serving places are bedroom communities dominated by residential development that is complemented by local serving commercial and civic uses, such as primary and secondary schools, police and fire stations, and so on. Generally speaking, regionally significant places are where the metropolitan area earns its living while local-serving places are where people spend their non-work lives. When form meets function, a simple matrix emerges that show how 100 percent of a metropolitan area s land is used. This research focuses on the upper-left quadrant of the matrix: regionally significant WalkUPs (referred to U.S. Metropolitan Land Use Options Regionally SignificanT Local Serving as simply WalkUPs below). WalkUPs are where metropolitan D.C. will build much of its wealth-creating assets. This research has found that WalkUPs, a niche market 20 years ago, are becoming the market of the future, both in the metro D.C. area and, likely, in the rest of the nation s metropolitan areas. Future research will focus on local-serving neighborhoods, represented by the top right cell of the matrix. For the District of Columbia, this means neighborhoods like Petworth, Brookland and Cleveland Park. Outside the District, examples include Shirlington and Falls Church, Virginia. In this research, the statistics for local-serving WalkUPs are combined with drivable sub-urban development since we have not yet separated them. Research on metropolitan D.C. s WalkUPs is based upon the 2012 Brookings Institution report, mentioned above, that developed a methodology to define WalkUPs (geographically and by product mix) and to rank them using separate economic and social equity performance metrics. The Brookings research statistically defined regional significance as having a minimum of 1.4 million square feet of office space and/or a minimum of 340,000 square feet of retail space. 5 These metrics were used to rank the WalkUPs that emerged from the research and to create four levels of economic and social equity performance. 6 WALKABLE URBAN DRIVABLE SUB-URBAN WalkUP (Walkable Urban Place) 1-2% of Metro Area Acreage Edge City 5-7% of Metro Area Acreage Neighborhood 3-7% of Metro Area Acreage Bedroom Community 80-85% of Metro Area Acreage Regionally significant and local serving WalkUPs are likely to be the major generators of real estate growth in the future. Although no fiscal impact analysis has yet been undertaken for the D.C.-area WalkUPs, their contribution to total government tax revenues in the region is expected to be many times the proportion of land they consume. In Arlington County, for example, the share of property tax assessments from the county s seven regionally significant WalkUPs is five times the amount of the land the WalkUPs occupy. 7 Fiscal impact studies throughout the country indicate that WalkUPs tend to produce a significant net surplus (tax revenues minus costs of service), subsidizing the local serving areas of the jurisdiction. 8 7


.")


8 WalkUPs Defined The 6 Types of WalkUPs There are six types of regionally significant WalkUPs in any metropolitan area. Metropolitan Washington is the only metro area that possesses an example of each. A 1 Downtown PHOTOS: Christopher Leaman C Examples: Downtown D.C. and Golden Triangle Downtown WalkUPs are the original downtown sections off a metro area s principal city. Downtown WalkUPs are dominated by office space (83 percent of total square footage) and have modest though fast-growing residential (6 percent). Only one percent of the space is occupied by retail, although one-of-a-kind regional assets (convention center, Verizon Center, museums, etc.) account for 10 percent of all space. H G A. The National Archives Building and Navy Memorial on Pennsylvania Ave. NW B. A quintessential Golden Triangle street scene C. Hines Interests office, residential and retail mixeduse project on the old convention center land; the last surface parking lot downtown to be redeveloped D. The Chinatown Friendship Gate at Gallery Place at 7th and H Sts. D B F E. Woolly Mammoth Theatre and new downtown office and residential at 7th and D Sts. NW F., G. & H. Golden Triangle food trucks at Farruget Square Product Mix: Downtown Average % of Total Square Footage E For-SalE Housing: 3% ApartmenT Rental: 3% Retail: 1% Office: 83% 8 DC: The WalkUp Wake-Up Call The George Washington University School of Business 2012


, but they also")
.")


9 B C D E A 2 Downtown Adjacent Examples: Capitol Hill, Capitol Riverfront, Dupont Circle, Foggy Bottom/West End, Logan Circle, NoMA and SW Federal Area G F Immediately adjacent to downtown, these WalkUPs usually have a lower density than downtown and possess unique character. Downtown Adjacent WalkUPs have a substantial amount of office space (58 percent), but they also have significant residential (24 percent) and four times the relative retail of downtown (4 percent). The result is generally a lively, 24-hour environment. PHOTOS: Christopher Leaman A. & B. Waterfront sculpture and fountains at Yards Park in Capitol Riverfront C. & D. Dupont Circle park and fountain E. The Studio Theatre at 14th & P Sts. NW in Logan Circle F. & G. Victorian row houses in Logan Circle H. Free Wednesday night yoga in the park at Dupont Circle Product Mix: Downtown-Adjacent Average % of Total Square Footage H I I. Sweetgreen is among many new restaurants at the Foggy Bottom Metro Station at George Washington University J. Whole Foods at 14th & P Sts. NW For-SalE Housing: 16% Office: 58% ApartmenT Rental: 8% Retail: 4% J 9


 and less office space (20 percent) than downtown or")


10 WalkUPs Defined C A B 3 Urban Commercial Examples: Adams Morgan, Columbia Heights, Georgetown, H Street/Atlas District, Tenleytown, U Street/Shaw, Van Ness and Woodley Park Historically local-serving neighborhood commercial, these places declined after World War II but, in recent years, found a new economic role. Urban Commercial WalkUPs in metro D.C. are dominated by residential property (56 percent) and are marked by more retail (15 percent) and less office space (20 percent) than downtown or downtown adjacent. The retail in urban commercial WalkUPs is generally characterized as urban entertainment, such as restaurants and nightclubs, as well boutique shops and furniture and home décor stores. Product Mix: Urban Commercial Average % of Total Square Footage D F E PHOTOS: Christopher Leaman A. The Northern Exchange condominium under construction at 14th and R Sts. NW by developer PN Hoffman B. Recently opened Georgetown Waterfront Park C. The intersection of U St., 16th St. and New Hampshire Ave. NW D. Alley graffiti along U St. NW E. Georgetown Waterfront Park F. The Pug bar on H St. NE G. Pedestrian crossing in the U Street Corridor at 16th St. and New Hampshire Ave. NW H. & I. Georgetown retail on M St. NW Office: 20% For-SalE Housing: 43% Retail: 15% ApartmenT Rental: 13% G H I 10 DC: The WalkUp Wake-Up Call The George Washington University School of Business 2012


 and significantly more retail (16")


11 D E A 4 Suburban Town Center Examples: Bethesda, Clarendon, Frederick, Historic Fairfax City, Old Town Alexandria, Rockville, Rosslyn and Silver Spring B C Typical Suburban Town Centers are 18th or 19thcentury towns that were swept up in the sprawl of the metropolitan area after World War II. Following decades of decline, they have found a new economic role. Suburban Town Centers have relatively less office space than in downtowns or downtown adjacent areas (although offices still occupy 46 percent of all space), more residential (30 percent) and significantly more retail (16 percent). F PHOTOS: Christopher Leaman A. Park space in the mixed residential/commercial development at N. Edgewood St. and Clarendon Blvd. B. & C. Downtown Silver Spring D. Iced coffee from Northside Social Coffee and Wine E. Liberty Tavern on the corner of Wilson Blvd. and N. Irving St. Product Mix: Suburban Town Center Average % of Total Square Footage I G F. Sidewalk dining in Clarendon G. Single family neighborhood within walking distance of Clarendon H. Rental apartments under construction in Clarendon For-SalE Housing: 19% Office: 46% I. Pedestrian on Downtown Silver Spring s mosaic tile staircase ApartmenT Rental: 11% Retail: 16% H 11


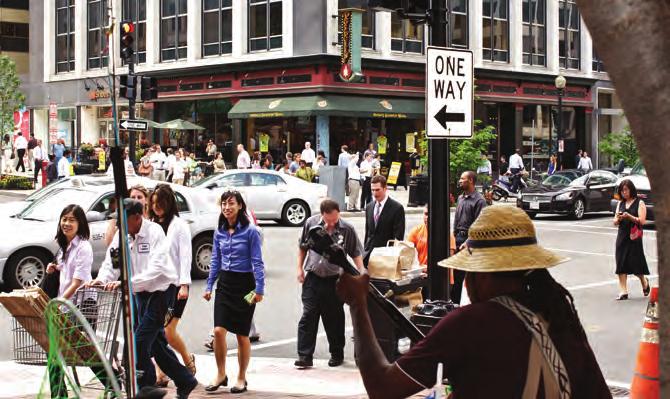
12 WalkUPs Defined A 5 Strip Commercial Redevelopment B PHOTOS: Christopher Leaman D C Examples: Annandale CDC, Bailey s Crossroads, Ballston, Carlyle, Courtthouse, Friendship Heights, New Carrollton, Pentagon City, Prince George s Plaza, Seven Corners CDC, Tysons Corner, Virginia Square, Wheaton and White Flint These WalkUPs were mid-to-late 20th century strip commercial that became obsolete and then evolved into higher density development. Somewhat similar to suburban town centers, Strip Commercial Redevelopment WalkUPs have relatively less office space than in downtowns or downtown adjacent areas (46 percent of all space), more residential (31 percent) and significantly more retail (16 percent). Many of these WalkUPs include regional malls that have been or will be urbanized. This type of of WalkUP will be the major focus of walkable urban development over the next generation. A. Street musician in Welburn Square in Ballston, Arlington B. Commuters on their way home in Ballston C. Commercial office space and Virginia Tech Research Center on N. Glebe Road in Ballston D., E., F. & G. Green space and farmers market in Welburn Square H. Walkway in Ballston at Stuart and 9th St. N E F Product Mix: Strip Commercial Redevelopment Average % of Total Square Footage H For-SalE Housing: 19% ApartmenT Rental: 12% Office: 46% Retail: 16% G 12 DC: The WalkUp Wake-Up Call The George Washington University School of Business 2012


, while retail (6 percent) tends to")


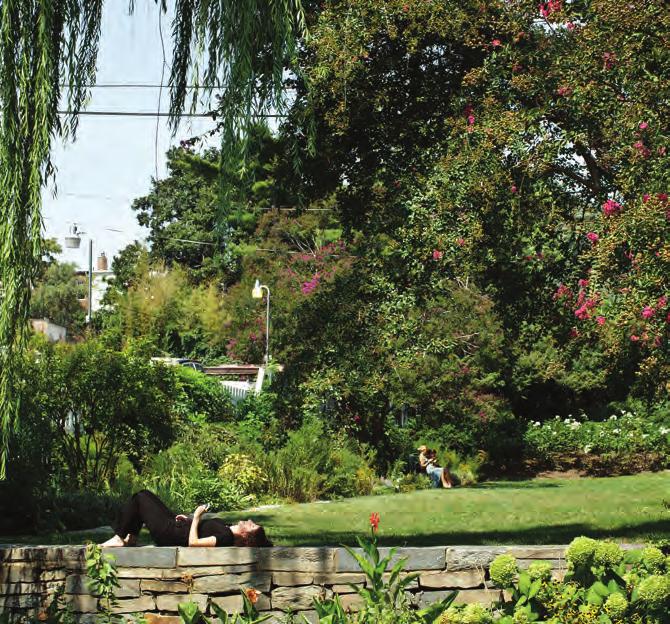
13 D A 6 Greenfield B Examples: Crystal City, Kentlands, National Harbor and Reston Town Center Often criticized as being sterile, Greenfield WalkUPs are situated where major investment has quickly turned formerly undeveloped land into a walkable urban place. Greenfield WalkUPs have among the most balanced product mix. Office (45 percent) is in balance with rental and for-sale residential (33 percent), while retail (6 percent) tends to be urban entertainment and boutiques. The large upfront capital costs required for Greenfield WalkUps and high market risk mean few will probably be attempted in the next generation. C F E PHOTOS: Christopher Leaman A. & B. The Marina at National Harbor C. The Awakening, an aluminum sculpture by J. Seward Johnson, Jr., was relocated to National Harbor from Hains Point D. Boutique retail along American Way E., F. & G. Retaurant and retail development at the American Way and Waterfront St. Product Mix: Greenfield Average % of Total Square Footage G J I H H. The intersection of Mariner Passage and Waterfront St. I. Gravel bike paths along the water s edge J. Rosa Mexicano on Waterfront St. For-SalE Housing: 17% Office: 45% ApartmenT Rental: 16% Retail: 6% 13

14 14 DC: The WalkUp Wake-Up Call The George Washington University School of Business 2012


15 III. WalkUPs in Metro D.C. 15
16 WalkUPs in Metro D.C. Frederick County 16 The 43 WalkUPs Though concentrated inside the Beltway, Metropolitan D.C. s regionally significant walkable urban places span seven counties. ID # WalkUP Name Acres 1 Adams Morgan Annandale Bailey s Crossroads Ballston Bethesda Capitol Hill Capitol Riverfront Carlyle Clarendon Columbia Heights Courthouse Crystal City Downtown DC Dupont Circle Foggy Bottom/West End Frederick Friendship Heights Georgetown Golden Triangle H Street/Atlas District Historic Fairfax City Kentlands ID # WalkUP Name Acres 23 Logan Circle National Harbor New Carrollton NoMA Old Town Alexandria Pentagon City Prince George's Plaza Reston Rockville Rosslyn Seven Corners CBC Silver Spring SW Federal Center Tenleytown Tysons Corner U Street/Shaw Van Ness Virginia Square Wheaton White Flint Woodley Park Loudoun County WalkUP Type: DOWNTOWN DOWNTOWN ADJACENT URBAN COMMERCIAL SUBURBAN TOWN CENTER STRIP COMMERCIAL REDEVELOPMENT GREENFIELD 30 Prince William County 16 DC: The WalkUp Wake-Up Call The George Washington University School of Business 2012
17 24 CANT WALKUPS Miles 31 Montgomery County Fairfax County Arlington County District of Columbia Prince George s County 2 Alexandria FICANT WALKUPS Miles 17
18 WalkUPs in Metro D.C. Geographic Findings Geography-focused distinctions from their size to their location define Metropolitan D.C. s WalkUPs. There were 43 regionally significant WalkUPs in metro D.C. in The amount of land in the metropolitan area used by these WalkUPs is.91 of 1.0 percent., and their size ranges from 62 to 2,176 acres with an average of 408 acres. Walking distance is what limits a WalkUP s size. The density of these WalkUPs averages 0.62 gross floor area ratio (FAR), 9 ranging from 0.13 to The gross FAR for the region, excluding these 43 walkable urban places, is only In other words, the regionally significant WalkUPs are 15 times denser than the rest of the region. The WalkUPs cluster in the northwest portion of the metropolitan area, which has been metro D.C. s favored quarter since at least World War II. 10 Some 34 percent of metropolitan jobs are located in WalkUPs. Overall, WalkUPs have an employment density of 50.5 jobs/acre, compared with non-walkups employment density of only 0.9 jobs/acre. About 65 percent of the region s jobs in public administration and 44 percent of its jobs in knowledge industries are in WalkUPs. Local-serving jobs (grocery clerks, teachers, police officers, firefighters and sanitation workers, etc.), which account for 35 percent of all jobs, are least likely to locate in WalkUPs. 11 Therefore, the share of export (or base) and regional jobs that are found in metro D.C. WalkUPs is probably closer to 50 percent. Since 2000, new WalkUPs have emerged in the District s northeast and southeast areas, especially along the Metro s Green Line. This brings more employment and opportunities closer to low-income households. Few other metropolitan areas are seeing regionally significant private sector investment outside their respective favored quarters. only 42 percent of the WalkUPs are in the District of Columbia. A surprising 58 percent are in the suburbs. The District of Columbia has 49 percent of the total square footage of all walkable urban real estate product versus 51 percent in the suburbs. The growth of new regionally significant WalkUPs in the suburbs over the past 20 years is the major reason why metropolitan D.C. has the most walkable urban places in the country. The trend toward WalkUPs is as much about transforming the suburbs as it is about redeveloping the central city. Thirty-three of the 43 regionally significant WalkUPs, or 77 percent, have rail transit or are currently installing rail transit. Two addition Walk- UPs (Reston Town Center and Bailey s Crossroads) have rail transit planned within the next decade, raising the total to 81 percent. Eight WalkUPs have no rail service and none planned. Statistically, there is no proven causal connection between rail transit and the development of walkable urban places. However, the high percentage of WalkUPs with rail suggests that it is an important factor. As the WalkUPs without rail demonstrate, however, it is possible to develop walkable urbanism without rail. There is about one regionally significant WalkUP for every 130,000 residents in metro D.C., the equivalent of seven to eight WalkUPs for every million residents (5.7 million residents in the metro area divided by 43 places). Assuming metropolitan D.C. is the model for how the country is developing the built environment, this would suggest that there are hundreds of regionally significant WalkUPs that should be developed in U.S. metro areas over the next generation. However, is too early to say with confidence that this formula will hold as the WalkUPs trend matures. In the 1960s, when regional malls were first being developed, there was similar uncertainty about the population needed to support each mall. 18 DC: The WalkUp Wake-Up Call The George Washington University School of Business 2012
19 Product Findings The strength of WalkUPs for many forms of income-producing real estate has become apparent. Office, hotel, rental residential and sports/convention development have each adapted to this form. However, retail and for-sale housing still face challenges. There are 4.1 billion square feet of real estate in metropolitan D.C. However, this figure notably omits owner-user space (i.e. government, corporate and institutional-owned space). That is because there is not a reliable data source for this type of real estate, though this might be addressed in the future. 12 The amount of space in regionally significant WalkUPs is 11.6 percent of the total. Income-producing property, which includes office, apartment, retail, institutional and all other non-for-sale real estate, totals 1.34 billion square feet and accounts for 33 percent of metro D.C. s income real estate. Again, this excludes owner-occupied space, which would certainly increase this percentage. WalkUPs account for 29 percent of all the income property in the region. The rest falls into the other cells of the matrix on page 7, namely regionally significant and local-serving drivable sub-urban and local-serving walkable urban. Income-producing real estate in WalkUPs varies between 2.4 percent and 60 percent of all space in the region. Again, the local serving WalkUPs, like Petworth in the District or Shirlington in Virginia, are not included in these numbers, so total WalkUP market share is higher. In order of lowest to highest, the percentage of income-producing WalkUPs by product square footage are: > Flex Industrial percent > Industrial percent > Heath Care percent > Institutional percent > Rental Residential percent > Retail percent > Hotel percent > Office percent > Sports/Convention percent For-sale residential (single family, townhouses and condominiums) account for 67 percent of all real estate in the region. Only 3 percent of this inventory is in WalkUPs. The rest is split between drivable sub-urban and local-serving WalkUPs, although it would seem that the majority would be in drivable sub-urban locations. Average vacancy-adjusted annual office rent in WalkUPs is $36.78 per square foot, compared to $20.98 for drivable sub-urban office rents, a 75 percent rental premium. Comparable data for 20 or 30 years ago is not available, but most real estate professionals would recall that drivable sub-urban rental rates had a significant premium over the few WalkUPs in existence in the 1980s. Those positions have switched, giving a significant market advantage to WalkUPs and indicating pent-up demand. Valuations of office space are significantly higher in WalkUPs. Annual office rental income in the region totals $13.6 billion; 68 percent of these rents are generated by regionally significant WalkUPs. Valuations are directly related to rental income and capitalization rates. Since cap rates tend to be substantially lower in WalkUPs, 13 which translates into higher valuations, combining the rent premiums and the lower cap rates results in an even higher percentage of metro area office valuations in WalkUPs. Among for-sale housing, per-square-foot values for regionally significant WalkUPs are 71 percent higher than the average of all other places in the D.C. metro area. WalkUps average price is $398 per square foot versus the drivable sub-urban average price of $222 per square foot. Once again, if local-serving walkable urban for-sale housing were combined with these regionally significant WalkUP housing results, the premium would probably be even larger. The 2012 Brookings research, which had a larger sample of drivable sub-urban for-sale housing, indicates that there is more than a 100 percent premium for WalkUPs over drivable sub-urban for-sale housing on a price per-square-foot basis. 19

20 20 DC: The WalkUp Wake-Up Call The George Washington University School of Business 2012

21 IV. WalkUP Trends 21
22 WalkUP Trends The Last Three Real Estate Cycles There are big questions facing developers, investors and public officials: What direction is the real estate market headed? Is it more drivable sub-urban or more walkable urban? Data covering the past three metro D.C. real estate cycles (1992 to 2000, 2001 to 2008, and 2009 to the present) make it possible to see where different real estate products have been built. Only data for office, retail, apartments and hotels for these three cycles is available. As mentioned, data is available only for regionally significant WalkUPs, the balance being both drivable sub-urban locations and local-serving WalkUPs. This data, therefore, understates the amount of walkable urban product developed during each cycle since local-serving WalkUPs are lumped in with drivable sub-urban. Real Estate Cycles Quantified The share of the four income property categories (office, retail, apartment and hotel) located in WalkUPs increased steadily over the past three real estate cycles. These four product types together accounted for 24 percent in the 1990s cycle, and rose to 34 percent in the 2000s cycle and 48 percent in the current cycle that started in Office space was the driver of the trend toward building more regionally significant walkable urban product. Some 38 percent of the office space delivered in the 1990s cycle was built in WalkUPs. This increased to 49 percent in the 2000s and to 59 percent in the current cycle that started in Rental apartment developers have begun to aggressively pursue walkable urban locations. In the 1990s, only 12 percent of the region s new rental apartment space was built in WalkUPs. In the early 2000s, this rose to 19 percent and has skyrocketed to 42 percent today. In addition, the volume of rental apartments in local-serving Walk- UPs has probably increased the walkable urban rental apartment market share considerably in recent years, as local-serving WalkUPs in Petworth and Mount Vernon show. Development of retail space lags. Only 8 percent of the retail space developed in the region in the 1990s was located in WalkUPs. For the early 2000s, it rose to 16 percent but has fallen to 13 percent for the cycle starting in The likely reason is that many, though not all, retail tenants have not yet figured out how to build walkable urban retail formats, particularly when it comes to big box stores. Many smaller specialty stores (Urban Outfitters, Brooks Brothers, etc.) and many grocery stores (Safeway, Harris Teeter, Whole Foods, etc.) have walkable urban formats. The big box retailers like Wal-Mart are just attempting walkable urban locations. Big box walkable urban pioneers, such as Target and Home Depot, only have five or so years experience with this format. Adding local serving WalkUPs to these product totals will probably significantly increase the percentage of retail that is walkable urban in the current cycle; many rental apartments over grocery stores are under construction in local-serving WalkUPs. Tysons Corner and White Flint, two of the new WalkUPs in metro D.C., are important models for the region and country. Both represent large strip commercial redevelopment WalkUP types and both were the poster children of edge city drivable sub-urban development in the late 20th century. They are significant for another reason: Many of the neighborhood associations surrounding these places became supporters of increased density because of the promised walkable urban future. NIMBYs (Not in My Backyard) became YIM- BYs (Yes In My Backyard). Tysons Corner is about to open four new Metrorail stations. Because of its size, Tysons Corner will likely be split into three, or even four, WalkUPs. Currently it covers 2,176 acres when the metropolitan average for a Walk- UP is 408 acres. Walkable urban development used to be a niche market. Today and in the future, it will be considered the market. This will become increasingly obvious once local-serving walkable urban development is folded into the analysis. 22 DC: The WalkUp Wake-Up Call The George Washington University School of Business 2012
23 Metro DC: A Model for the Country The nation s capital region, intertwined with the federal government and buffered from some recessionary effects, seems an unlikely national model for real estate development. But its signature characteristics include the elements needed to thrive in the current and future knowledge economy. Metropolitan Washington, D.C., is an improbable model for the future of the built environment. As the nation s capital, it benefits from a one-of-a-kind economic and employment base, namely the federal government, which has a recession-resistant foundation. The counter-argument for those who maintain that the presence of the federal government disqualifies the nation s capital from consideration as a model for the future of the built environment is that all metropolitan areas have a unique base economy. In Detroit, that industry is autos. In Seattle, it is aircraft and software. In Columbus, it is state government and insurance. Having a unique economic base cannot disqualify a metropolitan area from being the national model. In addition, metropolitan D.C. resembles other recent boomtowns. Like Dallas, Orlando and Atlanta, it is a southern metro that has been invaded by Yankees who fuel its population and boost its employment. Like Austin, Boston, San Francisco/San Jose and Raleigh, it has a notable technology sector. Metro D.C. also sprawled in a drivable sub-urban fashion in the late 20th century, just like all boomtowns, yielding arguably the worst traffic congestion in the country. Still, metropolitan D.C. sits near or at the top of surveys on walkability. According to a 2007 Brookings survey, the greater D.C. area has more WalkUPs per capita than any large metro area. Notably, metro D.C. s population holds more college degrees per capita than anywhere else in the nation. An educated populace the number of people over age 25 with college degrees is an indicator of the strength of the local knowledge economy. And knowledge workers want walkable urban options. Richard Florida, director of the Martin Prosperity Center at the University of Toronto School of Management and originator of the concept of the creative class, has most clearly demonstrated this connection. As Florida says in The Rise of the Creative Class Revisted, 14 the Creative Class is... the key force that is shaping our geography, spearheading the movement back from outlying areas to urban centers and close-in walkable suburbs. He quotes Carly Fiorina, then-ceo of Hewlett-Packard Co., as saying, Keep your tax incentives and highway interchanges; we will go to where highly skilled people are. Florida and this research demonstrate that most highly skilled, highly educated creative class workers want to work and live in walkable urban places. The creative class is driving the current and future knowledge economy and, in turn, driving the demand for walkable urban places. this population grew from 20 percent in 1990 to 28 percent in Putting aside the DC metro area, the next five most walkable large U.S. metropolitan areas have collegeeducated populations in 2010 that were equivalent to metro D.C. s in A plausible assumption can be made regarding education levels: that the next five most walkable metro areas are 20 years ahead of both the nation and the lowest five metro areas. Further, assume that metro D.C. is roughly 40 years ahead of the nation as a whole. It is possible that the country will follow the trajectory of the most walkable metro areas and metro D.C. over the next few decades. As education levels continue to increase and the country evolves further into the knowledge economy, the walkable urban trend will continue. Metro D.C. s population holds more college degrees per capita than anywhere else in the nation. An educated populace is an indicator of the strength of the local knowledge economy. And knowledge workers want walkable urban options. In short, Metropolitan Washington, D.C., can be used as a model for the future of the built environment because it is also the farthest along in adjusting to the demands of the knowledge economy and highly educated workers. The graph on the following page shows the growth in college-educated residents in the five least walkable large U.S. metros as well as the the nation as a whole; as illustrated in the chart, Also consider that in 1990, metro D.C. had few meaningful walkable urban areas. Its downtown like many city centers across the nation was abandoned and considered dangerous. No suburban-located walkable urban places had yet emerged, except for Old Town Alexandria and Rosslyn. When Joel Garreau wrote Edge City in 1989, the seminal book about the rise of drivable sub-urbanism, his prime example 23
24 WalkUP Trends was Tysons Corner in suburban Virginia. It was the world s largest drivable sub-urban concentration of commercial enterprises. Tysons is now on the path of becoming walkable urban. A rise in highly educated knowledge workers has powered the explosion in demand for and development of walkable urban places in metro D.C. and elsewhere. These highly educated creative class workers, especially the young Millennials (born between 1982 and 2004), want the option of living and working in walkable urban places. Since metro D.C. has relatively more of these workers than any other metropolitan area, it is not surprising that it leads the WalkUPs phenomenon. As these Millennials age, many seem to be moving to or near suburban Walk- UPs, such as Arlington. When it comes to developing suburban WalkUPs, metro D.C. has a substantial lead over all other U.S. areas. Development of WalkUPs is obviously not confined to metropolitan D.C., as the 2007 Brookings survey revealed. The Wall Street Journal has recenlty reported on numerous examples of corporate headquarters moving back into downtown Chicago and even downtown Detroit, as well as the rise of high-tech concentrations such as Silicon Alley in New York City and the growth of high-tech firms south of Market Street in San Francisco. 55% 50% 45% 40% 35% 30% 25% 20% Growth of College-Educated Population % of Adults 25 or Older in Select U.S. Metro Areas with at Least a Four-Year Degree D.C. s % of college educated adults is 20 years ahaead of the next 5 most walkable metro areas......and 40 years ahead of the nation as a whole and the 5 least walkable metro areas % COLLEGE EDUCATED IN: DC REGION NEXT 5 MOST WALKABLE METRO AREAS 5 LEAST WALKABLE METRO AREAS NATION PROJECTED % COLLEGE EDUCATED IN: NEXT 5 MOST WALKABLE METRO AREAS The trajectory for large metropolitan areas and the country as a whole is toward a better-educated population, the expansion of the knowledge economy and a growing demand for more walkable urban places. Metro D.C. just happened to get there first. 15% 10% NATION & 5 LEAST WALKABLE METRO AREAS 24 DC: The WalkUp Wake-Up Call The George Washington University School of Business 2012

25 V. WalkUP Rankings 25
26 WalkUP Rankings COPPER SILVER $50 Rents by Product Type GOLD PLATINUM Economic Rankings WalkUPs in Metro D.C. fall into four levels when measured by economic performance. Each WalkUP level has different growth and investment potential than the others. Rent (or Rent Equivalent) per Square Foot $40 $30 $20 $10 0 Office Retail Residential (Rental) Residential (Ownership) Overall COPPER SILVER GOLD PLATINUM These charts summarize the relative rent, Walk Score and FAR performance of the 42 WalkUPs (SW Federal Area was omitted due to data irregularities) by level. Each ranking is based upon the rents achieved for office, retail, rental apartment and for-sale housing (converted to the equivalent of annual rent). The average rent per square foot for the WalkUP was determined and weighted based upon the percentage of square feet per product type. The assumption is that the amount the market is willing and able to pay in rent is a proxy for the economic performance of the WalkUP. Rent is a proxy to be sure, but the best proxy we have at the moment. Walk Score Walk Score & FAR by Category FAR WALK SCORE GROSS FAR* *Floor Area Ratio, a Measure of Density COPPER SILVER GOLD PLATINUM 26 DC: The WalkUp Wake-Up Call The George Washington University School of Business 2012
27 COPPER Annandale Bailey s Crossroads Crystal City Frederick H Street NE/ Atlas District Historic Fairfax City Kentlands New Carrollton Prince George s Plaza Rockville Seven Corners CBC Silver Spring Tysons Corner Van Ness Wheaton White Flint CHARACTERISTICS The lowest level of economic performance, Copper WalkUPs have generally demonstrated the intention to be walkable urban. These places have decided to invest in transportation infrastructure, revised their zoning and sometimes introduced place management. However, they have not yet seen dramatic new walkable urban development and are not close to achieving critical mass. Some private investment in walkable urban projects may have begun but the Copper WalkUP may still be drivable sub-urban in nature or the redevelopment may be fledgling. The Copper level WalkUPs have the lowest rents, are the least dense and are the least walkable. Compared to the rest of the drivable sub-urban region, there is only a 4 percent price premium for office space in these WalkUPs over drivable sub-urban office space. However, for-sale housing prices are 13 percent higher, residential rental rates are 23 percent higher and retail rates are about 26 percent higher. OBSERVATIONS Copper WalkUPs Tysons Corner and White Flint are national models of strip commercial redevelopment. Both are at the Copper level since they have recently made or committed to make significant transit improvements, and both have dramatically increased and made legal walkable urban zoning. Tysons Corners, as the largest drivable sub-urban location in the country (with more than 42 million square feet), is about to open four Metro stations. Tysons covers 2,176 acres, nearly twice the acreage of the five Rosslyn-Ballston corridor WalkUPs (1,305 acres). There is no doubt that Tysons will evolve into at least three separate WalkUPs, each with its own character, density, product mix and performance, and place management. Some WalkUPs have achieved the Copper ranking without much conscious effort. Examples are Seven Corners, Bailey s Crossroads and Annandale, all in Fairfax County, Virginia, and Van Ness in the District of Columbia. While comprehensive plans have been proposed to transform these places into more vibrant WalkUPs, the character is still perceived as drivable sub-urban with little private/nonprofit sector-led effort to accelerate and manage these places. One notable exception may be Bailey s Crossroads, Average Key Metrics Walk Score: Acreage: Acres Gross FAR: 0.41 (Floor Area Ratio) Annual Rent per Sq. Ft. {$= $10} Office: RETAIL: APARTMENT: $21.82 $25.17 $22.02 Housing per Sq. Ft. {$= $10} FOR SALE HOUSING: $ Square Footage TOTAL: 9.3 million sq. ft. For-Sale Housing: 19% Apartment Rental: 12% Retail: 18% Office: 43% which will probably be served by the Columbia Pike streetcar a game-changing investment. An important Copper example is Silver Spring, especially when viewed with its social equity ranking (Platinum, the highest). Silver Spring walks the tightrope in attempting to achieve higher economic returns without gentrifying and detracting from its unique and diverse character. There are many potential WalkUPs waiting to move onto the WalkUP list. One that stands out is Potomac Yards in Alexandria. The proposed private sector-financed Metro station will mark the beginning of its transformation while the required greater density of zoning is now in place. This will spark the redevelopment of the existing big box center, anchored by Target and a multiplex cinema, into high density, mixed-use development, converting the current interim land uses into a WalkUP. Another potential WalkUP is the Minnesota Avenue Metro station area, which will emerge as the greater center city builds out over the next 10 to 20 years. Prince George s County has three WalkUPs listed as Copper (New Carrollton, Prince George s Plaza and National Harbor). There are others that could earn a place on the Copper list in the future, such as West Hyattsville, College Park, Naylor Road and Branch Avenue, the result of new development and place management. The key to the evolution of the new WalkUPs to the northeast and southeast is the expansion of the favored quarter. No metropolitan area in the country has witnessed substantial market-based employment growth outside the favored quarter. However, land and infrastructure constraints in metro D.C. s favored quarter have led to this tentative expansion, which currently includes WalkUPs such as NoMA, Capitol Waterfront, New Carrollton, Wheaton and Silver Spring. Metro D.C. growth outside the favored quarter is the first market-based bridging of the notorious west-east divide and is to be welcomed since it brings services and jobs where they are needed most. Still, it is important to recognize how unusual and tentative this trend is. To continue, it must be nurtured by infrastructure and zoning changes rather than by levying onerous costs or fees on future development. 27
28 WalkUP Rankings SILVER Adams Morgan Ballston Bethesda Carlyle Clarendon Columbia Heights Courthouse National Harbor Old Town Alexandria Pentagon City Reston Town Center Rosslyn U Street/Shaw Woodley Park CHARACTERISTICS Places in the Silver tier have the private development and, usually, the place management required to become a regionally significant WalkUP, but critical mass has not yet been achieved although it is obvious it eventually will. Silver WalkUPs have the greatest value-creation potential for investors and developers. While they may still have an image as being somewhat economically risky, as evidenced by their high capitalization rates and relatively lower valuations, this will likely be improved with more development and place management. The result will be lower capitalization rates and, therefore, higher valuations as they move into the Gold tier. Silver WalkUPs have 44 percent higher rents and are 53 percent more dense than Copper WalkUPs. They achieve a nine point higher Walk Score on average. OBSERVATIONS Each Silver WalkUP took a different path to reach this level of economic performance. National Harbor and Reston Town Center are Greenfield WalkUPs, which can suffer from feeling sterile. However, all have made remarkable strides in creating walkable urban vibrancy for specific target markets attracted to new development. Carlyle and Pentagon City have been strip commercial redevelopment WalkUPs, taking advantage of either federal government or regional mall anchors at their Metro stations. Average Key Metrics Walk Score: Acreage: Acres Gross FAR: 0.63 (Floor Area Ratio) Annual Rent per Sq. Ft. {$= $10} Office: RETAIL: APARTMENT: $33.01 $37.25 $28.93 Housing per Sq. Ft. {$= $10} FOR SALE HOUSING: $ Square Footage TOTAL: 8.6 million sq. ft. For-Sale Housing: 25% Office: 40% Its major drawback is a lack of rail transit. Columbia Heights is a national model of urban commercial WalkUP redevelopment, focusing on regional retail while maintaining a diverse, mixed-income community. Many of Arlington s WalkUPs are in the Silver tier. Arlington has more WalkUPs per capita than any jurisdiction in the country and is the suburban model of walkable urban development. Bethesda barely missed a Gold ranking. The redevelopment of the area adjacent to the south of the Metro station has been a national model, as has its place management. The Woodmont Triangle is where the future of opportunity exists. The lack of private/nonprofit place management is a concern for future economic progress in Old Town, Carlyle, Pentagon City and Columbia Heights. Adams Morgan has successfully implemented an urban entertainment strategy, but it has possibly leveled off in performance, unable to broaden this strategy. Old Town Alexandria has leveraged its historic character, innate urban character, tourism and arts. Apartment Rental: 15% Retail: 10% 28 DC: The WalkUp Wake-Up Call The George Washington University School of Business 2012
29 GOLD Capitol Hill Capitol Riverfront Dupont Circle Friendship Heights Logan Circle NoMA Tenleytown Virginia Square CHARACTERISTICS Gold WalkUPs have achieved critical mass; there is a there-there. Investors recognize this by lowering capitalization rates (increasing valuations). Land prices are at a premium, reflecting the higher rents and selling prices per-square-foot that have been achieved. Developers are attracted to Gold WalkUPs since the market risk is low and there are relatively assured exit strategies for selling stabilized projects to institutional investors. Average rents for Gold WalkUPs are 19 percent higher than those of Silver WalkUPs, although their Walk Score and density are similar. Gold Walk- UPs for-sale housing prices are twice the drivable sub-urban average in the metro area, though only 10 percent higher than Silver for-sale housing prices. Two factors stand out in the economic performance of these WalkUPs. One is that most have aggressive place management, mainly nonprofit BIDs, although there are public sector exceptions. The other factor is described in the Brookings Walk This Way research: Average Key Metrics Walk Score: Acreage: Acres Gross FAR: 0.62 (Floor Area Ratio) Annual Rent per Sq. Ft. {$= $10} Office: RETAIL: APARTMENT: $39.29 $42.82 $35.74 Housing per Sq. Ft. {$= $10} FOR SALE HOUSING: $ OBSERVATIONS There are a number of WalkUPs that do not have active place management but still have achieved Gold ranking. This is more a matter of having been dealt a good hand by the market. Dupont Circle was the first WalkUP to emerge after the walkable urban decline of the late 20th century. It was built in the former luxury mansion district, Embassy Row, and benefited from early reinvestment by the gay community now recognized as an urban pioneering demographic. Still, competition from well-managed competitive WalkUPs could derail the economic success of these unmanaged WalkUPs. Dupont, in particular, could be vulnerable to its fat, dumb and happy approach to place management. For example, there are no plans to have streetcars the region s major rail transit investment in the early 21st century to connect Dupont to the rest of the WalkUPs in the District. That will be seen in retrospect as a major mistake. Walkable places benefit from being near other walkable places. On average, walkable neighborhoods in metropolitan Washington that cluster and form walkable districts exhibit higher rents and home values than stand-alone walkable places. Square Footage TOTAL: 8.1 million sq. ft. The greater center city of the District (the downtown, downtown adjacent and some of the urban commercial WalkUPs) have achieved Gold and even Platinum rankings as a result of clustering. The economic performance of both NoMA and Capitol Riverfront is particularly remarkable since they have only been in existence for one real estate cycle. For-Sale Housing: 25% Apartment Rental: 9% Retail: 8% Office: 46% 29

30 WalkUP Rankings PLATINUM Downtown D.C. Foggy Bottom/West End Georgetown Golden Triangle CHARACTERISTICS This exalted ranking has been achieved by only four of the 43 WalkUPs. All are in the District, which is remarkable considering that 30 years ago these places were viewed as secondary investment opportunities or worse. The Platinum ranking is the clearest indication that the walkable urban trend has revitalized the center city, particularly over the past 15 years, and reversed the relative economic performance of drivable sub-urban versus walkable urban places. Platinum WalkUPs predominantly are where large institutional owners, such as insurance companies, pension funds, sovereign wealth funds and REITs, have chosen to invest, resulting in the lowest capitalization rates and highest valuations and land prices. The Platinum WalkUPs have the highest rents, 19 percent above Gold. Office rents, retail rents, and housing prices (both rental and for-sale) are more than double those in drivable sub-urban areas. The average density is more than triple that of Gold WalkUPs and has substantially greater walkability over all competition. Average Key Metrics Walk Score: Acreage: Acres Gross FAR: 2.19 (Floor Area Ratio) Annual Rent per Sq. Ft. {$= $10} Office: RETAIL: APARTMENT: $43.67 $45.29 $40.68 Housing per Sq. Ft. {$= $10} FOR SALE HOUSING: $ OBSERVATIONS The four Platinum WalkUPs all benefit from being adjacent to other WalkUPs and, with the exception of Foggy Bottom/West End, from aggressive place management. They also have a preponderance of office space (78 percent of all space), which runs counter to the popular wisdom that a balanced portfolio of different product types is needed for optimal economic performance. Downtown and Golden Triangle combined form the actual downtown of the District of Columbia. The city core has regained its position as the region s premier business district, with rising office market share since 2004 (after more than 50 years of relative decline) and the region s highest rental rates and lowest vacancies. Foggy Bottom/West End has large wealthy institutions (The George Washington University, the World Bank, etc.) and is geographically situated between downtown and the other Platinum WalkUP, Georgetown. It is evolving into D.C. s Upper East Side. Much can still be accomplished, including re-establishment of downtown as a major retail concentration, continued growth in convention activity and, perhaps surprisingly, relocation of federal office space away from downtown. Square Footage TOTAL: 31.3 million sq. ft. For-SalE Housing: 5% Apartment Rental: 3% Retail: 3% Office: 78% Vacated federal space should be replaced by more walkable and vital private sector office, hotel, residential and retail. Downtown needed the federal presence to survive the downward spiral of the late 20th century, but portions should now decamp to new WalkUPs, including Copper and Silver. Relocation of the U.S. Dept. of Transportation and the U.S. Patent and Trademark Office to Capitol Riverfront and Carlyle, respectively, over the past decade demonstrates how effective this anchoring strategy can be. 30 DC: The WalkUp Wake-Up Call The George Washington University School of Business 2012
31 COPPER SILVER 80% Social Equity Measures by Category 80 GOLD 70% 70 HOUSING & TRANSPORTATION COSTS as a % of Area Median Income PLATINUM Social Equity Rankings 60% 50% 40% 30% 20% Diversity Index SHARE OF JOBS IN THE REGION Accessible in 90 Minutes DIVERSITY INDEX (2010) WalkUPs fall into the same four levels as the economic rankings, although driven by entirely different variables. 10% 0% COPPER SILVER GOLD PLATINUM 10 0 There has been no previous attempt at developing social equity performance rankings for WalkUPs. This ranking is, by its very nature, controversial. It is hoped that the release of these rankings will provoke lively discussion, further research and eventual consensus on how to measure social equity in walkable urban places. The methodology is controversial because there is disagreement over what is a positive societal good and what is a negative one. The word that best captures this in urbanism is gentrification. A new word, it first appeared in Webster s Collegiate Dictionary in 1964, defined as the process of renewal and rebuilding accompanying the influx of middle class or affluent people into deteriorating areas that often displaces earlier, usually poorer, residents. Gentrification is both a loved and hated word, depending on one s perception as to whether it brings about positive or negative social impacts. Still, gentrification can be an unequivocal force for good if it is harnessed to pay for social programs and public investment. In examining social equity, we looked at variables that are consistently available nationally. Those variables include these five: Household housing and transportation costs as a percentage of the metropolitan area median income. These are used to measure actual affordability since housing and transportation are intimately linked, especially if the household has to drive until you qualify. Relative weighting equal to 30 percent of total score. Unemployment rate, since a WalkUP s ability to provide jobs for people living within it is a basic component of social equity. Relative weighting equal to 20 percent of total score. Diversity Index, developed by ESRI, represents the likelihood that two persons, chosen at random from the same area, belong to different race or ethnic groups. Relative weighting equal to 15 percent of total score. Percentage change between whites and blacks, a proxy for gentrification with displacement of the African American population being a negative indicator, in the WalkUP between the 2000 Census and the 2010 Census. Relative weighting equal to 15 percent of total score. Share of jobs accessible by transit within 90 minutes from the WalkUP. Relative weighting equal to 20 percent of total score. 31
32 WalkUP Rankings COPPER Carlyle Frederick Georgetown H Street NE/ Atlas District Historic Fairfax City Kentlands Old Town Alexandria Tenleytown Average Key Metrics Housing & Transportation Costs: (As a % of median income for metropolitan D.C.) 56% Unemployment: 8.25% Diversity Index: Racial Change: 7.61% (Change in % of whites vs. blacks from 2000 to 2010) Job Accessibility: 44.92% (Share of jobs accessible by transit within 90 minutes) CHARACTERISTICS The lowest level of social equity, these eight WalkUPs have on average: The highest household housing and transportation costs of any WalkUPs (56 percent of average metro household income). As an average, this is significantly higher than the benchmark for neighborhood affordability established by the Center for Neighborhood Technology (45 percent); in the least affordable WalkUP, Georgetown, average housing and transportation is 84 percent of area median income, nearly double the national average. Higher than average unemployment (with three notable exceptions). The Lowest Diversity Index, meaning an individual is only 39 percent likely to come into contact with a person of a different ethnic background at random, compared to 53 percent for all WalkUPs. Copper WalkUPs have about the same Diversity Index as the average metropolitan area in the country (40 percent). An extreme shift in racial composition in many WalkUPs, such as H Street NE and, to a lesser extent, Frederick, with white residents representing a larger share of the population and black residents a smaller share. Uniformly poorer regional transit accessibility (six of the eight do not have rail transit availability) and the worst accessibility among WalkUPs to regional jobs. OBSERVATIONS Two WalkUPs that share much in common, Georgetown and Old Town Alexandria, are listed at the Copper level. They are the oldest, most historic, riverfront places (water orientation in real estate is exceedingly valuable) and have no rail transit. These common factors are partially responsible for the poor rankings. For example, it is expensive to buy land for affordable housing in these WalkUPs and their waterfront locations result in unstable geology, one of the reasons Metro tunnels were not built. The lack of rail transit accessibility affects other Copper WalkUPs. Being on the metropolitan fringe complicates accessibility in Kentlands, Frederick and Historic Fairfax City. H Street/Atlas District, the newly redeveloping WalkUP in northeast D.C. that seems to be replacing U Street/Shaw as the young urban entertainment area, achieved a surprise low ranking. The primary reason was the change from a predominantly black neighborhood to an integrated neighborhood. This highlights the difficulty in developing a social equity ranking system: An argument can be made on both sides of this issue about the societal benefit, or harm, of such a change. 32 DC: The WalkUp Wake-Up Call The George Washington University School of Business 2012
33 SILVER GOLD Capitol Hill Clarendon Downtown D.C. Friendship Heights New Carrollton Reston Town Center Tysons Corner U Street/Shaw Van Ness Woodley Park Average Key Metrics Housing & Transportation Costs: (As a % of median income for metropolitan D.C.) 44% Unemployment: 7.74% Diversity Index: Racial Change: 7.82% (Change in % of whites vs. blacks from 2000 to 2010) Job Accessibility: 60.35% (Share of jobs accessible by transit within 90 minutes) CHARACTERISTICS The second lowest level of social equity, these 10 WalkUPs have on average: The second highest household housing and transportation costs (44 percent of average metro household income) though substantially lower than Copper and, on average, just within the national average (45 percent). Downtown D.C. has the lowest percentage (30 percent) in the region, even lower than many households spend on housing by itself. Relatively low unemployment (7.7 percent). A somewhat higher Diversity Index (43 percent), though this was mainly due to two WalkUPs that are not diverse (Capitol Hill and Woodley Park). This ranking is only slightly better than U.S. metro areas overall (40 percent). Relatively unchanged racial composition between 2000 and 2010, with the notable exceptions of downtown D.C. and U Street/ Shaw, where the demographics shifted dramatically, with white residents representing a much larger share of the population mix and black residents a much smaller share. In contrast, over this period, Tysons Corner s population shifted significantly in the opposite direction, with white residents becoming a much smaller share and black residents a somewhat larger share. Substantially better regional transit accessibility to jobs than Copper WalkUPs, and accessibility comparable to Gold and Platinum level WalkUPs. This is primarily due to the fact that most have Metrorail stations. Adams Morgan Bailey s Crossroads Ballston Bethesda Columbia Heights Crystal City Dupont Circle Foggy Bottom/West End Logan Circle Prince George s Plaza Rockville Seven Corners Virginia Square White Flint Average Key Metrics Housing & Transportation Costs: (As a % of median income for metropolitan D.C.) 37% Unemployment: 8.31% Diversity Index: Racial Change: 7.05% (Change in % of whites vs. blacks from 2000 to 2010) Job Accessibility: 60.95% (Share of jobs accessible by transit within 90 minutes) CHARACTERISTICS The second highest level of social equity, these 14 WalkUPs have on average: Among the lowest housing and transportation household costs in the region (37 percent), substantially below those of Copper or Silver WalkUPs or the national average (45 percent). The presence of Metrorail in nearly all of these places is a significant factor in the lower average transportation costs. About the same unemployment rate as Silver WalkUPs. A substantially increased Diversity Index (62 percent) compared with Silver and Copper WalkUPs and the national metropolitan average (40 percent), although there are some low outliers, notably Dupont Circle and Foggy Bottom/West End. Relatively unchanged racial composition between 2000 and 2010, with, again, a few notable exceptions. In Logan Circle and Columbia Heights, white residents came to represent a much larger share of the population mix and black residents a much smaller share. There were similar, but less dramatic patterns in Adams Morgan and Prince George s Plaza, where significant declines in the Latino populations were also observed. In contrast, the white population of White Flint became much less dominant over this period as the Asian population increased dramatically. Substantially better regional transit accessibility to jobs than Copper WalkUPs and comparable to Silver and Platinum-level WalkUPs. This is primarily due to most places having Metrorail stations. 33
34 WalkUP Rankings PLATINUM Courthouse Rosslyn Silver Spring Wheaton CHARACTERISTICS The highest level of social equity, these four WalkUPs have on average: The same low level of housing and transportation costs as Gold WalkUPs (37 percent), substantially below the Copper and Silver WalkUPs as well as the national average. The lowest average unemployment rate (6 percent). The highest Diversity Index (72 percent) with particularly high ratings for Wheaton (the highest) and Silver Spring. Average Key Metrics Housing & Transportation Costs: (As a % of median income for metropolitan D.C.) Insignificant changes in their racial compositions between 2000 and 2010, with the exception of Silver Spring, in which the white population grew relative to the black population, which declined. Substantially better regional transit accessibility to jobs than the Copper WalkUPs and comparable to Silver and Platinum level WalkUPs. This is primarily due to most places having Metrorail stations. 37% Unemployment: 5.97% Diversity Index: Racial Change: 6.47% (Change in % of whites vs. blacks from 2000 to 2010) Job Accessibility: 62.18% (Share of jobs accessible by transit within 90 minutes) 34 DC: The WalkUp Wake-Up Call The George Washington University School of Business 2012

35 VI. Next Steps 35
36 Next Steps Conclusions & Recommendations The metropolitan landscape has never been systemically categorized by walkable urban versus drivable sub-urban. There is much to learn. Even this first glimpse reveals startling differences in economic and social equity performance. ECONOMIC CONCLUSIONS Increases in Average Key Metrics As the average Metro D.C. WalkUP s economic level moves from Copper to Silver, Silver to Gold, and Gold to Platinum, there are substantial increases in performance: Walk Score: points Office Rent: +$7.28/square foot annually Retail Rent: +$6.71/square foot annually Rental Apartment Rent: +$6.22/square foot annually For-Sale Housing Price: +$113.00/square foot Statistical analysis shows that there are three factors that explain 90 percent of the increased economic performance in the 43 metro DC WalkUPs. WALKABILITY By itself, Walk Score explains 67% of the increase in economic performance. As measured by Walk Score, a finding confirmed by the Brookings Walk This Way research. JOB DENSITY Adding jobs per acre to walkability explains 84% of the increase in economic performance. WORKFORCE EDUCATION Adding the number of workers with a college degree to walkability and job density explains 90% of the increase in economic performance. As measured by percentage of college-educated persons over 25 in the workforce living in a WalkUP. WalkUP place managers and investors/developers would improve their economic returns by increasing walkability, job density and the education levels of the work force. Note that simple subtraction of these three factors is not a correct way of understanding their individual impact since there is substantial overlapping co-variability. Investors and developers looking for new opportunities should understand these place characteristics before investing, matching their risk tolerance and the implicit market risk implied in these rankings, such as: Investing in a Copper WalkUP means that a long-term time frame is required to maximize returns, though entry prices are relatively modest. Place strategy and management for a Copper WalkUP is particularly important to ensure economic performance. Silver WalkUPs are prime for growth in the existing real estate cycle and there is an opportunity for this WalkUP to emerge with a Gold ranking, increasing returns substantially. Investing in Gold or Platinum WalkUPs is much less risky but the high price of entry reflects this. The upside of Platinum investments might be relatively less but will be more stable and, thus, attractive to institutional investors (insurance companies, pension funds, REITs, etc.). The public policy response to these market trends should be to encourage the economic growth and resulting fiscal benefits to each jurisdiction s revenue base. The first step needed to make this happen is to monitor the increasing economic performance of WalkUPs so as to understand the fiscal impact on government revenues. The second step is to make sure the zoning is in place and the proper infrastructure is planned and financed in order to make the place more walkable, to increase its job density and to attract an educated workforce. Copper and Silver WalkUPs may require special attention from the jurisdiction via investment in quality of life improvements (as opposed to subsidies for corporate relocation or developer incentives). However, long-term public sector investments in specific projects, as opposed to upfront subsidies, are more appropriate. A public investment approach helps a project get financing as productively as a subsidy, but it also carries a hoped-for return of capital, plus profit from the investment, that the government can then re-invest. Gold and Platinum WalkUPs need little in the way of special public financing programs. For example, there is no reason to provide incentives for Platinum 36 DC: The WalkUp Wake-Up Call The George Washington University School of Business 2012
37 places like Georgetown. In fact, there is the possibility of engaging in value capture where sharing the private sector upside returns from public improvements, say a street car line, could help fund those public investments or social programs like affordable housing. Basically this is a private sector Tax-Increment Financing (TIF) program. SOCIAL EQUITY CONCLUSIONS Since there is no agreed upon measure of social equity, it has been somewhat like discussing the weather. Everybody talks about it, but there is little that can be done about it. Eventually, agreement on a social equity performance metric will allow for more effective management. If you cannot measure, you cannot manage. Virginia Square were double Gold while Foggy Bottom/West End scored Platinum/Gold. All are older WalkUPs with many smaller buildings, ranging from modest to the very highest rents or sales prices although this could just be part of the evolution from partially affordable to completely gentrified. What is needed is a conscious strategy for each WalkUP to create and maintain affordable and workforce housing, as well as to increase accessibility. Having social equity measures will provide place managers and their jurisdictions with goals to which they can aspire. Implementation of the social equity goals should be the responsibility of the place management organization and part of its charter granted by the local jurisdiction. However, the second reason is land values. In Dupont Circle, the land cost as a percentage of the house is at least 50 percent. That compares with most drivable sub-urban housing, where it is 20 percent. The shortage of walkable urban residential land, especially for townhouses and small lot single-family housing, is driving up land prices. This makes no sense in the United States since we have no shortage of land. What we do not have is enough walkable urban land. Public policy that creates more in-fill residential land (brownfield, rezoned, assembling small parcels, knocking down obsolete uses, etc.) is the most crucial way to address social equity concerns. NIMBY opposition to high-density development One obvious conclusion is that increased economic performance leads to lower social equity outcomes. Georgetown epitomizes this with a Platinum economic ranking and a Copper social equity ranking. Golden Triangle has taken care of this issue by gerrymandering so as to have almost no one living within its boundaries, making it difficult to measure social equity. One obvious conclusion is that increased economic performance leads to lower social equity outcomes. Georgetown epitomizes this with a Platinum economic ranking and a Copper social equity ranking. On the other hand, WalkUPs with high social equity have lower economic performance. Two Platinum social equity WalkUPs, Silver Spring and Wheaton, had Copper economic rankings. The other two Platinum social equity places, Rosslyn and Courthouse, had Silver economic rankings. There are lessons from those WalkUPs that do well on both measures. Dupont Circle, Logan Circle, and The ultimate solution to affordable housing is to build more walkable urban product. There are two reasons why walkable urban housing costs more than the drivable sub-urban product. The first is the quality of construction. It must be higher quality for walkable urban product (better foundations, serious architecture, buildings right up to the sidewalk, etc.). Most people compensate for this additional cost by occupying a smaller amount of space. is equally responsible for the land shortage. An education campaign must be undertaken to turn the opposition into YIMBYs, such as happened in Tysons Corner and White Flint. Given a growing understanding of how economically successful WalkUPs can be, we must figure out how to take advantage of this rising tide of economic activity to pay for social equity performance. 37
38 Next Steps Social Equity vs. Economic Rankings Scatterplot Showing the Distribution of the Metro D.C. WalkUPs on Both Economic and Social Equity Rankings COPPER Economic Rankings SILVER GOLD PLATINUM COPPER SILVER GOLD PLATINUM Social Equity Rankings 38 DC: The WalkUp Wake-Up Call The George Washington University School of Business 2012
39 Further Study No research report would be complete without the obligatory more research needs to be done. This is particularly the case with WalkUPs research. There are a number of areas that require expanded research: This research focused on regionally significant WalkUPs. Local-serving WalkUPs, walkable urban bedroom communities, need to be quantified and better understood. This research is a snapshot in time (early 2012) but longitudinal research will help understand what actions are needed to improve economic and social equity performance over time. Comparisons to other metropolitan areas will provide insights into how this market trend is unfolding as well as a larger universe of the six different types of WalkUps from which to learn how to improve performance. measures have come down as far as metropolitan areas. It is time to push this gold standard of economic performance measurement to the WalkUP level. Social equity measures need to be refined. There are clear and agreed-upon definitions of affordable and workforce housing, but there is no agreed-upon measure of social equity. economic growth, quality of life and social equity. Regionally significant and local-serving WalkUPs, although likely to be located on less than 10 percent of the land in any region, could house most of the population growth and spur economic development for the next generation. WalkUPs will provide a foundation for the regional and national economy. More knowledge about this trend will propel how Americans invest in the largest asset class in the economy, an investment that directly influences economic growth, quality of life and social equity. Optimal product mix in a WalkUP is a much-debated topic in urban circles. How much retail or housing is best for economic or social equity performance? The urbanism field contains many opinions about the optimal product mix but few measurable principles. There is need to quantify the illusive concept of critical mass, colloquially referred to (using Gertrude Stein s masterful phrase) as having a there-there. We can feel when a place is at critical mass but this feeling has not been quantified. The expansion of the favored quarter to the northeast and southeast in metro D.C. is a major social and economic change that needs to be better understood. What can be done to encourage this positive market trend? The economic measures should include development of a GDP measure for a WalkUP. GDP There needs to be a determination of fiscal returns resulting from government investment in infrastructure and operating programs. The measurement of additional government revenues resulting from these investments should be calculated continuously, just as the private sector does. Since the economic returns of public sector investments tend to accrue to the private sector, we need to understand more about the potential of value capture. These private sector, TIF-like, arrangements can help pay for infrastructure and social programs. The maturity of walkable urban development in metropolitan Washington makes it a model for the nation. More knowledge about this trend will propel how Americans invest in the largest asset class in the economy, an investment that directly influences Yet the creation of economically successful WalkUPs with high social equity is a huge challenge, possible the largest domestic challenge U.S. society currently faces. This research shows that economic success tends to lead to lower social equity performance. Many citizens would like to see high economic and social equity performance. This is the dual goal that urbanism must embrace. 39


40 40 DC: The WalkUp Wake-Up Call The George Washington University School of Business 2012VI. Appendices
Ranking Walkable Urbanism in America s Largest Metros
 Ranking Walkable Urbanism in America s Largest Metros The Largest 30 Metros in the United States SHARE OF U.S. POPULATION SHARE OF U.S. GDP 54% 46% 42% 58% LARGEST 30 METROS REST OF U.S. The Old Dichotomy
The Brookings Institution Metropolitan Policy Program
 The Brookings Institution Metropolitan Policy Program The Structural Shift in Building The Built Environment The Next American Dream for the 21 st Century Economy The Brookings Institution Metropolitan
Integrating Community Development and Transportation Strategies. November 13, 2014
 R-B CORRIDOR 1970 R-B CORRIDOR TODAY Integrating Community Development and Transportation Strategies November 13, 2014 The Community Development Transportation Question Can communities support increased
Ranking Walkable Urbanism in America s Largest Metros. By Christopher B. Leinberger & Patrick Lynch
 Ranking Walkable Urbanism in America s Largest Metros By Christopher B. Leinberger & Patrick Lynch The George Washington University School of Business 1 The Center for Real Estate and Urban Analysis Table
FY Transportation Capital Improvement Plan Update Arlington Committee for Transportation Choices
 FY 2017-2026 Transportation Capital Improvement Plan Update Arlington Committee for Transportation Choices November 1, 2017 Forecasted Growth Arlington continues to grow with a shift towards multi-family
Detroit Metromode. From Suburban To Urban RELATED IMAGES KIM NORTH SHINE THURSDAY, DECEMBER 01, 2011 CHRISTOPHER B. LEINBERGER
 Detroit Metromode From Suburban To Urban KIM NORTH SHINE THURSDAY, DECEMBER 01, 2011 RELATED IMAGES CHRISTOPHER B. LEINBERGER ENLARGE ENLARGE ENLARGE ENLARGE RELATED TAGS DEVELOPMENT, DOWNTOWN DEVELOPMENT,GOVERNMENT,
University of Michigan & Urban Land Institute Real Estate Forum. Mary Beth Graebert Michigan State University
 University of Michigan & Urban Land Institute Real Estate Forum Mary Beth Graebert Michigan State University November 20, 2013 Michigan State University Land Policy Institute Strong focus on research and
Future of Housing Trends and the Housing Market Demographic Waves in the Region and Future of Housing. Illinois Finance Forum January 25, 2019
 Future of Housing Trends and the Housing Market Demographic Waves in the Region and Future of Housing Illinois Finance Forum January 25, 2019 Millions OUR STATE S POPULATION 2000-2017 13.0 12.4 M 12.9
ITEM 7 Action April 19, 2017 Approval of Regional Bike to Work Day 2017 Proclamation. None
 ITEM 7 Action April 19, 2017 Approval of Regional Bike to Work Day 2017 Proclamation Staff Recommendation: Approve the Bike to Work Day 2017 Proclamation. Issues: Background: None In an effort to increase
PERFORMANCE ANALYSIS of The Draft 2015 CLRP
 Item 9 PERFORMANCE ANALYSIS of The Draft CLRP Presentation to the Transportation Planning Board September 16, CLRP Performance Analysis 1 What is the Long-Range Transportation Plan (CLRP)? The CLRP identifies
The WalkUP Wake-Up Call: Atlanta. By Christopher B. Leinberger Mason Austin. The George Washington University School of Business
 The WalkUP Wake-Up Call: Atlanta By Christopher B. Leinberger Mason Austin The George Washington University School of Business 1 The Center for Real Estate and Urban Analysis Table of Contents I. EXECUTIVE
Tourists simply won t go to a city or town that has lost its soul. Arthur Frommer
 Among cities and towns with no particular recreational appeal, those that preserve the past continue to enjoy tourism. Those that haven t receive almost no tourism at all. Tourists simply won t go to a
APPENDIX E BIKEWAY PRIORITIZATION METHODOLOGY
 APPENDIX E BIKEWAY PRIORITIZATION METHODOLOGY INTRODUCTION The network of bikeways recommended in the Bicycle Master Plan is extensive and is likely to be only partially completed during the 25-year life
The Brookings Institution
 The Brookings Institution Metropolitan Policy Program Expanding on Revitalization The East-West Corridor in Atlanta Walkable Urban Places are Different Must Have a Strategy & Be Managed to Succeed Each
Planning for Economic and Fiscal Health
 Planning for Economic and Fiscal Health Christopher Zimmerman Vice President for Economic Development Cheyenne, Wyoming April 21, 2015 2 Planning for Economic and Fiscal Health The pattern of development
Proposed White Flint Separated Bike Lane Network September 2015
 Proposed White Flint Separated Bike Lane Network September 2015 Abstract This report includes a proposed separated bike lane network for the White Flint Sector Plan area. Separated bike lanes create a
Rochester Area Bike Sharing Program Study
 roc bike share Rochester Area Bike Sharing Program Study Executive Summary ~ January 2015 JANUARY 2015 8484 Georgia Avenue, Suite 800 Silver Spring, MD 20910 3495 Winton Pl., Bldg E, Suite 110 Rochester,
Location Matters: Where America Is Moving
 Location Matters: Where America Is Moving Nearly half of all American households plan to move at some point in the future. While some will move for a larger or nicer home, or perhaps to purchase a home
ABOUT THE PROJECT. DOWNTOWN WEST Transportation Planning Study. Pennsylvania Ave. NW: H Street NW: Farragut. K St. NW. North. I St.
 ABOUT THE PROJECT Downtown West seeks to improve east-west travel for pedestrians and cyclists on Pennsylvania Avenue NW and persons using public transit along H and I Streets NW. K St. NW North I St.
THE MOST INFORMATIVE EVENT COVERING REAL ESTATE INVESTMENTS
 THE MOST INFORMATIVE EVENT COVERING REAL ESTATE INVESTMENTS 2014 U.S. Economic, Capital Markets, and Retail Market Overview and Outlook Retail Trends 2014 U.S. Economic Overview and Outlook Total Employment
Public Opinion about Transportation Issues in Northern Virginia A Report Prepared for the:
 Public Opinion about Transportation Issues in Northern Virginia A Report Prepared for the: Northern Virginia Transportation Authority By QSA Research & Strategy October 13, 2005 TABLE OF CONTENTS Page
Capital and Strategic Planning Committee. Item III - B. April 12, WMATA s Transit-Oriented Development Objectives
 Capital and Strategic Planning Committee Item III - B April 12, 2018 WMATA s Transit-Oriented Development Objectives Page 24 of 76 Washington Metropolitan Area Transit Authority Board Action/Information
Transportation. Pages E-3 to E-145 PROPOSED FY CAPITAL IMPROVEMENT PLAN (CIP) CCCRC Presentation Thursday, June 14, 2018
 CCCRC Presentation Thursday, June 14, 2018") PROPOSED FY 2019-2028 CAPITAL IMPROVEMENT PLAN (CIP) Pages E-3 to E-145 CCCRC Presentation Thursday, June 14, 2018 in the CIP Continues Arlington s commitment to a transportation system that expands travel
PROPOSED FY 2019-2028 CAPITAL IMPROVEMENT PLAN (CIP) Pages E-3 to E-145 CCCRC Presentation Thursday, June 14, 2018 in the CIP Continues Arlington s commitment to a transportation system that expands travel
Public Transport and Development: Making It Work
 Public Transport and Development: Making It Work Robert T. Dunphy Urban Land Institute World Bank Transport Forum 2006 March 28, 2006 Transportation Development Disconnect Now Few Then places w/o car Many
Walkable Retail: When Old Becomes New Again Part 1
 Walkable Retail: When Old Becomes New Again Part 1 By Erin Talkington, Vice President, and Jacob Ross, Associate You have probably read the following headline thousands of times, perhaps this year alone:
TRANSIT PERFORMANCE IN THE I-66 INSIDE THE BELTWAY CORRIDOR
 TRANSIT PERFORMANCE IN THE I-66 INSIDE THE BELTWAY CORRIDOR June 2018 This report summarizes the performance of public transportation systems serving the I-66 inside the Beltway corridor in Northern Virginia.
Smart Growth: Residents Social and Psychological Benefits, Costs and Design Barbara Brown
 Smart Growth: Residents Social and Psychological Benefits, Costs and Design Barbara Brown By Scott Siedor 11 At the invitation of the Goodwin-Niering Center for the Environment, Barbara Brown came to Connecticut
Rock Spring Kick-Off Meeting 09/01/15 Walter Johnson High School Break Out Table Summaries. Rock Spring Break Out Table Comments. Table 1: Strengths:
 Rock Spring Break Out Table Comments Table 1: Strengths: Trees, open areas 1 Medical Care, Offices Parking at Medical important Mall access Good access to emergency services/police/ambulance/fire Weaknesses:
Community Improvement Plans: Creating walkable and liveable communities that support local business
 Community Improvement Plans: Creating walkable and liveable communities that support local business Kate Hall Program Manager ~ WALK Friendly Ontario Canada Walks, Green Communities Canada khall@greencommunitiescanada.org
CAPITOL CROSSING / 200 & 250 MASSACHUSETTS AVE NW / WASHINGTON, DC
 CAPITOL CROSSING / 200 & 250 MASSACHUSETTS AVE NW / WASHINGTON, DC Palisades American University Park Spring Valley Foxhall Wesley Heights Friendship Heights Tenleytown Cathedral Heights Glover Park Georgetown
summary of issues and opportunities
 1 summary of issues and opportunities EXECUTIVE SUMMARY CHAPTER 2: HISTORY - 3: LAND USE This first chapter is an overview of lessons learned from analysis of the existing conditions on El Camino as well
Cherry Creek Transportation and Land Use Forum September 25, 2013 Meeting Summary
 Cherry Creek Transportation and Land Use Forum September 25, 2013 Meeting Summary I. LEAD-IN TO SMALL GROUP DISCUSSION, POLLING AND STEERING COMMITTEE/TECHNICAL TASK FORCE DISCUSSION The meeting began
MONTGOMERY COUNTY PLANNING DEPARTMENT THE MARYLAND-NATIONAL CAPITAL PARK AND PLANNING COMMISSION
 MONTGOMERY COUNTY PLANNING DEPARTMENT THE MARYLAND-NATIONAL CAPITAL PARK AND PLANNING COMMISSION MCPB Item No. 5 Date: 12/3/15 Draft White Flint Separated Bike Lanes Network David Anspacher, Functional
WHERE ARE ARIZONA DEMOGRAPHICS TAKING US? HOW GROWING SLOWER, OLDER AND MORE DIVERSE AFFECTS REAL ESTATE
 WHERE ARE ARIZONA DEMOGRAPHICS TAKING US? HOW GROWING SLOWER, OLDER AND MORE DIVERSE AFFECTS REAL ESTATE March 2017 Tom Rex Office of the University Economist and Center for Competitiveness and Prosperity
Arlington County 10-Year Transit Development Plan & Premium Transit Network Briefing. May 2016
 Arlington County 10-Year Transit Development Plan & Premium Transit Network Briefing May 2016 Overview 10-Year Transit Development Plan Premium Transit Network Columbia Pike service concept Premium amenities
Walkability. The Pathway to Atlanta s Future Growth April 19, 2017
 Walkability The Pathway to Atlanta s Future Growth April 19, 2017 1 Walkability The Pathway to Atlanta s Future Growth This report was prepared by the ULI Atlanta s Livable Communities Council Working
THE BLUE SKY REPORT A KERRIGAN QUARTERLY. Third Quarter 2018 December 2018
 THE BLUE SKY REPORT A KERRIGAN QUARTERLY Third Quarter 2018 December 2018 Contact Erin Kerrigan: (949) 439-6768 erin@kerriganadvisors.com Contact Ryan Kerrigan: (949) 728-8849 ryan@kerriganadvisors.com
Development of Arlington County s Marked Crosswalk Guidelines. Jon Lawler, P.E. Design Engineer Arlington County, VA
 Development of Arlington County s Marked Crosswalk Guidelines Jon Lawler, P.E. Design Engineer Arlington County, VA April 13, 2015 Transportation System Users Residents Estimated 215,000 in 2014 Lowest
About the Active Transportation Alliance
 About the Active Transportation Alliance Chicagoland s voice for better biking, walking and transit Founded 1985 7,000 members, ~33 full time staff Serve Chicago metro region 1 More Cars, More Driving
What if YOU could help plan Northern Virginia s transportation future?
 What if YOU could help plan Northern Virginia s transportation future? Photo credits: Washington Metropolitan Area Transit Authority And improve the quality of life in your community -- for yourself, your
Preview. Second midterm Tables in your paper Mass Transit as alternative to auto California s problems in urban transportation
 Preview Second midterm Tables in your paper Mass Transit as alternative to auto California s problems in urban transportation Score Distribution 1 st Midterm 2 nd Midterm 3.5-4.0 8% 21% 3.0-3.5 23% 34%
Community & Transportation Preferences Survey
 Community & Transportation Preferences Survey Webinar: August 5, 2015 Hugh Morris, AICP, LEED Realtor.org Jennifer Dill, Ph.D. trec.pdx.edu 1 Introduction National Association of Realtors Over 1,000,000
Public Opinion about Transportation Issues in Northern Virginia
 Public Opinion about Transportation Issues in Northern Virginia Research and Strategy Presented to: The Northern Virginia Transportation Authority July 28, 2005 Research Objectives 1. Travel Patterns*
Healthy Corridors. Ed McMahon Urban Land Institute Nashville, TN
 Healthy Corridors Ed McMahon Urban Land Institute Nashville, TN What s Wrong with this Corridor? Ugly Unsafe Unhealthy Unwalkable Under performing Un-Connected Why Are Corridors Unhealthy? Safety Lots
Fixed Guideway Transit Outcomes on Rents, Jobs, and People and Housing
 Fixed Guideway Transit Outcomes on Rents, Jobs, and People and Housing Arthur C. Nelson, Ph.D., ASCE, FAICP Professor of Planning and Real Estate Development University of Arizona 1 Changing Transportation
BRIEFING ON PROPOSED ADDITIONS AND CHANGES Additions and Changes to Projects Proposed for Inclusion in the 2015 CLRP Update
 BRIEFING ON PROPOSED ADDITIONS AND CHANGES Additions and Changes to Projects Proposed for Inclusion in the 2015 CLRP Update January 23, 2015 Travel Forecasting Subcommittee What is the CLRP? Federally
Characteristics from these programs were used to compare to and evaluate existing conditions in Howard County.
 EXECUTIVE SUMMARY Bike share is a mobility option that allows users to access a fleet of public bicycles throughout a community. Bike share systems have successfully been implemented in communities throughout
CITY OF ALPHARETTA DOWNTOWN MASTER PLAN TRAFFIC EVALUATION
 CITY OF ALPHARETTA DOWNTOWN MASTER PLAN TRAFFIC EVALUATION June 2015 CITY OF ALPHARETTA DOWNTOWN MASTER PLAN TRAFFIC EVALUATION Introduction The Alpharetta Downtown Master Plan was developed in the fall
7 NE 145TH STREET STATION TOD POTENTIAL
 7 NE 145TH STREET STATION TOD POTENTIAL Key Findings The 145th Street Station area has limited TOD potential, primarily because of its location in an area that is currently zoned predominantly single-family
BUILDING THE CASE FOR TRAVEL OPTIONS IN WASHING TON COUNTY. Image: Steve Morgan. Image: Steve Morgan
 BUILDING THE CASE FOR TRAVEL OPTIONS IN WASHING TON COUNTY Image: Steve Morgan Image: Steve Morgan Image: TriMet Image: TriMet WHAT ARE TRAVEL OPTIONS PROGRAMS? Travel options programs encourage residents,
MEETING Agenda. Introductions. Project Overview. Key Study Components. Alternative Station Concepts. Preferred Station Concept. Next Steps.
 City GARLAND Council ROADVISION Briefing STUDY VISION STUDY Dallas, TX April 8, 2010 1 1 MEETING Agenda Introductions Project Overview Key Study Components Alternative Station Concepts Preferred Station
Webinar: The Association Between Light Rail Transit, Streetcars and Bus Rapid Transit on Jobs, People and Rents
 Portland State University PDXScholar TREC Webinar Series Transportation Research and Education Center (TREC) 11-15-2016 Webinar: The Association Between Light Rail Transit, Streetcars and Bus Rapid Transit
Sustainable Transportation Planning in the Portland Region
 Sustainable Transportation Planning in the Portland Region Jennifer Dill, Ph.D. Associate Professor School of Urban Studies & Planning jdill@pdx.edu http://web.pdx.edu/~jdill/ Outline Elements of a sustainable
Capital Beltway HOT Lanes - Frequently Asked Questions
 Capital Beltway HOT Lanes - Frequently Asked Questions December 20, 2007 1. What is the cost of the project? The fixed-price design-build cost is approximately $1.4 billion. 2. Why have the project costs
Fitting Light Rail through Well-established Communities
 Fitting Light Rail through Well-established Communities San Francisco 2008 Michael D. Madden Chief, Project Development, Maryland Transit Administration Project Setting Located inside the Capital Beltway
2010 Pedestrian and Bicyclist Special Districts Study Update
 2010 Pedestrian and Bicyclist Special Districts Study Update Pedestrian and Bicyclist Special Districts Program Overview H-GAC s Special Districts Program aims to provide strategic investments in pedestrian
Q1 Are you a Palisades resident?
 Q1 Are you a Palisades resident? 95.24% 0.68% If no, on what street do yo... 4.08% If no, on what street do you live? (please supply your street name and municipality) 95.24% 140 0.68% 1 4.08% 6 # If no,
Customer Service and Operations Committee. Board Information Item III-A. March 12, 2015
 Customer Service and Operations Committee Board Information Item III-A March 12, 2015 Business Partnerships and Encouraging Off-Peak Ridership Page 3 of 30 Washington Metropolitan Area Transit Authority
Briefing Paper #1. An Overview of Regional Demand and Mode Share
 2011 Metro Vancouver Regional Trip Diary Survey Briefing Paper #1 An Overview of Regional Demand and Mode Share Introduction The 2011 Metro Vancouver Regional Trip Diary Survey is the latest survey conducted
Texas Housing Markets: Metropolitan vs. Border Communities. September 22, 2014
 Texas Housing Markets: Metropolitan vs. Border Communities Luis Bernardo Torres Ruiz, Ph.D. Research Economist El Paso Branch Dallas Federal Rio Grande Economic Association September 22, 2014 Contents
2045 Long Range Transportation Plan. Summary of Draft
 2045 Long Range Transportation Plan Summary of Draft Fredericksburg Area Metropolitan Planning Organization The George Washington Region includes the City of Fredericksburg and the counties of Caroline,
To Shape or Serve: Transit & Land Use Forum Tina M. Votaw, Charlotte Area Transit System (CATS)
") To Shape or Serve: Transit & Land Use Forum Tina M. Votaw, Charlotte Area Transit System (CATS) What s the Strategy? Balanced Approach: Invest in both Streets and Transit First to shape, i.e. manage growth
To Shape or Serve: Transit & Land Use Forum Tina M. Votaw, Charlotte Area Transit System (CATS) What s the Strategy? Balanced Approach: Invest in both Streets and Transit First to shape, i.e. manage growth
Population & Demographics
 Population & Demographics Conditions and Trends When looking at trends in the total number of people living in Windham (population) and at the characteristics of the people who live here by factors such
METRO Light Rail: Changing Transit Markets in the Phoenix Metropolitan Area
 METRO Light Rail: Changing Transit Markets in the Phoenix Metropolitan Area Abhishek Dayal, AICP Planner III, METRO Light Rail Phoenix, AZ BACKGROUND Transit in the Phoenix Region Transit services in the
Exit 13/Golden Triangle Study FREQUENTLY ASKED QUESTIONS
 FREQUENTLY ASKED QUESTIONS How will you improve traffic in the Golden Triangle? One main goal of this study is to examine the current traffic patterns of the area and propose ways to improve the traffic.
Will 2016 Be the Last Hurrah for Commercial Real Estate? Presented By: John Chang First Vice-President Marcus & Millichap Research Services
 Will 2016 Be the Last Hurrah for Commercial Real Estate? Presented By: John Chang First Vice-President Marcus & Millichap Research Services Rising Uncertainty Creating Headwinds for Commercial Real Estate
November 14, Dulles To DC Loop Public-Private Partnership Proposal. Executive Summary
 November 14, 2005 Dulles To DC Loop Public-Private Partnership Proposal Executive Summary Virginia Mobility Associates LLC, a newly established single purpose entity, proposes to privately finance the
Complete Streets 101: The Basics
 Complete Streets 101: The Basics Michigan Municipal League - Capital Conference March 21, 2017 Chip Smith, AICP - Senior Planner - Wade Trim Inc. and City Council member City of Ann Arbor 2017 MML Capital
DES MOINES AREA MPO. Presentation to Iowa Commercial Real Estate Association. April 6, 2017
 DES MOINES AREA MPO Presentation to Iowa Commercial Real Estate Association April 6, 2017 Presentation Outline MPO Overview Trends We re Watching Plans, Projects, Initiatives, Regional Transportation Priorities
Guidelines for Providing Access to Public Transportation Stations APPENDIX C TRANSIT STATION ACCESS PLANNING TOOL INSTRUCTIONS
 APPENDIX C TRANSIT STATION ACCESS PLANNING TOOL INSTRUCTIONS Transit Station Access Planning Tool Instructions Page C-1 Revised Final Report September 2011 TRANSIT STATION ACCESS PLANNING TOOL INSTRUCTIONS
U.S. Property Market Outlook, 2013Q1. Jim Costello, Managing Director CBRE Americas Research Investment Research
 U.S. Property Market Outlook, 2013Q1 Jim Costello, Managing Director CBRE Americas Research Investment Research CBRE Page 2 Outlook for the Real Side of the Economy Operationally, what do Research Teams
Coolest Cities Results Summary
 Coolest Cities Results Summary About Coolest Cities Canada s six largest urban areas provide homes and jobs for almost 15 million people, nearly half of our population. Transporting these citizens to and
Appendix B: Benefit-Cost Analysis
 Appendix B: Benefit-Cost Analysis RE-CONNECTING CLEVELAND: PATHWAYS TO OPPORTUNITY RE-CONNECTING CLEVELAND: PATHWAYS TO OPPORTUNITY [this page intentionally blank] RE-CONNECTING CLEVELAND: PATHWAYS TO
The Walkability Indicator. The Walkability Indicator: A Case Study of the City of Boulder, CO. College of Architecture and Planning
 1 : A Case Study of the City of Boulder, CO College of Architecture and Planning University of Colorado Author Note: Daryoosh Ardalan, Urban Regional Planning, College of Architecture and Planning, University
Exceeding expectations: The growth of walking in Vancouver and creating a more walkable city in the future through EcoDensity
 Exceeding expectations: The growth of walking in Vancouver and creating a more walkable city in the future through EcoDensity Melina Scholefield, P. Eng. Manager, Sustainability Group, City of Vancouver
Appendix T 1: Additional Supporting Data
 Appendix T 1: Additional Supporting Data Project Delivery Delays with the implementation of the 2000 TIP became apparent early in the decade. In response to direction among policy officials, ARC began
Table #6 VISION CHARACTERISTICS
 Table #6 VISION White Flint is a place to live, work, play, shop, and walk with sufficient density to encourage quality redevelopment. Vibrant streets and consistent streetscapes are important. CHARACTERISTICS
Enhanced BBD Office Focus. September 30, 2015
 Enhanced BBD Office Focus September 30, 2015 SAFE HARBOR Certain matters in this presentation are forward-looking statements within the meaning of the federal securities laws, such as the following: the
Project Narrative. Albuquerque, NM. July 31, 2015
 Project Narrative Albuquerque, NM July 31, 2015 1 Project Identification As the first bus rapid transit (BRT) project in New Mexico, the Albuquerque Rapid Transit (ART) line will run through the heart
Approaches. Livable Neighborhood Design. Examples. Traditional neighborhood development. CE 594 University of Wisconsin- Milwaukee
 Approaches Livable Neighborhood Design CE 594 University of Wisconsin- Milwaukee Traditional neighborhood design (TND), new urbanism, transit friendly design, transit oriented development and walkable
The Impact of Placemaking Attributes on Home Prices in the Midwest United States
 The Impact of Placemaking Attributes on Home Prices in the Midwest United States 2 0 1 3 C O N S T R U C T E D E N V I R O N M E N T C O N F E R E N C E M A R Y B E T H G R A E B E R T M I C H I G A N
Detroiters need to be able to conveniently and reliably get to work, school, church, stores, and parks.
 Environment & MOBILITY Detroiters need to be able to conveniently and reliably get to work, school, church, stores, and parks. Several surveyed challenges related to lack of mobility ranked in the top
MONTGOMERY COUNTY COUNCIL
 MONTGOMERY COUNTY COUNCIL R O C K V I L L E, M A R Y L A N D October 20, 2015 The Honorable Isiah Leggett Montgomery County Executive 101 Monroe Street, 2nd Floor Rockville, MD 20850 Dear County Executive
Ellensburg CENTRALLY LOCATED
 Ellensburg CENTRALLY LOCATED Ellensburg was awarded two Opportunity Zone designations Opportunities Combined, the tracts total more than 6120 acres. Of that, 22 percent is designated for commercial or
RESTAURANT OR RETAIL opportunity located in the central business district
 RESTAURANT OR RETAIL opportunity located in the central business district 14 TH S T N W H S T S W 12TH ST NW TURNKEY SECOND GENERATION RESTAURANT SPACE 1110 Vermont Ave NW is a fully built out restaurant/retail
Better Market Street Project Update. Urban Forestry Council September 17, 2014
 Better Market Street Project Update Urban Forestry Council September 17, 2014 Project Area Limits Better Market Street Schedule Market Street City s busiest transit corridor Over 85 buses per hour 14 surface
Transit-Driven Complete Streets
 Questions: Type questions into the box at bottom of webinar panel. Panelists for today s webinar: Nimotalai Azeez, Program Associate with the National Complete Streets Coalition Rich Weaver, Director of
THE I-79 CORRIDOR. I-79 provides motorists with connections to the following major highways: I-80, PA 358, PA 965 and PA 208.
 The I-79 Corridor Pittsburgh to Erie Regional Thruway I-79 was constructed through Mercer County in the early 1960s. The portion north of PA 965 opened in 1961 and the segment south of PA 965 the following
Smart Growth, Climate Change and Prosperity Steve Winkelman Chuck Kooshian
 Smart Growth, Climate Change and Prosperity Steve Winkelman Chuck Kooshian Asilomar Transportation & Energy Conference August 31, 2011 CCAP put the third leg of the stool on the policy map. Reducing VMT
Cities Connect. Cities Connect! How Urbanity Supports Social Inclusion
 Cities Connect! How Urbanity Supports Social Inclusion Todd Litman Victoria Transport Policy Institute Metropolis Toronto, Canada - 14 June 2006 Cities Connect People with people. People with jobs. People
Non-motorized Transportation Planning Resource Book Mayor s Task Force on Walking and Bicycling City of Lansing, Michigan Spring 2007 pg.
 Non-motorized Transportation Planning Resource Book pg. 105 of 158 Non-motorized Transportation Planning Resource Book pg. 106 of 158 Non-motorized Transportation Planning Resource Book pg. 107 of 158
ADA Transition Plan. City of Gainesville FY19-FY28. Date: November 5, Prepared by: City Of Gainesville Department of Mobility
 ADA Transition Plan FY19-FY28 Date: November 5, 2018 Prepared by: City Of Gainesville Department of Mobility 1.0 INTRODUCTION 1.1 BACKGROUND The federal statute known as the Americans with Disabilities
ATTACHMENT 4 - TDM Checklist. TDM Checklist Overview
 ATTACHMENT 4 - TDM Checklist TDM Checklist Overview The proposed checklist rates developments on the degree to which they are TDM and transit supportive. Points are assigned based on the level of transit
Ann Arbor Downtown Street Plan
 1 Ann Arbor Downtown Street Plan Public Workshop #1 We know that. 2 Public right-of-way (streets, sidewalks, and alleys) make up 30% of the total District area of downtown. Streets need to provide mobility
FACTS AND FIGURES: MAKING THE CASE FOR COMPLETE STREETS IN LEE COUNTY
 FACTS AND FIGURES: MAKING THE CASE FOR COMPLETE STREETS IN LEE COUNTY Safety: Close to 5,000 pedestrians and bicyclists die each year on U.S. roads, and more than 70,000 are injured. [Mean Streets, Surface
Washington Metropolitan Area Transit Authority Board Action/Information Summary
 Washington Metropolitan Area Transit Authority Board Action/Information Summary Action Information MEAD Number: 200242 Resolution: Yes No TITLE: MWCOG Strategic Investment Plan & TPB Priorities PRESENTATION
WILMAPCO Public Opinion Survey Summary of Results
 Wilmington Area Planning Council WILMAPCO Public Opinion Survey Summary of Results Prepared by: 2955 Valmont Road, Suite 300 Boulder, Colorado 80301 t: 303-444-7863 f: 303-444-1145 www.n-r-c.com Table
PEDESTRIAN ACTION PLAN
 ATTACHMENT 2 CITY OF SANTA MONICA PEDESTRIAN ACTION PLAN CITY OF SANTA MONICA PEDESTRIAN ACTION PLAN This page intentionally left blank EXECUTIVE SUMMARY CHAPTER 1 EXECUTIVE SUMMARY Setting the Stage
Arnold Hinojosa
 Policy Analysis of the Mass Transit Challenges Facing Rapidly Growing Southern and Western Cities and How These Challenges Can Be Addressed Using the Model Set by Chicago Arnold Hinojosa ahinojosa@kentlaw.edu
Travel and Rider Characteristics for Metrobus
 Travel and Rider Characteristics for Metrobus 040829040.15 Travel and Rider Characteristics for Metrobus: 2012-2015 Overview The Miami Dade County Metropolitan Planning Organization (MPO) conducted a series