Performance measures for nonmotorized
|
|
|
- Aileen Parsons
- 6 years ago
- Views:
Transcription


1 Performance measures for nonmotorized transportation May 2, 2014 Performance measures for non-motorized transportation
2 Today s Speakers Robbie Webber State Smart Transportation Initiative Craig Williams Senior Associate, San Diego Alta Planning and Design Paula Reeves, Community Designs Manager, Local Programs Washington State DOT May 2, 2014 Performance measures for non-motorized transportation 2

3 State Smart Transportation Initiative Practical Solutions to Move America Forward A network of reform-oriented state DOTs, founded in 2010 and housed at the University of Wisconsin. Executive-level Community of Practice Technical assistance Resource for the transportation community May 2, 2014 Performance measures for non-motorized transportation 3
4 May 2013 Community of Practice Program and notes: Webinar, May 22, 2013: ng-the-most-of-thetransportation-alternativesprogram/ May 2, 2014 Performance measures for non-motorized transportation 4
5 Performance measures under MAP-21 Goal area Safety Infrastructure condition Congestion reduction System reliability Freight movement and economic vitality Environmental sustainability Reduced project delivery delays Akron Innerbelt Alps Roads National goal To achieve a significant reduction in traffic fatalities and serious injuries on all public roads To maintain the highway infrastructure asset system in a state of good repair To achieve a significant reduction in congestion on the National Highway System To improve the efficiency of the surface transportation system To improve the national freight network, strengthen the ability of rural communities to access national and international trade markets, and support regional economic development Rochester To Friscocali enhance / the via performance Flickr of the transportation system while protecting and enhancing the natural environment To reduce project costs, promote jobs and the economy, and expedite the movement of people and goods by accelerating project completion through eliminating delays in the project development and delivery process, including reducing regulatory burdens and improving agencies work practices May 2, 2014 Performance measures for non-motorized transportation 5

6 Traditional performance measures for DOTs Metrics for driver-based personal transportation Safety Congestion Travel time Rochester Friscocali / via Flickr Roadway Level of Service Pavement condition and other maintenance metrics Akron Innerbelt Alps Roads May 2, 2014 Performance measures for non-motorized transportation 6


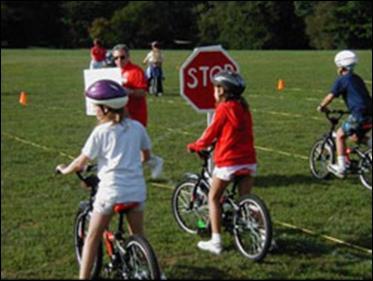
7 Outputs vs outcomes Photo: Elvert Barnes Photo: Dan Burden Rochester Friscocali / via Flickr Akron Innerbelt Alps Roads Photo: Robbie Webber May 2, 2014 Performance measures for non-motorized transportation 7


8 What can we use for biking and walking? Output-based measures Quantity of infrastructure Photo: Laura Sandt Quality of infrastructure Rochester Friscocali / via Flickr Accessibility Akron Innerbelt Alps Roads Photo: Michael King Photo: Dan Burden May 2, 2014 Performance measures for non-motorized transportation 8

9 What can we use for biking and walking? Outcome-based measures Congestion Air Quality Rochester Friscocali / via Flickr Safety Modal Shift Akron Innerbelt Alps Roads Photo: The Alliance for Biking and Walking May 2, 2014 Performance measures for non-motorized transportation 9

10 What can we use for biking and walking? More outcome-based measures Economic development Public health Rochester Friscocali / via Flickr Quality of life Akron Innerbelt Alps Roads May 2, 2014 Performance measures for non-motorized transportation 10
11 Quantity of Infrastructure Total miles of sidewalks, paths, or bike lanes Fraction of total roadway miles on arterial/major collector routes that include bike facilities or are within 1/4 mile of a mapped bike route Rochester Friscocali / via Flickr Fraction of total roadway miles that include sidewalks Akron Innerbelt Alps Roads May 2, 2014 Performance measures for non-motorized transportation 11

12 Quality of infrastructure Bicycle Level of Service Bicycle Compatibility Index Bicycle Level of Stress Rochester Friscocali / via Flickr Pedestrian Environmental Quality Index Akron Innerbelt Alps Roads May 2, 2014 Performance measures for non-motorized transportation 12
13 Accessibility Walk Score/Bike Score Advantage: Low cost, easy to use. Benefit: Shows proximity to amenities, which is very important Rochester Disadvantage: Does not show the quality of the walking Friscocali / via Flickr or biking experience. Does not distinguish between quality of amenities More of a land use metric than transportation Akron Innerbelt Alps Roads May 2, 2014 Performance measures for non-motorized transportation 13
14 Modal shift Data only trip to work is widely available Data often not fine-grained Possibility that people are moving from transit to biking and walking ACS Rochester Friscocali / via Flickr Bike-ped counts Big Data cell phone data Akron Innerbelt Alps Roads May 2, 2014 Performance measures for non-motorized transportation 14
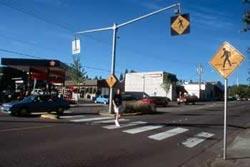
15 Safety Widely-accepted transportation metric How to measure? Bicyclist/pedestrian fatalities per million VMT Rochester Friscocali / via Flickr Percentage of drivers exceeding posted speed limits by > 5 mph Akron Innerbelt Alps Roads May 2, 2014 Performance measures for non-motorized transportation 15

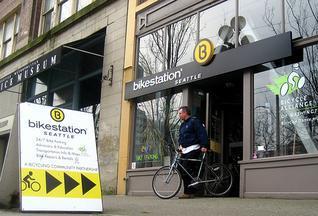
16 Economic development Important to business community, neighborhood, and city May be difficult to tie to specific project or program Portion of sales to customers arriving by foot or bike Total retail sales Property values Occupancy rates Rochester Friscocali / via Flickr Rental prices Akron Innerbelt Alps Roads Photo: Heather Bowden May 2, 2014 Performance measures for non-motorized transportation 16

17 Public health Public health agencies might already be collecting data Some measures are long-term or difficult to tie to a specific investment Obesity rates Asthma Diabetes Akron Innerbelt Alps Roads Rochester Friscocali / via Flickr Number of minutes of physical activity per day May 2, 2014 Performance measures for non-motorized transportation 17
18 Air quality and congestion Pro: Transportation agencies are already measuring Con: Hard to tie to bicycle and pedestrian programs. Induced demand Rochester Friscocali / via Flickr Possibility that people are moving from transit to biking and walking Akron Innerbelt Alps Roads May 2, 2014 Performance measures for non-motorized transportation 18

19

20 Minnesota DOT Performance Measures From Minnesota Statewide Bicycle Planning Study
21 MnDOT Performance Measures As bicycling has become a more popular mode of travel, and acknowledged as integral to a safer and more livable multimodal transportation network, the need to track ridership trends and the effectiveness of bicycle transportation systems has become clear. As MnDOT seeks to promote and increase bicycling, it is imperative that investments be based on data and research that shows which planning and implementation policies are the most successful. Establishing targets for bicycle travel, making steady progress in improvements, and monitoring key indicators such as usage, safety, and facilities also demonstrates to stakeholder groups, other agencies, and the public, that MnDOT takes bicycling as seriously as other modes of travel. 21
22 Minnesota DOT Performance Measures Usage Increase Bicycle Mode Share to X% by 20XX Safety Reduce bicyclist crash rate to X percentage of bicycle trips by year 20xx Assets Increase the miles of the statewide priority network that meets specified criteria for bicycle transportation to X percentage of the total network by 20XX. 22
23 Minnesota DOT Performance Measures For each measure Methodology Data Needed Data Collection and Evaluation Potential Metric Variations Further Applications Potential Partners Example Measures 23
24 Illinois DOT Performance Measures From Illinois Bike Transportation Plan 2014 The performance measures presented in this chapter provide a tool for tracking the progress of State bicycling and Complete Streets improvements and Plan implementation. Categories: Planning & Policies Design & Maintenance Funding Education & Promotion 24
25 25
26 26
27 27
28 28
29 29
30 30
31


32 Measuring Biking and Walking A State Perspective Paula Reeves, AICP CTP WSDOT Local Programs Division SSTI Webinar May 2, 2014


33 WSDOT s Local Programs Division We provide educational, technical, and financial support with federal oversight to local customers to help them achieve their transportation goals We are stewards of federal transportation funding We provide technical expertise and services related to federal and state requirements. We promote cooperative planning and partnerships.


34 Community Design to better balance the regional need for moving automobile traffic with the community need for a vibrant, connected and safe pedestrian environment.
35 Overview Our general requirements for measuring biking and walking What data are we tracking? Recent research Main Street Highways and Complete Streets

36 Why does the state measure bicyclists and pedestrians? Required by Governor s Performance Measurement Programs since 2008 Necessary to track progress toward meeting Washington State s long range goal: Reduce fatal and serious crashes involving bicyclists and pedestrians, while doubling biking and walking. Critical for the State Highway Safety Plan Target Zero
.")
37 Tracking important trends Declining Miles Traveled on WA Roads Rising/fluctuating fuel prices Health & environmental concerns Technology Aging population Rising maintenance needs and costs + declining transportation revenue (gas tax). Source: Sightline Increased urbanization


38 Trends we are watching Millennials are driving less from 2001 to 2009 down 23 percent K-8 children walking to school increasing from 2007 to 2012 up 27 percent increase Commute trips make up less than 20% of all vehicle trips during peak hour - from 1969 to 2009, down from 45%
39 Are we meeting our goals? In 2012 there were 560 fatal and serious injury pedestrian or bicyclist collisions, accounting for 20% of all fatal and serious injury traffic collisions that year. 90 Number of traffic fatalities involving bicyclists and pedestrians , Washington only Pedestrian and Bicyclist fatalities Pedestrian fatalities Bicyclist fatalities


40 The young & aging - At Risk groups 769 bicycle and pedestrian traffic crashes involving children in Adults 65+ are 13% of the population, but 25% of pedestrian fatalities. 30% Number of pedestrian collisions and fatalities compared to population by age group , Washington only 25% 20% 15% 10% 5% 0% Percent of all pedestrian collisions Percent of pedestrian fatalities Percent of total population


41 Pedestrian and Bicyclist Mobility Trends In Washington approximately 13% of all trips, 5% of commute trips, and 10% of all miles traveled were on foot or by bicycle. 10% increase in biking and walking statewide over the past 5 years. Source: NHTS, ACS, Regional Surveys, and WSDOT Bicycle and Pedestrian Documentation Project
42 Counting Biking and Walking in WA 42 cities & 250 count sites in 2013

43 Site Background Data Collection
44 Reasons we count bicyclists and pedestrians statewide: Beyond the main reason We track all users of the transportation system Current national & state travel behavior surveys are inadequate Regional household surveys vary greatly Biking and walking is rapidly increasing in urban areas American Community Survey Question: How did this person usually get to work LAST WEEK? If this person usually used more than one method of transportation during the trip, mark the box of the one usually used. (most of the distance or most of the time)

45 What have we learned so far? In addition to capturing large amounts of data from across WA in a short period of time at very low cost Improving local, regional and state planning Strengthening partnerships Raising awareness about the need for more and better bicycle and pedestrian data
46 Where are people biking and walking? REGIONAL CENTERS Household Location: INSIDE OUTSIDE INSIDE OUTSIDE Work Location: INSIDE INSIDE OUTSIDE OUTSIDE Drive Alone 38.3% 70.8% 81.% 84.9% Carpool 7.9% 7.9% 7.4% 9.3% BUS 25.2% 16.1% 8.8% 2.0% BICYCLE 3.0% 2.1% 1.9% 1.4% WALK 25.5% 2.4% 0.4% 1.8% OTHER 0.0% 0.7% 0.0% 0.6% TOTAL 100% 100% 100% 100% Source: Puget Sound Regional Council Travel Demand Model
47 Walkability = Community Economic Development Rents in walkable shopping areas can be 27 to 54 percent higher than mainly automobile dependent or drive-to shopping Each point increase in your community WalkScore correlated to a $500 to $3000 increase in rent - home values. Over 80 percent of residents regularly walk to run errands when retail and services are one-fifth of a mile or less from most homes. BUT - when that average distance between homes, retail and services increases to half of a mile, the share of even periodic foot travelers drops significantly 30% or less. Source: Cortright, Joe Walking the Walk: How Walkability Raises Home Values in U.S. Cities. CEOs for Cities. Handy, Susan, K. Butler, and R.G. Paterson Planning for Street Connectivity Getting from Here to There. Chicago: American Planning Association.


 The transportation sector is responsible for over half of EPA s six regulated air")
48 Transportation and Public Health Trends Automobile dependency is costly, discourages physical activity, and adversely affects air quality. Recent studies link increasing rates of obesity to time spent in cars and community design - wide roads without crossings, and no safe areas to walk or bike. 1 in 3 people and 17 percent of young people in Washington are obese in 2012 (Washington Department of Health) The transportation sector is responsible for over half of EPA s six regulated air pollutants and the largest contributor of greenhouse gas emissions in Washington (Washington Department of Ecology)

49 Washington s 2014 Student Travel Survey WSDOT, Dept. of Health, Office of Public Instruction Partnership It is a random representative telephone survey of parents who have children in grades K-8. It asks how students travel to and from school and about barriers to walking, biking and taking the school bus.

50 Research identified approximately 500 miles of Main Street highways bisecting 180+ cities based on criteria applied consistently across the state. Main Street Highways
51 Variables State Route within City Limits Y, N Highway of Statewide Significance Y, N National Highway System Y, N State Access Control Classification Y, N Federal Functional Classification Design Speed Posted Speed Year of Incorporation Freight Classification Collision History What is a Main Street Highway? Step 1: Screening Units of Measure Principal arterials, Minor arterial streets, Collector streets, Local streets MPH MPH Year T-1 more than 10 million tons per year; T-2 4 million to 10 million tons per year; T-3 300,000 to 4 million tons per year; T-4 100,000 to 300,000 tons per year; T-5 at least 20,000 tons in 60 days Number of collisions involving bicyclists and pedestrians
52 Step 2 Defining Main Street Highways Variables Units of Measure CBD, Mixed Use, Commercial Center Land Use Locally Adopted Zoning Proportion of visible buildings that are commercial Percentage (25%, 50%, 75%, 100%) Proportion of street frontage with dead space Percentage (25%, 50%, 75%, 100%) Proportion of street frontage with parked cars Percentage (25%, 50%, 75%, 100%) Number of travel lanes Average travel lane width Average shoulder width Average median width Average sidewalk width Total curb to curb width Total back of sidewalk to back of sidewalk width Posted speed limit Crosswalk spacing Visible curb extensions (y, n) Y,N Average building setback Average building height (stories) Uniform building height (y, n)) Y,N Number of pedestrians visible Average daily traffic Visible bicycle lane Y,N Visible buildings that are historic Y,N Number both directions Feet Feet Feet Feet Feet Feet MPH Feet Feet Stories Count Volume
53 Why Define Main Street Highways? Ensure a measurable link between goals and transportation investments --Outcomes vs. throughput or volume to capacity ratio Develop the most cost effective transportation projects --Ensure fewer scope and schedule changes Identify partnerships, opportunities, and resources. --Transportation, historic preservation, environmental, economic development, utilities, etc..
54 Research Findings Scope changes: -- More common on Main Street Highways -- 48% of all projects on Main Street Highways vs. 38% on other parts of the state system Retrospective review: projects or 20% of WSDOT s scope, schedule and budget changes could have directly benefited from additional community design before projects were scoped Average possible cost avoidance per project: -- Estimated at over $9 million dollars or 30% of project cost
55 Main Street Highways Pedestrian and Bicyclist Collisions and Fatalities on Main Street Highways 2010 through % 60% Percent of Collisions 50% 40% 30% Percent of Fatalities 20% 10% Percent of Highway Miles 0% State Highways that also serve as City Streets in core commercial areas or Main Street Highways serve as both thoroughfares and community access routes.


56 Moving Forward More Measures to Consider Complete Streets Act Consultation Requirement Practical Design Reform WSDOT Community Engagement Goal Bike Share in Puget Sound State Route 14 Bingen State Route 12 Morton
57 Resources WSDOT s Websites WSDOT Contacts Paula Reeves Manager, Community Design Reevesp@WSDOT.WA.GOV Vacant Bicycle and Pedestrian Coordinator Maceki@WSDOT.WA.GOV Charlotte Claybrooke Safe Routes to Schools Coordinator ClaybrC@WSDOT.WA.GOV Ed Spilker GIS and Local Planning Coordinator Spilker@WSDOT.WA.GOV
58 Thank you! We are very interested in your feedback: What metrics is your transportation agency using? What are the most important metrics for your state or community? What data is important to your performance measures? Robbie Webber: May 2, 2014 Performance measures for non-motorized transportation 58
WSDOT s Main Street Highways Initiative
 WSDOT s Main Street Highways Initiative Paula Reeves, AICP CTP WSDOT Highways and Local Programs Reconnecting America Webinar October 16 th, 2013 WSDOT s Local Programs Division We provide educational,
Attachment A: Columbus Area Metropolitan Transportation Plan Objectives, Performance Measures, and Targets
 OBJECTIVE: Reduce the percentage of commuters driving alone, and increase the percentage of commuters riding transit, ing Reducing single occupancy auto commutes and increasing commuters using alternative
BUILDING THE CASE FOR TRAVEL OPTIONS IN WASHING TON COUNTY. Image: Steve Morgan. Image: Steve Morgan
 BUILDING THE CASE FOR TRAVEL OPTIONS IN WASHING TON COUNTY Image: Steve Morgan Image: Steve Morgan Image: TriMet Image: TriMet WHAT ARE TRAVEL OPTIONS PROGRAMS? Travel options programs encourage residents,
Appendix T 1: Additional Supporting Data
 Appendix T 1: Additional Supporting Data Project Delivery Delays with the implementation of the 2000 TIP became apparent early in the decade. In response to direction among policy officials, ARC began
City of Jacksonville Mobility Fee Update
 City of Jacksonville Mobility Fee Update 2017 Preliminary Analysis May 3, 2017 Carnival Cruise lines photo credit Presentation Overview Public Outreach Process Pedestrian and Bicycle Master Plan Study
MCTC 2018 RTP SCS and Madera County RIFP Multi-Modal Project Eval Criteria GV13.xlsx
 MCTC 8 RTP SCS and Madera County RIFP Multi-Modal Project Eval Criteria GV.xlsx Madera County Transportation Commission Regional Transportation Plan / Sustainable Communities Strategy Multi-Modal Project
Complete Streets 101: The Basics
 Complete Streets 101: The Basics Michigan Municipal League - Capital Conference March 21, 2017 Chip Smith, AICP - Senior Planner - Wade Trim Inc. and City Council member City of Ann Arbor 2017 MML Capital
Lisa Quinn Executive Director
 Transforming Injury and Violence Prevention: Innovations in Policy, Practice, and Partnerships Advocating for Prevention: Enacting and Reacting to Legislation Lisa Quinn Executive Director Feet First works
MOBILITY RESULTS AREA. Budgeting For Outcomes Council Presentation January 12, 2007
 MOBILITY RESULTS AREA Budgeting For Outcomes Council Presentation January 12, 2007 Mobility Results Team Members 2 Hammond Perot, OED, Co-Team Leader Bonnie Meeder, DEV (returning), Co-Team Leader Peer
Incorporating Health in Regional Transportation Planning
 Mayor Karl Dean, Chairman Incorporating Health in Regional Transportation Planning Leslie A. Meehan, AICP Center TRT Intervention Webinar January 29, 2013 Objectives for Today Background About the Nashville
City of Jeffersonville Complete Streets Workshop
 City of Jeffersonville Complete Streets Workshop Planning for a Healthy Community Proudly brought to you by: WORKSHOP OVERVIEW 1. Complete Streets 101 2. Bloomington-Monroe County MPO Policy 3. Mobile
CITY OF BLOOMINGTON COMPLETE STREETS POLICY
 CITY OF BLOOMINGTON COMPLETE STREETS POLICY POLICY OBJECTIVE: The City of Bloomington will enhance safety, mobility, accessibility and convenience for transportation network users of all ages and abilities,
Complete streets serve the 1/3 of Hoosiers who do not drive.
 Complete Streets Complete streets are safe, comfortable and convenient for all users, including pedestrians, bicyclists, motorists and public transit riders, regardless of age or ability. Complete streets
RESOLUTION NO ?? A RESOLUTION OF THE CITY OF NEPTUNE BEACH ADOPTING A COMPLETE STREETS POLICY
 RESOLUTION NO. 2018-?? A RESOLUTION OF THE CITY OF NEPTUNE BEACH ADOPTING A COMPLETE STREETS POLICY WHEREAS, safe, convenient, and accessible transportation for all users is a priority of the City of Neptune
o n - m o t o r i z e d transportation is an overlooked element that can greatly enhance the overall quality of life for the community s residents.
 N o n - m o t o r i z e d transportation is an overlooked element that can greatly enhance the overall quality of life for the community s residents. 84 Transportation CHAPTER 11 INTRODUCTION Transportation
Governor s Transportation Vision Panel
 Office of Governor Kate Brown Governor s Transportation Vision Panel JLA Public Involvement Project Overview The is a yearlong effort to develop a series of recommendations for the Governor that address
DRAFT MOVING FORWARD RHODE ISLAND BICYCLE MOBILITY PLAN 2018 PREPARED FOR PREPARED BY IN ASSOCIATION WITH
 RHODE ISLAND MOVING FORWARD BICYCLE MOBILITY PLAN 2018 PREPARED FOR PREPARED BY IN ASSOCIATION WITH T AF CHAPTER 1 D R INTRODUCTION CHAPTER 3 ARTICULATES VISION Bicycling is safe, fun and practical in
Living Streets Policy
 Living Streets Policy Introduction Living streets balance the needs of motorists, bicyclists, pedestrians and transit riders in ways that promote safety and convenience, enhance community identity, create
Perryville TOD and Greenway Plan
 Perryville TOD and Greenway Plan Greenway Glossary Pathway: A bicycle and pedestrian path separated from motorized vehicular traffic by an open space, barrier or curb. Multi-use paths may be within the
Incorporating Health in Regional Transportation Planning
 Mayor Karl Dean, Chairman Incorporating Health in Regional Transportation Planning Leslie A. Meehan, AICP Center TRT Intervention Webinar January 29, 2013 Objectives for Today Background About the Nashville
Chapter 2. Bellingham Bicycle Master Plan Chapter 2: Policies and Actions
 Chapter 2 Bellingham Bicycle Master Plan Chapter 2: Policies and Actions Chapter 2: Policies and Actions The Bicycle Master Plan provides a road map for making bicycling in Bellingham a viable transportation
Chapter 5. Complete Streets and Walkable Communities.
 Chapter 5. Complete Streets and Walkable Communities. 5.1 Description of Complete Streets. Cities throughout the world, and specifically the United States, are coming to embrace a new transportation and
ACTIVE TRANSPORTATION
 ACTIVE TRANSPORTATION Mobility 2040 Supported Goals Improve the availability of transportation options for people and goods. Support travel efficiency measures and system enhancements targeted at congestion
Measuring and Communicating Mobility:
 Measuring and Communicating Mobility: The District Mobility Project Stephanie Dock, District Department of Transportation TRB Transportation Issues in Major Cities Committee May 2, 2017 Deconstructing
Bicycle Master Plan Goals, Strategies, and Policies
 Bicycle Master Plan Goals, Strategies, and Policies Mobilizing 5 This chapter outlines the overarching goals, action statements, and action items Long Beach will take in order to achieve its vision of
Performance Criteria for 2035 Long Range Transportation Plan
 Minimizing Impacts on Natural, Historic, Cultural or Archeological Resources 2035 LRTP Weighting Factor: 7% Objective 1.1: Use appropriate planning and design criteria to protect and enhance the built
City of Novi Non-Motorized Master Plan 2011 Executive Summary
 City of Novi Non-Motorized Master Plan 2011 Executive Summary Prepared by: February 28, 2011 Why Plan? Encouraging healthy, active lifestyles through pathway and sidewalk connectivity has been a focus
Proposed. City of Grand Junction Complete Streets Policy. Exhibit 10
 Proposed City of Grand Junction Complete Streets Policy Exhibit 10 1 City of Grand Junction Complete Streets Policy Vision: The Complete Streets Vision is to develop a safe, efficient, and reliable travel
We believe the following comments and suggestions can help the department meet those goals.
 The Honorable Secretary Anthony Foxx The Secretary of Transportation United States Department of Transportation 1200 New Jersey Avenue, SE Washington, DC 20590 August 30, 2013 Dear Secretary Foxx, Thank
Bicycle and Pedestrian Connectivity Study Phase 2
 Connectivity Study Phase 2 Process PROCESS OUTCOMES Phase Prepared By STEP I Public Participation and Outreach 1. RTP Outreach activities, and development of the Bike and Ped Task Force Phase 1 2011 OCPC
AMATS Complete Streets Policy
 AMATS Complete Streets Policy Table of Contents: Section 1. Definition of Complete Streets Section 2. Principles of Complete Streets Section 3. Complete Streets Policy Section 4. Consistency Section 5.
How To Encourage More Efficient Transportation in Brazilian Cities
 How To Encourage More Efficient Transportation in Brazilian Cities Todd Litman Victoria Transport Policy Institute Presented Seminar on Discouraging The Use Of Cars São Paulo, Brazil 3 September 2013 Creating
Pedestrian & Bicycle Program & Safe Routes to School 2016
 Pedestrian & Bicycle Program & Safe Routes to School 2016 Charlotte Claybrooke, Local Programs Active Transportation Programs Manager Tribal Transportation Conference September 29, 2016 2 WSDOT Local Programs
Monterey Road Complete Streets
 Monterey Road Complete Streets Complete Street Objectives Improve livability and economic vitality Enhance pedestrian environment Accommodate bicyclists safely Reduce noise and air pollution Create attractive,
Regional Transportation Needs Within Southeastern Wisconsin
 Regional Transportation Needs Within Southeastern Wisconsin #118274 May 24, 2006 1 Introduction The Southeastern Wisconsin Regional Planning Commission (SEWRPC) is the official areawide planning agency
BETHEL ROAD AND SEDGWICK ROAD CORRIDOR STUDY
 DRAFT PLAN City Council Meeting August 14, 2017 STUDY AREA Sedgwick Corridor State Route 160, principal arterial with Class 3 access management designation, commuter and freight route, connection to SR
Complete Streets Workshop Follow-up. April 27, 2011 Rockledge City Hall
 Complete Streets Workshop Follow-up April 27, 2011 Rockledge City Hall Agenda Complete Streets draft briefing presentation and sample policy language Share your Complete Streets projects and post workshop
2015 Florida Main Street Annual Conference. Complete Streets Equal Stronger Main Streets
 WHAT ARE COMPLETE STREETS? CASE STUDIES COMPLETING YOUR MAIN STREET 2015 Florida Main Street Annual Conference St. Petersburg, Florida August 19, 2015 WHAT ARE COMPLETE STREETS? CASE STUDIES COMPLETING
Transit-Driven Complete Streets
 Questions: Type questions into the box at bottom of webinar panel. Panelists for today s webinar: Nimotalai Azeez, Program Associate with the National Complete Streets Coalition Rich Weaver, Director of
Public Works AGENDA ITEM D-2 STAFF REPORT
 AGENDA ITEM D-2 Public Works STAFF REPORT Transportation Master Plan Oversight and Outreach Committee Meeting Date: 10/30/2017 Staff Report Number: 17-001-TMP Regular Business: Provide feedback on Performance
Chapter 14 PARLIER RELATIONSHIP TO CITY PLANS AND POLICIES. Recommendations to Improve Pedestrian Safety in the City of Parlier (2014)
") Chapter 14 PARLIER This chapter describes the current status and future plans for biking and walking in the City of Parlier. RELATIONSHIP TO CITY PLANS AND POLICIES The Parlier General Plan is the primary
Chapter 14 PARLIER This chapter describes the current status and future plans for biking and walking in the City of Parlier. RELATIONSHIP TO CITY PLANS AND POLICIES The Parlier General Plan is the primary
Typical Rush Hour Commute. PennyforTransportation.com
 Typical Rush Hour Commute In the News Overview of the Plan Collaborative plan with projects in every community Prioritizing connectivity and congestion relief Dedicated transportation-specific funding;
An Assessment of Potential Greenhouse Gas Emissions Reductions from Proposed On Street Bikeways
 An Assessment of Potential Greenhouse Gas Emissions Reductions from Proposed On Street Bikeways Through the Sustainable Bethlehem Initiative, the Town of Bethlehem has identified both the improvement of
Defining Purpose and Need
 Advanced Design Flexibility Pilot Workshop Session 4 Jack Broz, PE, HR Green May 5-6, 2010 Defining Purpose and Need In your agency s project development process, when do design engineers typically get
Tulsa Metropolitan Area LONG RANGE TRANSPORTATION PLAN
 Tulsa Metropolitan Area LONG RANGE TRANSPORTATION PLAN Indian Nations Council of Governments August 2005 CONTACTING INCOG In developing the Destination 2030 Long Range Transportation Plan, INCOG s Transportation
REGIONAL BICYCLE AND PEDESTRIAN DESIGN GUIDELINES
 REGIONAL BICYCLE AND PEDESTRIAN DESIGN GUIDELINES November 16, 2011 Deb Humphreys North Central Texas Council of Governments Bicycle and Pedestrian Advisory Committee Snapshot of the Guide 1. Introduction
What s Health Got to Do With It? Health and Land Use Planning
 What s Health Got to Do With It? Health and Land Use Planning CANDACE RUTT, PH.D. EXECUTIVE DIRECTOR APRIL 13 TH, 2016 Planning and Public Health Planning + Public Health Healthy Communities Healthier
Transportation Master Plan Advisory Task Force
 Transportation Master Plan Advisory Task Force Network Alternatives & Phasing Strategy February 2016 BACKGROUND Table of Contents BACKGROUND Purpose & Introduction 2 Linking the TMP to Key Council Approved
Prioritizing Transportation Policy and Funding for Active Transportation, Safety, Equity and Health
 Mayor Karl Dean, Chairman Prioritizing Transportation Policy and Funding for Active Transportation, Safety, Equity and Health Leslie A. Meehan, AICP Planning and Implementing the Active Community Webinar
Highway School, Ithaca NY
 Highway School, Ithaca NY June 1, 2009 Michael Ronkin Designing Streets for Pedestrians and Bicyclists 1 We know how to build right 6 Yet many roads are built like this 7 What is a Complete Street?
TOWN OF PORTLAND, CONNECTICUT COMPLETE STREETS POLICY
 TOWN OF PORTLAND, CONNECTICUT COMPLETE STREETS POLICY I. VISION, GOALS & PRINCIPLES VISION To improve the streets of Portland making them safer and more accessible for all users including pedestrians,
2. Context. Existing framework. The context. The challenge. Transport Strategy
 Transport Strategy Providing quality connections Contents 1. Introduction 2. Context 3. Long-term direction 4. Three-year priorities 5. Strategy tree Wellington City Council July 2006 1. Introduction Wellington
Real-Life Cost of Incomplete Streets
 Real-Life Cost of Incomplete Streets Presented by: Sheree Davis New Jersey Department of Transportation State Bicycle & Pedestrian Coordinator 609.530.6551 sheree.davis@dot.state.nj.us 2011 New Jersey
Complete Streets: Building Momentum in Connecticut
 Complete Streets: Building Momentum in Connecticut Tri-State Transportation Campaign, 2012 What are Complete Streets? Complete Streets are safe, comfortable, and convenient for travel for everyone, regardless
CONNECTING PEOPLE TO PLACES
 CONNECTING PEOPLE TO PLACES 82 EAST BENCH MASTER PLAN 07 Introduction The East Bench transportation system is a collection of slow moving, treelined residential streets and major arteries that are the
Outline. Safe Routes to School and Community Planning. School Basics. School Basics 1/12/2014
 Safe Routes to School and Community Planning Charlotte Claybrooke Safe Routes to School Coordinator Washington State Department of Transportation Seth Schromen-Wawrin Safe Routes to School Program Manager
NASHUA REGIONAL PLANNING COMMISSION REGIONAL BICYCLE AND PEDESTRIAN PLAN
 NASHUA REGIONAL PLANNING COMMISSION REGIONAL BICYCLE AND PEDESTRIAN PLAN June, 2005 Prepared by the Nashua Regional Planning Commission 2005 NRPC Regional Bicycle and Pedestrian Plan- JUNE 2005 ACKNOWLEDGEMENTS
Balboa Area Transportation Demand Management
 Balboa Area Transportation Demand Management April 2016 Presented by: Jeff Tumlin What Are We Aiming For? Transportation is not an end in itself. It is merely a means by which we support the community.
Brian D. Hare, P.E. Bureau of Design PennDOT PA APA Annual Conference Investing in a Sustainable Future October 5, 2009
 Brian D. Hare, P.E. Bureau of Design PennDOT 2009 PA APA Annual Conference Investing in a Sustainable Future October 5, 2009 1 What is Smart Transportation? Photographer: heyjude. Used through license
PEDESTRIAN ACTION PLAN
 ATTACHMENT 2 CITY OF SANTA MONICA PEDESTRIAN ACTION PLAN CITY OF SANTA MONICA PEDESTRIAN ACTION PLAN This page intentionally left blank EXECUTIVE SUMMARY CHAPTER 1 EXECUTIVE SUMMARY Setting the Stage
Rochester Downtown Bicycle Study 2009
 Rochester Downtown Bicycle Study 2009 Relationship of ROCOG Long Range Transportation Plan to Rochester Comprehensive Plan Regional Long Range Transportation Plan (LRTP) is prepared under the auspices
Purpose and Need. Chapter Introduction. 2.2 Project Purpose and Need Project Purpose Project Need
 Chapter 2 Purpose and Need 2.1 Introduction The El Camino Real Bus Rapid Transit (BRT) Project (Project) would make transit and other transportation improvements along a 17.6-mile segment of the El Camino
October 29, Modern traffic mitigation for development in cities: Moving beyond LOS
 Modern traffic mitigation for development in cities: Moving beyond LOS October 29, 2018 Modern traffic mitigation for development in cities: Moving beyond LOS State Smart Transportation Initiative Practical
TULARE COUNTY ASSOCIATION OF GOVERNMENTS
 TULARE COUNTY ASSOCIATION OF GOVERNMENTS Workshop: Creating Bikeable, Walkable Communities Wednesday, June 7, 2017 REVIEW OF THE 2016 REGIONAL ACTIVE TRANSPORTATION PLAN TCAG - 559-623-0450 210 N. Church
C C C
 C-012-001 Thank you for your support for the creation of new public space and nonmotorized access between downtown and the waterfront through the Overlook Walk, the East-West Connections, and the Promenade.
Creating Complete Streets to Accommodate All Users
 Creating Complete Streets to Accommodate All Users Peter Lagerwey, Toole Design Group plagerwey@tooledesign.com Brian Dougherty, Seattle DOT brian.dougherty@seattle.gov International Conference on Urban
Multimodal Transportation Plan
 Multimodal Transportation Plan The Multimodal Transportation Plan will accommodate MILLENIALS ARE DRIVING LESS. WE CANNOT BUILD OUR WAY all modes of transportation by keeping pedestrians, OUT OF CONGESTION.
Goal 3: Foster an environment of partnerships and collaboration to connect our communities and regions to one another.
 Non-Motorized Transportation Plan (NMTP) Draft Vision, Goal and,, Tri-County Regional Planning Commission (TCRPC) Purpose The purpose of the Tri-County Regional Planning Commission (TCRPC) Non-Motorized
San Jose Transportation Policy
 San Jose Transportation Policy Protected Intersections in LOS Policies to Support Smart Growth Presented by: Manuel Pineda City of San Jose Department of Transportation Bay Area Map San Francisco Oakland
El Paso County 2040 Major Transportation Corridors Plan
 El Paso County 2040 Major Transportation Corridors Plan Connect-our-County Online Transportation User Survey Preliminary Results June 24, 2010 Years of Residence 2. How many years have you LIVED HERE?
I-105 Corridor Sustainability Study (CSS)
") I-105 Corridor Sustainability Study (CSS) Metro Streets and Freeways Subcommittee March 21, 2019 Gary Hamrick Cambridge Systematics, Inc. I-105 CSS Project History & Background Funded by Caltrans Sustainable
I-105 Corridor Sustainability Study (CSS) Metro Streets and Freeways Subcommittee March 21, 2019 Gary Hamrick Cambridge Systematics, Inc. I-105 CSS Project History & Background Funded by Caltrans Sustainable
Cities Connect. Cities Connect! How Urbanity Supports Social Inclusion
 Cities Connect! How Urbanity Supports Social Inclusion Todd Litman Victoria Transport Policy Institute Metropolis Toronto, Canada - 14 June 2006 Cities Connect People with people. People with jobs. People
CITY OF COCOA BEACH 2025 COMPREHENSIVE PLAN. Section VIII Mobility Element Goals, Objectives, and Policies
 CITY OF COCOA BEACH 2025 COMPREHENSIVE PLAN Section VIII Mobility Element Goals, Objectives, and Policies Adopted August 6, 2015 by Ordinance No. 1591 VIII MOBILITY ELEMENT Table of Contents Page Number
5. Pedestrian System. Accomplishments Over the Past Five Years
 5. Pedestrian System Accomplishments Over the Past Five Years The Alamo Area Metropolitan Planning Organization (MPO) and its partner agencies recognize the importance of improving pedestrian mobility.
May 12, 2016 Metro Potential Ballot Measure Issue Brief: Local Return
 Summary: Local return is an important revenue source for cities to maintain their local transportation infrastructure. Most cities use their local return to operate small bus systems and repave streets,
USDOT Bicycle and Pedestrian Safety Initiative: Safer People and Safer Streets. Barbara McCann, USDOT Office of Policy
 { USDOT Bicycle and Pedestrian Safety Initiative: Safer People and Safer Streets Barbara McCann, USDOT Office of Policy 4 Steps from policy to practice Creating multi-modal streets means: 1. Change Decision-Making
EXECUTIVE SUMMARY. Vision
 Vision Walking and bicycling in Salt Lake City will be safe, convenient, comfortable, and viable transportation options that connect people to places, foster recreational and economic development opportunities,
Transportation and Health Tool
 Working together to evolve the Transportation and Health Tool APHA Webinar March 22, 2016 Ann Steedly, PE Overview THT Development Context Development of Indicators Strategies, Interventions & Policies
February 2018 HIGHWAY 316 IMPROVEMENTS PROJECT
 February 2018 HIGHWAY 316 IMPROVEMENTS PROJECT Agenda 1 2 3 4 5 A Message from the City Project Area Traffic Conditions Pedestrian/Bicycle Comfort & Safety Next Steps Q&A City of Hastings Supports a study
Safety & Convenience for All Users, in All Modes. Barbara McCann NCSL December 3, 2013
 Safety & Convenience for All Users, in All Modes Barbara McCann NCSL December 3, 2013 Safety & Convenience for All Users? Who was left out when this road was planned? Takaaki Iwabu for Raleigh News Observer
T1-A - Service Reduction (Re-sizing)
") Key T1-A Choice A Key T1-B Choice B Key T1-C Choice C Key T1-D Choice D Key T1-E Choice E Key T1-F Choice F Key Choice G T2 T1-A - Service Reduction (Re-sizing) Description This key choice would represent
Key T1-A Choice A Key T1-B Choice B Key T1-C Choice C Key T1-D Choice D Key T1-E Choice E Key T1-F Choice F Key Choice G T2 T1-A - Service Reduction (Re-sizing) Description This key choice would represent
PRINCE GEORGE S PLAZA METRO AREA PEDESTRIAN PLAN
 PRINCE GEORGE S PLAZA METRO AREA PEDESTRIAN PLAN May 28, 2008 Agenda Welcome and introductions Project overview and issue identification Planning context and strengths Design challenges and initial recommendations
Vision Public Workshop: Findings
 Vision Public Workshop: Findings Long Range Transportation Plan & Bicycle Mobility Plan February 2018 Vision Workshop South Kingstown 1/23/18 Providence 1/24/18 Newport 1/31/18 Long Range Transportation
NM-POLICY 1: Improve service levels, participation, and options for non-motorized transportation modes throughout the County.
 Transportation PRINCE WILLIAM COUNTY 2008 COMPREHENSIVE PLAN NON-MOTORIZED PLAN CONTENTS Goals, Policies, and Action Strategies Table 4 (Bike Facility Classifications and Descriptions) Table 5 (Bike Facility
Creating Livable Streets and Corridors (S526) Harrison Rue, ICF International APA Conference, Los Angeles April 16, 2012
 Harrison Rue, ICF International APA Conference, Los Angeles April 16, 2012") Creating Livable Streets and Corridors (S526) Harrison Rue, ICF International APA Conference, Los Angeles April 16, 2012 Overview What is livability in transportation? FHWA livability resources: a new
Creating Livable Streets and Corridors (S526) Harrison Rue, ICF International APA Conference, Los Angeles April 16, 2012 Overview What is livability in transportation? FHWA livability resources: a new
Measuring Success: Performance Metrics and Project Selection
 Measuring Success: Performance Metrics and Project Selection Fayetteville Mobility Plan Presented by: Jeffrey Tumlin March 19, 2018 How do we use transportation performance metrics? Improving efficiency
Complete Streets Chicago: Data Driven Design. Luann Hamilton Deputy Commissioner
 Complete Streets Chicago: Data Driven Design Luann Hamilton Deputy Commissioner AGENDA Chicago s goals Complete Streets & Sustainable Infrastructure Guides Data-Driven Planning Setting goals Scoping/research
SPEED MANAGEMENT FOR VISION ZERO
 SPEED MANAGEMENT FOR VISION ZERO LUANN HAMILTON, DEPUTY COMMISSIONER FOR PROJECT DEVELOPMENT CHICAGO DEPARTMENT OF TRANSPORTATION NACTO DESIGNING CITIES 2017 Vision Zero Action Plan Speed management and
WILMAPCO Public Opinion Survey Summary of Results
 Wilmington Area Planning Council WILMAPCO Public Opinion Survey Summary of Results Prepared by: 2955 Valmont Road, Suite 300 Boulder, Colorado 80301 t: 303-444-7863 f: 303-444-1145 www.n-r-c.com Table
WALKNBIKE DRAFT PLAN NASHVILLE, TENNESSEE EXECUTIVE SUMMARY NASHVILLE, TENNESSEE
 NASHVILLE, TENNESSEE EXECUTIVE SUMMARY Executive Summary A world-class multi-modal transportation system is essential to a vibrant city and better quality of life. -Mayor Barry The WalknBike plan aims
SUMMARY OF TRANSPORTATION INVESTMENTS
 Santa Cruz County 2016 Measure D: Transportation Improvement Expenditure Plan - Approved by over 2/3 of Santa Cruz County voters on November 8, 2016 - Overview Measure D, the 2016 Transportation Improvement
Multimodal Through Corridors and Placemaking Corridors
 68 Multimodal Through Corridors and Placemaking Corridors Corridors have different functions in a region. Some corridors are used to get smoothly and rapidly through a region or to get quickly to major
Multimodal Analysis in the 2010 Highway Capacity Manual
 Multimodal Analysis in the 2010 Highway Capacity Manual It s not just cars anymore! Jamie Parks, AICP HCAT Conference May 9-10, 2011 Multimodal LOS in the 2010 HCM History and background Overview of methods
FACTS AND FIGURES: MAKING THE CASE FOR COMPLETE STREETS IN LEE COUNTY
 FACTS AND FIGURES: MAKING THE CASE FOR COMPLETE STREETS IN LEE COUNTY Safety: Close to 5,000 pedestrians and bicyclists die each year on U.S. roads, and more than 70,000 are injured. [Mean Streets, Surface
A Traffic Operations Method for Assessing Automobile and Bicycle Shared Roadways
 A Traffic Operations Method for Assessing Automobile and Bicycle Shared Roadways A Thesis Proposal By James A. Robertson Submitted to the Office of Graduate Studies Texas A&M University in partial fulfillment
SF Transportation Plan Update
 SF Transportation Plan Update CAC Meeting #11 Existing Conditions and Future Baseline Needs Revised, Part I www.sfcta.org/movesmartsf twitter.com/sanfranciscota www.facebook.com/movesmartsf January 30,
Agenda. Overview PRINCE GEORGE S PLAZA METRO AREA PEDESTRIAN PLAN
 PRINCE GEORGE S PLAZA METRO AREA PEDESTRIAN PLAN May 28, 2008 Agenda Welcome and introductions Project overview and issue identification Planning context and strengths Design challenges and initial recommendations
Active Transportation Infrastructure Investment A Business Case
 Active Transportation Infrastructure Investment A Business Case In 2016, the Real Estate Foundation awarded the Capital Regional District a $50,000 grant for Shifting Gears: Land Use Change through Active
Operationalizing Accessibility
 Operationalizing Accessibility March 30, 2017 Chris McCahill State Smart Transportation Initiative Matt Pettit Citilabs State Smart Transportation Initiative A network of reform-oriented state DOTs, founded
Performance Metrics: [Making lemonade out of federal and state Requirements]
![Performance Metrics: [Making lemonade out of federal and state Requirements]](/thumbs/86/93321209.jpg "Performance Metrics: [Making lemonade out of federal and state Requirements]") Performance Metrics: [Making lemonade out of federal and state Requirements] AMPO Performance Panel I October 18, 2017 Jeff Pollack, AICP, ENV SP Transportation Planning Director, Corpus Christi MPO Member
Performance Metrics: [Making lemonade out of federal and state Requirements] AMPO Performance Panel I October 18, 2017 Jeff Pollack, AICP, ENV SP Transportation Planning Director, Corpus Christi MPO Member