IMPROVING SAFETY AT SIGNALIZED INTERSECTIONS NEAR ERTICAL CURVES
|
|
|
- Evan Glenn
- 6 years ago
- Views:
Transcription
1 1. Report No. FHWA/TX-05/ Title and Subtitle 2. Government Accession No. 3. Recipient's Catalog No. IMPROVING SAFETY AT SIGNALIZED INTERSECTIONS NEAR ERTICAL CURVES Technical Report Documentation Page 5. Report Date September 2004 V 6. Performing Organization Code 7. Author(s) Paul A. Barricklow, Marc S. Jacobson, and Dominique Lord 9. Performing Organization Name and Address Texas Transportation Institute The Texas A&M University System College Station, Texas Sponsoring Agency Name and Address Texas Department of Transportation Research and Technology Implementation Office P. O. Box 5080 Austin, Texas Performing Organization Report No. Report Work Unit No. (TRAIS) 11. Contract or Grant No. Project Type of Report and Period Covered Technical Report: September 2002-August Sponsoring Agency Code 15. Supplementary Notes Project performed in cooperation with the Texas Department of Transportation and the Federal Highway Administration. Project Title: Countermeasures to Reduce Crashes at Signalized Intersections near Vertical Curves URL: Abstract The research described herein documents an investigation into countermeasures that can be used to provide motorists with advance notification of traffic signals or queues from those signals that are located beyond the motorists line of sight due to a crest vertical curve. Whereas standard roadway design ensures that stopping sight distance (SSD) is provided at all locations along a roadway, there is no standard established for when decision sight distance (DSD) is needed with respect to traffic signals. A reduced decision zone (RDZ) was identified in the research as the location along a roadway with a vertical curve and a traffic signal beyond the curve where SSD is provided but DSD is not. Essentially, motorists within the RDZ are provided with SSD for unexpected stopping but are not provided with the added decisionmaking and response time that DSD might otherwise provide as they approach the vertical curve and the downstream traffic signal. Contained within this report are techniques for determining whether an RDZ exists along an existing roadway or has the potential to exist in a proposed design. It is suggested that intersections not be located within the RDZ. In cases where a traffic signal or queue from a signal is located within the RDZ for an existing roadway, guidance is provided on both the type and location of countermeasures that can be used. Results of field tests conducted using both the suggested type and location of advance warning sign countermeasures are included within this report and its appendix. 17. Key Words Signal, Vertical Curve, Sight Distance 19. Security Classif.(of this report) Unclassified Form DOT F (8-72) 20. Security Classif.(of this page) Unclassified Reproduction of completed page authorized 18. Distribution Statement No restrictions. This document is available to the public through NTIS: National Technical Information Service Springfield, Virginia No. of Pages Price
2
3 IMPROVING SAFETY AT SIGNALIZED INTERSECTIONS NEAR VERTICAL CURVES by Paul A. Barricklow Assistant Transportation Researcher Texas Transportation Institute Marc S. Jacobson, P.E. Assistant Research Engineer Texas Transportation Institute and Dominique Lord, Ph.D. Associate Research Scientist Texas Transportation Institute Report Project Project Title: Countermeasures to Reduce Crashes at Signalized Intersections near Vertical Curves Performed in cooperation with the Texas Department of Transportation and the Federal Highway Administration September 2004 TEXAS TRANSPORTATION INSTITUTE The Texas A&M University System College Station, Texas
4
5 DISCLAIMER The contents of this report reflect the views of the authors, who are solely responsible for the facts and accuracy of the data, opinions, and conclusions presented herein. The contents do not necessarily reflect the official views or policies of the Texas Department of Transportation (TxDOT) or the Federal Highway Administration (FHWA). This report does not constitute a standard or regulation, and its contents are not intended for construction, bidding, or permit purposes. The names of specific products or manufacturers listed herein do not imply endorsement of these products or manufacturers. The engineer in charge of this project was Marc S. Jacobson, P.E. (Texas #89335). The United States Government and the State of Texas do not endorse products or manufacturers. Trade or manufacturers names may appear herein solely because they are considered essential to the object of this report. v
6 ACKNOWLEDGMENTS This research was conducted during a two-year project under a cooperative research program between the Texas Transportation Institute (TTI), TxDOT, and FHWA. Imelda Barrett of the TxDOT Austin District was the project director (PD). Other TxDOT members of the Project Monitoring Committee included Brian Van De Walle, David Mitchell, Chuck Ansley, Arnold Ramirez (retired), Bill Tucker (retired), and Peter Eng. Ali Mozdbar of the City of Austin, Texas, also served on the Project Monitoring Committee. Tom Beeman of the Traffic Operations Division was the program coordinator, and Wade Odell of TxDOT s Research and Technology Implementation Office was an active participant in project management meetings. Angelia Parham, Michael Martello, Gary Barricklow, Mark Wooldridge, and Hassan Charara of TTI also contributed to the materials used in this report. Angelia Parham and Mike Martello helped with literature and site reviews, Mark Wooldridge provided guidance on data collection techniques, Hassan Charara assisted with field implementation, and Gary Barricklow conducted field studies. vi
7 TABLE OF CONTENTS Page LIST OF FIGURES... ix LIST OF TABLES...x CHAPTER 1. INTRODUCTION... 1 PROJECT OVERVIEW... 1 RESEARCH OBJECTIVES... 2 SCOPE OF RESEARCH... 2 CHAPTER 2. LITERATURE REVIEW AND CURRENT PRACTICE... 3 LITERATURE REVIEW... 3 Current Guidelines Provided by the TMUTCD... 3 Studies Related to the Use of Countermeasures... 3 STATE-OF-THE-PRACTICE SURVEYS... 7 Electronic Mail Survey to TxDOT Districts... 7 Telephone Survey to Other State Transportation Departments CHAPTER 3. GUIDELINES FOR THE USE OF DECISION SIGHT DISTANCE IN INTERSECTION DESIGN EXISTING PRACTICE AND GUIDELINES Stopping Sight Distance Decision Sight Distance Existing Vertical Curve Design PROPOSED GUIDELINES FOR USING DECISION SIGHT DISTANCE IN INTERSECTION DESIGN GUIDELINES FOR USING DECISION SIGHT DISTANCE IN INTERSECTION OPERATIONS/SAFETY ANALYSIS CHAPTER 4. GUIDELINES FOR THE USE OF COUNTERMEASURES TO REDUCE CRASHES ON APPROACHES TO SIGNALIZED INTERSECTIONS NEAR VERTICAL CURVES TMUTCD STANDARDS AND GUIDANCE REVIEW OF POTENTIAL COUNTERMEASURES Symbolic SIGNAL AHEAD Warning Signs BE PREPARED TO STOP Warning Signs WATCH FOR STOPPED VEHICLES Warning Signs Additional Countermeasures RECOMMENDED GUIDELINES FOR THE USE OF COUNTERMEASURES CHAPTER 5. CANDIDATE LOCATIONS WHERE CRASHES DUE TO VERTICAL ALIGNMENT ARE LIKELY TXDOT SURVEY AND STUDY SITE SELECTION CRASH STATISTICS vii
8 SELECTED FIELD STUDY SITES NB Loop 360 at Walsh-Tarlton WB RM 620 at Comanche Trail NB US 281 at Bulverde Road CHAPTER 6. STUDY DESIGN FOR COUNTERMEASURE EVALUATION COUNTERMEASURE STUDY DESIGN Data Collection Techniques BEFORE FIELD DATA COLLECTION Site 1: NB Loop 360 at Walsh-Tarlton Site 2: WB RM 620 at Comanche Trail Site 3: NB US 281 at Bulverde Road AFTER FIELD DATA COLLECTION Site 1: NB Loop 360 at Walsh-Tarlton Site 2: WB RM 620 at Comanche Trail Site 3: NB US 281 at Bulverde Road CHAPTER 7. RESULTS OF THE COUNTERMEASURE EVALUATION CHAPTER 8. CONCLUSIONS AND RECOMMENDATIONS REFERENCES APPENDIX viii
9 LIST OF FIGURES Page Figure 1. Advance Warning Signs Used in Ohio Study (2)... 4 Figure 2. Electronic Mail Survey Distributed to the 25 TxDOT Districts... 8 Figure 3. Design of Typical Vertical Curve from TxDOT Roadway Design Manual (11) Figure 4. Minimum Lengths of Vertical Curves to Provide Stopping Sight Distance from TxDOT Roadway Design Manual (11) Figure 5. Reduced Decision Zone Location for Rural Roadway Applications Figure 6. Reduced Decision Zone Location for Urban Roadway Applications Figure 7. Reduced Sight Distance on the Approach to Signalized Intersections near Vertical Curves Figure 8. Uses of the Symbolic SIGNAL AHEAD Warning Sign Figure 9. Uses of the BE PREPARED TO STOP Family of Signs Figure 10. Uses of the WATCH FOR STOPPED VEHICLES Sign Figure 11. Countermeasure Placement Location for Rural Roadway Applications Figure 12. Countermeasure Placement Location for Urban Roadway Applications Figure 13. Dynamic Message Sign as Advance Warning of a Signalized Intersection near a Vertical Curve Figure 14. Crash Rate Comparison for Sites with and without Decision Sight Distance Figure 15. Crash Rate versus Sight Distance for Study Sites Figure 16. Northbound Loop 360 at Walsh-Tarlton Figure 17. Westbound RM 620 at Comanche Trail Figure 18. Northbound US 281 at Bulverde Road Figure 19. Study Sites and Deployed Countermeasures Figure 20. HI-STAR Data Collector (Credit Card as Size Reference) Figure 21. HI-STAR Deployed in a Traffic Lane Figure 22. Observation Number versus Observed Speed Site Figure 23. Speed Data for NB Loop 360 at Walsh-Tarlton Figure 24. Before Speed Data for NB Loop 360 at Walsh Tarlton Figure 25. Before Speed Data for WB RM 620 at Comanche Trail Figure 26. Before Speed Data for NB US 281 at Bulverde Road Figure 27. Study Signing (Dual Symbolic SIGNAL AHEAD Signs) Installed at Site Figure 28. After Speed Data for NB Loop 360 at Walsh-Tarlton Figure 29. Study Signing (BE PREPARED TO STOP) Installed at Site Figure 30. After Speed Data for WB RM 620 at Comanche Trail Figure 31. Before-and-After Speed Comparison at Site Figure 32. Before-and-After Speed Comparison at Site ix
10 LIST OF TABLES Page Table 1. TMUTCD Guidelines for the Need and Placement of SIGNAL AHEAD Signs (1) Table 2. Potential Effectiveness of Intersection Countermeasures (Derived from 8) Table 3. Results from the Electronic Mail Survey Sent to TxDOT Districts Table 4. Recommended Stopping Sight Distance Guidelines Provided by AASHTO (10) Table 5. Decision Sight Distance Guidelines Provided by AASHTO (10) Table 6. Potential Field Study Sites Table 7. Average Before Speed Data for NB Loop 360 at Walsh-Tarlton Table 8. Average Before Speed Data for WB RM 620 at Comanche Trail Table 9. Average Before Speed Data for NB US 281 at Bulverde Road Table 10. Average After Speed Data for NB Loop 360 at Walsh-Tarlton Table 11. Average After Speed Data for WB RM 620 at Comanche Trail Table 12. Statistical Comparison of Before-and-After Speeds at Site Table 13. Statistical Comparison of Before-and-After Speeds at Site x
11 CHAPTER 1. INTRODUCTION PROJECT OVERVIEW Within the state of Texas, the standards and guidelines provided in the Texas Manual on Uniform Traffic Control Devices, or TMUTCD (1), direct most of the decision making concerning the type and placement of roadside signing. However, there are some instances where complexities of the driving environment indicate that supplemental devices be used even beyond those required and suggested by the TMUTCD. In the case where signalized intersections are located beyond crest vertical curves, the TMUTCD provides for upstream use of SIGNAL AHEAD text or symbolic advance warning signing where the signal heads for the intersection are not visible for some minimum distance upstream of the intersection. However, with the TMUTCD s placement distances of SIGNAL AHEAD advance warning signs ranging up to only 650 feet (for a speed of 65 miles per hour) from the primary traffic control device (i.e., the traffic signal), there exists the possibility that even the advance warning sign is not fully visible to motorists approaching the intersection because their line of sight is limited by the vertical curve upstream of the signal. Also, the queue of vehicles from the signal may extend far enough back from the signal that even where an advance warning sign is provided, there is insufficient notice to approaching motorists that a queue is likely to exist either on or beyond the vertical curve. The research described herein documents an investigation into countermeasures that can be used to provide motorists with advance notification of traffic signals or queues from those signals that are located beyond the motorists line of sight due to a vertical curve. Whereas standard roadway design ensures that stopping sight distance (SSD) is provided at all locations along a roadway, there is no standard established for when decision sight distance (DSD) is needed with respect to traffic signals. A reduced decision zone (RDZ) was identified in the research as the location along a roadway with a vertical curve and a traffic signal beyond the curve where SSD is provided but DSD is not. Essentially, motorists within the RDZ are provided with SSD for unexpected stopping but are not provided with the added decision-making and response time that DSD might otherwise provide as they approach the vertical curve and the downstream traffic signal. Contained within this report are techniques for determining whether an RDZ exists along an existing roadway or has the potential to exist in a proposed design. Research suggests that intersections should not be located within the RDZ. In cases where a traffic signal or queue from a signal is located within the RDZ for an existing roadway, guidance is provided on both the type and location of countermeasures that can be used. Results of field tests conducted using both the suggested type and location of advance warning sign countermeasures are included within this report and its appendix. 1
12 RESEARCH OBJECTIVES This two-year effort had four unique research objectives, including: 1. determine whether crash rates at intersections located beyond vertical curves experience higher than normal crash rates, 2. field test promising countermeasures, 3. develop criteria for the use of DSD in intersection design, and 4. develop guidelines for the use of countermeasures at existing intersections located proximate to vertical curves. SCOPE OF RESEARCH The proposed research was designed to supplement rather than test or suggest replacement of existing provisions in the TMUTCD or Texas Department of Transportation (TxDOT) roadway design manuals. Research was specifically focused on approaches to signalized intersections where vertical curves along the approach have the potential to limit motorists perception of the signal or a queue that may exist at the signal. With respect to supplemental use of advance warning signing, both the field tests conducted during the course of this project and the recommendations from the research were designed to not be in conflict with the TMUTCD. With respect to intersection and roadway design, the research offers suggestions as to spacing between signalized intersections and vertical curves. 2
13 CHAPTER 2. LITERATURE REVIEW AND CURRENT PRACTICE This chapter summarizes the results of the literature review and a survey of transportation professionals both within TxDOT and around the country on issues relating to signalized intersections located proximate to vertical curves. LITERATURE REVIEW An extensive literature search examined many national and in-state research efforts focused on reducing crashes at signalized intersections located at or near the bottom of crest vertical curves. While studies that specifically looked at signalized intersections near vertical curves were not found, research related to the use of countermeasures to increase motorist awareness was identified as described in the following sections. Current Guidelines Provided by the TMUTCD Regardless of the existence of a nearby vertical curve, it is often necessary to alert motorists to the presence of an upcoming traffic signal. Locations with either permanent or intermittent sight distance obstructions and locations where a traffic signal might not be expected, such as the first signal as you enter a town, would be candidates for either a text (TMUTCD designation W3-3a) or symbolic (TMUTCD designation W3-3) SIGNAL AHEAD warning sign. Guidelines for the use and placement of such signs are provided in the TMUTCD (1). The TMUTCD states that the SIGNAL AHEAD warning sign should be used when there is insufficient visibility distance for motorist to correctly respond to the traffic control device. At a signalized intersection, it is necessary for the motorist to be able to continuously view at least two signal faces for the approach that he/she is traveling on for the distances specified in Table 1. The TMUTCD allows for a warning beacon or beacons to be installed in conjunction with the SIGNAL AHEAD sign. In addition, a BE PREPARED TO STOP (TMUTCD designation W20-7b) sign with or without warning flashers can be installed on those approaches where significant queuing or stopped traffic results at the traffic signal. Although not mandatory by the guidelines, it is suggested that a WHEN FLASHING supplemental plaque be used when the flashers on the BE PREPARED TO STOP sign are interconnected with the traffic signal or a queue detection device. Studies Related to the Use of Countermeasures In many cases the signalized intersection will not be clearly visible due to the crest of the preceding vertical curve. In this situation additional countermeasures may be needed to provide adequate warning time. These devices could range from a simple SIGNAL AHEAD sign to an active warning sign that provides information on the current state of the traffic signal. The effectiveness of a variety of countermeasures has been researched in several studies, some of which are documented in the following paragraphs. 3
14 Table 1. TMUTCD Guidelines for the Need and Placement of SIGNAL AHEAD Signs (1). 85th Percentile Speed (mph) Visibility Distance (ft) [Table 4D-1] Sign Placement (ft) [Table 2C-4] The minimum distance required for a motorist to see two signal faces on the approach to the signalized intersection. In locations where visibility is diminished, a SIGNAL AHEAD sign should be used. 2 Placement location for signs warning of a potential stop situation. The distances are based on the 1990 AASHTO policy for stopping sight distance providing a PIEV time of 2.5 seconds, friction factor of 0.30 to 0.40, minus the sign legibility distance 175 ft. The distances are adjusted for a sign legibility distance of 175 ft, which is the appropriate legibility distance for a 5 in Series D word legend. The distances may be adjusted by deducting another 100 ft if symbol signs are used. Adjustments may be made for grades if appropriate. A study in Ohio compared driver s reaction to the existing Passive Symbolic SIGNAL AHEAD sign (PSSA), a Prepare To Stop When Flashing sign (PTSWF), a Flashing Symbolic SIGNAL AHEAD sign (FSSA), and a Continuously Flashing Symbolic SIGNAL AHEAD sign (CFSSA). Examples of the signs used are presented in Figure 1. In this study the flashers on the PTSWF and FSSA signs were tied to the traffic signal and would begin to flash a few seconds before the yellow interval until the end of the red interval. The warning flashers on the CFSSA sign would always flash regardless of the state of the traffic signal (2). Figure 1. Advance Warning Signs Used in Ohio Study (2). 4
15 The study found that the CFSSA produced results similar to the standard PSSA sign. The PTSWF and FSSA signs were effective in reducing approach speeds during the red interval and reducing red-light violations; however, the use of these signs tended to increase approach speeds during the green interval when the signal state was clearly visible from the sign location (2). A study in British Columbia using similar signs as those used in Ohio found that the use of active warning flashers lowers the frequency of accidents at an intersection, in addition to the benefits found in the previous study. However, further testing was deemed necessary to determine if this reduction was statistically significant (3). A Minnesota study conducted in 1992 examined the effectiveness of advance warning flashers (AWF) used in that state on approaches to high-speed or otherwise unusual signalized intersections. The warning flasher consisted of a BE PREPARED TO STOP sign with supplemental WHEN FLASHING plaque and two amber flashers that would begin to flash a few seconds before the end of the green phase on the approach. The flashing would continue through the yellow and red phases on the approach. The purpose of these warning devices was to assist motorists in deciding if it was safe to proceed to the intersection at speed or if they should begin to lower their speed to facilitate stopping at the intersection (4). The study examined approach speeds at three locations with and without the AWF system installed based on the current signal indication displayed. The results found that locations with the AWF system experienced higher speeds during the yellow change interval than the non-awf locations. Overall, speeds at the non-awf locations were lower than those at the AWF-equipped locations. Red-light violations were greater at locations where no AWF system was installed. A before-and-after examination of accident rates found that the AWF tended to reduce the accident rate down to the area average for signalized intersections at those locations where the accident rate prior to the AWF installation was greater than the area average (4). In summary, the researchers recommended the AWF system only at those locations where a specific need had been identified. Such locations would include those that are experiencing above average rates of rear-end and angle collisions. The installation of the AWF system was not recommended only in anticipation of a future problem (4). A follow-up study conducted in 2001 found that activating the warning flashers either 2.0 seconds before the yellow or 3.5 seconds before the yellow resulted in more cautious behavior of drivers on the approach. This was measured by examining deceleration rates and braking pressure applied in a simulated environment. Researchers noted that approach speeds were reduced on approaches with AWF when the system was flashing (5). A similar study conducted by the Texas Transportation Institute (TTI) examined the use of an Advance Warning for End of Green System (AWEGS). This system uses the BE PREPARED TO STOP with the WHEN FLASHING supplemental plaque and two flashers to alert motorists when a signal is about to change from green to yellow. Unlike the AWF system in Minnesota, the Texas AWEGS can also extend the green phase based on a vehicle s approach speed to ensure that the vehicle does not get trapped in the dilemma zone. The study found that 5
16 AWEGS were effective in reducing red-light running at the intersection and should be considered in locations that currently experience a high level of red-light violations (6). A Minnesota study examined the use of in-lane rumble strips to alert motorists to a change in traffic control ahead. These devices were installed in the pavement across the travel lane and were usually half of the width of the lane and centered in the lane. The results indicated that the rumble strips did not significantly decrease accidents. Further, over saturation of rumble strips in an area tended to limit their effectiveness; therefore, the rumble strips are only recommended for limited locations where other countermeasures, such as signing, have already been implemented (7). A recent summary of the effectiveness of countermeasures to improve intersection safety was assembled by the Federal Highway Administration and the Institute of Transportation Engineers. The information is qualified (as stated in the publication) by the fact that some of the countermeasures have only been studied a few times and that a consensus on the effectiveness of the measures has not been reached. Also, some of the effectiveness information is based on older studies (8). Summary statistics for those countermeasures that can be considered either directly or indirectly applicable to the advance warning of signals beyond vertical curves are shown in Table 2 below. Table 2. Potential Effectiveness of Intersection Countermeasures (Derived from 8). Improvement Type Advance Warning of Signal Changes at Rural Locations Install Flashing Beacon in Advance of Intersection Install Additional Signal Heads Move Intersection Away from Curve** Horizontal/Vertical Realignment of Approaches** Install SIGNAL AHEAD Sign Install Rumble Strips on Intersection Approaches Rumble Strips & SIGNAL AHEAD Sign & Pavement Markings with Message SIGNAL AHEAD Cost Total Crashes Right- Angle Crashes Potential Effectiveness (Percent Reduction) Rear-End Sideswipe Crashes Red-Light Running Medium * * * * Medium * Older Drivers Medium * * * High 25 * * * High * Low * * *` 2-44 * Medium * * Relationship indicated but no specific benefit cited. ** Effectiveness reported associated with unsignalized intersection only. 6
17 STATE-OF-THE-PRACTICE SURVEYS In order to determine the current practice being used in Texas and throughout the country with regard to signalized intersections near vertical curves, a survey of the various districts within the TxDOT was conducted. In addition, several departments of transportation from other states were contacted to determine what practices or guidelines, if any, were being used. This section presents results from each survey. Electronic Mail Survey to TxDOT Districts A survey was distributed to all 25 TxDOT districts in February 2003 to determine what countermeasures, if any, are currently being used to reduce crashes at signalized intersections near vertical curves. The survey was distributed by electronic mail from the TxDOT Traffic Operations Division staff. Each district was asked to provide the following information with regard to signalized intersections near crest vertical curves in their district: location (city, roadway, mile marker, etc.), description of location (i.e., rural, urban, number of turn lanes, high speed, low or high volume, etc.), crash history, types of countermeasures used or considered, and the effectiveness of the countermeasure. An example of the survey is shown in Figure 2. Responses were received from 7 of the 25 districts. In all but three cases, the districts responded that they did not have any locations that met the needs of this project. The Abilene, Atlanta, and San Angelo Districts indicated a total of four locations for further study. Those locations are listed in Table 3. Table 3. Results from the Electronic Mail Survey Sent to TxDOT Districts. District Location Countermeasures Abilene SH 36 at Loop 322 INTERSECTION AHEAD sign with beacon changed to SIGNAL AHEAD sign with beacon Atlanta US 59 at SH 43 Overhead dynamic message sign (interconnected with traffic signal) and speed display Atlanta US 59 at Loop 390 Overhead dynamic message sign (interconnected with traffic signal) and speed display San Angelo US 67 at FM 2288 SIGNAL AHEAD warning sign with flashing beacons installed on mast arm The three districts that provided locations all indicated that they felt the devices had improved safety at the locations, though no formal study had been conducted to document improvements. The displays that have been installed in the Atlanta District represent a unique case where a device other than the SIGNAL AHEAD and BE PREPARED TO STOP warning signs have been used to alert motorists to the potential need to stop. 7
18 Figure 2. Electronic Mail Survey Distributed to the 25 TxDOT Districts. 8
19 Figure 2. Electronic Mail Survey Distributed to the 25 TxDOT Districts (continued). 9
20 Telephone Survey to Other State Transportation Departments Due to the limited response that was received from within Texas, researchers contacted the transportation departments of several other states to determine what type of countermeasures are in use at signalized intersections near vertical curves. The following questions were asked of each respondent: 1. Are any special countermeasures used when there is a signal located near a vertical curve and, if so, what type? 2. Has the procedure for using this countermeasure been documented somewhere (i.e., a design manual)? If so, could we get a copy of the pertinent information (preferably by fax)? 3. Have there been any evaluations performed to determine the effectiveness of the countermeasure? If so, who performed the analysis and can we get a copy? 4. How long have these countermeasures been used in this area? The following states sent responses: California, Colorado, Idaho, Kentucky, Nevada, New Jersey, New York, North Carolina, Ohio, Oklahoma, Vermont, Washington, West Virginia, and Wyoming. The most common response was that the only countermeasures that are used are the SIGNAL AHEAD warning sign and the BE PREPARED TO STOP warning sign with or without flashing beacons as described in the Manual on Uniform Traffic Control Devices (MUTCD)(9). These sign locations varied from side-of-the-road pole mounts to overhead mastarm mounts. In addition to this typical response, some additional countermeasures were mentioned by some of the states. Those responses included: Wyoming and Colorado use reduced speed limit zones on the approaches to some signals that are near vertical curves. Vermont indicated that it uses supplemental high-mounted signal heads and transverse (in-lane) rumble strips at some locations. Nevada uses a video detection system in conjunction with its advance warning sign to activate the flashing beacons on the sign based on the presence of a queue. California has used larger fonts on some signs on the approaches to signals near vertical curves based on recommendations from their Older Driver Guide. In addition, California was considering the use of a dynamic message sign (DMS) on a freeway to alert exiting motorists when there was a queue from the ramp signal. In almost every case, the MUTCD (9) was stated as the guiding document for deciding when a countermeasure was needed and where it should be placed. Most respondents indicated that no research study on the effectiveness of a particular countermeasure installation is performed. However, several respondents referenced general studies on the impacts of signing that their state had conducted. 10
21 CHAPTER 3. GUIDELINES FOR THE USE OF DECISION SIGHT DISTANCE IN INTERSECTION DESIGN As a motorist travels any stretch of roadway, there is a certain distance ahead of the motorist s vehicle that can be clearly seen. This distance is known as the sight distance at a particular location along the roadway. The sight distance at a point is dependent upon the direction of travel of the vehicle. In order to safely travel a given route, a motorist must be able to see a potentially harmful object or situation, comprehend the required action needed to avoid a collision, and take the appropriate action. The combination of these three steps results in guidelines for minimum sight distance required in certain situations. These guidelines are provided in A Policy on Geometric Design of Highways and Streets, better known as the Green Book, published by the American Association of State Highway and Transportation Officials (AASHTO) (10). EXISTING PRACTICE AND GUIDELINES Stopping Sight Distance The most basic sight distance guideline provided is SSD. The SSD is the distance required, at a given speed, for a motorist to recognize a stationary object in the roadway and come to a complete stop prior to striking the object. Based on previous studies, AASHTO recommends using a perception-reaction time of 2.5 seconds and a deceleration rate of 11 feet per second squared. In addition, a driver s eye height of 3.5 feet and an object height of 2.0 feet are recommended. Using these recommended values, the design guidelines for required SSD at various speeds are shown in Table 4 (10). Table 4. Recommended Stopping Sight Distance Guidelines Provided by AASHTO (10). Design Speed (mph) Stopping Sight Distance (ft)
22 Decision Sight Distance While the provision of SSD should be sufficient in most cases for the average driver to comprehend a possible conflict and appropriately react, there are circumstances where additional sight distance is needed. When additional distance is necessary, the guidelines for DSD should be used. The TxDOT Roadway Design Manual defines DSD as follows: Decision sight distance is the distance required for a driver to detect an unexpected or otherwise difficult-to-perceive information source, recognize the source, select an appropriate speed and path, and initiate and complete the required maneuver safely and efficiently (10). The main difference between the DSD and SSD criteria is the complexity of the situation that the driver is faced with. The added complexity requires additional perception-reaction time prior to applying the brakes to begin to slow the vehicle to a stop. The existing guidance as to when DSD should be used rather than SSD is rather vague. However, signalized intersections near crest vertical curves present a wide range of complexities that emphasize the need to provide DSD. Unexpected or unusual situations that a driver approaching a signalized intersection on the far side of a crest vertical curve may experience include: The intersection and traffic signals are not visible; however, the back of the queue from the signalized intersection is reached. The intersection and traffic signals are not visible, and the queue on the downgrade of the curve is not visible. The queue on the downgrade of the curve is not visible, but signal head(s) at the downstream intersection is (are) visible; the queue would be especially unexpected if the visible signal head was green. Under normal driving conditions (i.e., in the absence of a vertical curve), objects downstream of the driver are visible and discernable in a sequential manner. This allows the driver to comprehend and react to each object one at a time. However, because the crest of a vertical curve can limit the driver s sight distance, several objects downstream of the crest become visible at one time as the driver passes through the zone of decreased visibility. Objects could include driveways, billboards, street lighting, roadway geometry changes (e.g., left turn pockets), stopped vehicles, traffic signals, etc. Under this circumstance, the driver is required to process and respond to each object simultaneously. The additional demand placed on the driver is translated into additional time needed before the appropriate reaction can be made. AASHTO s Green Book (10) provides guidelines on the minimum sight distance required to account for the increased decision time needed for complex maneuvers and various design speeds. The guidelines are provide for different types of maneuvers, but those that are applicable to the signal-near-vertical-curve scenario are Case A, stop on a rural road, and Case B, stop on an urban road. For rural roads, an additional 0.5 seconds of reaction time is provided over the normal 2.5 seconds provided for SSD. For roads in urban areas, the additional time provided jumps to 9 seconds. The reason for the large jump in reaction time is presumed to be the large increase in the number of objects competing for the driver s attention that exist in the urban (or 12
23 suburban/urban fringe) environment and that are not present in rural environments. The Green Book guidelines are shown in Table 5 (10). Table 5. Decision Sight Distance Guidelines Provided by AASHTO (10). Decision Sight Distance (ft) Design Speed Avoidance Maneuver (mph) A B Avoidance Maneuver A: Stop on Rural Road t = 3.0 s Avoidance Maneuver B: Stop on Urban Road t = 9.1 s Due to the additional complexities that the driver is faced with as he or she approaches a signalized intersection near a vertical curve, it is recommended that, whenever possible, DSD be provided on the approach to the signalized intersection. If DSD is not or cannot be provided, an advance warning device should be used to alert motorists before they enter the zone along the approach where DSD is not provided. Existing Vertical Curve Design The AASHTO Green Book (10) provides guidelines for the design of vertical curves on highways and streets. The TxDOT Roadway Design Manual (11) follows the same guidelines as those presented in the Green Book. Vertical curves are designed as simple parabolas such as the one shown in Figure 3. Restrictions are placed on the minimum length of vertical curve, L, that can be used to connect two given grades at a given design speed. These restrictions are based on ensuring that SSD is provided at all points along the curve. Figure 4 is the chart that is used to determine the minimum length of vertical curve, L, that can be used for a given design speed, V, and algebraic difference in grade, A (11). 13
24 Figure 3. Design of Typical Vertical Curve from TxDOT Roadway Design Manual (11). 14
25 Figure 4. Minimum Lengths of Vertical Curves to Provide Stopping Sight Distance from TxDOT Roadway Design Manual (11). PROPOSED GUIDELINES FOR USING DECISION SIGHT DISTANCE IN INTERSECTION DESIGN Vertical curves that are designed based on the minimum values provided in Figure 3 are adequate in most situations because they ensure that SSD is provided. However, in those locations where signalized intersections (or other areas of high complexity and visual noise) are located in close proximity to the vertical curve, there will be portions on the approach to those intersections where the recommended DSD is not provided. Graphically, sight distance at any point along the roadway near a vertical curve is represented by the length of the sight line that extends from a point at driver s eye height (3.5 feet above the roadway) at the vehicle s location, is tangent to the crest of the curve, and terminates at a point where it is object height (2 feet above the roadway). Using the mathematical relationships shown in Figure 3, equations were developed that can determine the sight distance at any point on the roadway, on the tangent prior to the vertical curve, or on the vertical curve itself. Using these equations, the location of the RDZ for curves designed to meet 15
26 the minimum lengths shown in Figure 5 (for various design speed and grade combinations) was determined. The RDZ represents the portion along the roadway where high concentrations of visual noise or complex environments, such as a signalized intersection, should not be located. Sight distances along the roadway are less than that required for DSD to all points within the RDZ. In the course of the design process, if it is determined that a certain combination of curve length and grade would result in locating an intersection or potential back of queue from an intersection within this zone, the designer should select a different curve design if possible. Since the RDZ is dependent upon the definition of DSD, the location would vary depending on whether it was a rural or urban application. The RDZ graph for the rural case (Case A) is shown in Figure 5 and the urban case (Case B) is shown in Figure 6. In both cases the location of the RDZ is provided with respect to the location of the vertical point of intersection (VPI) of the vertical curve. This point was selected because it is usually fixed in design based on the natural curvature properties of the land. Negative values represent distances prior to the VPI as the vehicle is traveling toward the intersection. Positive values are distances after the VPI as the vehicle is traveling toward the intersection. The range for the RDZ is between the two lines at the particular design speed for a given algebraic difference in grade. GUIDELINES FOR USING DECISION SIGHT DISTANCE IN INTERSECTION OPERATIONS/SAFETY ANALYSIS The charts and methodology used above for roadway design could also be applied in operational and safety analyses of signalized intersections. The charts can be used to identify those locations where an intersection or back of queue has been located within the RDZ on an approach to the intersection. Those locations in which DSD is not provided to the intersection would be candidates for additional countermeasures (to be discussed in the next chapter) to alert motorists at the appropriate location of the presence of the downstream signal or back of queue. 16
27 Figure 5. Reduced Decision Zone Location for Rural Roadway Applications. 17
28 Figure 6. Reduced Decision Zone Location for Urban Roadway Applications. 18


29 CHAPTER 4. GUIDELINES FOR THE USE OF COUNTERMEASURES TO REDUCE CRASHES ON APPROACHES TO SIGNALIZED INTERSECTIONS NEAR VERTICAL CURVES Signalized intersections located at or near the bottom of a crest vertical curve have the potential to experience higher crash rates than other similar signalized intersections. Two common effects that occur when signals are located near vertical curves are a reduction in the sight distance to the signal heads and a reduction in the sight distance to the back of the queue waiting at a signal. If the traffic signal heads and/or the end of the queue are not visible due to the crest of the curve, drivers may not have sufficient time to react in order to avoid a crash. Figure 7 demonstrates these issues from the driver s perspective. In part a of the figure, the driver cannot see the signal heads for the approaching intersection. In part b, the driver can see the signal heads but not the back of queue. The waiting vehicles are illustrated in part c. (a) (b) (c) Figure 7. Reduced Sight Distance on the Approach to Signalized Intersections near Vertical Curves. 19
30 When the geometry of the roadway prevents a driver from seeing the signal heads or the back of the queue with enough time to appropriately react and, if necessary, stop, increased accidents, red-light running, or other erratic maneuvers (such as hard deceleration) may result. These intersections present complex situations to the driver that require more time to perceive and react appropriately to the situation. Thus they are candidates for the provision of DSD rather than SSD. Since reconstruction of the approach to provide DSD is usually not feasible, countermeasures can be used to communicate to the driver the situation ahead that is beyond the available sight distance. The countermeasures could be passive devices that constantly display the same message, or they could be active devices that offer a varying message depending on the state of the traffic signal or presence of a queue. This chapter provides some information on available countermeasures and presents some guidelines for their use at signalized intersections near vertical curves. TMUTCD STANDARDS AND GUIDANCE The Texas Manual on Uniform Traffic Control Devices (TMUTCD) provides some guidance on the use and placement of advance warning signs prior to signalized intersections (1). The TMUTCD states that the SIGNAL AHEAD warning sign shall be used on approaches to signalized intersections that are not visible for a sufficient distance to permit the road user to respond to the device. Furthermore, the TMUTCD states that two signal heads must be visible for the distance listed in Table 1 in order to be considered visible. The TMUTCD also provides for the use of a BE PREPARED TO STOP sign in situations where the driver needs additional warning about stopped or queued traffic near traffic signals where queues occur regularly. If this sign is used, it must be accompanied by the SIGNAL AHEAD sign. Flashing beacons may be used to supplement the warning sign. The TMUTCD encourages the use of the WHEN FLASHING plaque when flashing beacons that are connected with the traffic signal are used although it is not required. REVIEW OF POTENTIAL COUNTERMEASURES In many cases the signalized intersection will not be clearly visible at the appropriate DSD due to the crest of the preceding vertical curve. In this situation another type of warning device should be installed at the appropriate distance to provide adequate warning time. These devices could range from a simple SIGNAL AHEAD sign to an active warning sign that provides information on the current indication of the traffic signal. Symbolic SIGNAL AHEAD Warning Signs The use of the SIGNAL AHEAD warning sign is thoroughly covered in the TMUTCD. This sign may be used by itself (Figure 8a), with continuously flashing or actuated beacons (Figure 8b), or with actuated flashing beacons and a supplemental plaque warning motorists to be prepared to stop (Figure 8c). When actuated beacons are used, these beacons should begin to flash just prior to the signal s change to yellow and should remain flashing until the signal turns green. 20
31 (a) (b) (c) Figure 8. Uses of the Symbolic SIGNAL AHEAD Warning Sign. Several studies compared drivers reaction to the several configurations of SIGNAL AHEAD signs. The results found that the sign with the continuously flashing beacons produced results similar to the standard sign (without beacons). The sign with actuated beacons was effective in reducing approach speeds during the red interval and reducing red-light violations; however, the use of these signs tended to increase approach speeds during the green interval when the state of the signal was clearly visible from the sign location (2, 3, 4, 5). Since the SIGNAL AHEAD sign is used at many intersections, its use to distinguish a special circumstance, such as a signal hidden by a vertical curve, may have limited effectiveness. BE PREPARED TO STOP Warning Signs A second group of signs warns the motorist that they may have to stop ahead. Again, combinations of static signs, continuously flashing beacons, and actuated beacons can be used as shown in Figure 9. The BE PREPARED TO STOP signs are versatile in that they are applicable in warning the motorist they should be prepared for either a yellow or red signal ahead or a queue of stopped vehicles. Thus, actuated flashing beacons, if used, could be connected to either the traffic signal or a queue detector. (a) (b) (c) (d) Figure 9. Uses of the BE PREPARED TO STOP Family of Signs. 21
32 WATCH FOR STOPPED VEHICLES Warning Signs When the traffic signal heads are visible for an adequate distance but the back of the queue is hidden by the vertical curve, the use of the WATCH FOR STOPPED VEHICLES sign could be considered. This sign could be used with or without continuously flashing or actuated beacons. If actuated beacons are used, they should be connected to a queue detector and not to the active signal phase. This is to allow for the fact that stopped vehicles may remain for some time after a signal has turned green. Examples of this sign are shown in Figure 10. It should be noted, however, that the WATCH FOR STOPPED VEHICLES sign is not explicitly contained within either the state TMUTCD (1) or the national MUTCD (9). (a) (b) (c) Figure 10. Uses of the WATCH FOR STOPPED VEHICLES Sign. Additional Countermeasures Several additional countermeasures have been used or could be applied in situations where a signalized intersection is located near a vertical curve. HILL BLOCKS VIEW Sign The HILL BLOCKS VIEW sign has been shown to be understood by most drivers. This sign is intended to replace the more vague LIMITED SIGHT DISTANCE sign and the undesirable HIDDEN INTERSECTION and DANGEROUS INTERSECTION signs. A symbolic version of this sign is used in Canada. RED SIGNAL AHEAD Sign The RED SIGNAL AHEAD sign is an actuated warning sign that is connected to the traffic signal. This sign displays the word RED in red letters only when the signal ahead is red (or will be red when the vehicle reaches the intersection). When the signal ahead is green, the sign simply reads SIGNAL AHEAD. 22
33 Variable Message Sign An overhead or side-mounted variable message sign may be used on the approach to the signal to display a variety of messages to the driver. This sign could be connected to a queue detector and/or a traffic signal. This device is usually more expensive than other similar devices (i.e., signs with flashing beacons). Rumble Strips In-lane rumble strips may be used in conjunction with an advance warning sign to alert the driver to a situation that requires special attention. Studies have found that the installation of rumble strips should be limited to only a few locations in order to maximize their effectiveness. Furthermore, rumble strips should be considered a secondary warning device after another type of warning device has been implemented on an approach. Supplemental High-Mounted Signal Head In situations where the sight distance to the signal heads themselves is limited, a supplemental, high-mounted signal head could be used to increase the available sight distance. This countermeasure is most effective in situations where the back of the queue is visible but the signal heads themselves are not. RECOMMENDED GUIDELINES FOR THE USE OF COUNTERMEASURES Countermeasures should be considered at signalized intersections near vertical curves when the intersection or back of queue is located within the RDZ (as defined previously) on the approach. In addition, when a crash study at the signalized intersection reveals that there is an above average number of rear-end or right-angle collisions involving vehicles from the approach with the vertical curve, a countermeasure should be considered. Countermeasures have also been shown to be useful in reducing the number of red-light violations on the approach. Due to its versatility in application and its thorough definition in the TMUTCD, the BE PREPARED TO STOP sign is recommended as the countermeasure that should be considered in the above defined situations. Continuous flashers can accompany the BE PREPARED TO STOP sign as attention-getting devices. Active flashers can be used where a queue detection system is in operation. In such a system the flashers would only be deactivated when the signal is green and the queue on the approach has cleared. Active flashers may also be used when the flashers are connected to the signal (i.e., flashing when the signal is yellow or red for the approach); however, due to uncertainty about the presence of a queue, active operation is suggested over continuous flashing only when a queue detection system is in place. The BE PREPARED TO STOP sign should be used in conjunction with the SIGNAL AHEAD sign as described in the TMUTCD. The SIGNAL AHEAD sign should be located on the approach following the guidelines for placement that are available in the TMUTCD (Table 1). The additional countermeasure, the BE PREPARED TO STOP sign, should be located such that it is legible at the beginning of the RDZ on the approach. Since the RDZ is dependent upon the geometry of the vertical curve, it is once again useful to refer to charts to determine the sign placement location. The chart shown in Figure 11 should be used to locate signs on rural roadways. The chart in Figure 12 should be used in urban locations. In both cases, the figure 23
34 identifies the beginning of the RDZ. Since standard signs are visible at 175 feet (1), the actual sign location will be 175 feet closer to the VPI than Figure 11 or Figure 12 indicate. Figure 11. Countermeasure Placement Location for Rural Roadway Applications. 24
35 Figure 12. Countermeasure Placement Location for Urban Roadway Applications. 25
36
 based on responses to a survey mailed to each")

37 CHAPTER 5. CANDIDATE LOCATIONS WHERE CRASHES DUE TO VERTICAL ALIGNMENT ARE LIKELY TXDOT SURVEY AND STUDY SITE SELECTION An initial list of field sites (see Table 3) based on responses to a survey mailed to each of the 25 TxDOT districts was found too limiting to allow for the variety of experiments anticipated in the testing of advance warning devices along vertical curves upstream of signalized intersections. Some of the sites suggested in the survey of TxDOT district personnel around the state already included some form of treatment, including a unique application of a dynamic message sign along a vertical curve approaching a signalized intersection in Marshall, Texas (see Figure 13). Active speed monitoring with speed display is also used at this location to inform motorists about their driving activity along the approach to the signal. Utilizing the DMS, a Be Prepared to STOP message is displayed when the downstream signal (located in a sag vertical curve upstream of the DMS location) is yellow, and a Stop Ahead Signal is RED message is displayed when the downstream signal is red. However, due to implementation cost concerns, this warning method was not included for further study. Figure 13. Dynamic Message Sign as Advance Warning of a Signalized Intersection near a Vertical Curve. 27
38 To augment the number of potential study sites, a statewide search was undertaken using the information contained in crash database records maintained by the Texas Department of Public Safety (DPS). Intersections with crashes were identified, and those locations where the intersection was located close to a vertical curve were marked for potential inclusion in the research project. Staff from TTI offices in San Antonio, Austin, College Station, Arlington, Dallas and Houston then reviewed the intersections identified as being close to vertical curves to determine whether or not the vertical curve was proximate to the signalized intersection. A final selection of study sites was made based on these site reviews, with the final sites highlighted in Table 6. For all sites, sight distance to both the intersecting roadways and the signal head in the indicated direction of travel were estimated to the nearest hundred feet in the field using line of sight and a measuring wheel. CRASH STATISTICS Crash statistics from the DPS database were examined for each site in Table 6. In the case of some sites, the exact cross-street location could not be consistently matched with information in the crash database. In these instances, the crash totals were left blank rather than estimating a total number of crashes on insufficient reference data. Subsets of the sites found in Table 6 were created based on whether or not the site provided DSD and, if DSD was not provided, if the site was located in a rural or urban setting. Crash data were also obtained for a number of signalized intersections in the Austin, Texas area that were not located close to vertical curves but were sites where the overall level of traffic (i.e., the average daily traffic volume) was in a range similar to the potential field study sites. These data were meant to serve as control data. Crash data totaled from the control sites were compared with data from the potential study sites to determine if the presence of the vertical curve upstream of a signalized intersection created a disproportionate number of crashes along that approach. The result of the comparison between the control sites and the study sites is shown in Figure 14. It is immediately clear from the figure that the control sites are not clearly associated with a lower crash rate and that locations without DSD are not necessarily indicative of increased crashes. In an attempt to resolve the issue of the relationship between sight distance and crash rate, Figure 15 was created to more directly establish their correlation. This figure only includes data from the potential study sites those sites where a vertical curve exists in close proximity to the signalized intersection. Again, results appear inconsistent in that lower intersection sight distance does not appear to indicate higher crashes or crash potential. Based on both analyses, the conclusion was made that no definitive relationship exists between sight distance and crash rate. Accordingly, the number of crashes and the crash rate were not a definitive factor in the selection of final study sites from the overall list of potential study sites. 28
39 29 Site Table 6. Potential Field Study Sites. District Speed Sight Distance to Intersection (ft) Sight Distance to Signal Head (ft) AASHTO Stopping Sight Distance (ft) AASHTO Decision Sight Distance (ft) (Rural) AASHTO Decision Sight Distance (ft) (Urban) Advance Warning Sign Location (ft) NB Loop Barton Creek Mall Austin None 153 NB Loop Walsh-Tarlton Austin */ None 153 SB FM Ellison Dr San Antonio ** WB FM Springdale Austin None 50 WB RM Comanche Trail Austin */ EB FM Heatherwilde Austin None 43 NB FM Cromwell Marine Creek Ft. Worth None 43 NB FM Lake Country Dr Ft. Worth None 43 EB SH Hwy 124 Atlanta ** NB US US 290 Austin ** SB Loop Westbank Austin EB SH FM 1869 Austin ** SB US Hwy 580 Austin EB US Johnny Morris/Giles Austin EB US Old Kimbro Rd Austin */ ** SB Loop Loop 1 WSR Austin None 153 EB US FM 116 Austin SB US Hwy 346 Tyler / SB Loop Barton Creek Mall Austin None 153 NB Loop Westlake Austin */ ** WB FM Brittlewood Dallas ** ** ** ** 1175 ** NB Loop Lost Creek Austin WB FM CR 185 Austin None 14 WB FM Vista Hills Blvd Austin NB US Bulverde Rd San Antonio ** SB SH Custer Dallas ** ** ** ** 1500 ** SB Loop Lakewood Austin NB SH Custer Dallas ** ** ** ** ** * These sites have two signal head sight distances; the greater value is the sight distance to an auxiliary signal head at the site. ** Data not available at the time of initial site review Crashes ( )
40 700 Crash Rate (crashes per million vehicles) Control Study Locations with DSD Study Locations without Rural DSD Study Locations without Urban DSD ADT Figure 14. Crash Rate Comparison for Sites with and without Decision Sight Distance Crash Rate (crashes per million vehicles) Sight Distance (ft) Figure 15. Crash Rate versus Sight Distance for Study Sites. 30
 crash data.")


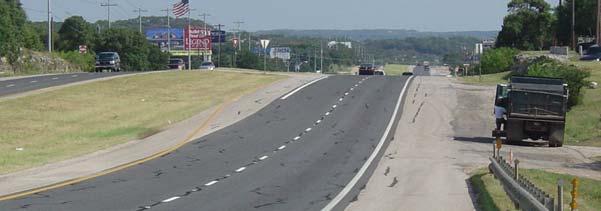
41 SELECTED FIELD STUDY SITES Ultimately, three final study sites were selected based on contact with staff from the appropriate TxDOT district and consideration of intersection sight distance and (to some extent) crash data. Two sites NB Loop 360 at Walsh-Tarlton and WB RM 620 at Comanche Trail are located in the Austin District, and one site NB US 281 at Bulverde Road is located in the San Antonio District. At each of these three sites, detailed sight distance and vertical profile data were collected using plan and profile sheets obtained from TxDOT. Details were verified during the field data collection process. NB Loop 360 at Walsh-Tarlton Loop 360 is a circumferential major arterial divided highway around western Austin, Texas. The signalized intersection of Loop 360 and Walsh-Tarlton is in southwestern Austin and is close to Barton Creek Mall, a large retail center in southern Austin. Average daily traffic (ADT) on Loop 360 is approximately 44,000 vehicles per day according to 2001 data from TxDOT. Conditions along the northbound approach of Loop 360 to Walsh-Tarlton are shown in Figure 16. As can be seen in the successive images, sight distance to the signal heads, vehicles in queue at the signal, and the intersection itself is limited because the intersection is located in a small valley. Figure 16. Northbound Loop 360 at Walsh-Tarlton. 31


, US 281 is a freeway with frontage roads.")
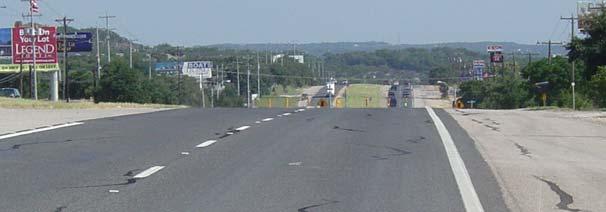
42 WB RM 620 at Comanche Trail Like Loop 360, RM 620 is a circumferential route around western Austin, Texas. However, RM 620 is further away from downtown Austin and passes through more rural settings than Loop 360. The intersection of RM 620 and Comanche Trail is located north and to the west of Austin and is located near a developing junction known as Four Points (i.e., the junction between RM 620 and FM 2222). ADT on RM 620 near this intersection is approximately 27,000 vehicles per day accordingly to 2001 data from TxDOT. Figure 17 contains photographs along the westbound RM 620 approach to Comanche Trail as a vehicle approaches the intersection. NB US 281 at Bulverde Road Figure 17. Westbound RM 620 at Comanche Trail. US 281 is a radial major arterial in north central San Antonio, Texas. Inside of San Antonio s outer loop (Loop 1604), US 281 is a freeway with frontage roads. Outside of Loop 1604, US 281 is a divided highway that eventually turns into a two-lane undivided highway further away from San Antonio. Near its junction with Bulverde Road, US 281 carries approximately 30,000 vehicles per day according to 2001 volumes from TxDOT. While this site has substantial sight distance to the intersection and signal heads (see Figure 18), queuing in the northbound direction often backs into the RDZ; many instances of hard deceleration were observed in the field. 32
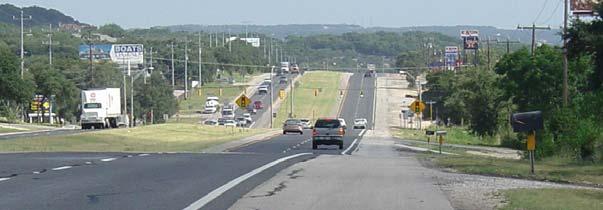
43 Figure 18. Northbound US 281 at Bulverde Road. 33
44
45 CHAPTER 6. STUDY DESIGN FOR COUNTERMEASURE EVALUATION COUNTERMEASURE STUDY DESIGN A field study data collection plan was developed to test three different types of countermeasures for vertical curvature in advance of signalized intersections. The first tested countermeasure included dual (i.e., either side of the directional roadway on a divided highway) symbolic SIGNAL AHEAD signs (see Site 1 details in Figure 19). As with the other countermeasure deployments, the signs were located at the beginning of the RDZ at a location where the driver was able to perceive the sign s message just as his or her vehicle entered the RDZ. Further detail about the site and signing location can be found in the appendix. Figure 19. Study Sites and Deployed Countermeasures. The second countermeasure to be tested was the deployment of a BE PREPARED TO STOP sign upstream of an existing advance warning symbolic SIGNAL AHEAD sign (see Site 2 details in Figure 19). In the case of the site selected for this treatment, the symbolic SIGNAL AHEAD sign was already located at the appropriate location based on the definition of the RDZ, wherein motorists do not have DSD along the entire approach to the signal. Thus, an intermediate signing location was found based on TMUTCD criteria and the symbolic sign was relocated to this position. The BE PREPARED TO STOP sign was then located at the beginning of the RDZ using the post and foundation originally used for the symbolic sign. Field details of this site, including the location of the RDZ based on the criteria developed in this research, can be found in the appendix. 35

46 The final countermeasure was the addition of dual (i.e., either side of the directional roadway on a divided highway) BE PREPARED TO STOP signs with active flashers (see Site 3 details in Figure 19). In this case, the solar-powered flashers were activated when the downstream signal displayed either a yellow or red indication for the study approach. Radio communication devices were used to enable the control of the active flashers. Because the flashers were solar powered and communication was established using radios located in the signal controller cabinet and in the small flasher control cabinet mounted on the sign pole installed for the new signs, the countermeasure required no cable plant installation for either power or communications. Again, site details can be found in the appendix. Data Collection Techniques Both the researchers and the TxDOT Project Monitoring Committee members felt that it was essential that the methods used for site data collection not be overly evident to drivers along the approaches to signalized intersections. Common techniques such as the placement of road tube sensors or the use of video equipment would locate devices (and, possibly, data collection staff) that were easily visible to drivers in direct proximity to the countermeasures being studied. Accordingly, researchers used Nu-metrics HI-STAR data collectors (see Figure 20) to obtain count and speed information at evenly-spaced stations along the study approach to each of the three signalized intersections being investigated. Figure 20. HI-STAR Data Collector (Credit Card as Size Reference). The HI-STAR devices were able to collect the necessary volume and speed data at each station and were located within a lane of traffic using an adhesive tape that secured and protected the device but did not contrast heavily with the roadway pavement (see Figure 21). These devices were used during both the before and after (i.e., after countermeasures were deployed) studies and were located at the same station for both studies. Thus, any differences in driver speed between the before and after studies as motorists approach the vertical curve and the signalized intersection were due to the countermeasure being deployed. 36

47 Figure 21. HI-STAR Deployed in a Traffic Lane. BEFORE FIELD DATA COLLECTION At each of the three field study sites, the HI-STAR counters were used to collect speed data at various locations along the study approach to the downstream signalized intersection. Evenly spaced stations were measured with respect to the location of the advance warning signing installed for the research. Accordingly, at each study site HI-STAR counters (set to measure and record the speed of each vehicle) were located 400 feet upstream of the (new) sign location, 200 feet upstream of the sign location, at the sign location, 200 feet downstream of the sign, and 400 feet downstream of the sign. Since a sixth HI-STAR was available, this counter was located at a position 100 feet downstream of the sign (i.e., between the zero point at the sign and the counter 200 feet downstream of the sign). Specific findings from the before data collection at each of the three study sites can be found in the following three sections. Site 1: NB Loop 360 at Walsh-Tarlton After examining speed data collected at the first site on the northbound approach to Loop 360, researchers made the decision to remove the noise within the speed data by truncating data points with a speed less than 25 miles per hour from the speed limit. Arguably, these data points represented either driveway traffic close to the data collection station, partially disabled vehicles, or vehicles slowing to access the shoulder for unknown reasons and were not progressing down the roadway at the anticipated speed for prevailing operating conditions. Figure 22 shows an entire station s data set of observed speeds, including the noise found at lower speeds. Figure 23 displays both the entire data set collected at the first station of Site 1 and the data set after the low-speed noise was removed from the data set. It is clear that the speed distribution is normal; the low-speed points are non-representative of the overall population and were removed to ensure the validity of the later statistical tests between the before and after conditions. 37

48 Figure 22. Observation Number versus Observed Speed Site 1. Figure 23. Speed Data for NB Loop 360 at Walsh-Tarlton. 38
49 Figure 24 and Table 7 contain the before data observed along northbound Loop 360 approaching the signalized intersection with Walsh-Tarlton. As shown in the figure, the roadway approach in this direction includes a sag vertical curve. The location of the sign tested at this site is shown in the figure for reference. At each data collection station, the vertical curved line represents the actual speed distribution observed as a histogram. The bottom horizontal curved line represents the roadway profile, and the upper curved line that connects the histograms represents an average speed profile along the approach. Actual average speeds and standard deviations at each station are provided in the table. Figure 24. Before Speed Data for NB Loop 360 at Walsh Tarlton. 39
50 Table 7. Average Before Speed Data for NB Loop 360 at Walsh-Tarlton. Data Station (w/r/t study sign) Speed (mph) Standard Deviation (mph) 400 ft upstream ft upstream ft (at sign location) ft downstream ft downstream ft downstream Site 2: WB RM 620 at Comanche Trail Before statistics for westbound RM 620 approaching Comanche Trail are shown in Figure 25 and Table 8. The figure contains an average speed profile, and the table contains actual average speeds and standard deviations at each data station. Figure 25. Before Speed Data for WB RM 620 at Comanche Trail. 40
51 Table 8. Average Before Speed Data for WB RM 620 at Comanche Trail. Data Station (w/r/t study sign) Speed (mph) Standard Deviation (mph) 400 ft upstream ft upstream ft (at sign location) ft downstream ft downstream ft downstream Site 3: NB US 281 at Bulverde Road Similar to the other two sites, the average speed profile for Site 3 can be found in Figure 26, and the average speed data and standard deviations for each station are located in Table 9. Figure 26. Before Speed Data for NB US 281 at Bulverde Road. 41
 62.83 7.18 100 ft downstream 61.25 6.62 200 ft downstream 57.99 6.47 400 ft downstream 57.13 6.")
52 Table 9. Average Before Speed Data for NB US 281 at Bulverde Road. Data Station (w/r/t study sign) Speed (mph) Standard Deviation (mph) 400 ft upstream ft upstream ft (at sign location) ft downstream ft downstream ft downstream AFTER FIELD DATA COLLECTION Data collection at each site for the after study consisted of placing the counter devices at the exact locations used in the before study and repeating the data collection effort. Both a photograph of the installed signs and the speed data collected at each after site are provided in the following three sections. Site 1: NB Loop 360 at Walsh-Tarlton Figure 27 contains a photograph of the northbound Loop 360 at Walsh-Tarlton study site with the advance warning signs installed. In this case, the signs are installed approximately 1400 feet upstream of the signalized intersection. It is clear from the figure that vehicles stopped at the signal are located in a reduced decision zone; these vehicles cannot be seen by the approaching motorist even though the signal heads can be seen from the location where the photograph was taken. Data from each of the data collection stations for this site can be found in Figure 28, and average speeds and standard deviations for each station can be found in Table 10. Figure 27. Study Signing (Dual Symbolic SIGNAL AHEAD Signs) Installed at Site 1. 42
53 Figure 28. After Speed Data for NB Loop 360 at Walsh-Tarlton. Table 10. Average After Speed Data for NB Loop 360 at Walsh-Tarlton. Data Station (w/r/t study sign) Speed (mph) Standard Deviation (mph) 400 ft upstream ft upstream ft (at sign location) ft downstream ft downstream ft downstream

54 Site 2: WB RM 620 at Comanche Trail Figure 29 depicts conditions along westbound RM 620 approaching the signalized intersection at Comanche Trail. The BE PREPARED TO STOP advance warning sign has been installed on an existing pole that only served as the mounting for a SIGNAL AHEAD sign. This location is approximately 1550 feet upstream of the signal and is between the points defining the urban and rural beginning of the RDZ the location where a motorist is along this approach when they cannot see a 2-foot high object on the other side of the vertical curve. The SIGNAL AHEAD sign was relocated to a point 550 fee upstream of the signal. Figure 30 displays the speed profile for this site, and Table 11 contains the average speeds and standard deviations of those speeds at the data collection stations bracketing the installed BE PREPARED TO STOP sign. Figure 29. Study Signing (BE PREPARED TO STOP) Installed at Site 2. 44
55 Figure 30. After Speed Data for WB RM 620 at Comanche Trail. Table 11. Average After Speed Data for WB RM 620 at Comanche Trail. Data Station (w/r/t study sign) Speed (mph) Standard Deviation (mph) 400 ft upstream ft upstream ft (at sign location) ft downstream ft downstream ft downstream
56 Site 3: NB US 281 at Bulverde Road Due to a lack of emergency maintenance funding, the TxDOT San Antonio District was not able to install the signing for the NB US 281 at Bulverde Road site. This installation would have included dual (either side of the divided highway) BE PREPARED TO STOP signs with active flashers at a location sufficiently upstream of the signalized intersection and vertical curve where drivers would be reaching a point where their vision of a 2-foot object was obscured by the vertical curve (i.e., the beginning of the RDZ). The signing and flasher equipment intended for installation at this site included high-strength foundations, pole bases, and poles; 36-inch signs; dual (upper and lower) flashers; control cabinets and flasher controllers; solar-power assemblies with batteries (which were to be housed in the cabinet); and a radio communications system that could communicate between the flasher controllers and the traffic signal s controller unit. The system was to be designed and programmed such that the flashers were only operational or active from just before the end of green for the northbound through phase until the end of red for that phase. Though this system was not installed in time to be included in this research investigation, all of the equipment necessary was purchased using project funds and made available to the Traffic Operations section of the TxDOT San Antonio District. It is anticipated that the sign will be installed in the near future, at which time researchers will perform the after study for this site. Though those results will not be included in this research effort, they will be included in publication of results for a national audience (e.g., the Transportation Research Board). 46
57 CHAPTER 7. RESULTS OF THE COUNTERMEASURE EVALUATION Several statistical tests were used to compare the before and after data for each site. As the data collection stations at each site were independent that is, represent different locations along the roadway where data were collected it was necessary to compare individual stations before and after data. However, applying standard hypothesis testing using the normally distributed data at each station could be considered not sufficiently stringent from a statistical point of view. Accordingly, a method known as the Bonferroni Correction was applied to limit the number of spurious positives. That is, the alpha value (error tolerance) for each station s before and after comparison was lowered because multiple comparisons were simultaneously being made (for all stations at each site). For this project, the correction was applied by simply dividing the acceptable error of 0.05 for a two-tailed test comparing the before and after average speeds by the number of data collection stations. For Site 1, which had five data collection stations, this meant that an acceptable error of 0.01 for a two-tailed test was used for each station. Because platoons of vehicles tend to form along roadways with traffic signals, there was some concern among researchers that the field data were overly influenced by the behavior of following vehicles. In this case, the behavior of concern occurs when the driver of the lead vehicle in a group, or platoon, is the first to view a downstream situation, which would cause the driver to remove his or her foot from the accelerator or begin braking. The vehicles behind the lead vehicle would tend to do the same thing in order to avoid colliding with the lead vehicle and to avoid the potential downstream hazard. However, the behavior of the following vehicles in this situation is not independent and based on driver perception of the roadway environment alone; it is influenced by the actions of the lead vehicle. Accordingly, a subset of vehicles was pulled from the before and after data sets consisting of only those vehicles with a following headway (time separation) of greater than 5 seconds between their vehicle and the vehicle in front of them. Though based solely on engineering judgment, the 5 second value was judged a time horizon that, for most situations, would provide adequate physical separation between vehicles to allow for the following vehicle s driver to independently observe and respond to downstream situations. Before and after results from northbound Loop 360 at Walsh-Tarlton (Site 1) are shown along the roadway profile in Figure 31 and details of the statistical test at each station is shown for both the overall data set and the subset of vehicles with headways greater than 5 seconds in Table 12. Similar data from Site 2 for westbound RM 620 approaching Comanche Trail are shown in Figure 32 and Table 13, respectively. 47
58 Figure 31. Before-and-After Speed Comparison at Site 1. Table 12. Statistical Comparison of Before-and-After Speeds at Site 1. Full Data Set Data Subset Headway > 5 sec Feet Upstream Data Station Feet Downstream Individual Significance No Yes Yes No Data Yes Yes Sitewise Significance No No Yes Yes No Mean Difference P-Value E E Individual Significance No No No No Data Yes No Sitewise Significance No No No Yes No Mean Difference P-Value
59 Figure 32. Before-and-After Speed Comparison at Site 2. Table 13. Statistical Comparison of Before-and-After Speeds at Site 2. Full Data Set Data Subset Headway > 5 sec Data Station Feet Upstream Feet Downstream Individual Significance Yes No Yes No Yes Yes Sitewise Significance Yes No Yes No Yes Yes Mean Difference P-Value 1.20E E E E-11 Individual Significance Yes No Yes No Yes No Sitewise Significance Yes No No No No No Mean Difference P-Value 2.82E
60 Figure 31 and Figure 32 can be used to get a general understanding of driver behavior and response to the installed signing. In Figure 31, motorists approaching the vertical curve and signal are traveling from the right side (of the page) to the left, and motorist speeds for the before-and-after conditions appear very similar approaching the tested sign installation. After the sign, speeds decrease up to a point 400 feet after the sign, where the after speed appears higher than the before speed. In Figure 32, motorists are traveling from the left to the right, and after speeds appear slightly lower before the sign, slightly higher immediately after the sign, and lower again 400 feet downstream of the new sign. Table 12 and Table 13 contain the statistical test results for all of the data collection stations at each site. In each table, the individual significance results indicate whether the measured difference between before-and-after speeds is significant using an alpha of 0.05 and a two-tailed test. The sitewise significance results indicate whether the difference between beforeand-after speeds is significant using the Bonferroni Correction, wherein the overall alpha of 0.05 is divided evenly across each of the data collection stations. Where the mean difference between before-and-after speeds is positive, the after speeds are lower than the before speeds. In both Table 12 and Table 13 the results of the analysis of the subset of before-and-after data with headways of greater than 5 seconds is shown at the bottom of the table. While there are some data collection stations that exhibit a speed increase in the after study and some stations that exhibit a speed decrease, the only data stations that show a significant difference in speed for all tests of statistical significance are the stations 200 feet downstream of the new sign at Site 1 (Loop 360 at Walsh-Tarlton) and the station 400 feet upstream of the new sign at Site 2 (RM 620 at Comanche Trail). In both cases, the tests showed a speed decrease after the new sign was installed. One possible reason for the difference in the location of the speed reduction with respect to the sign installation is that Site 1 was a completely new installation (of SIGNAL AHEAD signing), while the Site 2 installation actually involved the substitution of a BE PREPARED TO STOP sign for a previous SIGNAL AHEAD symbolic sign (which was relocated approximately 1000 feet further downstream). It was the expectation of researchers that the new signing would result in increased driver attention approaching and downstream of the new signing. In this project, speed measurement was used as a proxy measure of driver response to the signing message that a signal and/or stopped vehicles were ahead but perhaps not immediately visible to the driver. While speed reduction may be one driver response in these situations, an equally possible driver response is simply improved vigilance on the approach to the signal. Since drivers were not surveyed for their response to the new signing installation, it is unknown whether and to what extent their attention was captured by the new signs. While the project team opted for speed measurement as the desired data collection method for this project so as to monitor behavior without having the data collection be observed by motorists, it is suggested that future signing studies of this type include a survey of driver recognition and response to the signing at a location safely downstream of the new/tested signing. 50
61 CHAPTER 8. CONCLUSIONS AND RECOMMENDATIONS The literature review and investigation for this research identified a shortcoming in past research regarding using driver line of sight and objects within the driver s view as a means of identifying areas along a signalized intersection approach where vertical curves limit the information-gathering process. Whereas standards and guidelines provide visibility requirements for the signal heads of traffic signals and recommend advance warning signing where the minimum visibility distance is not available, there has been little or no investigation into locations along the approach to a signal where the driver has limited information about the signal or the queue waiting at the signal due to sight line interference from a vertical curve. Researchers participating in this effort mathematically derived equations which defined a reduced decision zone along the approach to a signal (or intersection) that includes a vertical curve. Within this zone, stopping sight distance is provided as per roadway geometric design standards, but any extra decision-making time that would otherwise be provided by decision sight distance is not. Graphs referenced to the vertical point of intersection of the vertical curve were developed from these equations to identify the segments of roadway along the signalized intersection approach where a (standard) 2-foot object would not be visible (using decision sight distance criteria) to motorists on the roadway approaching the signal. It is recommended that these graphs be used during the design process to identify potential locations where reduced decision zones exist and thereby avoid the location of intersections within these zones either by relocating the intersection or changing the grades to reduce the size of the reduced decision zone. Additional graphs were developed to identify where a motorist would be located along the intersection approach when they reach a point along the roadway where they could not see a 2-foot object within the reduced decision zone. The distances indicated in these graphs (less a sign visibility distance of 175 feet) are the recommended locations for advance warning signing, especially BE PREPARED TO STOP signing used in conjunction with symbolic or text SIGNAL AHEAD signing. Crash data from multiple locations around Texas where signals are located downstream of vertical curves were examined to identify a possible relationship between limited decision sight distance near signals and increased crashes. Comparisons of crashes at signalized locations with limited decision sight distance and crashes without vertical curves (i.e., where decision sight distance was provided) revealed no statistically significant difference. In other words, there was no evidence from the crash study to indicate that not providing decision sight distance contributed to or increased the likelihood of crashes. Researchers suggest that this result occurred because existing roadway design standards ensure that stopping sight distance is always provided and existing signing standards require that a minimum signal head visibility distance either be provided or advance warning signing must be installed. In other words, existing standards appear adequate in most situations. However, the crash analysis results should not overshadow the presence of the reduced decision zone identified in this research or preclude the vigilance of the traffic engineer in addressing concerns about queues from signals not being visible to approaching motorists. 51
62 A final recommendation is provided with respect to the use of active flashers with BE PREPARED TO STOP or text or symbolic SIGNAL AHEAD signing. Whereas common practice is to activate the flashers a few seconds before the end of green and continue flashing operation until the end of red for the through phase on the subject approach, there is no sensitivity in this practice to the presence of the queue. A standing queue may remain on the approach for 20 seconds or more after the signal has turned green, especially where volumes are high and queues are longer. If the active flashers deactivate before the end of the queue begins moving and accelerates to speed, approaching motorists would be given the impression (because the flashers became inactive) that the downstream signal is green and the roadway is clear, and they may not be as vigilant in anticipating a queue of vehicles ahead. For this reason, it is recommended that in locations where the queue from the signal extends into a reduced decision zone, active flashers only be used if they are tied not only to the signal but also to a queue detection system. An alternative and less expensive mode of operation for this situation is simply to operate the flashers in a continuously flashing mode. 52
63 REFERENCES 1. Texas Manual on Uniform Traffic Control Devices. Texas Department of Transportation, Austin, Texas, Pant, P. D., Y. Xie, and X. Huang. Evaluation of Detection and Signing Systems for High Speed Signalized Intersections. Report FHWA/OH-95/016. University of Cincinnati, Cincinnati, Ohio, Sayed, T., H. Vahidi, and F. Rodriguez. Advance Warning Flashers: Do They Improve Safety? Transportation Research Record 1692, Transportation Research Board, Washington, D.C., Klugman, A., B. Boje, and M. Belrose. A Study of the Use and Operation of Advance Warning Flashers at Signalized Intersections. Report MN/RC-93/01. Minnesota Department of Transportation, Saint Paul, Minnesota, Smith, T. J., C. Hammond, and M. G. Wade. Investigating the Effect on Driver Performance of Advance Warning Flashers at Signalized Intersections. Report MN/RC Human Factors Research Laboratory, Division of Kinesiology, University of Minnesota, Minneapolis, Minnesota, July Messer, C. J., S. R. Sunkari, R. T. Parker, and H. A. Charara. Development of Advance Warning Systems for End-of-Green Phase at High Speed Traffic Signals. Report FHWA/TX-04/ Texas Transportation Institute, College Station, Texas, September Corkle, J., M. Marti, and D. Montebello. Synthesis on the Effects of Rumble Strips. Report MN/RC SRF Consulting Group, Inc., Minneapolis, Minnesota, October Toolbox of Countermeasures and Their Potential Effectiveness to Make Intersections Safer. Issue Briefs 8. Institute of Transportation Engineers and the Federal Highway Administration, U.S. Department of Transportation, Washington, D.C., April Manual on Uniform Traffic Control Devices. Federal Highway Administration, U.S. Department of Transportation, Washington, D.C., A Policy on Geometric Design of Highways and Streets. American Association of State Highway Transportation Officials, Washington, D.C., Texas Roadway Design Manual. Texas Department of Transportation, Austin, Texas, April 2004 (Revised). 53
64
65 APPENDIX Site 1 Details NB Loop 360 at Walsh-Tarlton (Austin District) Site 2 Details WB RM 620 at Comanche Trail (Austin District) Site 3 Details NB US 281 at Bulverde Road (San Antonio District 55
66

")
67 57 Site 1 Details (Plan and Profile)
68 Site 2 Details (Plan and Profile) 58

69 Site 3 Details (Plan and Profile) 59
GUIDELINES FOR USING DECISION SIGHT DISTANCE AT IGNALIZED INTERSECTIONS NEAR VERTICAL CURVES
 1. Report No. FHWA/TX-05/0-4084-P2 4. Title and Subtitle 2. Government Accession No. 3. Recipient's Catalog No. GUIDELINES FOR USING DECISION SIGHT DISTANCE AT IGNALIZED INTERSECTIONS NEAR VERTICAL CURVES
Texas Transportation Institute The Texas A&M University System College Station, Texas
 1. Report No. FHWA/TX-05/0-4084-P1 4. Title and Subtitle GUIDELINES FOR THE USE OF COUNTERMEASURES TO REDUCE CRASHES ON APPROACHES TO SIGNALIZED INTERSECTIONS NEAR VERTICAL CURVES 2. Government Accession
Subject: Use of Pull-off Areas in Work Zones Page: 1 of 13. Brief Description: Guidance for the use and placement of pull-off area in work zones.
 6 - G2 Subject: Use of Pull-off Areas in Work Zones Page: 1 of 13 MdMUTCD REF. NO. None Date Issued: 09/09 Effective Date: 09/09 Brief Description: Guidance for the use and placement of pull-off area in
National Committee on Uniform Traffic Control Devices RWSTC RECOMMENDATION FOLLOWING SPONSOR COMMENTS
 1 2 3 ATTACHMENT NO. 1 RW No. 1, Jan 2012 4 5 6 7 8 9 10 11 12 13 14 15 16 17 18 19 20 21 22 23 24 25 26 27 28 29 30 31 32 33 34 35 36 37 38 39 40 41 National Committee on Uniform Traffic Control Devices
PERFORMANCE OF THE ADVANCE WARNING FOR END OF GREEN SYSTEM (AWEGS) FOR HIGH SPEED SIGNALIZED INTERSECTIONS
 FOR HIGH SPEED SIGNALIZED INTERSECTIONS") PERFORMANCE OF THE ADVANCE WARNING FOR END OF GREEN SYSTEM (AWEGS) FOR HIGH SPEED SIGNALIZED INTERSECTIONS Submitted for 2007 Technical Paper Award Texas District of the Institute of Transportation Engineers
PERFORMANCE OF THE ADVANCE WARNING FOR END OF GREEN SYSTEM (AWEGS) FOR HIGH SPEED SIGNALIZED INTERSECTIONS Submitted for 2007 Technical Paper Award Texas District of the Institute of Transportation Engineers
CROSSING GUARD PLACEMENT CONSIDERATIONS AND GAP ASSESSMENT
 CROSSING GUARD PLACEMENT CONSIDERATIONS AND GAP ASSESSMENT Many factors contribute to the need for a Crossing Guard. General federal guidance, provided by the FHWA MUTCD, states that adult crossing guards
A Traffic Operations Method for Assessing Automobile and Bicycle Shared Roadways
 A Traffic Operations Method for Assessing Automobile and Bicycle Shared Roadways A Thesis Proposal By James A. Robertson Submitted to the Office of Graduate Studies Texas A&M University in partial fulfillment
Chapter Twenty-eight SIGHT DISTANCE BUREAU OF LOCAL ROADS AND STREETS MANUAL
 Chapter Twenty-eight SIGHT DISTANCE BUREAU OF LOCAL ROADS AND STREETS MANUAL Jan 2006 SIGHT DISTANCE 28(i) Chapter Twenty-eight SIGHT DISTANCE Table of Contents Section Page 28-1 STOPPING SIGHT DISTANCE
TABLE OF CONTENTS LIST OF FIGURES. Figure Title
 TABLE OF CONTENTS Table of Contents... 1 List of Figures... 1 Chapter Forty-two... 2 42-1.0 STOPPING SIGHT DISTANCE... 2 42-1.01 Theoretical Discussion...2 42-1.02 Passenger Car Stopping Sight Distance...
Access Location, Spacing, Turn Lanes, and Medians
 Design Manual Chapter 5 - Roadway Design 5L - Access Management 5L-3 Access Location, Spacing, Turn Lanes, and Medians This section addresses access location, spacing, turn lane and median needs, including
RURAL HIGHWAY SHOULDERS THAT ACCOMMODATE BICYCLE AND PEDESTRIAN USE (TxDOT Project ) June 7, Presented by: Karen Dixon, Ph.D., P.E.
 June 7, Presented by: Karen Dixon, Ph.D., P.E.") RURAL HIGHWAY SHOULDERS THAT ACCOMMODATE BICYCLE AND PEDESTRIAN USE (TxDOT Project 0-6840) June 7, 2016 Presented by: Karen Dixon, Ph.D., P.E., TTI Team: Kay Fitzpatrick, Raul Avelar, & Subasish Das Project
RURAL HIGHWAY SHOULDERS THAT ACCOMMODATE BICYCLE AND PEDESTRIAN USE (TxDOT Project 0-6840) June 7, 2016 Presented by: Karen Dixon, Ph.D., P.E., TTI Team: Kay Fitzpatrick, Raul Avelar, & Subasish Das Project
ATTACHMENT NO. 18 GMI-C. National Committee on Uniform Traffic Control Devices GMI SIGNS TECHNICAL COMMITTEE RECOMMENDATION
 1 2 3 ATTACHMENT NO. 18 GMI-C 4 5 6 7 8 9 10 11 12 13 14 15 16 17 18 19 20 21 22 23 24 25 26 27 28 29 30 31 32 33 34 35 36 37 38 39 GMI agenda item II.H.2., January 19, 2012 National Committee on Uniform
DEPARTMENT OF ENVIRONMENTAL SERVICES. North Harrison Street (Lee Highway to Little Falls Road) Comparative Analysis. Prepared for:
 Comparative Analysis. Prepared for:") DEPARTMENT OF ENVIRONMENTAL SERVICES North Harrison Street (Lee Highway to Little Falls Road) Comparative Analysis Prepared for: Arlington County Department of Environmental Services 2100 Clarendon Boulevard,
DEPARTMENT OF ENVIRONMENTAL SERVICES North Harrison Street (Lee Highway to Little Falls Road) Comparative Analysis Prepared for: Arlington County Department of Environmental Services 2100 Clarendon Boulevard,
Chapter 2: Standards for Access, Non-Motorized, and Transit
 Standards for Access, Non-Motorized, and Transit Chapter 2: Standards for Access, Non-Motorized, and Transit The Washtenaw County Access Management Plan was developed based on the analysis of existing
Developed by: The American Traffic Safety Services Association (ATSSA) 15 Riverside Parkway, Suite 100 Fredericksburg, VA
 15 Riverside Parkway, Suite 100 Fredericksburg, VA") Addendum Developed by: The American Traffic Safety Services Association (ATSSA) 15 Riverside Parkway, Suite 100 Fredericksburg, VA 22406-1022 800-272-8772 This material is based upon work supported by
Addendum Developed by: The American Traffic Safety Services Association (ATSSA) 15 Riverside Parkway, Suite 100 Fredericksburg, VA 22406-1022 800-272-8772 This material is based upon work supported by
California Manual on Uniform Traffic Control Devices
 California Manual on Uniform Traffic Control Devices FHWA s MUTCD 2009 Edition as amended for use in California 2012 Edition State of California Business, Transportation and Housing Agency Department of
Attachment No. 17 GMI No. 1. National Committee on Uniform Traffic Control Devices GMI SIGNS TECHNICAL COMMITTEE RECOMMENDATION
 1 2 3 Attachment No. 17 GMI No. 1 4 5 6 7 8 9 10 11 12 13 14 15 16 17 18 19 20 21 22 23 24 25 26 27 28 29 30 31 32 33 34 35 36 37 GMI agenda item II.H.2., January 19, 2012 National Committee on Uniform
November 2012: The following Traffic and Safety Notes were revised:
 CHANGE LIST for MDOT Traffic and Safety, TRAFFIC AND SAFETY NOTES Located at http://mdotcf.state.mi.us/public/tands/plans.cfm JANUARY 2014: The following Traffic and Safety Note was added: Note 705A Angled
Safety Impacts: Presentation Overview
 Safety Impacts: Presentation Overview The #1 Theme How Access Management Improves Safety Conflict Points The Science of Access Management By Treatment Studies Themes for Texas Access Management Improve
Roadway Design Manual
 Roadway Design Manual Manual Notice Archive by Texas Department of Transportation (512) 302-2453 all rights reserved Manual Notice 2009-1 From: Manual: Mark A. Marek, P.E Roadway Design Manual Effective
Bicyclist Signing Guidelines
 Bicyclist Signing Guidelines April, 2009 1 Introduction This paper describes the Montana Department of Transportation s (MDT) current practices related to bicyclist safety and signing issues and presents
Development of Left-Turn Operations Guidelines at Signalized Intersections
 TxDOT 0-5840-1 http://itri.tsu.edu/reports/txdot_5840-r1.pdf Development of Left-Turn Operations Guidelines at Signalized Intersections August 2008 By Lei Yu, Ph.D., P.E., Yi Qi, Ph.D. Hongxi Yu Lei Guo
PLACEMENT OF SIGNS RECOMMENDED PRACTICES SUB-SECTION
 Page 1 of 6 RECOMMENDED PRACTICES PART SECTION SUB-SECTION HIGHWAY SIGNS GENERAL General Proper positioning of signs is an important element in the overall control of traffic within a roadway network.
Toolbox of Countermeasures and Their Potential Effectiveness to Make Intersections Safer
 8 Toolbox of Countermeasures and Their to Make Intersections Safer Introduction Studies included in the NCHRP 17-18 (3), Guidance for Implementation of the AASHTO Strategic Highway Safety Plan, as well
Bureau of Planning and Research. Project No.: (C14) Phase II Final Report March 2, 2007 CMA
 Phase II Final Report March 2, 2007 CMA") Bureau of Planning and Research Safer Driver Actions at Stop Signs Project No.: 04-01 (C14) Phase II Final Report March 2, 2007 CMA Technical Report Documentation Page 1. Report No. 2. Government Accession
Bureau of Planning and Research Safer Driver Actions at Stop Signs Project No.: 04-01 (C14) Phase II Final Report March 2, 2007 CMA Technical Report Documentation Page 1. Report No. 2. Government Accession
Recent U.S. Research on Safety Evaluation of Low-Cost Road Engineering Safety Countermeasures Lessons for Canada
 Recent U.S. Research on Safety Evaluation of Low-Cost Road Engineering Safety Countermeasures Lessons for Canada Bhagwant Persaud Department of Civil Engineering, Ryerson University 350 Victoria Street,
2009 Manual on Uniform Traffic Control Devices
 2009 Manual on Uniform Traffic Control Devices Tori Brinkly, PE Highway Safety Engineer WFL-FHWA April 20, 2010 Paragraphs are numbered. Standard Statements are bolded. Guidance statements are italicized.
MUTCD Part 6: Temporary Traffic Control
 MUTCD Part 6: Temporary Traffic Control OMUTCD English units are preferred. OHIO MANUAL OF UNIFORM TRAFFIC CONTROL DEVICES TABLE OF CONTENTS PREFACE INTRODUCTION TABLE OF CONTENTS PART 1. GENERAL Chapter
Issues Relating to the Geometric Design of Intersections Vergil G. Stover
 Introduction Issues Relating to the Geometric Design of Intersections Vergil G. Stover This paper presents five issues, or topics, that the author suggests be addressed in the design of intersections.
THE FUTURE OF THE TxDOT ROADWAY DESIGN MANUAL
 THE FUTURE OF THE TXDOT ROADWAY DESIGN MANUAL Kenneth Mora, P.E. (Design Division) 10/10/2017 Table of contents 1 2 Reduction in FHWA design controlling criteria Innovative Intersection Guidance 3-7 8-42
Traffic Control Devices
 533372 Highway Engineering Traffic Control Devices Traffic Control Devices o The media by which traffic engineers communicate with drivers o Every traffic law, regulation, or operating instruction must
Technical Memorandum. Subject: Interchange Ramp Terminal Configuration. Expiration. Implementation. Introduction
 Minnesota Department of Transportation Engineering Services Division Technical Memorandum To: Electronic Distribution Recipients From: Nancy T. Daubenberger, P.E. Assistant Commisioner, Engineering Services
Speed Management Techniques for Collectors and Arterials
 Speed Management Techniques for Collectors and Arterials ANGELIA H. PARHAM Texas Transportation Institute College Station, Texas 77843-3135 a-parham@tamu.edu KAY FITZPATRICK Texas Transportation Institute
3-13 UFC - GENERAL PROVISIONS AND GEOMETRIC DESIGN FOR ROADS, STREETS, WALKS, AND OPEN
 maintenance, and erosion. Stability is required to maintain the integrity of the pavement structure, and a slope stability analysis should be conducted for cuts and fills greater than 15 feet. For lower
Lf Wv-11 L_ Mario Dupigny-G iroux, P.E. Traffic Safety Engineer. ja WTtffiti. _J~?feL. \~tk 1pp Research Technician
 Activated Approach Flasher System Final Report October 2009 Report 2009-11 Reporting on Work Plan No. W P 2006-R-1 State of Vermont Agency of Transportation Materials and Research Section Prepared by:
CHAPTER 2G. PREFERENTIAL AND MANAGED LANE SIGNS
 2011 Edition - Revision 2 Page 275 Section 2G.01 Scope CHAPTER 2G. PREFERENTIAL AND MANAGED LANE SIGNS 01 Preferential lanes are lanes designated for special traffic uses such as high-occupancy vehicles
LEFT-TURN LANE DESIGN AND OPERATION
 Report No. TxDOT 0-5290-1 LEFT-TURN LANE DESIGN AND OPERATION August 2007 By Lei Yu, Ph.D., P.E., Yi Qi, Ph.D. Mehdi Azimi Chenyan Guo Lei Guo 1. Report No. 2. Government Accession No. Recipient's Catalog
FYG Backing for Work Zone Signs
 Report Title Report Date: 2001 FYG Backing for Work Zone Signs Principle Investigator Name Kamyab, Ali Affiliation Western Transportation Institute Address c/o Caltrans, 1227 O Street, 5th Floor Sacramento,
WEST AVENUE AND NEW ROAD TRAFFIC STUDY PART III WEST AVENUE CLOSURE ALTERNATIVES ANALYSIS
 WEST AVENUE AND NEW ROAD TRAFFIC STUDY PART III WEST AVENUE CLOSURE ALTERNATIVES ANALYSIS CITY OF LINWOOD ATLANTIC COUNTY, NEW JERSEY March 30, 2006 PREPARED FOR: City of Linwood 400 Poplar Avenue Linwood,
Figure 1: Graphical definitions of superelevation in terms for a two lane roadway.
 Iowa Department of Transportation Office of Design Superelevation 2A-2 Design Manual Chapter 2 Alignments Originally Issued: 12-31-97 Revised: 12-10-10 Superelevation is the banking of the roadway along
DOT HS September Crash Factors in Intersection-Related Crashes: An On-Scene Perspective
 DOT HS 811 366 September 2010 Crash Factors in Intersection-Related Crashes: An On-Scene Perspective DISCLAIMER This publication is distributed by the U.S. Department of Transportation, National Highway
MEMORANDUM. Date: 9/13/2016. Citywide Crosswalk Policy
 MEMORANDUM Date: 9/13/2016 Re: Citywide Crosswalk Policy Foreword Through the s Circulation Element and Complete Streets Policy, it is the City s goal to promote walking trips and provide safe facilities
Traffic Impact Analysis Walton Acres at Riverwood Athletic Club Clayton, NC
 Traffic Impact Analysis Walton Acres at Riverwood Athletic Club Clayton, NC 1. TABLE OF CONTENTS INTRODUCTION...1 1.1. Site Location and Study Area...1 1.2. Proposed Land Use and Site Access...2 1.3.
20. Security Classif.(of this page) Unclassified
 Unclassified") 1. Report No. FHWA/TX-10/0-5890-1 4. Title and Subtitle GUIDELINES FOR THE USE OF PAVEMENT MARKING SYMBOLS AT FREEWAY INTERCHANGES: FINAL REPORT Technical Report Documentation Page 2. Government Accession
1. Report No. FHWA/TX-10/0-5890-1 4. Title and Subtitle GUIDELINES FOR THE USE OF PAVEMENT MARKING SYMBOLS AT FREEWAY INTERCHANGES: FINAL REPORT Technical Report Documentation Page 2. Government Accession
SCOPE Application, Design, Operations,
 SCOPE Application, Design, Operations, Maintenance, etc.: Typical Traffic Control Signals Pedestrian Hybrid Beacons Emergency Vehicle One-Lane/Two-Way Facilities, Freeway Entrance Ramps, and Movable Bridges
Crash Analysis of I-64 Closure in St. Louis County
 Report # MATC-MST: 341 Final Report 25-1121-0001-341 Crash Analysis of I-64 Closure in St. Louis County Ghulam H. Bham, Ph.D. Professor Department of Civil, Architectural, and Environmental Engineering
How Might Connected Vehicles and Autonomous Vehicles Influence Geometric Design? October 10, 2017
 How Might Connected Vehicles and Autonomous Vehicles Influence Geometric Design? October 10, 2017 Overview Design Vehicle Design Driver Potential Geometric Impacts of Autonomous Vehicles Connected Vehicles
THE INSTALLATION OF PRE-SIGNALS AT RAILROAD GRADE CROSSINGS
 THE INSTALLATION OF PRE-SIGNALS AT RAILROAD GRADE CROSSINGS Lisa D. Sherman, Kenneth J. Petraglia, P.E. INTRODUCTION Each signalized intersection adjacent to a highway-rail grade crossing presents the
Pedestrian Hybrid Beacons
 Pedestrian Hybrid Beacons The 2011 Texas Manual on Uniform Traffic Control Devices (TMUTCD) included the Pedestrian Hybrid Beacons (PHB) for use at marked crosswalks which are not managed by a traffic
Evaluation of M-99 (Broad Street) Road Diet and Intersection Operational Investigation
 Road Diet and Intersection Operational Investigation") Evaluation of M-99 (Broad Street) Road Diet and Intersection Operational Investigation City of Hillsdale, Hillsdale County, Michigan June 16, 2016 Final Report Prepared for City of Hillsdale 97 North Broad
Evaluation of M-99 (Broad Street) Road Diet and Intersection Operational Investigation City of Hillsdale, Hillsdale County, Michigan June 16, 2016 Final Report Prepared for City of Hillsdale 97 North Broad
WORK ZONE SAFETY TOOLBOX
 Maryland State Highway Administration Page 1 of 18 REDUCED CHANNELIZING DEVICE SPACING A. INTRODUCTION To determine the spacing of channelizing devices, state Departments of Transportation (DOTs) and the
EVALUATING THE IMPACT OF TWO ALLOWABLE PERMISSIVE LEFT-TURN INDICATIONS
 EVALUATING THE IMPACT OF TWO ALLOWABLE PERMISSIVE LEFT-TURN INDICATIONS Michael A. Knodler Jr., Ph.D. Assistant Professor Department of Civil and Environmental Engineering University of Massachusetts-Amherst
Oregon Supplement to the Manual on Uniform Traffic Control Devices. Adopted July 2005 by OAR
 Oregon Supplement to the Manual on Uniform Traffic Control Devices Adopted July 2005 by OAR 734-020-0005 2003 Edition Oregon Supplement to the MUTCD Page 2 INTRODUCTION Traffic control devices installed
TRAFFIC SIGNAL WARRANT STUDY
 TRAFFIC SIGNAL WARRANT STUDY 5 th STREET & ENCHANTED PINES DRIVE JANUARY 2013 TRAFFIC OPERATIONS ENGINEERING SERVICES/PUBLIC WORKS DEPARTMENT TABLE OF CONTENTS INTERSECTION LOCATION MAP ii INTRODUCTION
TRANSMITTAL LETTER. Revision to Publication 149, Chapter 20 (Criteria for the Design of Traffic Signal Supports) - March 2009 Edition
 - March 2009 Edition") OS-299 (7-08) TRANSMITTAL LETTER PUBLICATION: Publication 149 - Traffic Signal Design Handbook DATE: 10/14/10 SUBJECT: Revision to Publication 149, Chapter 20 (Criteria for the Design of Traffic Signal
OS-299 (7-08) TRANSMITTAL LETTER PUBLICATION: Publication 149 - Traffic Signal Design Handbook DATE: 10/14/10 SUBJECT: Revision to Publication 149, Chapter 20 (Criteria for the Design of Traffic Signal
Module 3 Developing Timing Plans for Efficient Intersection Operations During Moderate Traffic Volume Conditions
 Module 3 Developing Timing Plans for Efficient Intersection Operations During Moderate Traffic Volume Conditions CONTENTS (MODULE 3) Introduction...1 Purpose...1 Goals and Learning Outcomes...1 Organization
Pavement Markings (1 of 3)
") Pavement Markings (1 of 3) DESCRIPTION AND DEFINITION Disadvantages Relatively high cost (over typical Crash reduction as yet unknown painted edge line) No tactile effect The STOP AHEAD pavement marking
Pavement Markings (1 of 3) DESCRIPTION AND DEFINITION Disadvantages Relatively high cost (over typical Crash reduction as yet unknown painted edge line) No tactile effect The STOP AHEAD pavement marking
Shortening or omitting a pedestrian change interval when transitioning into preemption
 Signals #1 NOTE: This is a recommendation by the Signals Technical Committee of the NCUTCD. It is being distributed to the NC Sponsoring agencies for review and is subject to revision. This recommendation
DEFINITIONS Activity Area - Advance Warning Area Advance Warning Sign Spacing Advisory Speed Approach Sight Distance Attended Work Space
 DEFINITIONS Activity Area - that part of a TTC zone activity area where the work actually takes place. It consists of the work space, traffic space and one or more buffer spaces. Advance Warning Area -
Truck Climbing Lane Traffic Justification Report
 ROUTE 7 (HARRY BYRD HIGHWAY) WESTBOUND FROM WEST MARKET STREET TO ROUTE 9 (CHARLES TOWN PIKE) Truck Climbing Lane Traffic Justification Report Project No. 6007-053-133, P 101 Ι UPC No. 58599 Prepared by:
CHAPTER 1 STANDARD PRACTICES
 CHAPTER 1 STANDARD PRACTICES OBJECTIVES 1) Functions and Limitations 2) Standardization of Application 3) Materials 4) Colors 5) Widths and Patterns of Longitudinal Pavement Marking Lines 6) General Principles
Abstract. Background. protected/permissive operation. Source: Google Streetview, Fairview/Orchard intersection
 ITE 2015 Western District Annual Meeting Ada County Highway District s Flashing Yellow Arrow Initiative Primary Author: Tim Curns, PE Ada County Highway District Traffic Engineer Author: Andrew Cibor,
Chapter V TRAFFIC CONTROLS. Tewodros N.
 Chapter V TRAFFIC CONTROLS www.tnigatu.wordpress.com tedynihe@gmail.com Lecture Overview Traffic markings Longitudinal markings Transverse markings Object markers and delineator Traffic signs Regulatory
Railroad Inspection Procedure Manual
 Railroad Inspection Procedure Manual Railroad Inspection Procedure Manual Table of Contents Introduction... 1 Inspection Report t For orm... 3 Instructions for Completing Inspection Report t For orms...
APPENDIX A TWO-LANE RURAL ROADS ELEMENTS OF DESIGN CREST VERTICAL CURVES
 APPENDIX A TWO-LANE RURAL ROADS ELEMENTS OF DESIGN CREST VERTICAL CURVES 1. Two-lane Rural Roads 1.1 Introduction The definition of rural area can be derived from the definition of urban areas. Officially,
Attachment No. 4 Approved by National Committee Council
 Attachment No. 4 Approved by National Committee Council The Signals Technical Committee distributed a technical committee recommendation to sponsors concerning pedestrian hybrid beacons following the January
TRAFFIC CONTROLS FOR BICYCLE FACILITIES
 PART IX. TRAFFIC CONTROLS FOR BICYCLE FACILITIES A. GENERAL 9A-1 Requirements for Bicyclist Traffic Control Devices Traffic control devices, whether they are intended for motorists or bicyclists, must
Pedestrian Treatments by
 Pedestrian Treatments by Kay Fitzpatrick Texas A&M Transportation Institute TxDOT Short Course October 15-16, 2013 Recent Research Efforts FHWA Studies Crosswalk markings Driver yielding (DY) at rectangular
UNCONTROLLED PEDESTRIAN CROSSING GUIDELINES
 City and County of Denver UNCONTROLLED PEDESTRIAN CROSSING GUIDELINES Prepared for: Prepared by: Adopted September 2016 This page is intentionally left blank. Contents for Denver Uncontrolled Pedestrian
THE EFFECTIVENESS OF LOW-COST TRAFFIC CALMING APPLICATIONS APPROPRIATE FOR MAIN STREETS THROUGH RURAL COMMUNITIES
 THE EFFECTIVENESS OF LOW-COST TRAFFIC CALMING APPLICATIONS APPROPRIATE FOR MAIN STREETS THROUGH RURAL COMMUNITIES Eric R. Petersen Civil Engineering (M.S.) Student Iowa State University (515) 223-6534
IMPROVING PEDESTRIAN SAFETY AT UNCONTROLLED CROSSINGS. Guidelines for Marked Crosswalks
 IMPROVING PEDESTRIAN SAFETY AT UNCONTROLLED CROSSINGS Presented by Nazir Lalani P.E. Traffex Engineers Inc. N_lalani@hotmail.com Guidelines for Marked Crosswalks Source: FHWA, Safety Effects of Marked
Work Zone Traffic Safety
 Work Zone Traffic Safety Summary The Hazard: death or serious injury from being struck by vehicles or equipment in work zones. Who is at risk: streets/highways, utilities and other public works department
STEP. Rectangular Rapid Flashing Beacons. Safe Transportation for Every Pedestrian
 STEP Safe Transportation for Every Pedestrian Rectangular Rapid Flashing Beacons Duane Thomas, Federal Highway Administration Megan McCarty Graham, Toole Design October 30, 2018 Housekeeping Problems with
Appendix B Warrants, Standards, and Guidelines for Traffic Control Devices used at Senior Citizen and Disabled Person Crossings
 Appendix B Warrants, Standards, and Guidelines for Traffic Control Devices used at Senior Citizen and Disabled Person Crossings B.1 General Minnesota Statute 169.215 and Highway Traffic Regulation 169.222
Transportation Advisory Board
 C I T Y O F WEATHERFORD Transportation Advisory Board AGENDA REPORT Meeting Date: October 15,2015 Staff Contact: Manny Palacios Jr. Phone: E-mail: 817-598-4296 mpalacios@weatherfordtx.gov SUBJECT: Discuss
Monroe County Department of Transportation Vertical Curve Safety Study
 Monroe County, New York PREPARED FOR: Monroe County Department of Transportation 50 West Main Street Suite 6100 Rochester, NY 14614 PREPARED BY: 255 East Avenue Rochester, New York 14604 project # 434934
The Effect of Pavement Marking on Speed. Reduction in Exclusive Motorcycle Lane. in Malaysia
 Contemporary Engineering Sciences, Vol. 3, 2010, no. 3, 149-155 The Effect of Pavement Marking on Speed Reduction in Exclusive Motorcycle Lane in Malaysia Seyed Farzin Faezi PhD student in highway and
A Residential Guide to Neighborhood Speed Enforcement
 A Residential Guide to Neighborhood Speed Enforcement City of Delaware, Ohio A Residential Guide to Neighborhood Speed Enforcement Introduction: The perception of speeding on local streets is probably
Traffic Control and Accidents at Rural High-Speed Intersections
 14 TRANSPORTATION RESEARCH RECORD 1160 Traffic Control and Accidents at Rural High-Speed Intersections KENNETH R. AGENT ln many Instances, when rural high-speed highways are constructed, there are a number
Chapter 5 DATA COLLECTION FOR TRANSPORTATION SAFETY STUDIES
 Chapter 5 DATA COLLECTION FOR TRANSPORTATION SAFETY STUDIES 5.1 PURPOSE (1) The purpose of the Traffic Safety Studies chapter is to provide guidance on the data collection requirements for conducting a
Appendix T CCMP TRAIL TRAFFIC & TRANSPORTATION DESIGN STANDARD
 Appendix T CCMP 3.3.4 TRAIL TRAFFIC & TRANSPORTATION DESIGN STANDARD 3.3.4 Trail Traffic and Transportation Design Multi-use trails have certain design standards, which vary depending on the agency that
PEDESTRIAN SAFETY IMPROVEMENT EVALUATION GUIDELINE FOR UNCONTROLLED CROSSINGS
 PEDESTRIAN SAFETY IMPROVEMENT EVALUATION GUIDELINE FOR UNCONTROLLED CROSSINGS Traffic Safety Engineering Division Updated: April 2018 EXECUTIVE SUMMARY NDOT Traffic Safety Engineering Division developed
Safety Assessment of Installing Traffic Signals at High-Speed Expressway Intersections
 Safety Assessment of Installing Traffic Signals at High-Speed Expressway Intersections Todd Knox Center for Transportation Research and Education Iowa State University 2901 South Loop Drive, Suite 3100
Geometric Design Tables
 Design Manual Chapter 5 - Roadway Design 5C - Geometric Design Criteria 5C-1 Geometric Design Tables A. General The following sections present two sets of design criteria tables - Preferred Roadway Elements
Yellow and Red Intervals It s Just a Matter of Time. 58 th Annual Alabama Transportation Conference February 9, 2015
 Yellow and Red Intervals It s Just a Matter of Time 58 th Annual Alabama Transportation Conference February 9, 2015 Presentation Content Background on Timing Methodology Findings and Recommendations from
MANUAL ON UNIFORM TRAFFIC CONTROL DEVICES INTRODUCTION
 2011 Edition Page I-1 MANUAL ON UNIFORM TRAFFIC CONTROL DEVICES INTRODUCTION 01 Traffic control devices shall be defined as all signs, signals, markings, and other devices used to regulate, warn, or guide
City of Albert Lea Policy and Procedure Manual 4.10 ALBERT LEA CROSSWALK POLICY
 4.10 ALBERT LEA CROSSWALK POLICY PURPOSE: Pedestrian crosswalks are an integral part of our transportation infrastructure. To be effective and promote safety, marked crosswalks must be installed after
Figure 3B-1. Examples of Two-Lane, Two-Way Marking Applications
 Figure 3B-1. Examples of Two-Lane, Two-Way Marking Applications A - Typical two-lane, two-way marking with passing permitted in both directions B - Typical two-lane, two-way marking with no-passing zones
Texas Transportation Institute The Texas A&M University System College Station, Texas
 2. Government Accession No. 3. Recipient's Catalog No. 1. Report No. FHWA/TX-01/1845-2 4. Title and Subtitle AT-GRADE INTERSECTIONS NEAR HIGHWAY-RAILROAD GRADE CROSSINGS Technical Report Documentation
The 2009 Manual on Uniform Traffic Control Devices (MUTCD) (Brief) Highlights for Arizona Practitioners. Arizona Department of Transportation
 (Brief) Highlights for Arizona Practitioners. Arizona Department of Transportation") The 2009 Manual on Uniform Traffic Control Devices (MUTCD) (Brief) Highlights for Arizona Practitioners Arizona Department of Transportation New 2009 MUTCD 9 Parts (down from 10 in 2003) 816 pages (up
The 2009 Manual on Uniform Traffic Control Devices (MUTCD) (Brief) Highlights for Arizona Practitioners Arizona Department of Transportation New 2009 MUTCD 9 Parts (down from 10 in 2003) 816 pages (up
2C-3 Placement of Warning Signs
 C. WARNING SIGNS 2C-1 Application of Warning Signs Warning signs are used when it is deemed necessary to warn traffic of existing or potentially hazardous conditions on or adjacent to a highway or street.
Turn Lane Warrants: Concepts, Standards, Application in Review
 Turn Lane Warrants: Concepts, Standards, Application in Review David J. DeBaie P.E., P.T.O.E. 2004 ITE, District 1 Annual Meeting Burlington, Vermont Introduction Turning lanes at intersections reduce
Section 3A.04 Colors. Section 3B.10 Approach Markings for Obstructions
 Section 3A.04 Colors Markings shall be yellow, white, red, or blue, or purple. The colors for markings shall conform to the standard highway colors. Black in conjunction with one of the above colors shall
METHODOLOGY. Signalized Intersection Average Control Delay (sec/veh)
") Chapter 5 Traffic Analysis 5.1 SUMMARY US /West 6 th Street assumes a unique role in the Lawrence Douglas County transportation system. This principal arterial street currently conveys commuter traffic
Chapter 5 Traffic Analysis 5.1 SUMMARY US /West 6 th Street assumes a unique role in the Lawrence Douglas County transportation system. This principal arterial street currently conveys commuter traffic
October 2004 REVISIONS (2) SUPERELEVATION DEVELOPMENT 11.3(2)
 SUPERELEVATION DEVELOPMENT 11.3(2)") October 2004 REVISIONS (2) Chapter 11 HORIZONTAL ALIGNMENT SUPERELEVATION DEVELOPMENT 11.3(2) Chapter 12 VERTICAL ALIGNMENT VERTICAL CURVES PASSING SIGHT DISTANCE 12.5(2) VERTICAL CURVES STOPPING SIGHT
October 2004 REVISIONS (2) Chapter 11 HORIZONTAL ALIGNMENT SUPERELEVATION DEVELOPMENT 11.3(2) Chapter 12 VERTICAL ALIGNMENT VERTICAL CURVES PASSING SIGHT DISTANCE 12.5(2) VERTICAL CURVES STOPPING SIGHT
PART 7. TRAFFIC CONTROLS FOR SCHOOL AREAS CHAPTER 7A. GENERAL
 2012 Edition Page 825 Section 7A.01 Need for Standards January 13, 2012 PART 7. TRAFFIC CONTROLS FOR SCHOOL AREAS CHAPTER 7A. GENERAL 01 Regardless of the school location, the best way to achieve effective
Pavement Markings to Reduce Lane Departure Crashes. Paul Carlson, PhD, PE Road Infrastructure Inc.
 Pavement Markings to Reduce Lane Departure Crashes Paul Carlson, PhD, PE Road Infrastructure Inc. 1 6-inch Edge Lines 10 years ago Agencies liked the looks of wider edge lines but did not have evidence
M-58 HIGHWAY ACCESS MANAGEMENT STUDY Mullen Road to Bel-Ray Boulevard. Prepared for CITY OF BELTON. May 2016
 M-58 HIGHWAY ACCESS MANAGEMENT STUDY Prepared for CITY OF BELTON By May 2016 Introduction Missouri State Highway 58 (M-58 Highway) is a major commercial corridor in the City of Belton. As development has
CHAPTER 2F. TOLL ROAD SIGNS. Table 2F-1. Toll Road Sign and Plaque Minimum Sizes
 2011 Edition Page 249 Section 2F.01 Scope CHAPTER 2F. TOLL ROAD SIGNS 01 Toll highways are typically limited-access freeway or expressway facilities. A portion of or an entire route might be a toll highway,
The Corporation of the City of Sarnia. School Crossing Guard Warrant Policy
 The Corporation of the City of Sarnia School Crossing Guard Warrant Policy Table of Contents Overview And Description... 2 Role of the School Crossing Guard... 2 Definition of a Designated School Crossing...