Haig Park Masterplan and CMP Utilisation Study Report
|
|
|
- Myra Underwood
- 5 years ago
- Views:
Transcription

1 Haig Park Masterplan and CMP Utilisation Study Report
2 Report Information Document Name Reference Prepared by On behalf of Utilisation Study Report Tait Waddington Office of the Coordinator-General, Urban Renewal Revision History Revision Number Revision Date Details Authorised A 13/04/2017 For Review by OCG Obelia Tait B 8/05/2017 Draft Final Obelia Tait C 22/06/2017 Final Obelia Tait
3 Table of Contents Executive Summary Introduction Background Purpose Study Location and Area Methodology Public Spaces Public Life (PSPL) Scope Limitations Information Collected Movement Counts User Activity Study Context ABS Community Profile Public Land Use Bookings Study Results and Analysis: Movement Counts Movement by Gender Weekday Weekend Movement by Age Weekday Weekend Movement by Mode Weekday Weekend Study Results and Analysis: User Activity User Activity by Gender Weekday Weekend User Activity by Age Weekday Weekend User Activity by Type of Activity Weekday... 18
4 5.3.2 Weekend Conclusion References Attachments... 22
5 Executive Summary Tait Waddington is currently preparing a revised Masterplan and Conservation Management Plan for Haig Park that conserves, respects and promotes the park s heritage significance and its important place in the future of the city. Haig Park is on the ACT Heritage Register as a rare example of windbreak planting on a large scale and it forms an important feature of Canberra s urban landscape. It represents a significant opportunity to support the growing population of the city s Inner North, and the Braddon and Turner mixed use precincts. Part of the master planning process involves undertaking a Utilisation Study, with the purpose of gathering detailed information on how people currently use Haig Park. The Study looks at the who, where and what of current activity in Haig Park over two sample days, which constitutes an important step in understanding patterns of behaviour within the park. The Study employs the methodology used by Jan Gehl and Birgitte Svarre s for their Public Spaces Public Life (PSPL) studies. Counting and recording observations about movement and stationary activities were the nominated methods used to collect data about how the park is used. The key findings arising from the Study are as follows: More people move through the park than stay within it for a period of time; Nearly two-thirds of those who either travel through or stay in the park are male; Dog walking is the most popular activity in the park, making up nearly one third of park users; On the weekend, the park is also frequently used for play, including walking, jogging or other exercise; Zone 2 had the highest number of people moving through the park on both weekdays and at weekends, whilst Zone 4 had the least; Zone 3 is the busiest area for people staying in Haig Park, whilst the least used are Zone 1 on weekends and Zone 5 on weekdays; Children and seniors make up less than a quarter of park users overall; The typical person using Haig Park is an adult male cycling through Zone 2 on a weekday morning. Given the number of people who live within the vicinity of the Park as well as the number of public space bookings over the past 5 years, it would appear that Haig Park is under-utilised relative to other parks and open spaces in Canberra. These results constitute a preliminary set of data analysing the existing public life of Haig Park and will inform the development of the Masterplan and Conservation Management Plan. 1
6 1.0 Introduction 1.1 Background In November 2016, the ACT Government issued a brief for an endorsed revised Haig Park Masterplan and a Conservation Management Plan (CMP) approved by the ACT Heritage Council. The purpose of the Masterplan is to conserve, respect and promote the park s heritage significance and its important place in the future of the city. It will provide guiding principles and strategies to support a long-term vision for the park and short term actions to support the vision. The CMP will explain why Haig Park is significant and will provide conservation policies to guide the future development and use of the park. The 2017 Master Plan and CMP build on a Draft Haig Park Master Plan Report prepared by Eric Martin and Associates, and sub-consultant Enviro Links Design, in Its recommendations included the retention of the park s heritage significance and the upgrading of frequently used walking paths. Since 2012 some improvements to signage, bins and seating have been carried out, and at the time of this Utilisation Study new paths and lighting were being installed in the area to the north of the Braddon commercial area. The previous masterplan also highlighted the importance of improving the park s perceived safety, particularly at night. This was also noted in the Crime Prevention Through Environmental Design assessment by the AFP which resulted in a high rating. Tait Waddington, with sub-consultant Navin Officer Heritage Consultants, commenced work on this project in January This Utilisation Study Summary Report (the Report) summarises the utilisation survey that was undertaken on Haig Park, which provides an understanding of the number and characteristics of users of the park. This Utilisation Study Summary Report is one of three background reports being prepared as part of the Master Plan and CMP, the others being the Site Analysis Report and the Community Engagement Report. The Site Analysis Report forms a background report to the Master Plan and CMP. It summarises the analysis work undertaken by the project team. The Community Engagement Report summarises the community engagement program, undertaken by the ACT Government, which is being run concurrently with all stages of the development of the Haig Park Master Plan and CMP. 1.2 Purpose The purpose of the Haig Park Utilisation Study is to gather detailed information on how people currently use Haig Park. The aims of the Study can be described as follows: To count how many people use the park within a given time period this records patterns of movement throughout the day on the weekend and during the week; To investigate how observed people use different areas of the park; To identify zones of high or low activity; To identify the distribution of age group and gender among park users; To establish a base set of observations, derived from a reliable, valid and repeatable methodology, which can be used as a reference point for future studies, particularly those carried out following the implementation of the Masterplan. 2
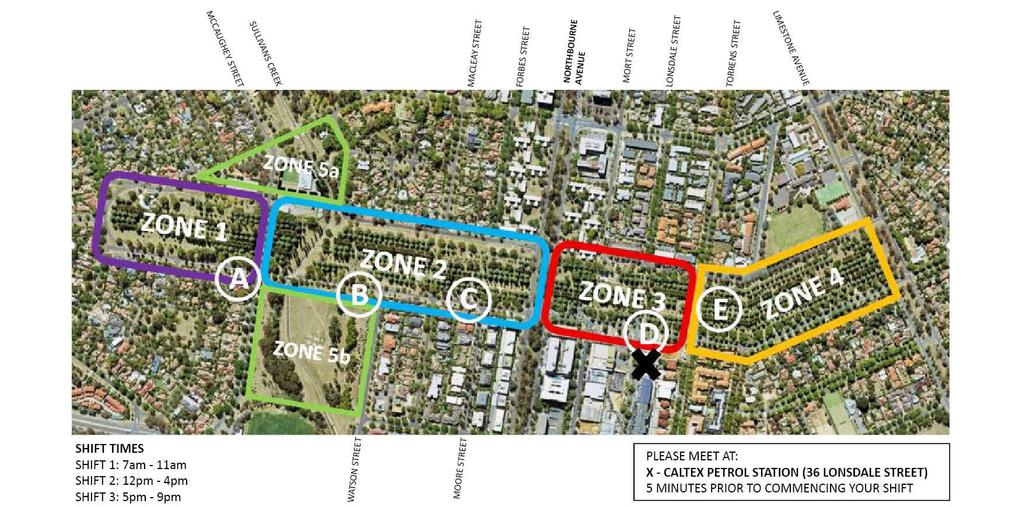
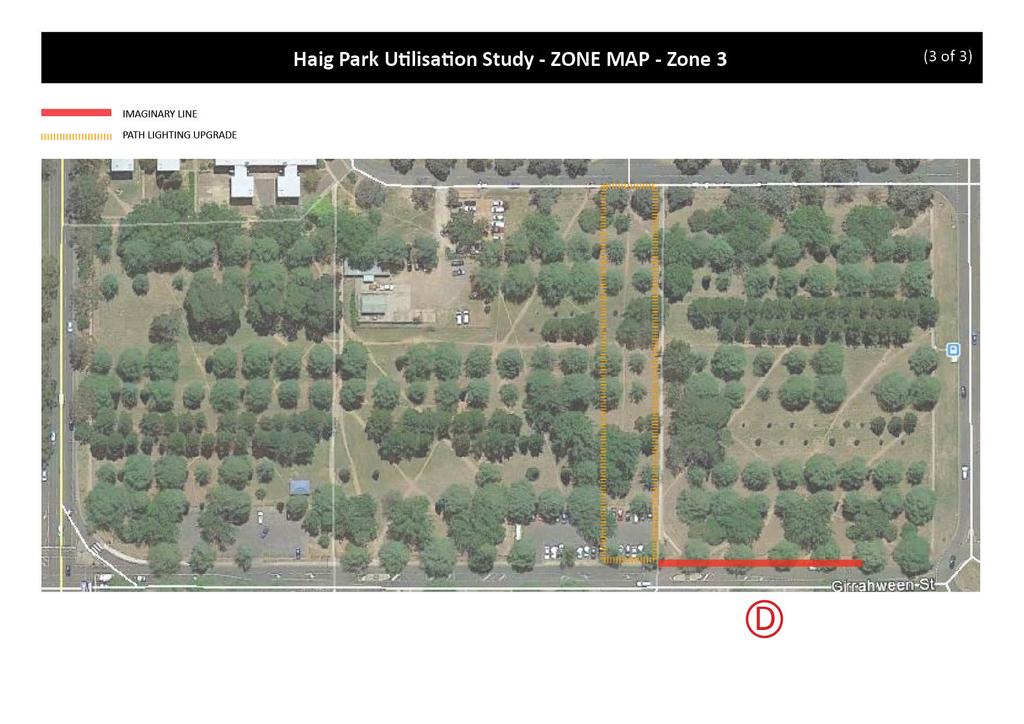
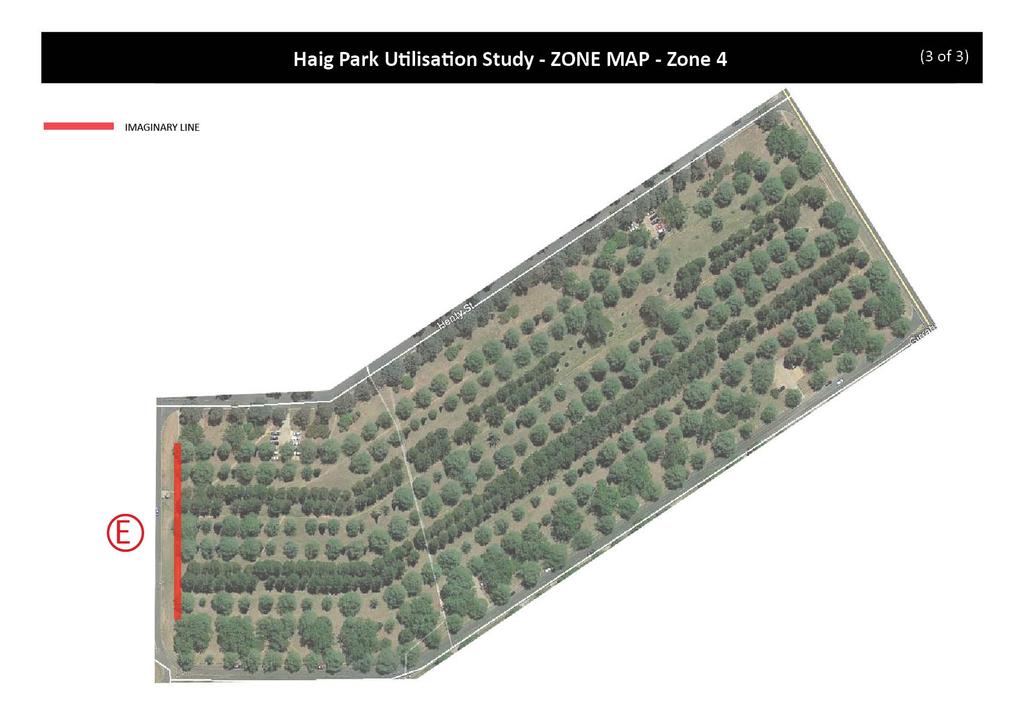
7 1.3 Study Location and Area Haig Park is located just north of the Civic Centre in the suburbs of Braddon and Turner. Constructed in as a shelterbelt comprising predominantly evergreen trees, the park is long and narrow (1780m long x 145m wide), and approximately 19 hectares. Bisected by Northbourne Avenue, a significant approach corridor, Haig Park is book ended by Froggatt Street, on the west, and Limestone Avenue on the east. Haig Park is listed on the ACT Heritage Register as a rare example of windbreak planting on such a large scale (that) remains highly intact and which is to be conserved in perpetuity. The study area includes an area of influence adjacent to the Sullivans Creek section of the park, comprising Turner Parkland to the south and recreational facilities to the north. For the purposes of the Utilisation Study, Haig Park has been divided into five zones, as defined in the ACT Government s YourSay online engagement portal (Appendix A). Zone 1 to Zone 4 are located in the park proper, with McCaughey St, Northbourne Avenue and Torrens Street separating each zone. Zone 5 is the area of influence adjacent to Zone 1 and 2. 3
8 2.0 Methodology 2.1 Public Spaces Public Life (PSPL) The Utilisation Study draws on the methodology of Jan Gehl and Birgitte Svarre s Public Spaces Public Life (PSPL) investigative tool box for studying public life. This methodology has been used in a number of other contexts, which in Australia include Wollongong (2016), Adelaide (2002 and 2011), Launceston (2011), Hobart (2010), Perth (2009) and Sydney (2007). The Utilisation Study employs the following tools: Counting all human-powered forms of transport, including pedestrian traffic, moving through Haig Park; Behavioural mapping recording the number and type of stationary activities by people who stayed and spent time in Haig Park; Surveys through observation of age and gender, identify who is and who isn t using Haig Park. Recording observations about movement and stationary activities provides a quantifiable snapshot about the quality of an urban space. 2.2 Scope A Utilisation Study Strategy was developed in February 2017, in consultation with the Office of the Co-Ordinator General, Urban Renewal. This set out the purpose and background for the Study, as well as outlining the proposed methodology. Prior to the commencement of the Study, Tait Waddington staff members visited the study site to refine the study methodology and carry out pilot testing. As part of this process, a number of suitable collection points were identified, based on their being indicative of movement through each Zone and being adequately lit during night time hours. Tait Waddington then engaged a team of City Making Enthusiasts to carry out the Study over the equivalent of two days. The team included students from the University of Canberra s Faculty of Arts and Design and other practitioners of built environment disciplines sourced through professional affiliations of Tait Waddington. Approximately 20 people were recruited for the period of the Study. Two study days were selected one weekday (Friday 3 rd March 2017) and one weekend day (Saturday 4 th March 2017). Each day was divided into the following data collection periods of four hours duration: Shift 1: 7.00am 11.00am Shift 2: noon 4.00pm Shift 3: 5.00pm 9.00pm Weather conditions are an important consideration in the implementation of any public life study. Gehl and Svarre (2013) recommend undertaking the Study on days that provide optimal conditions for outdoor activity and in the event of inclement weather, combining several partdays of study into the equivalent of one study day. Accordingly, since Canberra experienced significant rainfall on the identified weekend day, the Study was carried out the following Saturday (11 th March). The results were then collated to make up one full weekday and weekend day of pedestrian traffic counts and activities in Haig Park. All team members were supported during their shift by Tait Waddington staff members. Tait Waddington provided all the team members with the necessary tools to undertake the Study, 4
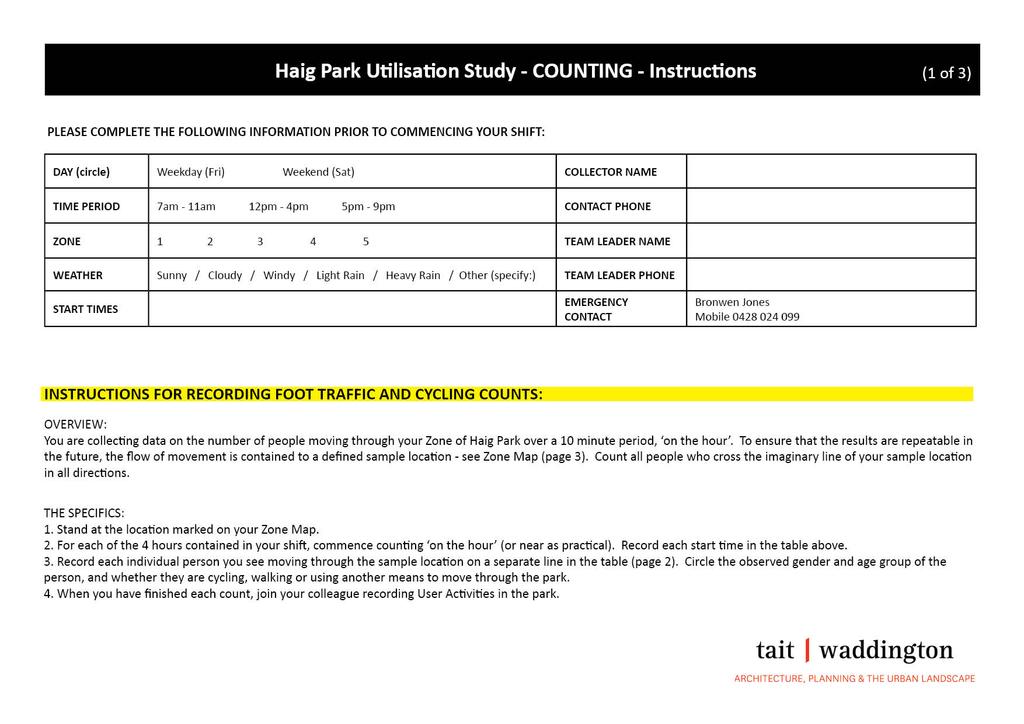
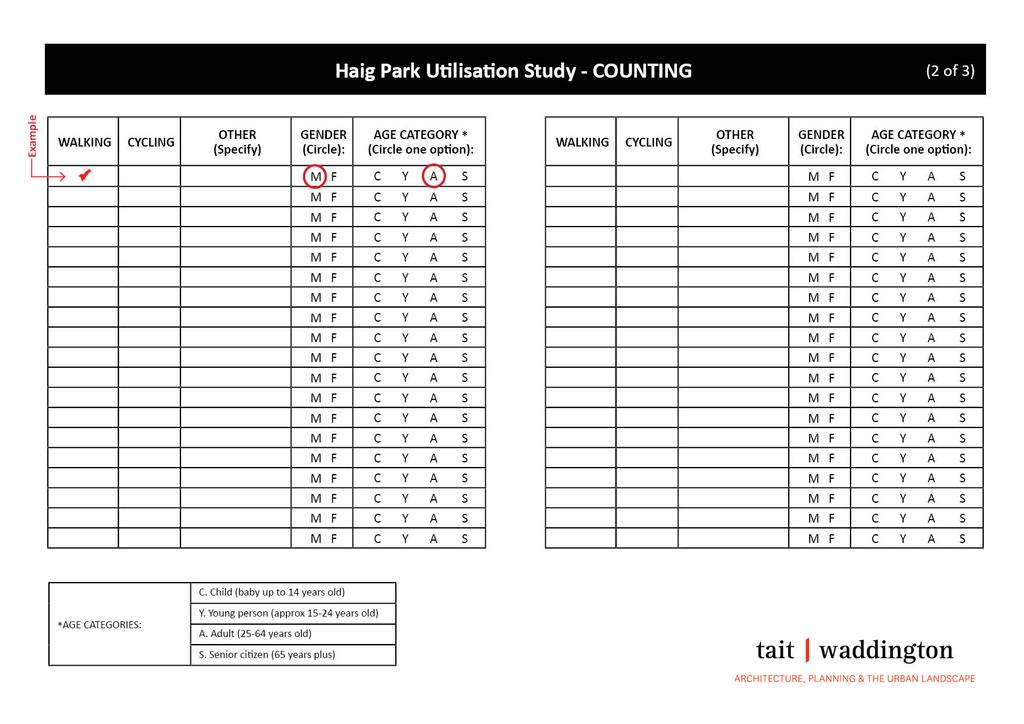
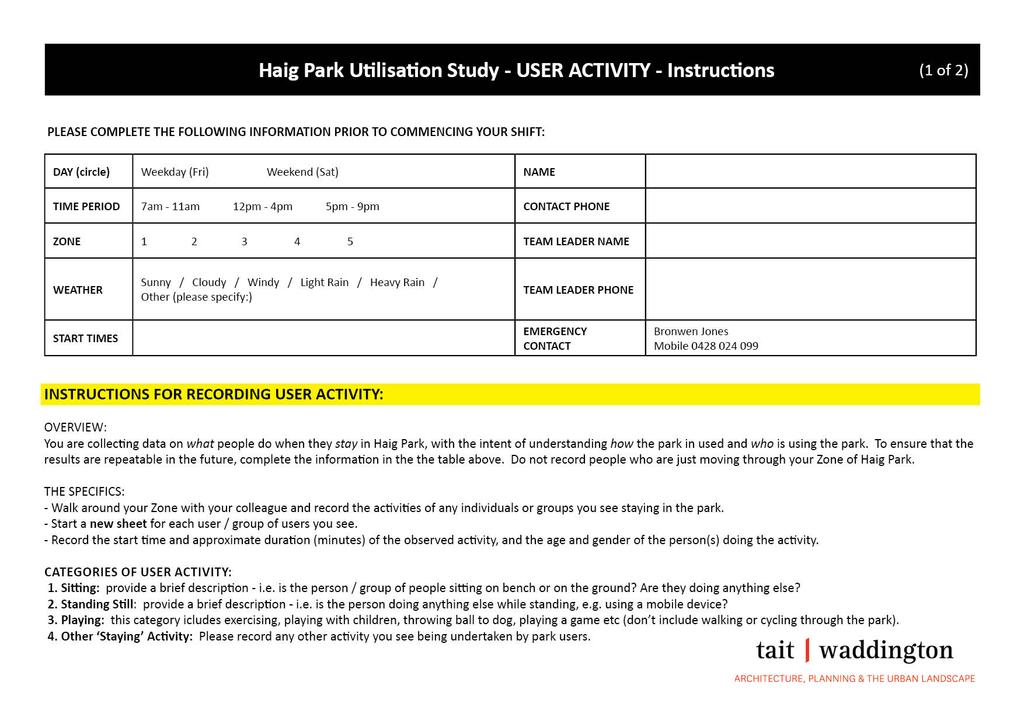
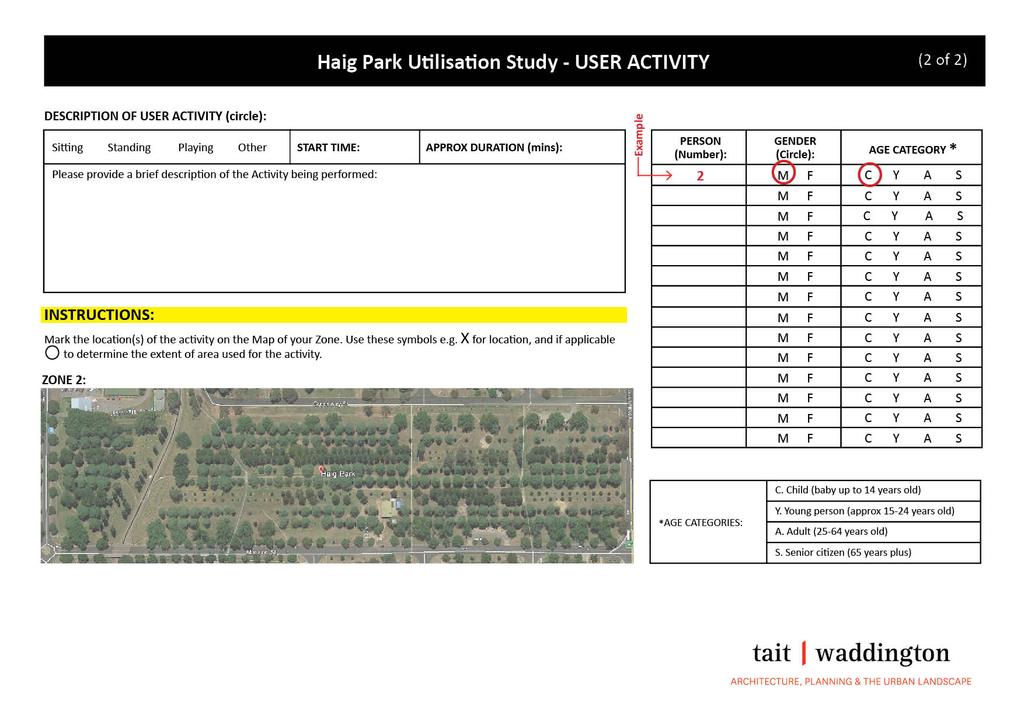
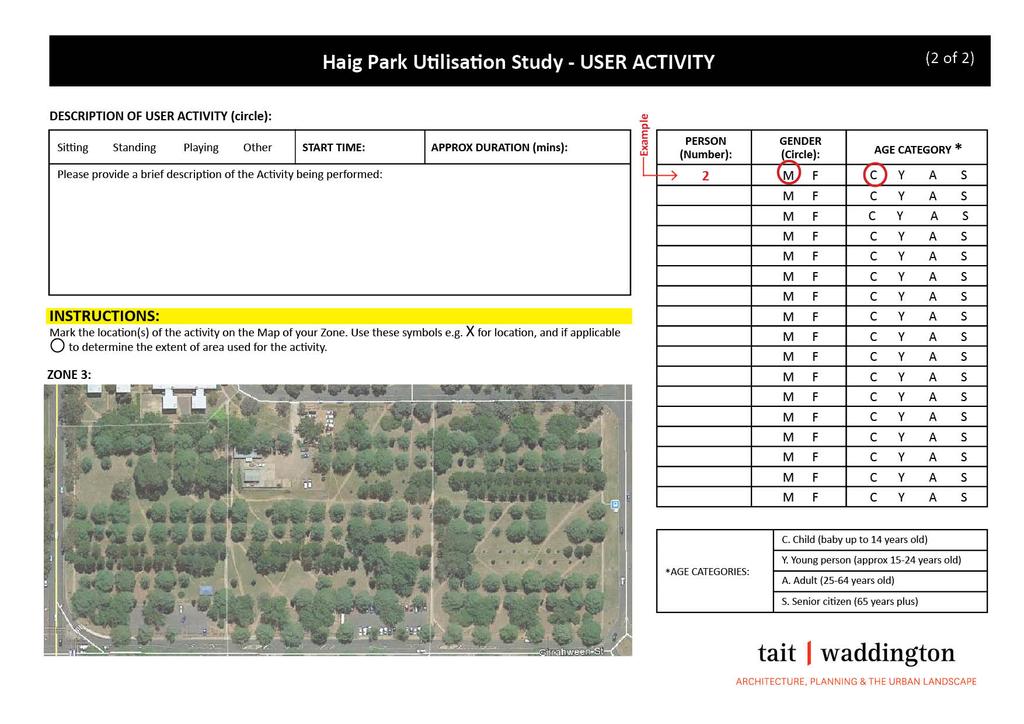
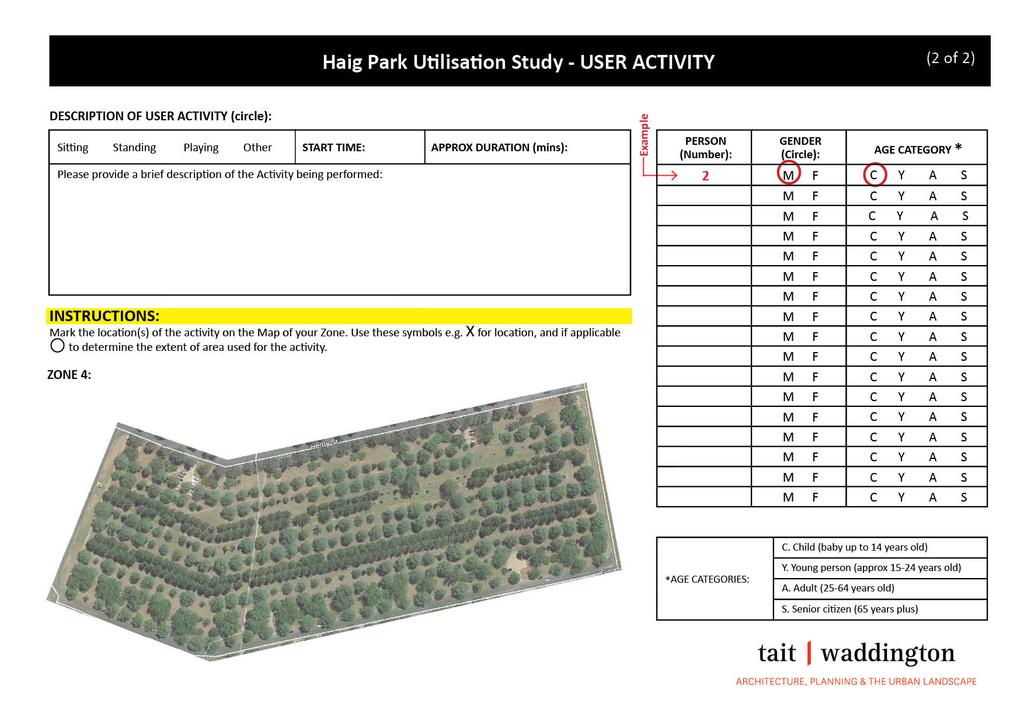
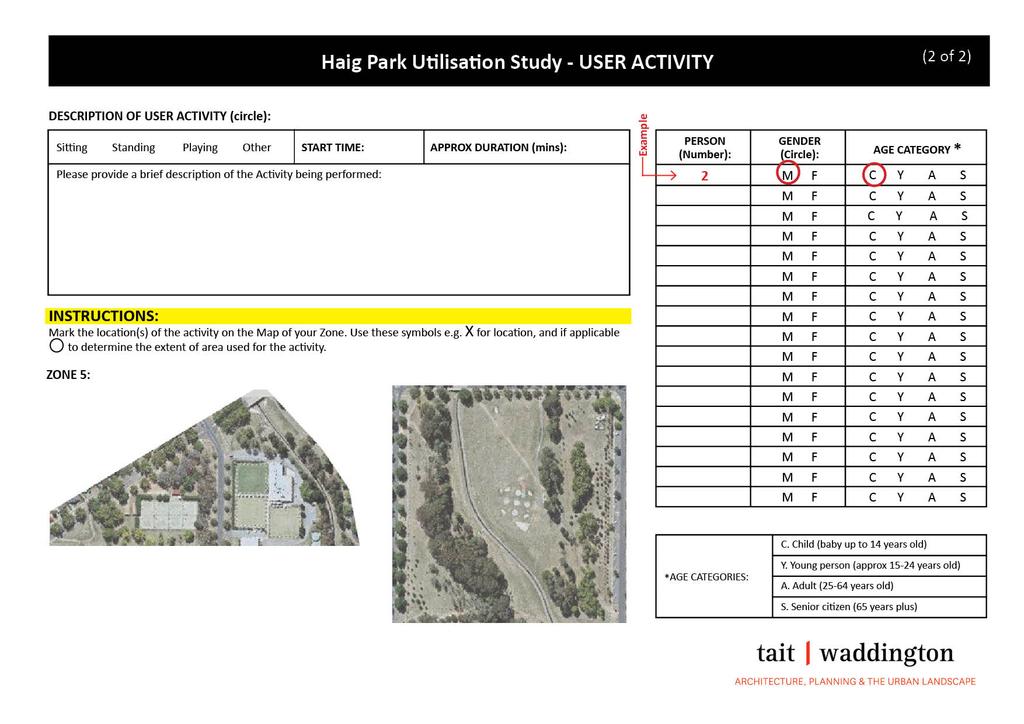
9 including data collection sheets, clipboards, pens and name tags. The completed data collection sheets were collected by a Tait Waddington staff member at the end of each shift. Additionally, due to Haig Park being rated High in a recent Crime Prevention Through Environmental Design (CPTED) assessment, the Australian Federal Police were informed of the study activities and additional security measures were observed during the night time shifts. 2.3 Limitations The following limitations of the Utilisation Study have been identified: As noted above, rainfall on the two days identified as the initial study period is likely to have affected the numbers of people moving through and using Haig Park. To address this, an additional study day was provided for in the following week. The additional study day, Saturday 11 March fell during the Canberra Day long weekend, which may have affected visitor numbers. In February 2017, the ACT Government commenced work on safety upgrades to paths and lighting in the Braddon area of Haig Park. At the time of the Study, the shared path from Lonsdale St to Henty St had been fenced off, meaning that some people who would normally traverse the park using that route would have needed to use an alternate route. During pilot testing an alternative route was identified for the collection of movement counts through Zone 3 of the park which was deemed to capture the majority of people who would otherwise have used the fenced-off path. Like any strictly observational study, there is a degree of judgement involved in ascertaining the age and gender of a park user. Volunteers were asked to record this information using a best guess assessment. This may lead to a small degree of misclassification of the age or gender of park users. As the Study captures only limited, observational characteristics of park users it is not possible to distinguish between new individual users of the park and those who made multiple visits over the course of the study days. For the purposes of this Study, however, quantifying the number of unique park visitors is not seen as a key factor in determining an overall picture of who, how and where Haig Park is being used. While the Utilisation Study provides a snapshot of the frequency and types of user activities in Haig Park, a more detailed examination of staying behavior would be needed to assess the factors that motivate people to stay for a period of time in each Zone. No utilisation studies using this methodology have been undertaken in the ACT. Other studies of parks of a comparable size to Haig Park, either in Canberra or another city with similar population density, would be a useful resource and provide more context for this information. 2.4 Information Collected The same type of information was collected for both counting and activity, and the same techniques were employed on all study days. Two sets of data collection sheets were designed for this Study: 1. Counting Sheets used for recording pedestrian traffic counts at specific, pre-identified locations in Zones 1-4, 2. User Activity Sheet used for recording of user activities within the park that involved staying for a period of time. Activities were recorded across all five Zones. Sample data collection sheets are included at Attachment 2 and Attachment 3. Both the Count and User Activity data collection sheets required the team member to record the following details at the commencement of the shift: Day (Weekday / Weekend); Time Period (7am-11am / 12pm-4pm / 5pm 9pm); 5
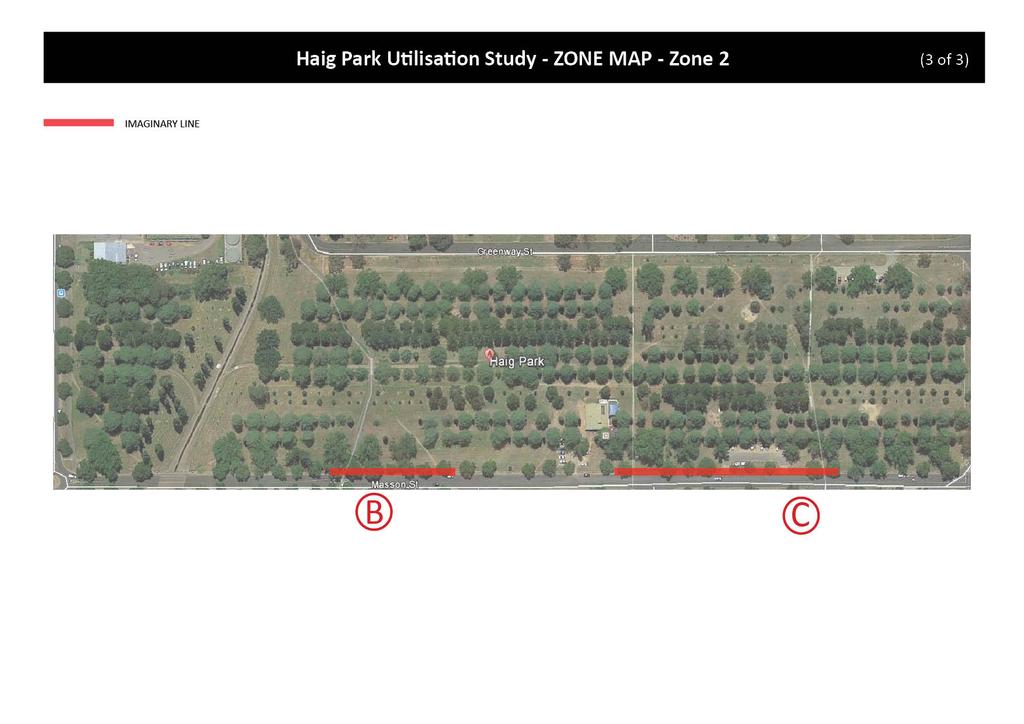
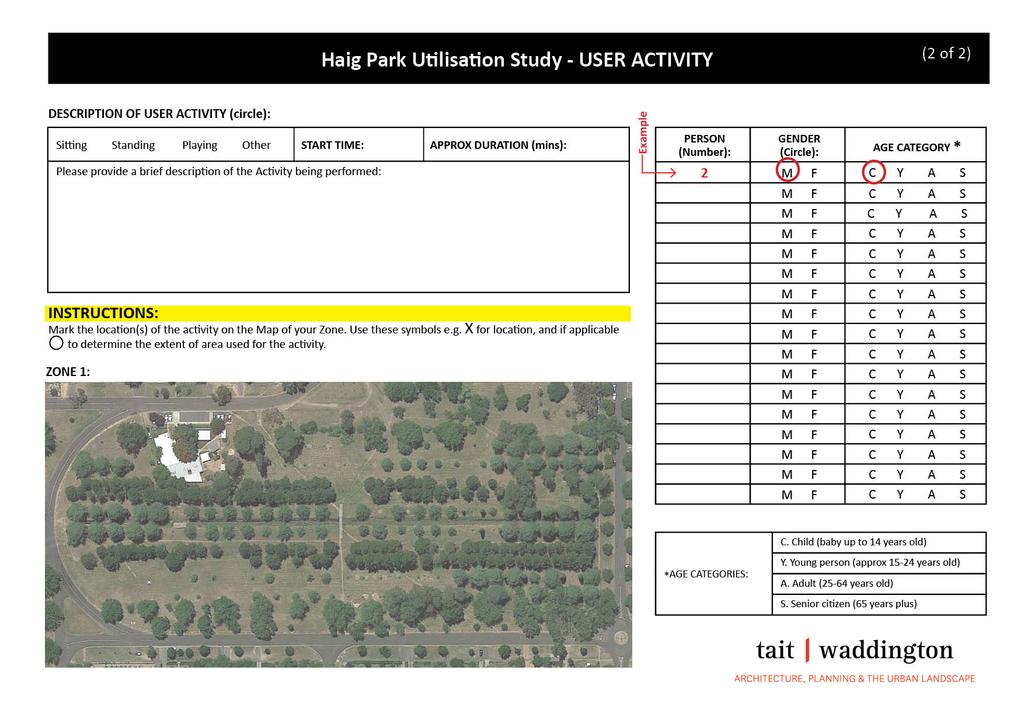
10 Zone (1 / 2 / 3 / 4 / 5); Weather conditions (Sunny / Cloudy / Windy / Light Rain / Heavy Rain / Other (specify); Start times for the observed counts or activity; Data collector s name and contact information; Team leader s name and contact information; Emergency contact number. Age of people was recorded for both investigative tools employed in this Study. Age categories were defined as follows: Child (from baby up to 14 years old); Young person (approximately years old); Adult (25-64 years old); Senior (65 years plus). As noted above age was recorded on an observation basis only, with team members were instructed to make a best guess assessment. 2.5 Movement Counts Team members recorded the number of people moving through their assigned Zone of Haig Park over a ten minute period, at the start of each hour, over the course of the four hour shift. For example if the shift was from 7am-11am, movement counts were recorded from 7:00-7:10, 8:00-8:10, 9:00-9:10 and 10:00-10:10. Team members were provided with a map of their Zone with the count location marked as a line (Attachment 2). They were then instructed to count all people who crossed this imaginary line in all directions. The following information about each person observed was also recorded: Whether the person was walking, cycling, or using some other mode to move through the park; The observed gender of the person being counted; The observed age category of the person being counted. 2.6 User Activity Team members walked around their assigned Zone and recorded the activities of any individuals or groups staying in the park. The data collection sheet included a map of the relevant zone for the team member to mark the indicative location of the activity. Team members were instructed to use a separate sheet for each user or group of users, and to record the start time, approximate duration and a written description of each observed activity. The following information about each activity was also recorded: Description of activity (Sitting / Standing / Playing / Other); Observed gender of the person or people participating in the activity; Observed age category of the person or people participating in the activity. For the purposes of this Study, Playing included exercising, playing with children, throwing a ball to a dog, playing a game but not walking or cycling through the park. Dog walking was included in the Other category. Sitting included sitting on benches or at tables already in the park, on portable chairs or the ground. 6
11 3.0 Study Context 3.1 ABS Community Profile The Australian Bureau of Statistics publishes Census data on the statistical profile of suburbs in each State and Territory. The latest available Basic Community Profiles for Braddon and Turner, from the 2011 Census, show the following age and sex breakdown in these two suburbs: Table 1. Age and Sex Breakdown of Braddon and Turner Populations (source: Australian Bureau of Statistics, 2011 Census Community Profiles) Male Female Total Total (%) BRADDON Child (0-14) % Young Adult (15-24) , % Adult (25-64) 1,639 1,271 2, % Senior (65+) % TOTAL 2,420 2,137 4, % TURNER Child (0-14) Young Adult (15-24) Adult (25-64) 1,266 1,088 2, Senior (65+) TOTAL 1,858 1,737 3, % These figures will be updated on the 27 June 2017, with the release of Community Profile data from the 2016 Census. 3.2 Public Land Use Bookings Table 2 shows the number of bookings made by the general public for various parks around Canberra, including Haig Park, over the previous five years. This indicates the much smaller number of bookings made for Haig Park compared to other Canberra parks of varying size and location. 7
12 Table 2. Public Land Use Bookings for Selected Canberra Parks, (source: Treasury and Economic Development Directorate): Park Total Haig Park Lennox Gardens Weston Park Glebe Park Telopea Park
13 4.0 Study Results and Analysis: Movement Counts The data on movement counts show that approximately double the number of people on a weekday move through Haig Park, compared to the weekend. On the weekday, 895 individuals were counted, compared with 465 individuals on the weekend day. There was a spike numbers between 8-10am and again between 4-6pm on the weekday, with cyclists most prevalent, suggesting commuters were using the park during these time periods. During the weekend, walking was by far the most recorded mode of travel. The counts show that mostly adult males travel through Haig Park, although the distribution between genders was more evenly spread on the weekend day. There were very few seniors and children moving through Haig Park at any time of the day, weekday or weekend. The highest level of movement activity was recorded in Zone 2, irrespective of whether it was the weekday or the weekend day, whilst Zone 4 had the lowest movement counts. The distribution of movement activity by gender, age category and mode of movement is discussed in further detail in the following sections. 4.1 Movement by Gender The Utilisation Study data on movement counts indicates that there were more males than females moving through the park. Over the total weekday and weekend time periods observed, 62.5% of the people moving through the park were male, compared to 37.5% females. This includes all age groups, although as shown later in Section 3.2, the counts of children were very low hence the gender differences are applicable to adult men and women Weekday On the weekday, 66% of the individuals observed moving through the park were identified as male, compared with 34% female. Figure 1 shows the pattern of movement by gender over the course of the weekday. Greater numbers of male users were recorded during all time periods. 9
14 Figure 1. Movement Counts by Gender - Weekday Number of people am pm Time of Day Female Male Weekend Gender distribution was more evenly spread on the weekend day, with 56% identified as male and 44% female. Figure 2 shows movement by gender over the course of the weekend day. Greater numbers of males were identified during all time periods, except during the 10am- 11am time period and between 7-9pm, although the overall numbers are low, particularly after 8pm. Figure 2. Movement Counts by Gender - Weekend Number of People am pm Time of Day Female Male 10
15 4.2 Movement by Age At 59.6% of individuals overall, adults made up the age category with the highest number of people recorded moving through the park. This is broadly representative of the proportion of adults in the population of the surrounding neighbourhoods. Young people were the next largest user group, with 31.6% of people moving through the park over all of the time periods recorded. Seniors made up 5% of individuals, and children were the smallest group at 3.8%. Zones 1 and 2 recorded the highest number of adults in all of the time periods on both the weekday and weekend, except for on the weekday afternoon in Zone 1, where young people outnumbered adults. Zone 3 recorded a more even distribution of adults and young people among park users compared with the other zones, as well as the highest number of children of any of the four zones. Zone 4 contained very low number across all of the age groups, with the highest user group being young people on the weekday between 12 and 4pm Weekday Figure 3 shows that the vast majority of individuals observed moving through the park on the weekday were adults, with some variation over the course of the day. During the afternoon hours of 1-4pm, there were more young people than adults recorded. The number of children moving through the park remained low at all times of day, with slight increases during the typical school and childcare drop-off and pick-up hours. Figure 3. Movement Counts by Age Category, Weekday Number of People am pm Time of Day Child Young Person Adult Senior Weekend Figure 4 shows the pattern of movement by age category on the weekend. As was the case for the weekday, the majority of people moving through the park were adults. The number of young people exceeded the number of adults moving through park during the hours of 10-11am and 6-7pm. Additionally, a slightly higher proportion of park users counted on the weekend were children (6%), compared with the weekday (2.6%). Similarly to the weekday, the number of seniors remained low during all time periods, with the maximum being 9 people counted between 8-9am. 11
16 Figure 4. Movement Counts by Age Category, Weekend Number of People am pm Time of Day Child Young Person Adult Senior 4.3 Movement by Mode Walkers and cyclists make up almost all individuals recorded, with only 3.7% using some other mode such as skateboard, scooter or being pushed in a pram. However, there are substantial differences between the weekday and the weekend, as shown in Figures 5 and 6. There are also differences between Zones, with cycling being more prevalent on weekdays only in Zones 1 and 2. In Zone 3 however, walking is substantially more common than cycling in during all times of day on both weekdays and the weekend Weekday As seen in Figure 5, on the weekday the majority of people moving through Haig Park do so by cycling. The number of cyclists is highest at all times of day except between 12-2pm, where there are a similar number of cyclists and walkers. 12
17 Figure 5. Movement Counts by Mode of travel, Weekday Number of People am pm Time of Day Walking Cycling Other Weekend Contrary to the weekday, more people walk than cycle through Haig Park on the weekend, and this remains consistent across all time periods as shown in Figure 6. Figure 6. Movement Counts by Mode of travel, Weekend Number of People am pm Time of Day Walking Cycling Other 13
18 5.0 Study Results and Analysis: User Activity The data on staying activities undertaken in Haig Park shows approximately one-and a half times as many people use the park on a weekend, compared with the weekday. On the weekend, 407 people were recorded using the park, whilst on the weekday this number was 261. Dog walking is most frequently carried out in the morning, and is the most popular activity, making up nearly a third of park usage overall. On the weekday, playing and dog walking were the most popular activities, with the evening being the busiest time for activities in the park. Playing mainly consisted of walking or jogging around the park, or other forms of exercise such as playing with a ball or using the tennis courts. On the weekend, dog walking was the most popular activity, followed by sitting. Sitting was mainly done for the purposes of eating and drinking, and at times by individual people using a mobile phone or a laptop. The data show that it is mostly adult males who stay and use Haig Park. The overall gender difference of 60% male 40% females using the park, is similar on both weekdays and weekends. Children and seniors make up less than a quarter of park users overall. The highest level of user activity was observed in Zone 3, irrespective of whether it was the weekday or weekend day. On the weekday Zone 5 had the lowest number of observed activities and on the weekend day Zone 1 was the least used zone. The distribution of user activity by gender, age category and type of activity is discussed in further detail in the following sections. 5.1 User Activity by Gender Similarly to the count data, more males were observed undertaking a staying activity within Haig Park than females around 60% males compared to 40% females. As seen in Figures 7 and 8, this gender split is almost identical on both the weekend and weekday. The largest gender difference appears in Zone 3 on the weekend evening among individuals sitting in the park. In Zone 2 similar numbers of males and females were observed engaging in playing activities on weekday evenings and other activities on weekend mornings. While gender differences are apparent in other time periods and zones, the number of individuals observed was generally low Weekday During the weekday, 107 females and 154 males were recorded staying in Haig Park. The weekday time period with the greatest difference in the proportion of males and females staying in the park is the afternoon, with 47 male park users (64%) versus 26 females (36%). During the morning and evening time periods, the gender split was closer to evenly distributed. 14
19 Figure 7. User Activity by Gender, Weekday Sitting Standing Playing Number of People Other Sitting Standing Playing Other Sitting Standing Playing Other Morning Afternoon Evening Female Male Weekend During the weekend, 164 females and 243 males were recorded staying in Haig Park. The weekend time period with the greatest difference in the proportion of males and females staying in the park is the evening, with 86 male park users (62%) versus 53 females (38%). During the morning and evening time period, the gender difference was slightly lower, with 42% of park users undertaking morning activities being female, and 41% females recorded during the afternoon. Figure 8. User Activity by Gender, Weekend Sitting Standing Playing Other Sitting Standing Playing Number of People Other Sitting Standing Playing Other Morning Afternoon Evening Female Male 5.2 User Activity by Age Similarly to the movement counts, adults make up the age category with the highest number of people recorded staying in the park, with 61% of individuals overall. The distribution across the remaining three age categories however is much more even than for the count data. 15
20 Young people make up 17% of people staying in the park over all of the time periods recorded. Children are the next highest age category at 12% and seniors make up 10% of individuals. Age differences in park activities across the different Zones are difficult to identify, as the numbers are very low in several of the zones and categories. Zone 5, which includes a playground and the Turner Parklands, recorded the highest number of people undertaking activities on the weekday. While around 60% of these were adults, the remaining 40% was split almost evenly between children, young people and seniors. On the weekend in Zone 5, again roughly 60% of park users were adults, children and young people made up 18% each, and seniors only 5% Weekday Figure 9 shows the patterns of user activity by age category on the weekday. The majority of individuals observed staying in the park were identified as adults, with some variation over the course of the day. The weekday evening recorded both the highest number of children in the park of all the time periods, as well as one of only two instances where the number of children exceeded the number of adults (23 children and 22 adults). The other period in which this occurred was the weekday afternoon. The proportion of people staying in the park who were recorded as seniors was consistently low across all of the time periods, with a maximum of 13 in the morning hours of 7am 11am. 16
21 Figure 9. User Activity by Age Category, Weekday Number of People Sitting Standing Playing Other Sitting Standing Playing Other Sitting Standing Playing Other Morning Afternoon Evening Child Young Person Adult Senior Weekend Figure 10 shows the patterns of user activity by age category on the weekend. Again the majority of individuals observed staying the park were adults, and the greatest difference between the number of adults and other age groups was observed on the weekend morning for park users doing an activity other than sitting, standing or playing. The morning time period also recorded a substantially higher number of seniors than any other time period 20 seniors compared with 7 during the afternoon and 7 in the evening. Children were most prevalent in the park during the afternoon, and a similar number during the morning, with most undertaking other activities. Children and seniors are almost entirely absent within the park during the evening hours on the weekend. Figure 10. User Activity by Age Category, Weekend Weekend Numberof People Sitting Standing Playing Other Sitting Standing Playing Other Sitting Standing Playing Other Morning Afternoon Evening Child Young Person Adult Senior 17
22 5.3 User Activity by Type of Activity This section aims to provide an overview of the types of activities that are most frequently undertaken within Haig Park at different times of the day. It was observed during the data collection days that dog walking was one of the most frequent activities people engaged in at the park. This may be due to its accessibility to residences in the surrounding suburbs, and its status as the largest off-leash park in Canberra s Inner North. On this basis dog walking is presented separately from the remainder of the other category. While some variation was observed in the types of activities undertaken in the different zones, the numbers are again too low to draw any conclusive lessons around park usage. In general, dog walking appears most popular in Zones 1 and 2 on weekend mornings, and on the weekday morning dog walkers were seen in all Zones except Zone 5. The single activity with the highest number recorded was people sitting in Zone 3 on the weekend evening near the Mandalay Bus which serves takeaway food Weekday On the weekday morning, dog walking was the most common activity undertaken in Haig Park, with 38 people recorded. Dog walking was also popular in the evening, however playing was the most common activity, with 51 individuals. On the weekday afternoon, there were equal numbers of people recorded sitting and standing in the park (20 each), and 19 people recorded walking their dog. Figure 11. User Activity by Type of Activity, Weekday Number of People Sitting Standing Playing Dog Walking Other Sitting Standing Playing Dog Walking Other Sitting Standing Playing Dog Walking Other Morning Afternoon Evening Weekend The weekend results for user activity shows substantial variation in the types of activities undertaken in Haig Park depending on the time of day. Similarly to the weekday morning, dog walking is the most prevalent activity in the park on a weekend morning. In the afternoon however, playing was the most frequent activity and in the evening the number of people sitting far exceeded those undertaking any other activity. 18
23 Figure 12. User Activity by Type of Activity, Weekend Number of People Sitting Standing Playing Dog Walking Other Sitting Standing Playing Dog Walking Other Sitting Standing Playing Dog Walking Other Morning Afternoon Evening 19
24 6.0 Conclusion This Utilisation Study is a valuable resource in gaining an understanding of who the typical park user is, the main purposes for which people travel through or stay in the park, and the busiest and quietest areas of the park. The typical engagement with Haig Park is by an adult male cycling through Zone 2 on a weekday morning, most likely to commute to work at Civic or the ANU. Substantially more people travel through rather than stay in Haig Park for a period of time. Of those who do choose to remain in the park, this is usually for the purposes of dog walking. On the weekend, it is also reasonably common to see the park being used for play, which in this Study includes exercise such as jogging or strolling individually or in a group. The busiest area for people moving through the park on both weekdays and weekends is Zone 2 in Turner, whereas for people staying in the park it is Zone 3 adjacent to Braddon. The least utilised area of Haig Park for people walking or cycling through is Zone 4 at the Limestone Avenue end of the park. On weekdays the Zone 5 area of influence is the least used by people staying in the park to walk their dog or participate in some other activity, and on weekends Zone 1 at the Turner end is the least occupied. 20
25 7.0 References The methodology used to carry out this Study is based on the following source: Gehl, Jan, and Birgitte Svarre. How to study public life. Island Press, In addition, the technique used to record movement counts is known as the stationary gate method, and was used in the following previous study of pedestrian movement in the ACT: Australian Capital Territory. Dept. of Planning and Land Management and Intelligent Space Partnership, Canberra central movement study: movement economy model forecasting. ACTPLA, [Canberra, 2006]. 21
26 8.0 Attachments The following attachments are included in the document: Attachment 1: Site Map Attachment 2: Data Collection Forms Movement Counts Attachment 3: Data Collection Forms User Activity 22
27 Attachment 1 Site Map
28
29 Attachment 2 Data Collection Forms Movement Counts
30
31
32
33
34
35
36 Attachment 3 Data Collection Forms - User Activity
37
38
39
40
41
42
Investment in Active Transport Survey
 Investment in Active Transport Survey KEY FINDINGS 3 METHODOLOGY 7 CYCLING INFRASTRUCTURE 8 Riding a bike 9 Reasons for riding a bike 9 Mainly ride on 10 Comfortable riding on 10 Rating of cycling infrastructure
Route User Intercept Survey Report
 Route User Intercept Survey Report Hills Road, Cambridge Fieldwork: October 2016 Report published: December 2016 1 About Sustrans Sustrans makes smarter travel choices possible, desirable and inevitable.
PERSONALISED TRAVEL PLANNING IN MIDLETON, COUNTY CORK
 PERSONALISED TRAVEL PLANNING IN MIDLETON, COUNTY CORK Elaine Brick Principal Transport Planner AECOM Abstract Smarter Travel funding was awarded to the Chartered Institute of Highways and Transportation
Determining bicycle infrastructure preferences A case study of Dublin
 *Manuscript Click here to view linked References 1 Determining bicycle infrastructure preferences A case study of Dublin Brian Caulfield 1, Elaine Brick 2, Orla Thérèse McCarthy 1 1 Department of Civil,
Cycle journeys on the Anderston-Argyle Street footbridge: a descriptive analysis. Karen McPherson. Glasgow Centre for Population Health
 Cycle journeys on the Anderston-Argyle Street footbridge: a descriptive analysis Karen McPherson Glasgow Centre for Population Health March 2017 Key points: There were 116,334 cycle journeys made using
Briefing Paper #1. An Overview of Regional Demand and Mode Share
 2011 Metro Vancouver Regional Trip Diary Survey Briefing Paper #1 An Overview of Regional Demand and Mode Share Introduction The 2011 Metro Vancouver Regional Trip Diary Survey is the latest survey conducted
University of Victoria Campus Cycling Plan Terms of Reference. 1.0 Project Description
 University of Victoria Campus Cycling Plan Terms of Reference 1.0 Project Description The Campus Cycling Plan, a first for the University, will provide a comprehensive and coordinated approach to support
Travel Plan Monitoring Report. Bourton View, Wellingborough - Residential
 Travel Plan Monitoring Report Bourton View, Wellingborough - Residential Prepared by: Developer Eyes Property and Estate Management, Broughton Grange Business Centre, Headlands, Kettering, Northants, NN15
Travel Patterns and Cycling opportunites
 Travel Patterns and Cycling opportunites The Household Travel Survey is the largest and most comprehensive source of information on the travel patterns of residents of the Sydney Greater Metropolitan Area
MANITOBA'S ABORIGINAL COMMUNITY: A 2001 TO 2026 POPULATION & DEMOGRAPHIC PROFILE
 MANITOBA'S ABORIGINAL COMMUNITY: A 2001 TO 2026 POPULATION & DEMOGRAPHIC PROFILE MBS 2005-4 JULY 2005 TABLE OF CONTENTS I. Executive Summary 3 II. Introduction.. 9 PAGE III. IV. Projected Aboriginal Identity
The Corporation of the City of Sarnia. School Crossing Guard Warrant Policy
 The Corporation of the City of Sarnia School Crossing Guard Warrant Policy Table of Contents Overview And Description... 2 Role of the School Crossing Guard... 2 Definition of a Designated School Crossing...
1999 On-Board Sacramento Regional Transit District Survey
 SACOG-00-009 1999 On-Board Sacramento Regional Transit District Survey June 2000 Sacramento Area Council of Governments 1999 On-Board Sacramento Regional Transit District Survey June 2000 Table of Contents
March Maidstone Integrated Transport Strategy Boxley Parish Council Briefing Note. Context. Author: Parish Clerk 2 March 2016
 Context. Author: Parish Clerk 2 The Draft Integrated Transport Policy (DITS) sets out a vision and objectives, and identifies a detailed programme of interventions to support the Maidstone Borough Local
BRIEFING PAPER 29 FINDINGS SERIES. Children s travel to school are we moving in the right direction?
 BRIEFING PAPER 29 FINDINGS SERIES Children s travel to school are we moving in the right direction? February 2011 FINDINGS SERIES 29 BRIEFING PAPER KEY FINDINGS National surveys show that while the level
York Scarborough Bridge Economic Appraisal Update Technical Note
 York Scarborough Bridge Economic Appraisal Update Technical Note Specification No. 1 Client name West Yorkshire Combined Authority Client reference M088 Discipline Transportation Project name CCAG2 Economics
GD 0043/18 ACTIVE TRAVEL STRATEGY
 GD 0043/18 ACTIVE TRAVEL STRATEGY 2018-2021 May 2018 Minister s Introduction There is strong evidence that regular physical activity reduces the risk of a range of health conditions. The best way to increase
2014 Fishers Trail Count
 2014 Fishers Trail Count July 2014 Table of Contents Introduction...1 Trail Count Locations...3 Ellipse Parkway at Holland Drive...4 Lantern Road at Sunblest Boulevard...5 126th Street at Cumberland Road...6
POLICY: TRAFFIC CALMING
 2006 MAY REFERENCE: COUNCIL APPROVED BY COUNCIL MAY 23, 2006 CITY OPERATIONS - NO. 608 POLICY: TRAFFIC CALMING A. All requests for traffic calming within the City shall be considered in accordance with
Neighbourhood Walkability Checklist How walkable is your community?
 Template letter This template is a guide to writing to your local council. You can change it in any way you feel necessary. Don t forget to attach the checklist and any photographs, maps or sketches you
Pocatello Regional Transit Master Transit Plan Draft Recommendations
 Pocatello Regional Transit Master Transit Plan Draft Recommendations Presentation Outline 1. 2. 3. 4. What is the Master Transit Plan? An overview of the study Where Are We Today? Key take-aways from existing
To: The results of these surveys have been analysed and are summarised within this Technical Note.
 Technical Note Project: Histon Road / Milton Road, Cambridge Parking Surveys To: Andy Harrison Subject: Survey Report v1.6 From: Jonathan Barlow Date: 18 th February 2016 cc: Richard Jones / Dave Boddy
COLUMBUS AVENUE NEIGHBORHOOD TRANSPORTATION STUDY
 COLUMBUS AVENUE NEIGHBORHOOD TRANSPORTATION STUDY Pedestrian Survey Findings Survey Main Findings: Transit and walking are the main two modes used by both visitors and residents of the area, regardless
Intercept Surveys of Cycle Usage
 Intercept Surveys of Cycle Usage Anthony J. Richardson, Professor of Transport Planning, Institute of Transport Studies Martin Utiger, project management Veloland Schweiz, Velobüro, Olten, CH Jürg Tschopp,
Thursday 18 th January Cambridgeshire Travel Survey Presentation to the Greater Cambridge Partnership Joint Assembly
 Thursday 18 th January 2018 Cambridgeshire Travel Survey Presentation to the Greater Cambridge Partnership Joint Assembly Contents 1. Study Background 2. Methodology 3. Key Findings An opportunity for
AMETI PANMURE: A SUSTAINABLE TRANSPORT SOLUTION - OR NOT? Phil Harrison, Opus International Consultants
 IPWEA Conference: 7 June 11 June 2015 Abstract AMETI PANMURE: A SUSTAINABLE TRANSPORT SOLUTION - OR NOT? Phil Harrison, Opus International Consultants The AMETI project is a package of multi-modal transport
Devonport City Cycling Network Strategy
 Devonport City Cycling Network Strategy 2010-2013 Devonport City Cycling Network Strategy Introduction In February 2010 a draft master plan for cycleways was presented to the community. The feedback received
City of Perth Cycle Plan 2029
 Bicycling Western Australia s response City of Perth Cycle Plan 2029 2012-2021 More People Cycling More Often ABOUT BICYCLING WESTERN AUSTRALIA Bicycling Western Australia is a community based, not-for-profit
Crash Patterns in Western Australia. Kidd B., Main Roads Western Australia Willett P., Traffic Research Services
 Crash Patterns in Western Australia Kidd B., Main Roads Western Australia Willett P., Traffic Research Services Abstract Examination of crash patterns is one way of identifying key factors on which focus
Travel and Rider Characteristics for Metrobus
 Travel and Rider Characteristics for Metrobus 040829040.15 Travel and Rider Characteristics for Metrobus: 2012-2015 Overview The Miami Dade County Metropolitan Planning Organization (MPO) conducted a series
Strategic Director for Environment. Enclosures Appendix A - Option drawings. Jamie Blake- Strategic Director for Environment
 Chipping Barnet Area Committee 9 July 2018 Title Report of Wards Status Urgent Key Cromer Road Request for 20mph Zone Strategic Director for Environment High Barnet Public No No Enclosures Appendix A -
Merseyside Road Safety Partnership s Annual Road Traffic Casualties Report 2015
 Merseyside Road Safety Partnership s Annual Road Traffic Casualties Report 2015 Contents 1. Overview of KSI s 2 2. Cyclists 4 3. Motorcyclists 8 4. Senior Road Users 10 5. Pedestrians 14 6. Car Drivers
Transit boulevard: A new road type for Sydney s Growth Centres
 Transit boulevard: A new road type for Sydney s Growth Centres Cleaver, M. A., de Roos, M. P., NSW Centre for Road Safety, Roads and Traffic Authority, NSW Collins, G., Network Services, Roads and Traffic
TO: Board Members Vancouver Park Board FROM: General Manager Parks and Recreation SUBJECT: Seaside Greenway Improvements
 Date: October 1, 2013 TO: Board Members Vancouver Park Board FROM: General Manager Parks and Recreation SUBJECT: Seaside Greenway Improvements RECOMMENDATION A. THAT the Board approve the new bike paths
National Bicycle and Pedestrian Documentation Project INSTRUCTIONS
 National Bicycle and Pedestrian Documentation Project INSTRUCTIONS The National Documentation Project (NBPD) is an annual bicycle and pedestrian count and survey effort sponsored by the Institute of Transportation
Weather and Cycling in Dublin : Perceptions and Reality
 Author : Keegan, O P 1. Abstract It is generally accepted that weather conditions and especially rainfall have an impact on cycling patterns in Dublin. For individuals who regularly cycle to work poor
Life Transitions and Travel Behaviour Study. Job changes and home moves disrupt established commuting patterns
 Life Transitions and Travel Behaviour Study Evidence Summary 2 Drivers of change to commuting mode Job changes and home moves disrupt established commuting patterns This leaflet summarises new analysis
Ormond & McKinnon Walks Response to Draft Glen Eira Community Plan
 Response to Draft Glen Eira Community Plan We would like to take this opportunity to thank Glen Eira City Council for the opportunity to comment on the Glen Eira Draft Community Plan. Below is an outline
EAST VILLAGE SHOPPERS STUDY A SNAPSHOT OF TRAVEL AND SPENDING PATTERNS OF RESIDENTS AND VISITORS IN THE EAST VILLAGE
 EAST VILLAGE SHOPPERS STUDY A SNAPSHOT OF TRAVEL AND SPENDING PATTERNS OF RESIDENTS AND VISITORS IN THE EAST VILLAGE CONTENTS 2 4 5 6 7 16 17 19 SUMMARY INTRODUCTION BACKGROUND METHODOLOGY RESULTS CONCLUSION
January Project No
 January 13 2015 Project No. 5070.05 Neil Connelly, Director University of Victoria, Campus Planning and Sustainability PO Box 1700 STN CSC Victoria, BC V8P 5C2 Dear Neil: Re: UVic 2014 Traffic Final Report
Analyses and statistics on the frequency and the incidence of traffic accidents within Dolj County
 UNIVERSITY OF PITESTI SCIENTIFIC BULLETIN Faculty of Mechanics and Technology AUTOMOTIVE series, year XXIV, no. 28 Analyses and statistics on the frequency and the incidence of traffic accidents within
GREY LYNN TOWN CENTRE PEDESTRIAN INTERCEPT SURVEY FINAL REPORT JUNE 2015
 GREY LYNN TOWN CENTRE PEDESTRIAN INTERCEPT SURVEY FINAL REPORT JUNE 2015 Prepared for: Auckland Transport Prepared by: Aleph Limited Table of Contents 1.0 INTRODUCTION... 3 2.0 METHODOLOGY... 4 3.0 RESULTS...
City of Toronto Complete Streets Guidelines
 Round One This is a summary of the Complete Streets Guidelines Survey posted on June 18 th, 2015 and live until July 2 nd, 2015. The survey was designed to solicit feedback on the draft Complete Streets
Exhibit 1 PLANNING COMMISSION AGENDA ITEM
 Exhibit 1 PLANNING COMMISSION AGENDA ITEM Project Name: Grand Junction Circulation Plan Grand Junction Complete Streets Policy Applicant: City of Grand Junction Representative: David Thornton Address:
NMT SAFE STUDY APPROACH
 24 May 2017 ADVOCATING THE NON MOTORISED TRANSPORT AGENDA CONTENT Content NMT road safety study approach NMT road safety study process NMT SAFE STUDY APPROACH THE NEED FOR NMT SAFETY STUDIES Is there is
NACTO Designing Cities Conference Project Evaluation: Tools for Measuring Success and Building Support. October 29, 2015
 NACTO Designing Cities Conference Project Evaluation: Tools for Measuring Success and Building Support October 29, 2015 The case for evaluation: Have a social contract with City Council, staff and community
Appendix B27 - Weekend and off-peak benefits
 Appendix B27 - Weekend and off-peak benefits Technical Note Project Title: MVA Project Number: Subject: SY BRT Northern - BAFFB C3a556 Report A5b: Off-Peak and Weekend Benefits Note Number: 56 Version:
Design Principle Active Transport
 Active Transport Definition Active transport includes non-motorised forms of transport involving physical activity, such as walking and cycling. It also includes public transport to meet longer distance
Reduction of Speed Limit at Approaches to Railway Level Crossings in WA. Main Roads WA. Presenter - Brian Kidd
 Australasian College of Road Safety Conference A Safe System: Making it Happen! Melbourne 1-2 September 2011 Reduction of Speed Limit at Approaches to Railway Level Crossings in WA Radalj T 1, Kidd B 1
20mph. We want to make Edinburgh a better and safer place to live, work and play.
 20mph CREATING A BETTER SAFER EDINBURGH We want to make Edinburgh a better and safer place to live, work and play. That s why on 13 January 2015 Councillors approved a new speed limit network for Edinburgh
Transportation Assessment
 Transportation Assessment Midtown Open House February 10, 2018 Overview Midtown in Focus Overview & Purpose of Today Transportation Assessment overview Summary of Transportation work to date Review & Analysis
Rural Economy and Connectivity Committee. Restricted Roads (20mph Speed Limit) (Scotland) Bill: Key Themes Arising from the Online Survey
 (Scotland) Bill: Key Themes Arising from the Online Survey") Rural Economy and Connectivity Committee Restricted Roads (20mph Speed Limit) (Scotland) Bill: Key Themes Arising from the Online Survey Introduction On Friday 9 November 2018, the Rural Economy and Connectivity
Rural Economy and Connectivity Committee Restricted Roads (20mph Speed Limit) (Scotland) Bill: Key Themes Arising from the Online Survey Introduction On Friday 9 November 2018, the Rural Economy and Connectivity
Appendix 9 SCUBA diving in the sea
 Appendix 9 SCUBA diving in the sea Firth of Clyde Forum SMRTS2015 Final Report 195 March 2016 Appendix 9 SCUBA diving in the sea Table A9.1: Summary of sample confidence levels Responses Spatial data Questionnaire
EUCLID AVENUE PARKING STUDY CITY OF SYRACUSE, ONONDAGA COUNTY, NEW YORK
 EUCLID AVENUE PARKING STUDY CITY OF SYRACUSE, ONONDAGA COUNTY, NEW YORK CITY OF SYRACUSE DEPARTMENT OF PUBLIC WORKS 1200 CANAL STREET EXTENSION SYRACUSE, NEW YORK 13210 DRAFT REPORT DATE: November 13,
Minor Amendments to the Street and Traffic By-law 2849 and Skateboards in Protected Bike Lanes
 ADMINISTRATIVE REPORT Report Date: October 31, 2017 Contact: Lon LaClaire Contact No.: 604.873.7336 RTS No.: 12241 VanRIMS No.: 08-2000-20 Meeting Date: November 15, 2017 TO: FROM: SUBJECT: Standing Committee
St Elizabeth s Primary School
 St Elizabeth s Primary School 55 Effingham St, Tarrangindi QLD 4121 2 Table 1: School overview School Name: St Elizabeth s Primary School Address: 55 Effingham St, Tarragindi, QLD 4121 Grades at the school:
EXECUTIVE SUMMARY Callan Park accommodates travel from a wide range of transport modes, including walking, cycling, bus and light rail.
 TRANSPORT AND ACCESS EXECUTIVE SUMMARY Callan Park accommodates travel from a wide range of transport modes, including walking, cycling, bus and light rail. Whilst there are some walking facilities within
Prepared For: Shieldbay Developments Inc. c/o Matson, McConnell Ltd. 2430A Bloor Street West Toronto, Ontario M6S 1P9.
 Prepared For: Shieldbay Developments Inc. c/o Matson, McConnell Ltd. 2430A Bloor Street West Toronto, Ontario M6S 1P9 Prepared By: URS Canada Inc. 4 th Floor, 30 Leek Crescent Richmond Hill, Ontario L4B
An evaluation of pedestrian countdown timers in the Sydney CBD
 An evaluation of pedestrian countdown timers in the Sydney CBD Cleaver, M. A., Hislop, J., de Roos, M. P., Fernandes, R., Prendergast, M. (NSW Centre for Road Safety) Brisbane, G., Levasseur, M., McTiernan,
Marin County. Nonmotorized Transportation Pilot Program. Bicycle and Pedestrian Counts Update
 Marin County Nonmotorized Transportation Pilot Program Bicycle and Pedestrian Counts 2013 Update Prepared for: County of Marin Department of Public works Contact: Dan Dawson walkbikemarin@marincounty.org
Evaluation. Monitoring and 8.0
 8.0 Monitoring and Evaluation 8.1 Introduction The Cycling Strategy is a dynamic document that will evolve over the 10 year timeframe in line with the changing land-use and transport environment in Lake
Loughborough University Travel Planning
 Document Ti tle Client Name Loughborough University Travel Planning Loughborough University Travel Plan Executive Summary 2015-2020 23 December 2015 Loughborough University Travel Planning Project no:
Standing Committee on Policy and Strategic Priorities. Mount Pleasant Industrial Area Parking Strategy and Access Improvements
 POLICY REPORT Report Date: April 23, 2018 Contact: Lon LaClaire Contact No.: 604.873.7722 RTS No.: 9944 VanRIMS No.: 08-2000-20 Meeting Date: May 16, 2018 TO: FROM: SUBJECT: Standing Committee on Policy
WILMAPCO Public Opinion Survey Summary of Results
 Wilmington Area Planning Council WILMAPCO Public Opinion Survey Summary of Results Prepared by: 2955 Valmont Road, Suite 300 Boulder, Colorado 80301 t: 303-444-7863 f: 303-444-1145 www.n-r-c.com Table
CITY OF ALPHARETTA DOWNTOWN MASTER PLAN TRAFFIC EVALUATION
 CITY OF ALPHARETTA DOWNTOWN MASTER PLAN TRAFFIC EVALUATION June 2015 CITY OF ALPHARETTA DOWNTOWN MASTER PLAN TRAFFIC EVALUATION Introduction The Alpharetta Downtown Master Plan was developed in the fall
AP-R361/10 AUSTROADS RESEARCH REPORT. The Road Safety Consequences of Changing Travel Modes
 AP-R361/10 AUSTROADS RESEARCH REPORT The Road Safety Consequences of Changing Travel Modes The Road Safety Consequences of Changing Travel Modes Published July 2010 Austroads Ltd. 2010 This work is copyright.
CITY OF SAINT JOHN TRAFFIC CALMING POLICY
 CITY OF SAINT JOHN TRAFFIC CALMING POLICY VERSION: 1.0 April 10, 2012 Pedestrians, Cyclists and Motorists Sharing Street Spaces CONTENTS INTRODUCTION... 3 POLICY GOAL... 3 POLICY OBJECTIVES... 3 GUIDING
UWA Commuting Survey 2013
 UWA Commuting Survey 2013 September 2013 Project: UWA/10 UWA Commuting Survey 2013 September 2013 Client: University of Western Australia Project: UWA/10 Consultants: Donna Hill Petra Roberts Jennifer
GLEN EIRA CITY COUNCIL. MURRUMBEENA Transforming our neighbourhood together our concepts based on your ideas
 GLEN EIRA CITY COUNCIL MURRUMBEENA Transforming our neighbourhood together our concepts based on your ideas 1 WHAT HAVE WE HEARD? WHAT NOW? Stage one Tell us what you love about your shopping strip November
Technical note. 1. Introduction
 Project: A428 study - Phase 2 To: Adrian Shepherd Subject: Park & Ride site locations From: Atkins Date: Jun 3, 2016 cc: Ashley Heller 1. Introduction 1.1. Purpose of Technical Note The purpose of this
Speed Limit Policy Isle of Wight Council
 APPENDIX B Speed Limit Policy Isle of Wight Council 2009 Contents Section 1 Introduction 1.1 Links with the Local Transport Plan Section 2 Speed Limits on Urban Roads and Residential Areas 2.1 20mph Limits
TO: FROM: SUBJECT: RECOMMENDATION REPORT SUMMARY BOARD AUTHORITY
 February 8, 2018 TO: Park Board Chair and Commissioners FROM: General Manager Vancouver Board of Parks and Recreation SUBJECT: Douglas Park Playground Replacement - Construction Contract RECOMMENDATION
Active Travel and Exposure to Air Pollution: Implications for Transportation and Land Use Planning
 Active Travel and Exposure to Air Pollution: Implications for Transportation and Land Use Planning Steve Hankey School of Public and International Affairs, Virginia Tech, 140 Otey Street, Blacksburg, VA
KING STREET TRANSIT PILOT
 STREET TRANSIT PILOT Update toronto.ca/kingstreetpilot #kingstreetpilot HIGHLIGHTS PREVIOUS HIGHLIGHTS TRANSIT RELIABILITY TRANSIT TRAVEL TIMES 85% of streetcars arriving within 4 minutes westbound during
Figure 39. Yearly Trend in Death Rates for Drowning: NSW, Year
 10.0 DROWNING 10.1 Deaths due to Drowning: The drowning death rate showed a statistically significant decrease between 199 and 1999 (Figure 39). Between 199 and 1999, 46 people died from drowning, at a
Communiqué ABC Meeting #41 Cairns 2-3 August 2012
 Communiqué ABC Meeting #41 Cairns 2-3 August 2012 Esplanade shared path, Cairns Queensland The Australian Bicycle Council met in Cairns on 2-3 August 2012. Cairns Cycling Update Hellius Visser, Director
Baseline Survey of New Zealanders' Attitudes and Behaviours towards Cycling in Urban Settings
 Baseline Survey of New Zealanders' Attitudes and Behaviours towards Cycling in Urban Settings Highlights 67% of urban New Zealanders, 18 years of age or more own or have access to a bicycle that is in
3 FRAMEWORK FOR IMPLEMENTATION OF LAKE-TO-LAKE CYCLING ROUTE
 3 FRAMEWORK FOR IMPLEMENTATION OF LAKE-TO-LAKE CYCLING ROUTE The Planning and Economic Development Committee recommends the adoption of the recommendations contained in the following report dated December
Canada s Capital Region Delegation to the Velo-City Global 2010 Conference
 Canada s Capital Region Delegation to the Velo-City Global 2010 Conference Report of Findings from Visits, Meetings & Presentations In Amsterdam-Den Haag, Utrecht, Berlin & Copenhagen The Itinerary Copenhagen
The 2001 Economic Benefits of Hunting, Fishing and Wildlife Watching in MISSOURI. Prepared by:
 The 2001 Economic Benefits of Hunting, Fishing and Wildlife Watching in MISSOURI Prepared by: Southwick Associates, Inc. PO Box 6435 Fernandina Beach, FL 32035 Ph (904) 277-9765 Fax (904) 261-1145 Email:
Active Travel Towns Funding Scheme Project Proposal. Sligo. Sligo Local Authorities
 Active Travel Towns Funding Scheme 2014-2016 Project Proposal for Sligo by Sligo Local Authorities Introduction Over the last two years, Sligo Local Authorities have implemented years 1 & 2 of their 5
Cyclists and red lights a study of behaviour of commuter cyclists in Melbourne
 Cyclists and red lights a study of behaviour of commuter cyclists in Melbourne Johnson, M., Charlton, J., Oxley, J. Monash University Accident Research Centre email: marilyn.johnson@muarc.monash.edu.au
How Policy Drives Mode Choice in Children s Transportation to School
 How Policy Drives Mode Choice in Children s Transportation to School Physical Activity through Active Transportation Ruth L. Steiner 2011 Technical Conference and Exhibit Lake Buena Vista, FL April 3-6,
Using smartphones for cycle planning Authors: Norman, G. and Kesha, N January 2015
 Using smartphones for cycle planning Authors: Norman, G. and Kesha, N January 2015 Abstract There has been an inherent lack of information available to transport and urban planners when looking at cycle
ATTACHMENT 4 - TDM Checklist. TDM Checklist Overview
 ATTACHMENT 4 - TDM Checklist TDM Checklist Overview The proposed checklist rates developments on the degree to which they are TDM and transit supportive. Points are assigned based on the level of transit
University of Leeds Travel Plan
 University of Leeds Travel Plan 2015-2018 Contents 1: Introduction 1.1 What is a Travel Plan? 1.2 Why do we need one? 1.3 Sustainability Strategy 2: Overview 2.1 The bigger picture 2.2 The City scale 2.3
Community Development and Recreation Committee. General Manager, Parks, Forestry and Recreation. P:\2015\Cluster A\PFR\CD AFS#22685
 CD10.2 STAFF REPORT ACTION REQUIRED City of Toronto Outdoor Tennis Operations Date: February 19, 2016 To: From: Wards: Reference Number: Community Development and Recreation Committee General Manager,
Travel Plan Monitoring Report. Buttercross Park, Whittlesey - Residential
 Travel Plan Monitoring Report Buttercross Park, Whittlesey - Residential Prepared by: Developer Eyes Property and Estate Management Limited Headlands, Kettering, Northants NN15 6XA Company Registration
Part B Design Guidance / Principles _
 Part B Design Guidance / Principles www. landlab.co.nz Queenstown Town Centre Public Realm Design Guidelines Version 7 14 June 2018 Page 006 B1 Design Guidance & Best Practice The Queenstown Town Centre
Terwillegar Drive Expressway Draft Concept Plan
 Terwillegar Drive Expressway Draft Concept Plan Anthony Henday Drive to Whitemud Drive November 28 5:00-8:00 p.m. December 1 10:00 a.m. - 3:00 p.m. Let s Talk Today you can: Learn about the new direction
TRANSPORTATION NEEDS ASSESSMENT
 TRANSPORTATION NEEDS ASSESSMENT A travel demand analysis was carried out to determine the operational issues and the potential benefit that adding traffic capacity would have on the road network. All the
September HAWKHURST PARISH COUNCIL Page 1 of 13 SPORTS STRATEGY FINAL
 September 2017 HAWKHURST PARISH COUNCIL Page 1 of 13 SPORTS STRATEGY FINAL Table of Contents EXECUTIVE SUMMARY 3 1. INTRODUCTION 4 2. LOCAL CONTEXT 5 3. OBJECTIVES 7 4. PRIORITIES 8 5. FUNDING OPTIONS
Georgetown Skate Park & Action Sports Needs Assessment Project Background
 Project Background Purpose of Study: The purpose of this study is to confirm needs for new action sports opportunities in Georgetown, and develop prioritized implementation strategy. A focus of this project
Evaluating the ECONOMIC IMPACT of Shared Use Paths
 Evaluating the ECONOMIC IMPACT of Shared Use Paths in North Carolina l December 2016 TECHNICAL MEMORANDUM: DUCK TRAIL YEAR TWO Acknowledgements Prepared by: Institute for Transportation Research and Education
Report to Cabinet. 18 May 2016
 Agenda Item 8 Report to Cabinet 18 May 2016 Subject: Presenting Cabinet Member: Proposed CCTV Enforcement of Traffic Contraventions in a Bus Lane (Key Decision Ref. No. HE030) Highways and Environment
Dunedin One Way System (SH1) Cycle Survey Report
 Cycle Survey Report") Dunedin One Way System (SH1) Cycle Survey Report Report produced March 2014 (based on traffic surveys undertaken December 2013, and January & February 2014) 1 Preamble This report provides cycle count
Dunedin One Way System (SH1) Cycle Survey Report Report produced March 2014 (based on traffic surveys undertaken December 2013, and January & February 2014) 1 Preamble This report provides cycle count
SUSTAINABLE TRAVEL TOWNS: RESULTS AND LESSONS
 SUSTAINABLE TRAVEL TOWNS: RESULTS AND LESSONS Joe Finlay Sustainable Travel Team Department for Transport (UK) Introduction I will: Give brief background on the Sustainable Travel Towns and the projects
QUEENSLAND UNIVERSITY OF TECHNOLOGY GARDENS POINT CAMPUS TRANSPORT STUDY Jonathan Bunker
 QUEENSLAND UNIVERSITY OF TECHNOLOGY GARDENS POINT CAMPUS TRANSPORT STUDY 2000 Jonathan Bunker Physical Infrastructure Centre School of Civil Engineering Queensland University of Technology November 2000
Douglas Land Use and Transportation Strategy (DLUTS) Summary. August 2013
 Summary. August 2013") Douglas Land Use and Transportation Strategy (DLUTS) Summary August 2013 Background Douglas is a large and popular residential suburb of approximately 30,000 persons on the periphery of Cork City along
Douglas Land Use and Transportation Strategy (DLUTS) Summary August 2013 Background Douglas is a large and popular residential suburb of approximately 30,000 persons on the periphery of Cork City along
City of Novi Non-Motorized Master Plan 2011 Executive Summary
 City of Novi Non-Motorized Master Plan 2011 Executive Summary Prepared by: February 28, 2011 Why Plan? Encouraging healthy, active lifestyles through pathway and sidewalk connectivity has been a focus
Summary Report: Built Environment, Health and Obesity
 Research and education Built Environment Edmonton Project Summary Report: Built Environment, Health and Obesity Introduction In 2007 the Canadian Institutes of Health Research and the Heart and Stroke