The Business Case for Walking. Counting Walking to Make Walking Count in Auckland, New Zealand
|
|
|
- Bruno Charles
- 5 years ago
- Views:
Transcription


1 The Business Case for Walking Counting Walking to Make Walking Count in Auckland, New Zealand

2 For the first time since the 1950 s there are more people commuting to the City Centre by public transport, walking, and cycling than driving The resident population (50,000) has doubled over the last ten years. Residents now outnumber the people commuting in by cars Number of jobs in the City Centre is now 110,000 The estimated total daytime population is 149,000 people There are an estimated 500,000 internal walking trips

3 The number of pedestrians on Queen Street has doubled since % increase in pedestrians across the City Centre +49% of retail spending since 2010 (now $1.8 billion/year) +41% increase in cafe seats across the City Centre since % increase in public seating places across the City Centre since 2010
4
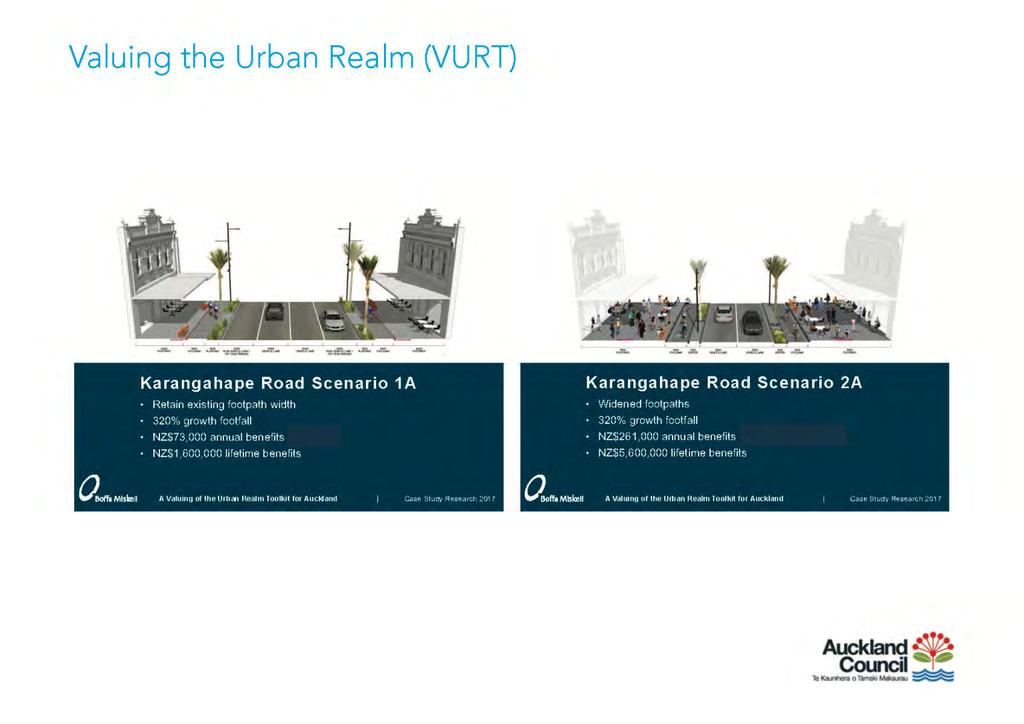
5 Methodology created and used by Transport for London Objective, evidence-based justifications for investment in public realm Quantifies user benefits Comparative before & after evaluation Measures & compares changes in public realm quality Link and space values: moving through, lingering, and sitting
6 Uses Pedestrian Environment Review System (PERS) Some factors are more important than others» Future user numbers» Effective footpath width» Personal security» Sense of place» Feeling comfortable
7

8
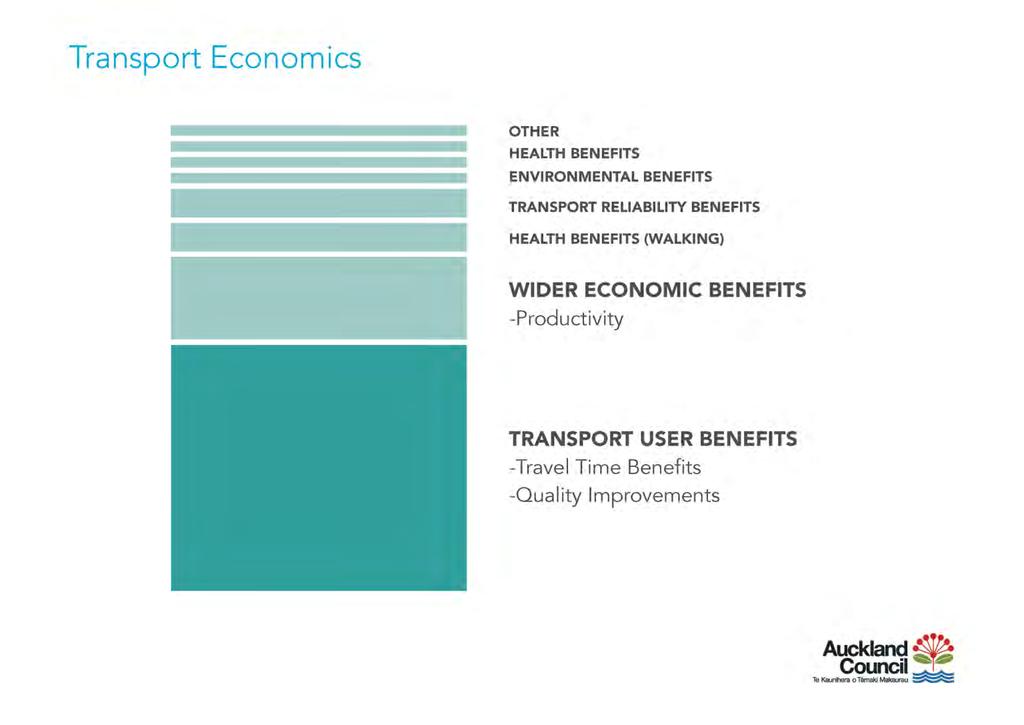
 NZTA s (2016) Economic Evaluation Manual provides guidance on valuing travel time delays incurred by transport users, regardless of mode")
9 Transport assessment is largely based on the user benefits (or disbenefits) of changes in travel time Delay measurement typically estimates vehicle delay, with monetary values assigned using standard value of users travel time (including for non-work purposes) NZTA s (2016) Economic Evaluation Manual provides guidance on valuing travel time delays incurred by transport users, regardless of mode of travel However, pedestrian delay is rarely measured during cost benefit analysis of a project
10
11

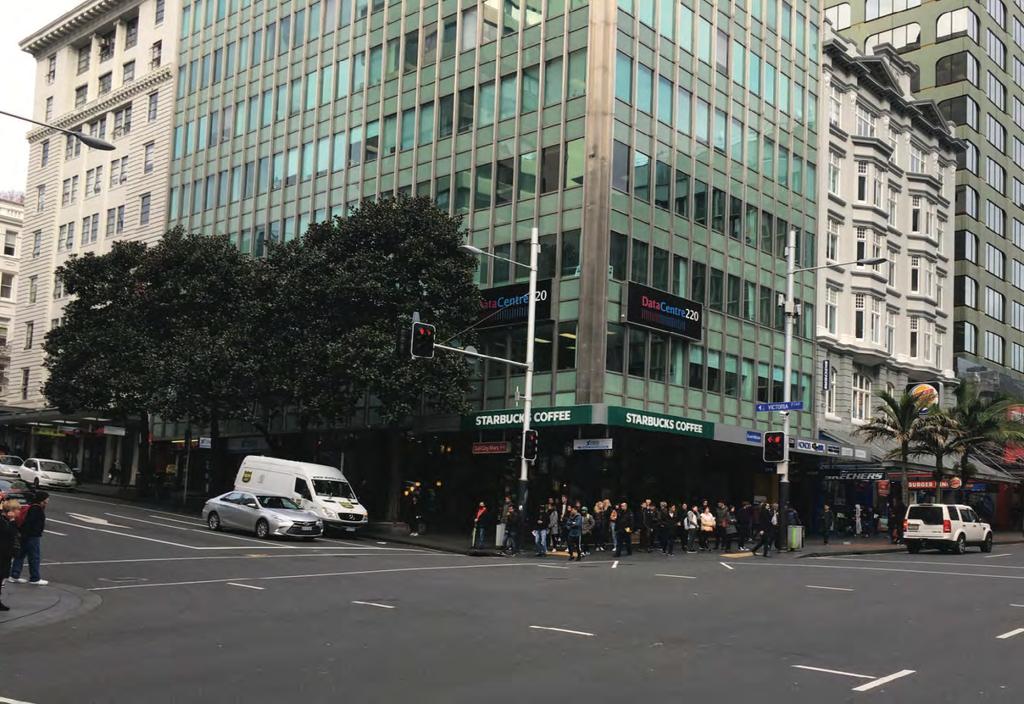
12 Over 7,700 pedestrians moved through the intersection in 1 hour 1,200 cars passed through the intersection in same hour Average delay per pedestrian 27 seconds 161,115 hours of annual delay to pedestrians Annual wasted time due to delay costs $2.2 million NPV is $36 million for free flow conditions*

13

14 Who values place? So what about the value that pedestrians create when they aren t moving What value is there in sticking, stopping and spending?


15 Who values place? The movement and place methodology is difficult to manage This upsets the movement and exchange balance Urban places cannot prosper How do you value place if you don t measure it? (

16 Walking facilitates personal and business networking within business centres. Attractive public spaces and walkable streets create a platform for business and social exchange and support the spread of knowledge. The research suggests that walkability within the Auckland city centre is likely to make a positive contribution to economic productivity.
17 A pedestrian network was developed based on the existing road network in the study area. Pedestrian links were assigned values based on their speed Network analyst software was run to estimate the travel time between each origin and destination point.
18 Pedestrian travel time matrices were combined with detailed estimates of employment to create a measure of the Effective Job Density (EJD) by walking in all buildings within the study area. Agglomeration economics literature suggests that there is a positive and causal relationship between EJD and productivity.
19 A proxy measure for labour productivity was estimated based on detailed data on average annual wages from Statistics NZ s Data (2015). The point estimate suggests that a 10 per cent increase in walking EJD is associated with a 5.3 per cent increase in productivity. This means that a 1% increase in walking EJD will increase the value of economy of the study area by 0.53% or approximately $42 million based on the authors estimate of $8.01 billion GDP for the study area.
20 Working to develop a fuller picture of current walking in Auckland city centre through a more sophisticated pedestrian model. However, we have no systematic way to estimate future walking volumes while we do this as a matter of course for motorised modes of transport. As an interim step, we are using current data sources, enhanced by a calibrated one-day, one-off walking sample, to build a blockby-block estimate of pedestrian volumes, similar to work carried out in Calgary and Melbourne. This work is being carried out by Stantec and MRCagney using a regression model to identify key drivers of both walking and future increases in walking.
Business Case for Walking. Investigating the Economic Value of Walking in the Auckland City Centre
 Business Case for Walking Investigating the Economic Value of Walking in the Auckland City Centre The Rise and Rise of the Auckland City Centre For the first time since the 1950 s there are more people
Living Streets response to the Draft London Plan
 Living Streets response to the Draft London Plan Contents Living Streets response to the Draft London Plan... 1 About Living Streets... 2 Summary... 2 Consultation response... 3 Chapter 1: Planning London
Measuring Pedestrian Delay
 Measuring Pedestrian Delay Final Report Prepared for: Auckland Design Office, Auckland Council Date: 20 September 2017 Version: Final Document Information Client Auckland Council Job Number NZ2165 Title
DRAFT for a State Policy for Healthy Spaces and Places
 DRAFT for a State Policy for Healthy Spaces and Places 1 DRAFT State Policy for Healthy spaces and Places 1. Purpose To encourage the use and development of land that builds healthy communities through
Community Improvement Plans: Creating walkable and liveable communities that support local business
 Community Improvement Plans: Creating walkable and liveable communities that support local business Kate Hall Program Manager ~ WALK Friendly Ontario Canada Walks, Green Communities Canada khall@greencommunitiescanada.org
Kevin Manaugh Department of Geography McGill School of Environment
 Kevin Manaugh Department of Geography McGill School of Environment Outline Why do people use active modes? Physical (Built environment) Factors Psychological Factors Empirical Work Neighbourhood Walkability
Complete Streets 101: The Basics
 Complete Streets 101: The Basics Michigan Municipal League - Capital Conference March 21, 2017 Chip Smith, AICP - Senior Planner - Wade Trim Inc. and City Council member City of Ann Arbor 2017 MML Capital
Extracting Maximum Benefit from Parking Policy - 10 Years Experience in Perth, Australia. By Emmerson Richardson Sinclair Knight Merz
 Extracting Maximum Benefit from Parking Policy - 10 Years Experience in Perth, Australia By Emmerson Richardson Sinclair Knight Merz Snapshot of Perth > Metropolitan Area Population 1.7 million > 3.5 million
Frequently asked questions about how the Transport Walkability Index was calculated are answered below.
 Transport Walkability Index The Transport Walkability Index is a relative indicator of how well the built environment in different areas supports walking for transport. The index is frequently used in
Wayfinding and Walking in London. Lilli Matson Transport for London May 2013
 Wayfinding and Walking in London Lilli Matson Transport for London May 2013 I want to make walking in London as attractive and enjoyable as possible by making walking count Mayor of London Boris Johnson
IAN WHITE ASSOCIATES. Crawley Station Gateway Public Realm
 IAN WHITE ASSOCIATES Crawley Station Gateway Public Realm contents 1. objectives & client brief 2. site appraisal 3. best practice guidance 4. design concept 1. objectives & client brief Crawley Train
JOINT PARTNERSHIPS: Working Together To Support Light Rail in Santa Monica
 JOINT PARTNERSHIPS: Working Together To Support Light Rail in Santa Monica ITY OF ANTA MONICA RAIL-VOLUTION / OCTOBER 17, 2012 SARAH LEJEUNE, PRINCIPAL PLANNER, STRATEGIC + TRANSPORTATION PLANNING DIVISION
Development Type - Neighbourhood Planning and Design
 Introduction The design and layout of new neighbourhoods greatly influences the nature of the urban form. When a neighbourhood is well designed it: allocates land for a range of uses, eg shops, community
TRANSPORTATION NEEDS ASSESSMENT
 TRANSPORTATION NEEDS ASSESSMENT A travel demand analysis was carried out to determine the operational issues and the potential benefit that adding traffic capacity would have on the road network. All the
Design Principle Active Transport
 Active Transport Definition Active transport includes non-motorised forms of transport involving physical activity, such as walking and cycling. It also includes public transport to meet longer distance
complete streets design and construction standards public primer City of Edmonton
 complete streets design and construction standards public primer City of Edmonton introduction Complete Streets are streets for everyone: people who walk, wheel, bike, take transit, or drive. They are
Welcome Pre-conference Workshop Walk21, Vienna, 20 October 2015
 Welcome Pre-conference Workshop Walk21, Vienna, 20 October 2015 Measuring Walking (part VII): International Walking Data Standard and its benefit Daniel Sauter, Urban Mobility Research, Zurich, Switzerland
Community engagement guide May 2018
 Community engagement guide May 2018 Greater Wellington Regional Council (GWRC), Hutt City Council (HCC) and the New Zealand Transport Agency (NZTA) are working together to achieve some big improvements
Perryville TOD and Greenway Plan
 Perryville TOD and Greenway Plan Greenway Glossary Pathway: A bicycle and pedestrian path separated from motorized vehicular traffic by an open space, barrier or curb. Multi-use paths may be within the
June 2015 REGIONAL TRANSPORTATION SNAPSHOT
 June 2015 REGIONAL TRANSPORTATION SNAPSHOT THE REGION Who are we? The Greater Toronto and Hamilton Area (GTHA), consisting of Durham Region, Halton Region, the City of Hamilton, Peel Region, the City of
THE PHILADELPHIA COMPLETE. an overview
 THE PHILADELPHIA COMPLETE STREETS DESIGN HANDBOOK an overview WHAT ARE COMPLETE STREETS? Complete Streets are streets designed to accommodate all users, from pedestrians to drivers Complete Streets provide
APPROVED OUTLAY AND EXPENDITURE ON ROAD TRANSPORT DURING XTH FIVE YEAR PLAN
 APPROVED OUTLAY AND EXPENDITURE ON ROAD TRANSPORT DURING XTH FIVE YEAR PLAN ABSTRACT PRAVEEN SINGH CHAUHAN, *DR. SATYAPAL *Associate Professor, Deptt. Of Management. & Commerce,Govt. P.G. College, Narnaul
Appendix A-K Public Information Centre 2 Materials
 Appendix A-K Public Information Centre 2 Materials Our Rapid Transit Initiative Make an impact on the future of transit Join the discussion on Rapid Transit in London You re invited to a Public Information
The Impact of Placemaking Attributes on Home Prices in the Midwest United States
 The Impact of Placemaking Attributes on Home Prices in the Midwest United States 2 0 1 3 C O N S T R U C T E D E N V I R O N M E N T C O N F E R E N C E M A R Y B E T H G R A E B E R T M I C H I G A N
Proposed. City of Grand Junction Complete Streets Policy. Exhibit 10
 Proposed City of Grand Junction Complete Streets Policy Exhibit 10 1 City of Grand Junction Complete Streets Policy Vision: The Complete Streets Vision is to develop a safe, efficient, and reliable travel
Chapter 2. Bellingham Bicycle Master Plan Chapter 2: Policies and Actions
 Chapter 2 Bellingham Bicycle Master Plan Chapter 2: Policies and Actions Chapter 2: Policies and Actions The Bicycle Master Plan provides a road map for making bicycling in Bellingham a viable transportation
Speed Limits in the Hoddle Grid
 Speed Limits in the Hoddle Grid Recent History of speed limits March 2013 Docs # 7738485 1 Introduction Muncipalities have power to Erect speed limit signs BUT Municipalities DO NOT have the power to approve
Planning Daily Work Trip under Congested Abuja Keffi Road Corridor
 ISBN 978-93-84468-19-4 Proceedings of International Conference on Transportation and Civil Engineering (ICTCE'15) London, March 21-22, 2015, pp. 43-47 Planning Daily Work Trip under Congested Abuja Keffi
ATTACHMENT 4 - TDM Checklist. TDM Checklist Overview
 ATTACHMENT 4 - TDM Checklist TDM Checklist Overview The proposed checklist rates developments on the degree to which they are TDM and transit supportive. Points are assigned based on the level of transit
What s Health Got to Do With It? Health and Land Use Planning
 What s Health Got to Do With It? Health and Land Use Planning CANDACE RUTT, PH.D. EXECUTIVE DIRECTOR APRIL 13 TH, 2016 Planning and Public Health Planning + Public Health Healthy Communities Healthier
Complementary modes? Walking, cycling and the quest for a more liveable city
 Surface Transport Complementary modes? Walking, cycling and the quest for a more liveable city Bruce McVean, Principal Strategy Planner brucemcvean@tfl.gov.uk 16 December 2015 1 Christmas quiz - A snapshot
A CHANGING CITY. of Edmonton, it is essential that it reflects the long-term vision of the City.
 A CHANGING CITY By the year 2040, Edmonton will be home to more than 1 million people. To accommodate growth and support a healthy and compact city, we need a new approach to development/redevelopment
A location model for pedestrian crossings in arterial streets
 A location model for pedestrian crossings in arterial streets B. Amini¹ & H. Ghahramani² ¹Department of Civil Engineering, International University of Imam Khomeini, Iran ²Iran University of Science and
Investment in Active Transport Survey
 Investment in Active Transport Survey KEY FINDINGS 3 METHODOLOGY 7 CYCLING INFRASTRUCTURE 8 Riding a bike 9 Reasons for riding a bike 9 Mainly ride on 10 Comfortable riding on 10 Rating of cycling infrastructure
What future for mid-sized cities? Prof. Emer. Antony Stathopoulos National Technical University of Athens
 What future for mid-sized cities? Prof. Emer. Antony Stathopoulos National Technical University of Athens These cities can range in size from 50,000 to 250,000 in population. Street in Larnaca in 1878
Standing Committee on Policy and Strategic Priorities. Mount Pleasant Industrial Area Parking Strategy and Access Improvements
 POLICY REPORT Report Date: April 23, 2018 Contact: Lon LaClaire Contact No.: 604.873.7722 RTS No.: 9944 VanRIMS No.: 08-2000-20 Meeting Date: May 16, 2018 TO: FROM: SUBJECT: Standing Committee on Policy
2015 Florida Main Street Annual Conference. Complete Streets Equal Stronger Main Streets
 WHAT ARE COMPLETE STREETS? CASE STUDIES COMPLETING YOUR MAIN STREET 2015 Florida Main Street Annual Conference St. Petersburg, Florida August 19, 2015 WHAT ARE COMPLETE STREETS? CASE STUDIES COMPLETING
Applying Bi-objective Shortest Path Methods to Model Cycle Route-choice
 Applying Bi-objective Shortest Path Methods to Model Cycle Route-choice Chris Van Houtte, Judith Y. T. Wang, and Matthias Ehrgott September 30, 2009 Outline Commuter Cyclists Motivation Choice Set Route
Transport Strategy refresh. Background paper: Walking
 Transport Strategy refresh Background paper: Walking March 2018 1 Contents Authors... 3 Executive Summary... 4 The importance of walking and the growth challenge... 4 Key problems... 4 Global best practice...
9/25/2018. Multi-Modal Level of Service (MMLOS) Bianca Popescu, Transportation Planner
 Bianca Popescu, Transportation Planner") Multi-Modal Level of Service (MMLOS) Bianca Popescu, Transportation Planner 1 What is MMLOS? Is this a nice place to walk? Is this a nice place to bike? Is transit convenient? Bottom line - Are there options
Multi-Modal Level of Service (MMLOS) Bianca Popescu, Transportation Planner 1 What is MMLOS? Is this a nice place to walk? Is this a nice place to bike? Is transit convenient? Bottom line - Are there options
21.07 TRANSPORT CONNECTIVITY AND INFRASTRUCTURE
 21.07 TRANSPORT CONNECTIVITY AND INFRASTRUCTURE 21.07-1 Connectivity and Choice Transport connectivity and mode choice are critical to achieving productive, sustainable and socially just cities. Travel
4.1 Introduction. 4.2 Aspects of walkable communities
 4 Community walkability Community walkability Making communities walkable Urban form Feeling secure 4.1 Introduction Walkability describes the extent to which the built environment is walking-friendly.
Illustrated Principles of Good Planning
 Illustrated Principles of Good Planning The Miami 21 Zoning Code incorporates time-tested planning principles into the zoning regulations of our City. These are principles that make for better neighborhoods,
BUILDING THE CASE FOR TRAVEL OPTIONS IN WASHING TON COUNTY. Image: Steve Morgan. Image: Steve Morgan
 BUILDING THE CASE FOR TRAVEL OPTIONS IN WASHING TON COUNTY Image: Steve Morgan Image: Steve Morgan Image: TriMet Image: TriMet WHAT ARE TRAVEL OPTIONS PROGRAMS? Travel options programs encourage residents,
TOWARDS A BIKE-FRIENDLY CANADA A National Cycling Strategy Overview
 TOWARDS A BIKE-FRIENDLY CANADA A National Cycling Strategy Overview NationalCyclingStrategFrameworkv3.indd 1 Potential for this modal shift can be found in municipalities of all sizes, in every population
NATIONAL ACTION STRATEGY A VOICE FOR WALKING
 NATIONAL ACTION STRATEGY A VOICE FOR WALKING Canadians are coming together to create a unified voice for walking and to pick up the pace of action for walkable communities. Our goal: to restore everyday
CHAPTER 7.0 IMPLEMENTATION
 CHAPTER 7.0 IMPLEMENTATION Achieving the vision of the Better Streets Plan will rely on the ability to effectively fund, build and maintain improvements, and to sustain improvements over time. CHAPTER
phoenix regional bike share program sponsorship
 phoenix regional bike share program sponsorship High visibility opportunities to promote a healthy lifestyle and sustainable transportation in the Phoenix area what is bike share? Bike share programs are
 Time of Change We Are Growing We Are An Attractive Place To Live We Are Age Diverse + Living Longer 50000 40000 30000 20000 10000 0 2010 Census Job Density Housing Sheds Transit Sheds The Project FUNDING
Public Consultation Centre
 Region of Waterloo Transportation Master Plan Update Public Consultation Centre See the Information Package on how to contact the Project Team and complete the Comment Sheet www.regionofwaterloo.ca/en/exploring-the-region/transportation-master-plan.aspx
Fixed Guideway Transit Outcomes on Rents, Jobs, and People and Housing
 Fixed Guideway Transit Outcomes on Rents, Jobs, and People and Housing Arthur C. Nelson, Ph.D., ASCE, FAICP Professor of Planning and Real Estate Development University of Arizona 1 Changing Transportation
Philip Schaffner Minnesota Department of Transportation October 22, 2013
 Philip Schaffner Minnesota Department of Transportation October 22, 2013 Going beyond performance measures & targets MnDOT has been using performance-based planning and programming for 10 years, but CIMS
APPENDIX E Needs Assessment
 APPENDIX E Needs Assessment Active Transportation Needs Assessment Technical Background This appendix provides the technical background supporting the findings presented in Section 3 of the report. Developed
NEWMARKET UPHAM S CORNER
 SOUTH STATION Planning Initiative NEWMARKET UPHAM S CORNER COLUMBIA ROAD (P) FOUR CORNERS/GENEVA Working Advisory Group (WAG) Meeting #5 TALBOT AVENUE MORTON STREET BLUE HILL AVE/CUMMINS HWY (P) RIVER
Cycling Providing for this Safe & Efficient Mode of Transport
 Trafinz Conference, Sep 2013 Cycling Providing for this Safe & Efficient Mode of Transport Dr Glen Koorey Senior Lecturer in Transportation Dept of Civil & Natural Resources Engineering Presentation Outline
Webinar: The Association Between Light Rail Transit, Streetcars and Bus Rapid Transit on Jobs, People and Rents
 Portland State University PDXScholar TREC Webinar Series Transportation Research and Education Center (TREC) 11-15-2016 Webinar: The Association Between Light Rail Transit, Streetcars and Bus Rapid Transit
Note this page is intentionally left blank for page layout purposes
 Note this page is intentionally left blank for page layout purposes Contents 1 Purpose of the Master Plan... 1 2 Development of the Master Plan... 1 3 How the Master Plan fits with other strategic plans
Uniting Cleveland through the Euclid Corridor Transportation Project
 Zhang 1 Uniting Cleveland through the Euclid Corridor Transportation Project Jinmeng Zhang As a bus passenger takes a ride to downtown Cleveland through Euclid Avenue, constructions can be seen along the
Project Narrative. Albuquerque, NM. July 31, 2015
 Project Narrative Albuquerque, NM July 31, 2015 1 Project Identification As the first bus rapid transit (BRT) project in New Mexico, the Albuquerque Rapid Transit (ART) line will run through the heart
Safer Cycling: How the City of Vancouver is Proactively Improving Cycling Safety
 Safer Cycling: How the City of Vancouver is Proactively Improving Cycling Safety Brian Patterson, MCIP, RPP Urban Systems 2015 Canadian Association of Road Safety Professionals (CARSP) Conference Session
Launceston's Transport Futures. Greater travel options for the people of Launceston
 Launceston's Transport Futures Greater travel options for the people of Launceston Final Draft 13 Jan 2014 1 Page Number Executive summary 3 What is Transport Futures? 4 Vision 6 Economy, access and liveability
A Traffic Operations Method for Assessing Automobile and Bicycle Shared Roadways
 A Traffic Operations Method for Assessing Automobile and Bicycle Shared Roadways A Thesis Proposal By James A. Robertson Submitted to the Office of Graduate Studies Texas A&M University in partial fulfillment
Winnipeg Walk Bike Projects Downtown Tire Talk - Summary
 Winnipeg Walk Bike Projects Downtown Tire Talk - Summary Downtown Projected Bike Lane System Connecting The Forks to the Exchange District (Fort Street, Garry Street & The Forks to Assiniboine Connection)
Douglas Land Use and Transportation Strategy (DLUTS) Summary. August 2013
 Summary. August 2013") Douglas Land Use and Transportation Strategy (DLUTS) Summary August 2013 Background Douglas is a large and popular residential suburb of approximately 30,000 persons on the periphery of Cork City along
Douglas Land Use and Transportation Strategy (DLUTS) Summary August 2013 Background Douglas is a large and popular residential suburb of approximately 30,000 persons on the periphery of Cork City along
2. Context. Existing framework. The context. The challenge. Transport Strategy
 Transport Strategy Providing quality connections Contents 1. Introduction 2. Context 3. Long-term direction 4. Three-year priorities 5. Strategy tree Wellington City Council July 2006 1. Introduction Wellington
METHODOLOGY. Signalized Intersection Average Control Delay (sec/veh)
") Chapter 5 Traffic Analysis 5.1 SUMMARY US /West 6 th Street assumes a unique role in the Lawrence Douglas County transportation system. This principal arterial street currently conveys commuter traffic
Chapter 5 Traffic Analysis 5.1 SUMMARY US /West 6 th Street assumes a unique role in the Lawrence Douglas County transportation system. This principal arterial street currently conveys commuter traffic
Economic Impact of the Recreational Marine Industry Broward, Miami-Dade, and Palm Beach Counties, Florida
 Economic Impact of the Recreational Marine Industry Broward, Miami-Dade, and Palm Beach Counties, Florida - 2018 Completed by THOMAS J. MURRAY & ASSOCIATES, INC. For MARINE INDUSTRIES ASSOCIATION OF SOUTH
Towards a Healthier Economy Why investing in sustainable transport makes economic sense
 Towards a Healthier Economy Why investing in sustainable transport makes economic sense Jolin Warren for Transform Scotland December 2008 Towards a Healthier Economy Why investing in sustainable transport
Maximizing Tourism Marketing Investments A Canadian Perspective
 Maximizing Tourism Marketing Investments A Canadian Perspective Understanding the potential of markets Economics: GDP; Inflation; Unemployment; Employment; Disposable Income; Private Consumption; Consumer
Public Consultation Centre For. Transportation Master Plan Update. Information Package
 Public Consultation Centre For Transportation Master Plan Update Information Package Date Location Hours Tuesday, September 12, 2017 Wednesday, September 13, 2017 Tuesday, September 19, 2017 Cambridge
Bicycle 360 Study Tour
 WE INSPIRE AND ENCOURAGE EXCHANGE SO YOU CAN INNOVATE Bicycle 360 Study Tour A tour mixing together ingredients from the Dutch cycling tradition! This tour is also a training session to help city planners,
Safe Speed programme ATTACHMENT 1. Randhir Karma, Group Manager Network Management and Safety
 Safe Speed programme ATTACHMENT 1 Randhir Karma, Group Manager Network Management and Safety 1 Why Safe Speeds? AT s strategic context National guidance AT has embraced Vision Zero principles and recognises
HAMILTON BIKING PLAN OUR VISION: A BIKE FRIENDLY CITY
 HAMILTON BIKING PLAN 2015-2045 OUR VISION: A BIKE FRIENDLY CITY INTRODUCTION Biking as a travel option is experiencing a resurgence internationally and in New Zealand, growing as a familyfriendly and healthy
Active Community Design: Why Here? Why Now?
 Active Community Design: Why Here? Why Now? Chris Holm Development Review Coordinator 20 April, 2015 Sacramento, California Our environment has changed North Natomas We ve rapidly urbanize our open space
Active travel and economic performance: A What Works review of evidence from cycling and walking schemes
 1 Making the economic case for active travel Active travel and economic performance: A What Works review of evidence from cycling and walking schemes Active Travel Toolkit Slide Pack July 2017 Active travel
Congestion Management in Singapore. Assoc Prof Anthony TH CHIN Department of Economics National University of Singapore
 Congestion Management in Singapore Assoc Prof Anthony TH CHIN Department of Economics National University of Singapore anthonychin@nus.edu.sg Introduction 2 Introduction and What is Traffic Congestion?
Non-motorized Transportation Planning Resource Book Mayor s Task Force on Walking and Bicycling City of Lansing, Michigan Spring 2007 pg.
 Non-motorized Transportation Planning Resource Book pg. 105 of 158 Non-motorized Transportation Planning Resource Book pg. 106 of 158 Non-motorized Transportation Planning Resource Book pg. 107 of 158
Cycling Economies. Economic Impacts of Bike Lanes. Daniel Arancibia
 Cycling Economies Economic Impacts of Bike Lanes Daniel Arancibia Introduction Research is showing that cyclists are good customers, that their numbers and economic impact increase with bike lanes, and
Liveable Neighbourhoods Design Code and Policy
 CNU London Transportation Summit, November 2007 The West Australian Liveable Neighbourhoods Design Code and Policy Incorporating a New Urbanist Street Design Manual for New Communities Wendy Morris Ecologically
Creating walkable, bikeable and transit-supportive communities in Halton
 Creating walkable, bikeable and transit-supportive communities in Halton By presenting current research and best practices, the information in this paper is meant to support and broaden discussion on how
BEAR CREEK PARK AND RIDE
 BEAR CREEK PARK AND RIDE 7760 178th Pl NE, Redmond, WA 98052 700 Average weekday transit boardings 283 Parking spaces Owned by King County Metro Served by Sound Transit and King County Metro Bear Creek
Part B Design Guidance / Principles _
 Part B Design Guidance / Principles www. landlab.co.nz Queenstown Town Centre Public Realm Design Guidelines Version 7 14 June 2018 Page 006 B1 Design Guidance & Best Practice The Queenstown Town Centre
ADOT Statewide Bicycle and Pedestrian Program Summary of Phase IV Activities APPENDIX B PEDESTRIAN DEMAND INDEX
 ADOT Statewide Bicycle and Pedestrian Program Summary of Activities APPENDIX B PEDESTRIAN DEMAND INDEX May 24, 2009 Pedestrian Demand Index for State Highway Facilities Revised: May 29, 2007 Introduction
Walkability in St Kilda Creates a Feeling of Social Cohesion Lily Weinberg Healthy Communities Assignment 2 14 September 2009
 Walkability in St Kilda Creates a Feeling of Social Cohesion Lily Weinberg 260504 Healthy Communities Assignment 2 14 September 2009 Introduction I used the Walkability Checklist to evaluate the walkability
Walking the Talk: Sustainable Transport and Urban Design in Four New Zealand Cities
 Walking the Talk: Sustainable Transport and Urban Design in Four New Zealand Cities INTRODUCTION Pilot study on sustainable transport and urban design at local government level Giving focus to further
Why Walking? The Heart Foundation call for a Walking Strategy
 Why Walking? The Heart Foundation call for a Walking Strategy Key facts Only 51% of adults and 34% of children in South Australia meet the physical activity guidelines to achieve health benefits. 4 Physical
At each type of conflict location, the risk is affected by certain parameters:
 TN001 April 2016 The separated cycleway options tool (SCOT) was developed to partially address some of the gaps identified in Stage 1 of the Cycling Network Guidance project relating to separated cycleways.
DOWNTOWN TUPELO MAIN STREET: ROAD DIET STUDY
 DOWNTOWN TUPELO MAIN STREET: ROAD DIET STUDY Since mid-2009, RPM Transportation Consultants (RPM) has worked with the Downtown Tupelo Main Street Association to evaluate traffic conditions and potential
Chapter 7. Transportation. Transportation Road Network Plan Transit Cyclists Pedestrians Multi-Use and Equestrian Trails
 Chapter 7 Transportation Transportation Road Network Plan Transit Cyclists Pedestrians Multi-Use and Equestrian Trails 7.1 TRANSPORTATION BACKGROUND The District of Maple Ridge faces a number of unique
1 Road and HGV danger in London. Hannah White, Freight & Fleet Programme Manager November 2017
 1 Road and HGV danger in London Hannah White, Freight & Fleet Programme Manager November 2017 2 London and its transport networks London: 8.6m residents + 30m visitors 30m journeys per day 6.3m by bus
Contents Location Map Welcome and Introduction Travel Plan Management Science Park Accessibility Walking Cycling Bus Rail Car Sharing Contact Details
 Contents Contents Location Map Welcome and Introduction Travel Plan Management Science Park Accessibility Walking Cycling Bus Rail Car Sharing Contact Details 1 2 3 5 7 9 11 13 15 17 19 Thames Valley Science
2010 Pedestrian and Bicyclist Special Districts Study Update
 2010 Pedestrian and Bicyclist Special Districts Study Update Pedestrian and Bicyclist Special Districts Program Overview H-GAC s Special Districts Program aims to provide strategic investments in pedestrian
WELCOME TO OPEN HOUSE # 1 June 14, 2017
 Langstaff Road Weston Road to Highway 7 Class Environmental Assessment Study WELCOME TO OPEN HOUSE # 1 June 14, 2017 Please sign in and join our mailing list Purpose of Open House #1 & Study Area York
Bike Routes Assessment: 95 Ave, 106 St & 40 Ave. Replace with appropriate image in View > Master.
 Bike Routes Assessment: 95 Ave, 106 St & 40 Ave Replace with appropriate image in View > Master. Transportation Committee October 15, 2014 City Council Direction What we are trying to achieve The Way Ahead:
Pedestrian Demand Modeling: Evaluating Pedestrian Risk Exposures
 Pedestrian Demand Modeling: Evaluating Pedestrian Risk Exposures Kelly J. Clifton National Center for Smart Growth University of Maryland May 19, 2008 Study Team University of Maryland National Center
The proposed development is located within 800m of an existing Transit Station where infill developments and intensification are encouraged.
 Stantec Consulting Ltd. 1331 Clyde Avenue, Suite 4 Ottawa ON K2C 3G4 Tel: (613) 722-442 Fax: (613) 722-2799 May 14, 213 File: 1638823 Robinson Park Development Corp. 5699 Power Road Ottawa, ON, K1G 3N4
Making Brighton & Hove A Walkable City
 Making Brighton & Hove A Walkable City Living Streets Public Meeting 28 th November 2011, 7.30 pm Lord Nelson Inn 36 Trafalgar St, Brighton, BN1 4ED Tonight s Meeting Stephen Young Chairman, Brighton and
The Nine Challenges for the Development of Transport in the Fast Growing Capital of Vietnam: Hanoi.
 The Nine Challenges for the Development of Transport in the Fast Growing Capital of Vietnam: Hanoi. Challenge 1:Economic growth Higher Incomes. More people can afford cars and motorbikes. In good old times
BYRES ROAD: PUBLIC REALM Public Consultation
 Public Consultation Introduction As a vibrant commercial, shopping and residential location within the heart of the West End Byres Road is an important destination. Its proximity to the University of Glasgow
Presentation Summary Why Use GIS for Ped Planning? What Tools are Most Useful? How Can They be Applied? Pedestrian GIS Tools What are they good for?
 1 2 Pedestrian GIS Tools What are they good for? Pro Walk / Pro Bike 2006 Presentation Summary Why Use GIS for Ped Planning? What Tools are Most Useful? How Can They be Applied? Matt Haynes Fehr & Peers