Pedestrian Demand Modeling: Evaluating Pedestrian Risk Exposures
|
|
|
- Marcus Patterson
- 5 years ago
- Views:
Transcription


1 Pedestrian Demand Modeling: Evaluating Pedestrian Risk Exposures Kelly J. Clifton National Center for Smart Growth University of Maryland May 19, 2008
2 Study Team University of Maryland National Center for Smart Growth Kelly J. Clifton, Associate Professor Carolina Burnier, PhD student Urban Studies and Planning Shuo Huang, MS student Urban Studies and Planning Min Wook Kang, PhD student, Civil Engineering Toole Design Group Bob Schneider
3 Presentation Outline Review Purpose & Objectives Project Description Application Results Challenges and Limitations Implementation
4 Purpose and Objectives
5 Research Problem Pedestrian risk exposure is an important measure of safety but often difficult to evaluate. Risk Exposure = # of collisions measures of demand
6 Research Problem Pedestrian risk exposure is an important measure of safety but often difficult to evaluate. Risk Exposure = # of collisions measures of demand We tend to have these data from police records

7 Pedestrian Crashes City of Baltimore
8 Research Problem Pedestrian risk exposure is an important measure of safety but often difficult to evaluate. Risk Exposure = # of collisions measures of demand Pedestrian demand data (counts) are less common
9 Research Objective We aim to develop a method to estimate pedestrian demand or volumes at intersections (numbers of pedestrians). These estimates can be used to analyze pedestrian risk exposure.
10 Guiding Principles Employ data available for all Maryland communities Use a Geographic Information Systems framework Develop a user-friendly methodology for practitioners Apply the model in a MD community
11 Project Description
12 Background Previous project used transportation modeling software (2004) Estimated models using walking data from New York City metropolitan area Applied model in Baltimore City and Langley Park Validation revealed areas for improvement
13 Evaluation Of Prior Effort (Strengths) + Developed based upon traditional regional travel demand models + Applied at pedestrian scale + Successful in predicting pedestrian counts + Relied on readily available data + Permitted evaluation relative risk exposures in two communities
14 Evaluation Of Prior Effort (Limitations) - Calibration data (actual pedestrian counts) limited - Boundary effects - Models estimated using NYC data - Utilized several software programs - Complicated interface
15 Project Description Builds on previous effort Retain general framework from previous model (Re) Specification of the pedestrian travel model using Maryland pedestrian data Data assembly Pedestrian travel model improvement & development in GIS platform Develop detailed user protocol Apply in Maryland community Combine with crash data to evaluate pedestrian exposures
16 Pedestrian Volume Model Components Pedestrian Network, Land Use and Zonal System Trip Generation How many trips? Sensitive to land use and demographics Estimated from 2001 NHTS for Baltimore region Trip Distribution Where are they going? Based upon gravity model Network Assignment By what path? Minimum travel time
17 Data Needs Use archived data available for Maryland communities US Census of Population and Housing US Census TIGER files MD Property View National Household Travel Survey for Baltimore metro area Aerial photos Pedestrian-Vehicular collisions Pedestrian counts (model calibration)


18 Pedestrian Network Census TIGER line file provides topology and basic characteristics Expands single street link to pedestrian links (sidewalks & crosswalks Use aerial photos to make corrections and add links (paths, trails, facilities not adjacent to road network
19 Land Use System Maryland Property View Residential units, commercial, retail, service, and other uses US Census Area vehicle ownership TIGER Files (street centerline) Pedestrian Connectivity

20 Pedestrian Analysis Zones Representation of activities/land uses Similar to TAZ concept Create centroid of block face that represents an aggregation of activities, land use and urban form
21 Trip Generation Estimates the number of walk trips produced and attracted to a PAZ Productions and Attractions for: Home Based Walk Trips Non-Home Based Walk Trips
22 Trip Generation HB Walk Equations for Attractions and Productions for HB Walk Trips Estimated using NHTS Baltimore Add On data Legend Baltimore Region Counties Anne Arundel County Baltimore COunty Carroll County Harford County Howard County Baltimore City
23 Trip Generation HB Walk Attractions and Productions for HB Walk Trips HB Walk (Walk trips/hh) = exp ( *vehicle ownership *street connectivity *percent commercial *residential dwelling units) Note: All of the land use variables are calculated at the ¼ mile buffer of PAZ; Vehicle ownership is calculated from the census tract. Converted the walk trips/hh to walk trips/ PAZ with the equation: HBWalk/PAZ (walk trips/paz) = HBWalk (walk trips/hh) * total dwelling units in the PAZ
24 Trip Generation NHB Walk Equations for Attractions and Productions for NHB Walk Trips Not enough NHB trips in NHTS to estimate directly: Employed NHB Trip Generation Models for the San Francisco Bay Area (BAYCAST-90) for all modes Estimated an Equation to skim walk trips using 2001 NHTS for Baltimore Area
25 Note: variables in this model are calculated at the ¼ mile buffer of the trip end. Trip Generation NHB Walk Equations for Productions for NHB Walk Trips NHB Productions (Total trips/paz) = 0.798*Other Employment *Retail Employment *Service Employment *Total Households Note: all of the variables are calculated the PAZ level Convert All Trips to Walk Trips Prob (Walk trip) = exp (UWalk) / (1+ exp(uwalk)) Where, UWalk = *Connectivity *percent commercial
26 Note: variables in this model are calculated at the ¼ mile buffer of the trip end. Trip Generation NHB Walk Equations for Attractions for NHB Walk Trips NHB Productions (Total trips/paz) = 0.636*Other Employment *Retail Employment *Service Employment *Total Households Note: all of the variables are calculated the PAZ level Convert All Trips to Walk Trips Prob (Walk trip) = exp (UWalk) / (1+ exp(uwalk)) Where, UWalk = *Connectivity *percent commercial
27 Trip Generation NHB Walk Equations for Productions and Attractions for NHB Walk Trips must be also converted from walk trips/hh to walk trips/ PAZ HBWalk/PAZ (walk trips/paz) = HBWalk (walk trips/hh) * total dwelling units in the PAZ
28 1. Trip Generation Frequency of Walk Trip Productions & Attractions by Trip Purpose in the Baltimore Study Area Frequency More Walk Trips per PAZ per Day HBWP/PAZ HBWA/PAZ NHBWP/PAZ NHBWA/PAZ
29 Trip Distribution Estimates the flows between origins and destinations Results in a trip table or OD matrix Use traditional approach gravity model Distributes trips based upon the number of attractions and the distance separating PAZs.
30 Trip Distribution Apply Gravity Model for Pedestrian Trip Distribution T ij = P i A j j A F j ij F K ij ij K ij
31 Trip Distribution - Distance Density (%) 45% 40% 35% 30% 25% 20% 15% 10% 5% 0% Walk Trip Distance Distribution F 1 ij = exp d ij More Walk Trip Distance (mile) ( 0. d ) ij HBWalk Trips (Bal_6C) All Walk Trips (Bal_6C) Where, Fij = Friction factor dij = walk trip distance (meter) NHBWalk Trips (Bal_6C) All Walk Trips (National) Data source: 2001 NHTS
32 Trip Distribution: Home Based Walk Trips
33 Trip Distribution: Non-Home Based Walk Trips
34 Route Assignment Estimates the path taken by each trip and assigns to the pedestrian network Developed an executable program using C++ to calculate the shortest path for each pair of PAZs All or nothing assignment to network Sums pedestrian volume at each intersection. Limited by computational capacity of GIS


35 Model Output Volumes are accumulated on intersections and links. Result is estimate of 24 hour pedestrian volumes
36 Model output gives pedestrian volumes at intersections Evaluation of Pedestrian Risk Exposure Pedestrian-vehicle crash data police records Risk Exposure = # of collisions measures of demand
37 Evaluation of Pedestrian Risk Exposure Output of model provides missing data to estimate risk exposure Crash data available through police reporting, geo-referenced to nearest intersection Using equation, can rank intersections with highest risk exposure
38 Application Results
39 Application Apply and calibrate model in urban and suburban setting Baltimore City Repeat same study area in prior study Crash and count data available Comparison of results Prince Georges County Calibration in suburban area Crash and count data available

40 Baltimore City Legend Pedestrian-Vehicular Crashes Study Area Roads

41 Prince George s County

42 Study area comparison

43 Time cost estimates (hrs)
44 Pedestrian Volumes 24 Pedestrian Volumes at Intersections Results range from pedestrians per intersection per 24 hr period Legend Sidewalk Total Volume
45 Crash Data 900 crashes between the years of 2000 to 2003 Legend Crashes Sidewalk
46 Legend Sidewalk Exposure Rate Pedestrian Risk Exposure
47 1 NORTH & GREENMOUNT PRATT & CAROLINE FRONT & FAYETTE CHARLES AND 20TH MADISON & BOND BROADWAY & EASTERN CHASE & HARFORD FAYETTE & CAROLINE GUILFORD & SARATOGA CHARLES & LAFAYETTE Top Intersections Risk Exposure Baltimore City RANK ADDRESS CRASHES EXPOSURE Crashes per million

48 Exposure analysis time cost (hrs)
49 Challenges and Limitations
50 Challenges and Limitations Pedestrian network and PAZs limits on number of PAZs GIS system can handle ~ 1700 Only two trip purposes home-based and nonhome based walk trips due to limitations of NHTS Computational capacity for network assignment long time to run Limited availability of pedestrian counts to revalidate model
51 Implementation
52 Implementation Suggestions for Maryland Develop Website at National Center for Smart Growth to disseminate model, protocol, results and other information Provide workshops through SHA or NCSG to train pedestrian planners on how to use the model Outreach to specific communities as demonstration project Refinement of model with each new application
53 Questions?
54
55 Count Validation Obtained peak hour counts for Baltimore City 7-9 AM, 11 AM-1PM and 4-6 PM For 8 directions Estimated volumes with Pedestrian Demand Model 24 hours Summed to the 4 nodes of the intersection Used NHTS to calculate percentage of walk trips that occurred during peak hours: AM peak 12.1%; Mid day peak 16.1%; PM peak 17.7% Calculated volume share for peak hours from the estimated volumes Compared average peak hour counts to estimated volumes for each intersection
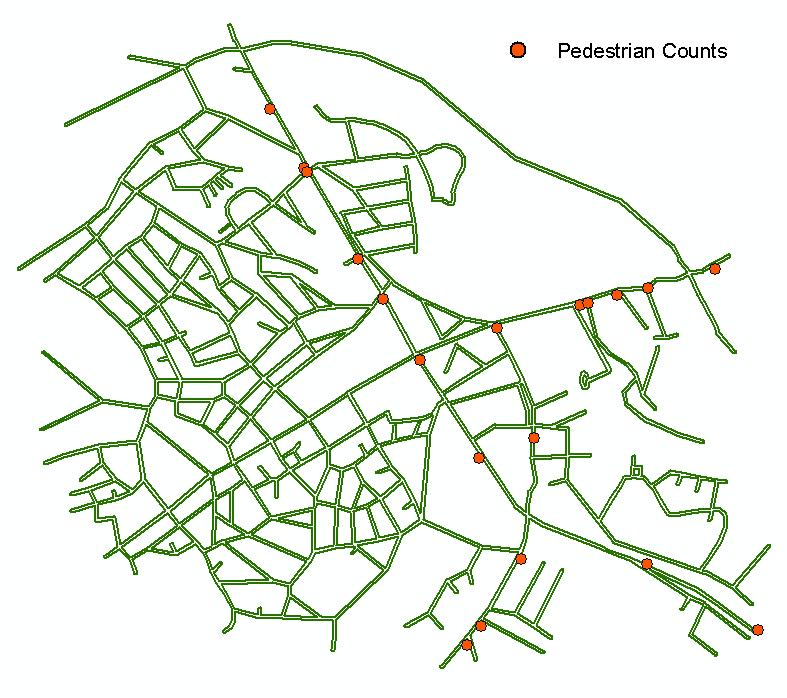
56 Pedestrian Counts
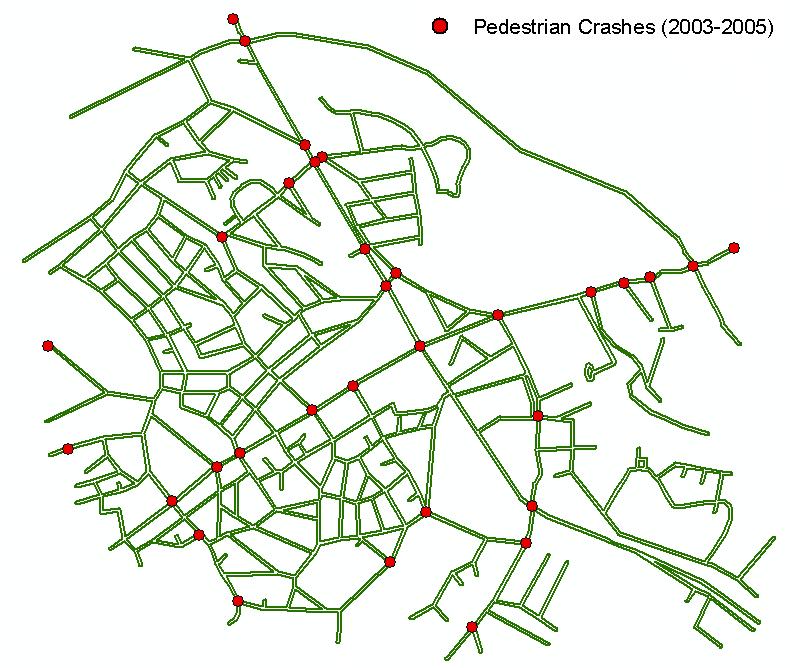
57 Pedestrian Crashes
Webinar: Development of a Pedestrian Demand Estimation Tool
 Portland State University PDXScholar TREC Webinar Series Transportation Research and Education Center (TREC) 2-18-2016 Webinar: Development of a Pedestrian Demand Estimation Tool Kelly Clifton Portland
A Framework For Integrating Pedestrians into Travel Demand Models
 A Framework For Integrating Pedestrians into Travel Demand Models Kelly J. Clifton Intersections Seminar University of Toronto September 22, 2017 Portland, Oregon, USA Region Population~ 2.4 M Urban Growth
APPENDIX E BIKEWAY PRIORITIZATION METHODOLOGY
 APPENDIX E BIKEWAY PRIORITIZATION METHODOLOGY INTRODUCTION The network of bikeways recommended in the Bicycle Master Plan is extensive and is likely to be only partially completed during the 25-year life
ADOT Statewide Bicycle and Pedestrian Program Summary of Phase IV Activities APPENDIX B PEDESTRIAN DEMAND INDEX
 ADOT Statewide Bicycle and Pedestrian Program Summary of Activities APPENDIX B PEDESTRIAN DEMAND INDEX May 24, 2009 Pedestrian Demand Index for State Highway Facilities Revised: May 29, 2007 Introduction
Presentation Summary Why Use GIS for Ped Planning? What Tools are Most Useful? How Can They be Applied? Pedestrian GIS Tools What are they good for?
 1 2 Pedestrian GIS Tools What are they good for? Pro Walk / Pro Bike 2006 Presentation Summary Why Use GIS for Ped Planning? What Tools are Most Useful? How Can They be Applied? Matt Haynes Fehr & Peers
2010 Pedestrian and Bicyclist Special Districts Study Update
 2010 Pedestrian and Bicyclist Special Districts Study Update Pedestrian and Bicyclist Special Districts Program Overview H-GAC s Special Districts Program aims to provide strategic investments in pedestrian
Memorandum. Drive alone
 Memorandum To: Cc: From: Kimberly Kerr, Assistant Chief Administrative Officer Natalie Porter, PE, TE Shawna Purvines Claudia Wade, PE Michael Schmitt, AICP CTP, PTP Re: Technical Memorandum #2: Model
ABSTRACT PEDESTRIAN - VEHICULAR CRASHES: THE INFLUENCE OF PERSONAL AND ENVIRONMENTAL FACTORS. Carolina V. Burnier, M.Sc., 2005
 ABSTRACT Title: PEDESTRIAN - VEHICULAR CRASHES: THE INFLUENCE OF PERSONAL AND ENVIRONMENTAL FACTORS Carolina V. Burnier, M.Sc., 2005 Directed By: Dr. Kelly J. Clifton, Department of Civil and Environmental
Pedestrian Level of Comfort The Pedestrian Level of Comfort analysis (PLOC) was created by the Montgomery County Planning Department for two reasons:
 was created by the Montgomery County Planning Department for two reasons:") Pedestrian Level of Comfort The Pedestrian Level of Comfort analysis (PLOC) was created by the Montgomery County Planning Department for two reasons: 1) To identify locations in the existing walking network
Pedestrian Level of Comfort The Pedestrian Level of Comfort analysis (PLOC) was created by the Montgomery County Planning Department for two reasons: 1) To identify locations in the existing walking network
Pedestrian Activity Criteria. PSAC March 8, 2011
 Pedestrian Activity Criteria PSAC March 8, 2011 Contents 1. Project Overview a) Revised schedule of PSAC hearings 2. Pedestrian Activity: Where walking is important a) Existing conditions (revisions based
How Policy Drives Mode Choice in Children s Transportation to School
 How Policy Drives Mode Choice in Children s Transportation to School Physical Activity through Active Transportation Ruth L. Steiner 2011 Technical Conference and Exhibit Lake Buena Vista, FL April 3-6,
Rerouting Mode Choice Models: How Including Realistic Route Options Can Help Us Understand Decisions to Walk or Bike
 Portland State University PDXScholar TREC Friday Seminar Series Transportation Research and Education Center (TREC) 4-1-2016 Rerouting Mode Choice Models: How Including Realistic Route Options Can Help
Bike Planner Overview
 Bike Planner Overview A Web-based Sketch Planning Tool for Los Angeles County presented by William E. Walter, GISP April 12, 2017 GIS-T Transportation leadership you can trust. Bike Planner Overview Guiding
GIS Based Data Collection / Network Planning On a City Scale. Healthy Communities Active Transportation Workshop, Cleveland, Ohio May 10, 2011
 The Purpose of GIS Based Network Planning GIS Based Data Collection / Network Planning Healthy Communities Active Transportation Conference Tuesday, May 10, 2011 10:00 AM Norman Cox, LLA, ASLA. Ann Arbor,
Chapter 4 Traffic Analysis
 Chapter 4 Traffic Analysis PURPOSE The traffic analysis component of the K-68 Corridor Management Plan incorporates information on the existing transportation network, such as traffic volumes and intersection
A GIS APPROACH TO EVALUATE BUS STOP ACCESSIBILITY
 Advanced OR and AI Methods in Transportation A GIS APPROACH TO EVALUATE BUS STOP ACCESSIBILITY Giuseppe SALVO 1, Simona SABATINI 2 Abstract. This paper proposes a methodology to assess public transportation
LONG-RANGE TRANSPORTATION MODELING IN THE BRISTOL URBANIZED AREA March 2008
 LONG-RANGE TRANSPORTATION MODELING IN THE BRISTOL URBANIZED AREA March 2008 Good planning is essential to the transportation process Bristol Metropolitan Planning Organization - Smallest urbanized area
SoundCast Design Intro
 SoundCast Design Intro Basic Design SoundCast and Daysim 3 Land use attributes Households & Individuals SoundCast DaySim Travel demand simulator Trips and Households, Excel Summary Sheets, EMME network
TRAVEL DEMAND FORECASTING MODEL DEVELOPMENT REPORT
 Trinity County TRAVEL DEMAND FORECASTING MODEL DEVELOPMENT REPORT Prepared for: County of Trinity California August 2010 2990 Lava Ridge Court, Suite 200 Rosevile, CA 95661 TABLE OF CONTENTS 1. Introduction...
Estimating a Toronto Pedestrian Route Choice Model using Smartphone GPS Data. Gregory Lue
 Estimating a Toronto Pedestrian Route Choice Model using Smartphone GPS Data Gregory Lue Presentation Outline Introduction Background Data Smartphone Data Alternative Route Generation Choice Model Toronto
GIS Based Non-Motorized Transportation Planning APA Ohio Statewide Planning Conference. GIS Assisted Non-Motorized Transportation Planning
 The Purpose of GIS Assisted Network GIS Assisted Non-Motorized Transportation 2011 APA Ohio Statewide Conference Friday, 10:45 AM to Noon Focus on near-term projects wwwgreenwaycollabcom The purpose of
RIDERSHIP PREDICTION
 RIDERSHIP PREDICTION Outline 1. Introduction: route ridership prediction needs and issues. 2. Alternative approaches to route ridership prediction. Professional judgement Survey-based methods Cross-sectional
Tampa Bay Regional Planning Model (TBRPM v7.x)
") Express Lane Model in Tampa Bay Area presented by Hoyt Davis, Kapil Arya, & Chunyu Lu March 26, 2014 Introduction Tampa Bay Regional Planning Model (TBRPM v7.x) 4 Step Model used for 2035 Long Range Transportation
Express Lane Model in Tampa Bay Area presented by Hoyt Davis, Kapil Arya, & Chunyu Lu March 26, 2014 Introduction Tampa Bay Regional Planning Model (TBRPM v7.x) 4 Step Model used for 2035 Long Range Transportation
City of Baton Rouge and Parish of East Baton Rouge
 City of Baton Rouge and Parish of East Baton Rouge An Analysis of Neighborhood Walkability Louisiana Remote Sensing and GIS Workshop April 22-25, 2013 Cajundome Convention Center Lafayette, Louisiana April
I-105 Corridor Sustainability Study (CSS)
") I-105 Corridor Sustainability Study (CSS) Metro Streets and Freeways Subcommittee March 21, 2019 Gary Hamrick Cambridge Systematics, Inc. I-105 CSS Project History & Background Funded by Caltrans Sustainable
I-105 Corridor Sustainability Study (CSS) Metro Streets and Freeways Subcommittee March 21, 2019 Gary Hamrick Cambridge Systematics, Inc. I-105 CSS Project History & Background Funded by Caltrans Sustainable
Traffic Safety Barriers to Walking and Bicycling Analysis of CA Add-On Responses to the 2009 NHTS
 Traffic Safety Barriers to Walking and Bicycling Analysis of CA Add-On Responses to the 2009 NHTS NHTS Users Conference June 2011 Robert Schneider, Swati Pande, & John Bigham, University of California
Guidelines for Providing Access to Public Transportation Stations APPENDIX C TRANSIT STATION ACCESS PLANNING TOOL INSTRUCTIONS
 APPENDIX C TRANSIT STATION ACCESS PLANNING TOOL INSTRUCTIONS Transit Station Access Planning Tool Instructions Page C-1 Revised Final Report September 2011 TRANSIT STATION ACCESS PLANNING TOOL INSTRUCTIONS
PEDESTRIAN COLLISIONS IN LOS ANGELES 1994 through 2000
 PEDESTRIAN COLLISIONS IN LOS ANGELES 1994 through 2000 City of Los Angeles Department of Transportation Gloria Jeff, General Manager March, 2006 This document printed with grant funds from the California
Kevin Proft NRS 509 Final Project: Written Overview & Annotated Bibliography GIS Applications in Active Transportation Planning
 Kevin Proft NRS 509 Final Project: Written Overview & Annotated Bibliography 12.13.16 GIS Applications in Active Transportation Planning Geographic Information Systems (GIS) play an important role in developing
Feasibility Study Danbury Branch Electrification. Task 3 Report Ridership Forecasting. Table of Contents
 Connecticut Department of Transportation Washington Group International FINAL Task 3 Report Ridership Forecasting Task 3 Report Ridership Forecasting Table of Contents 1.0 Background 2.0 Approach 3.0 Summary
TAKOMA METRO STATION
 TKOM METRO STTION Traffic nalysis Technical Memorandum Station Planning in Support of Joint evelopment Job No. 13-FQ165-LN-2 November 213 WSHINGTON METROPOLITN RE TRNSIT UTHORITY (WMT) Takoma Metro Station
Using GIS and CTPP Data for Transit Ridership Forecasting in Central Florida
 Using GIS and CTPP Data for Transit Ridership Forecasting in Central Florida Xiaobo Liu, Jeffery Stiles Jacobs Engineering Group Mei Chen University of Kentucky For GIS in Transit Conference, 2009 St.
TRANSPORTATION NEEDS ASSESSMENT
 TRANSPORTATION NEEDS ASSESSMENT A travel demand analysis was carried out to determine the operational issues and the potential benefit that adding traffic capacity would have on the road network. All the
Data Analysis February to March Identified safety needs from reported collisions and existing travel patterns.
 Welcome! Thank you for participating in today s Valencia Bikeway Improvements workshop. Data Analysis February to March Identified safety needs from reported collisions and existing travel patterns. Initial
Association of Monterey Bay Area Governments Regional Travel Demand Model Technical Report
 Association of Monterey Bay Area Governments Regional Travel Demand Model Technical Report January 2015 Report 445 Reservation Rd. Suite G Marina, California 93933 831.883.3750 www.ambag.org Contents Introduction...
PROJECT BACKGROUND/DESCRIPTION
 SCOPE OF SERVICES St. Charles Parish Comprehensive Pedestrian and Bicycle Master Plan (CPBP) St. Charles Parish, Louisiana State Project No. H. 012462 RPC Project No. SCPBMP1 PROJECT BACKGROUND/DESCRIPTION
3 Palmer Urban Travel Demand Model Development
 3 Palmer Urban Travel Demand Model Development This section discusses the development of the urban travel demand model. The Palmer Urban Transportation Study includes a detailed demand model for the Palmer
A New Approach in the GIS Bikeshed Analysis Considering of Topography, Street Connectivity, and Energy Consumption
 A New Approach in the GIS Bikeshed Analysis Considering of Topography, Street Connectivity, and Energy Consumption ACSP Conference, Cincinnati, OH November 1, 2012 Hiroyuki Iseki, Ph.D. & Matthew Tingstrom
Eric Sundquist Managing Director State Smart Transportation Initiative (SSTI) Urban Sustainability Accelerator
 Urban Sustainability Accelerator") New tools for making better transportation system decisions Eric Sundquist Managing Director State Smart Transportation Initiative (SSTI) Urban Sustainability Accelerator Accessibility and trip-making
New tools for making better transportation system decisions Eric Sundquist Managing Director State Smart Transportation Initiative (SSTI) Urban Sustainability Accelerator Accessibility and trip-making
PEDESTRIAN ACTION PLAN
 ATTACHMENT 2 CITY OF SANTA MONICA PEDESTRIAN ACTION PLAN CITY OF SANTA MONICA PEDESTRIAN ACTION PLAN This page intentionally left blank EXECUTIVE SUMMARY CHAPTER 1 EXECUTIVE SUMMARY Setting the Stage
Rochester Area Bike Sharing Program Study
 roc bike share Rochester Area Bike Sharing Program Study Executive Summary ~ January 2015 JANUARY 2015 8484 Georgia Avenue, Suite 800 Silver Spring, MD 20910 3495 Winton Pl., Bldg E, Suite 110 Rochester,
Pedestrian Dynamics: Models of Pedestrian Behaviour
 Pedestrian Dynamics: Models of Pedestrian Behaviour John Ward 19 th January 2006 Contents Macro-scale sketch plan model Micro-scale agent based model for pedestrian movement Development of JPed Results
3.0 Future Conditions
 3.0 Future Conditions In order to be able to recommend appropriate improvements to the transportation system of the Town, it is important to first understand the nature and volume of traffic that is expected
CPC Parking Lot Riverside Drive. Transportation Rationale
 CPC Parking Lot Transportation Rationale Prepared By: NOVATECH Suite 200, 240 Michael Cowpland Drive Ottawa, Ontario K2M 1P6 September 2015 Novatech File: 114093 Ref: R-2015-153 Table of Contents 1.0 INTRODUCTION...
Development of a Pedestrian Demand Estimation Tool
 Portland State University PDXScholar Civil and Environmental Engineering Faculty Publications and Presentations Civil and Environmental Engineering 9-2015 Development of a Pedestrian Demand Estimation
GIS Based Non-Signalized Intersection Data Inventory Tool To Improve Traffic Safety
 GIS Based Non-Signalized Intersection Data Inventory Tool To Improve Traffic Safety UNIVERSITY OF ALABAMA JENNA SIMANDL JENNY BLEIHOLDER ANDREW GRAETTINGER TIM BARNETT LUKE TAYLOR RANDY SMITH Introduction
Bicycle and Pedestrian Planning in a Historically Car-Centric Culture: A Focus on Connectivity, Safety, & Accessibility
 Bicycle and Pedestrian Planning in a Historically Car-Centric Culture: A Focus on Connectivity, Safety, & Accessibility Kate Horton and Zylavian Watley Transportation Planners Memphis MPO Date: October
Bike BR. A Tool for Baton Rouge, Louisiana by the City-Parish Planning Commission
 A Tool for Baton Rouge, Louisiana by the City-Parish Planning Commission APT 206 Function Code: S207 Title: Community Bikeability Tool APA s 2012 National Planning Conference April 15, 2012 Presented by:
Application of Demographic Analysis to Pedestrian Safety. Center for Urban Transportation Research University of South Florida
 Application of Demographic Analysis to Pedestrian Safety BDV25 TWO 977 30 Pei Sung Lin, Ph.D., P.E., PTOE, FITE Program Director Achilleas Kourtellis, Ph.D. Senior Research Associate CUTR, University of
City of Elizabeth City Neighborhood Traffic Calming Policy and Guidelines
 City of Elizabeth City Neighborhood Traffic Calming Policy and Guidelines I. Purpose: The City of Elizabeth City is committed to ensure the overall safety and livability of residential neighborhoods. One
Table #6 VISION CHARACTERISTICS
 Table #6 VISION White Flint is a place to live, work, play, shop, and walk with sufficient density to encourage quality redevelopment. Vibrant streets and consistent streetscapes are important. CHARACTERISTICS
Methodology for Determining Pedestrian Activity Factors
 Where People Walk: Methodology for Determining Pedestrian Activity Factors Part I: Background on the WalkFirst Project The goal of the WalkFirst project is to improve walking conditions in San Francisco,
Street Smart - Regional Pedestrian Safety Campaign. Hopkins Grand Rounds July 16, 2014
 Street Smart - Regional Pedestrian Safety Campaign Hopkins Grand Rounds July 16, 2014 Baltimore Metropolitan Council (BMC) Who We Are The organization of the Baltimore region s elected executives, representing
Vision Zero High Injury Network Methodology
 Vision Zero High Injury Network Methodology DATA SETS USED: 1. Reportable crashes in Philadelphia from 2012-2016, available as open data through PennDOT 2. Street Centerline geographic layer, maintained
DEVELOPMENT OF A SET OF TRIP GENERATION MODELS FOR TRAVEL DEMAND ESTIMATION IN THE COLOMBO METROPOLITAN REGION
 DEVELOPMENT OF A SET OF TRIP GENERATION MODELS FOR TRAVEL DEMAND ESTIMATION IN THE COLOMBO METROPOLITAN REGION Ravindra Wijesundera and Amal S. Kumarage Dept. of Civil Engineering, University of Moratuwa
AMENDING MOTION: Mobility Plan - Pedestrians and Disadvantaged Communities
 I MOVE that the Council: AMENDING MOTION: Mobility Plan - Pedestrians and Disadvantaged Communities 1. INSTRUCT the Department of City Planning to amend the proposed Mobility Plan to include the following;
BUILDING THE CASE FOR TRAVEL OPTIONS IN WASHING TON COUNTY. Image: Steve Morgan. Image: Steve Morgan
 BUILDING THE CASE FOR TRAVEL OPTIONS IN WASHING TON COUNTY Image: Steve Morgan Image: Steve Morgan Image: TriMet Image: TriMet WHAT ARE TRAVEL OPTIONS PROGRAMS? Travel options programs encourage residents,
DUNBOW ROAD FUNCTIONAL PLANNING
 DUNBOW ROAD FUNCTIONAL PLANNING Final Report August 3, 216 #31, 316 5th Avenue NE Calgary, AB T2A 6K4 Phone: 43.273.91 Fax: 43.273.344 wattconsultinggroup.com Dunbow Road Functional Planning Final Report
Analyzing Gainesville s Bicycle Infrastructure
 Mateo Van Thienen 1 DCP 2002: Intro to GIS II Final Project Paper Abstract: Analyzing Gainesville s Bicycle Infrastructure The main purpose of this project is to determine which areas within Gainesville
Eastern PA Trail Summit October 1, 2018
 Eastern PA Trail Summit October 1, 2018 WHO WE ARE + WHY + WE RE * HERE * * * * * * Session Goals: Discuss how to coordinate planning and design in small, urbanized towns Consider how to develop alternative
An Analysis of Central Business District Pedestrian Circulation Patterns
 An Analysis of Central Business District Pedestrian Circulation Patterns M. P. NESS, Greater London Council, J. F. MORRALL, Department of Highways, Ontario, and B. G. HUTCHINSON, University of Waterloo,
Bikeway action plan. Bicycle Friendly Community Workshop March 5, 2007 Rochester, MN
 Bikeway action plan Summary The was held on March 5, 2007 at the Rochester Mayo Civic Center. The workshop was hosted by Rochester-Olmsted County Planning Department in collaboration with the League of
ENHANCED PARKWAY STUDY: PHASE 2 CONTINUOUS FLOW INTERSECTIONS. Final Report
 Preparedby: ENHANCED PARKWAY STUDY: PHASE 2 CONTINUOUS FLOW INTERSECTIONS Final Report Prepared for Maricopa County Department of Transportation Prepared by TABLE OF CONTENTS Page EXECUTIVE SUMMARY ES-1
2015 Florida Main Street Annual Conference. Complete Streets Equal Stronger Main Streets
 WHAT ARE COMPLETE STREETS? CASE STUDIES COMPLETING YOUR MAIN STREET 2015 Florida Main Street Annual Conference St. Petersburg, Florida August 19, 2015 WHAT ARE COMPLETE STREETS? CASE STUDIES COMPLETING
Phase I-II of the Minnesota Highway Safety Manual Calibration. 1. Scope of Calibration
 TECHNICAL MEMORANDUM Phase I-II of the Minnesota Highway Safety Manual Calibration PREPARED FOR: PREPARED BY: Minnesota Department of Transportation Richard Storm, CH2M HILL Veronica Richfield, CH2M HILL
Simulation Analysis of Intersection Treatments for Cycle Tracks
 Abstract Simulation Analysis of Intersection Treatments for Cycle Tracks The increased use of cycle tracks also known as protected bike lanes has led to investigations of how to accommodate them at intersections.
Methodology. Reconnecting Milwaukee: A BikeAble Study of Opportunity, Equity and Connectivity
 Reconnecting Milwaukee: A BikeAble Study of Opportunity, Equity and Connectivity Released June 27, 2017 About BikeAble Rails-to-Trails Conservancy s (RTC s) BikeAble TM tool is a GIS-modeling platform
Appendix B: Forecasting and Traffic Operations Analysis Framework Document
 Existing Conditions Report - Appendix Appendix B: Forecasting and Traffic Operations Analysis Framework Document This document defines the methodology and assumptions that will be used in the traffic forecasting
METROPOLITAN TRANSPORTATION PLAN OUTREACH: INTERACTIVE MAP SUMMARY REPORT- 10/03/14
 METROPOLITAN TRANSPORTATION PLAN OUTREACH: INTERACTIVE MAP SUMMARY REPORT- 10/03/14 INTRODUCTION This document summarizes the results of the online interactive mapping exercise implemented by MIG for the
Bicycle Demand Forecasting for Bloomingdale Trail in Chicago
 Bicycle Demand Forecasting for Bloomingdale Trail in Chicago Corresponding Author: Zuxuan Deng Arup Water Street, New York, NY 000 zuxuan.deng@arup.com Phone:.. Fax:..0 Matthew Sheren Arup Water Street,
Agenda. Overview PRINCE GEORGE S PLAZA METRO AREA PEDESTRIAN PLAN
 PRINCE GEORGE S PLAZA METRO AREA PEDESTRIAN PLAN May 28, 2008 Agenda Welcome and introductions Project overview and issue identification Planning context and strengths Design challenges and initial recommendations
6.0 PEDESTRIAN AND BICYCLE FACILITIES 6.1 INTRODUCTION 6.2 BICYCLE DEMAND AND SUITABILITY Bicycle Demand
 6.0 PEDESTRIAN AND BICYCLE FACILITIES 6.1 INTRODUCTION Bicycle and pedestrian travel along and in the vicinity of the corridor is part of the vision of Somerset and Hunterdon counties and the integrated
SOUNDCAST CALIBRATION AND SENSITIVITY TEST RESULTS (DRAFT) TABLE OF CONTENTS. Puget Sound Regional Council. Suzanne Childress.
 TABLE OF CONTENTS. Puget Sound Regional Council. Suzanne Childress.") SOUNDCAST CALIBRATION AND SENSITIVITY TEST RESULTS (DRAFT) Puget Sound Regional Council Suzanne Childress June 2015 This document describes the activity-based model calibration to the 2010 using the following
SOUNDCAST CALIBRATION AND SENSITIVITY TEST RESULTS (DRAFT) Puget Sound Regional Council Suzanne Childress June 2015 This document describes the activity-based model calibration to the 2010 using the following
SANTA MONICA BOULEVARD CORRIDOR
 CIRCULATION ELEMENT WHITE PAPER NO. 3 SANTA MONICA BOULEVARD CORRIDOR INTRODUCTION From the 1930s to the beginning of Los Angeles freeway era, Santa Monica Boulevard, (previously Route 66, the Beverly
At each type of conflict location, the risk is affected by certain parameters:
 TN001 April 2016 The separated cycleway options tool (SCOT) was developed to partially address some of the gaps identified in Stage 1 of the Cycling Network Guidance project relating to separated cycleways.
Regional Bicycle Barriers Study
 Regional Bicycle Barriers Study Executive Summary Background and Purpose The 2040 Transportation Policy Plan (TPP) sets policies for planning and investment direction in the transportation system in the
CROSSING GUARD PLACEMENT CONSIDERATIONS AND GAP ASSESSMENT
 CROSSING GUARD PLACEMENT CONSIDERATIONS AND GAP ASSESSMENT Many factors contribute to the need for a Crossing Guard. General federal guidance, provided by the FHWA MUTCD, states that adult crossing guards
Rolling Out Measures of Non-Motorized Accessibility: What Can We Now Say? Kevin J. Krizek University of Colorado
 Rolling Out Measures of Non-Motorized Accessibility: What Can We Now Say? Kevin J. Krizek University of Colorado www.kevinjkrizek.org Acknowledgements Mike Iacono Ahmed El-Geneidy Chen-Fu Liao Outline
Driverless Vehicles Potential Influence on Bicyclist Facility Preferences
 Driverless Vehicles Potential Influence on Bicyclist Facility Preferences MICHAEL BLAU, MCRP, LCI O T E C O C T O B E R 2 6, 2 0 1 6 S E S S I O N # 8 2 - E V A L U AT I N G T H E P E R F O R M A N C E
Highway 111 Corridor Study
 Highway 111 Corridor Study June, 2009 LINCOLN CO. HWY 111 CORRIDOR STUDY Draft Study Tea, South Dakota Prepared for City of Tea Sioux Falls Metropolitan Planning Organization Prepared by HDR Engineering,
VTA s BART Silicon Valley
 VTA s BART Silicon Valley Phase II Extension Santa Clara Community Working Group June 11, 2015 Agenda Recap of CWG Process Follow up items VTA s BART Silicon Valley Program status Phase II recap Environmental
Complete Streets 101: The Basics
 Complete Streets 101: The Basics Michigan Municipal League - Capital Conference March 21, 2017 Chip Smith, AICP - Senior Planner - Wade Trim Inc. and City Council member City of Ann Arbor 2017 MML Capital
Proposed Action, Purpose and Need Technical Memorandum
 Proposed Action, Purpose and Need Technical Memorandum MoPac (State Loop 1) Intersections, Austin District From North of Slaughter Lane to South of La Crosse Avenue CSJ: 3136-01-015 Travis County, Texas
HENDERSON DEVELOPMENT 213, 217, 221, 221 ½, 223 HENDERSON AVENUE and 65 TEMPLETON STREET OTTAWA, ONTARIO TRANSPORTATION OVERVIEW.
 HENDERSON DEVELOPMENT 213, 217, 221, 221 ½, 223 HENDERSON AVENUE and 65 TEMPLETON STREET OTTAWA, ONTARIO TRANSPORTATION OVERVIEW Prepared for: 2294170 Ontario Inc. February 2, 2017 117-652 Report_1.doc
Kevin Manaugh Department of Geography McGill School of Environment
 Kevin Manaugh Department of Geography McGill School of Environment Outline Why do people use active modes? Physical (Built environment) Factors Psychological Factors Empirical Work Neighbourhood Walkability
METRO Light Rail: Changing Transit Markets in the Phoenix Metropolitan Area
 METRO Light Rail: Changing Transit Markets in the Phoenix Metropolitan Area Abhishek Dayal, AICP Planner III, METRO Light Rail Phoenix, AZ BACKGROUND Transit in the Phoenix Region Transit services in the
Plant City Walk-Bike Plan
 Plant City Walk-Bike Plan Plant City Commute Mode Share 2.2% 1.4% 2.9% Drove alone 10.2% Carpooled Public transportation (0.1%) Walked Used a Bike (0.4%) 82.9% Taxicab, motorcycle, or other means Worked
TRAFFIC IMPACT STUDY CRITERIA
 Chapter 6 - TRAFFIC IMPACT STUDY CRITERIA 6.1 GENERAL PROVISIONS 6.1.1. Purpose: The purpose of this document is to outline a standard format for preparing a traffic impact study in the City of Steamboat
Summary of NWA Trail Usage Report November 2, 2015
 Summary of NWA Trail Usage Report November 2, 2015 Summary Findings: The study showed that Northwest Arkansas (NWA) had relatively high cyclist user counts per capita aggregated across the top three usage
Rail Station Fact Sheet Downtown Carrollton Station
 Rail Station Fact Sheet Downtown Carrollton Station Station Overview Downtown Carrollton Station is located at East Belt Line Road and Broadway Street near the historic Downtown Carrollton Square. The
Standing Committee on Policy and Strategic Priorities. Mount Pleasant Industrial Area Parking Strategy and Access Improvements
 POLICY REPORT Report Date: April 23, 2018 Contact: Lon LaClaire Contact No.: 604.873.7722 RTS No.: 9944 VanRIMS No.: 08-2000-20 Meeting Date: May 16, 2018 TO: FROM: SUBJECT: Standing Committee on Policy
LETCHWORTH, WILLIAM E. Identification of Zones with High Pedestrian Activity Using GIS (under the direction of Dr. John R. Stone)
") ABSTRACT LETCHWORTH, WILLIAM E. Identification of Zones with High Pedestrian Activity Using GIS (under the direction of Dr. John R. Stone) The ability to forecast pedestrian trips is critical, but to date,
ABSTRACT LETCHWORTH, WILLIAM E. Identification of Zones with High Pedestrian Activity Using GIS (under the direction of Dr. John R. Stone) The ability to forecast pedestrian trips is critical, but to date,
About the Active Transportation Alliance
 About the Active Transportation Alliance Chicagoland s voice for better biking, walking and transit Founded 1985 7,000 members, ~33 full time staff Serve Chicago metro region 1 More Cars, More Driving
Pedestrian-Bicycle Emphasis Area Breakout Session. Highway Safety Summit April 26, 2016
 5/20/2016 Pedestrian-Bicycle Emphasis Area Breakout Session Highway Safety Summit April 26, 2016 Fatality and Serious Injury Averages (2008-2013) by Emphasis Area Where We ve Been: February 2014 Highway
Local Access Scores: Active Transportation Network Utility Scores
 Local Access Scores: Active Transportation Network Utility Scores Technical Documentation Timothy Reardon Eliza Wallace Colby Brown September 2016 Abstract Many public agencies across the country are eager
DANGEROUS BY DESIGN MARYLAND. Solving the Epidemic of Preventable Pedestrian Deaths (And Making Great Neighborhoods)
") DANGEROUS BY DESIGN 2011 MARYLAND Solving the Epidemic of Preventable Pedestrian Deaths (And Making Great Neighborhoods) DANGEROUS BY DESIGN 2011 Maryland T4AMERICA.ORG Between 2000 and 2009, 1,057 people
DANGEROUS BY DESIGN 2011 MARYLAND Solving the Epidemic of Preventable Pedestrian Deaths (And Making Great Neighborhoods) DANGEROUS BY DESIGN 2011 Maryland T4AMERICA.ORG Between 2000 and 2009, 1,057 people
REGIONAL SAFETY ADVISORY COMMITTEE North Central Texas Council of Governments Transportation Council Room Friday, October 26, :00 am AGENDA
 REGIONAL SAFETY ADVISORY COMMITTEE North Central Texas Council of Governments Transportation Council Room Friday, October 26, 2018 10:00 am AGENDA 1. Approval of August 24, 2018 Meeting Summary Matt Hotelling,
appendix b BLOS: Bicycle Level of Service B.1 Background B.2 Bicycle Level of Service Model Winston-Salem Urban Area
 appendix b BLOS: B.1 Background Winston-Salem Urban Area Bicycle Level of Service Level of Service (LOS) is a framework that transportation professionals use to describe existing conditions (or suitability)
Midtown Corridor Alternatives Analysis
 Midtown Corridor Alternatives Analysis Ridership Forecast Methodology and Results December 2013 Prepared by the SRF Consulting Group Team for Table of Contents Introduction... 1 Methodology... 1 Assumptions...
Land at Chesterton, Cirencester
 Land at Chesterton, Cirencester Transport Update 22 October 2014 By Mark Gimingham BA (Hons) BTP CMILT MCIHT, Partner, i-transport LLP Purpose To provide an update on progress with the development of the