Webinar: Development of a Pedestrian Demand Estimation Tool
|
|
|
- Juliet Hodge
- 5 years ago
- Views:
Transcription
1 Portland State University PDXScholar TREC Webinar Series Transportation Research and Education Center (TREC) Webinar: Development of a Pedestrian Demand Estimation Tool Kelly Clifton Portland State University, kclifton@pdx.edu Let us know how access to this document benefits you. Follow this and additional works at: Part of the Transportation Commons, Transportation Engineering Commons, and the Urban Studies Commons Recommended Citation Clifton, Kelly, "Webinar: Development of a Pedestrian Demand Estimation Tool" (2016). TREC Webinar Series This Book is brought to you for free and open access. It has been accepted for inclusion in TREC Webinar Series by an authorized administrator of PDXScholar. For more information, please contact pdxscholar@pdx.edu.
2 Development of a Pedestrian Demand Estimation Tool Framework and Methods Kelly J Clifton, PhD

3 Outline Background Project, methods, zones, & data Pedestrian index of the environment (PIE) I: Trip generation II: Walk mode split III: Pedestrian destination choice Conclusions & future work Adapted from: 2
4 BACKGROUND


5 Background Why model pedestrian travel? plan for pedestrian investments & non-motorized facilities mode shifts greenhouse gas emissions health & safety new data 4
6 Background How do travel models estimate walking? Among 48 large MPOs in US: 38% did not estimate walking 33% estimated non-motorized (walking + bicycling) travel 29% estimated walking Lacking pedestrian built environment measures & small spatial units Trip-based model sequence 1. Generation 2. Distribution 3. Mode choice 4. Assignment Source: Singleton, P. A., & Clifton, K. J. (2013). Pedestrians in regional travel demand forecasting models: State-of-the-practice. 5
7 Background What are some opportunities? Walking behavior data improved travel surveys, pedestrian count data collection Built environment data archived spatial datasets, GIS processing Travel demand models smaller zones, complete networks, computer power Walking behavior research more knowledge and studies 6
8 PROJECT, METHODS, ZONES & DATA


9 Project overview Partnered with Metro: metropolitan planning organization for Portland, OR Two research projects Improve representation of pedestrian environment in current 4-step method 8
10 Current 4-step method TAZ = transportation analysis zone Trip Generation (TAZ) Trip Distribution or Destination Choice (TAZ) Pedestrian Trips Mode Choice (TAZ) Trip Assignment All Trips Pedestrian Trips Vehicular Trips 9
11 New MoPeD method I Trip Generation (PAZ) TAZ = transportation analysis zone PAZ = pedestrian analysis zone Walk Mode Split (PAZ) Trip Distribution or Destination Choice (TAZ) III Destination Choice (PAZ) Mode Choice (TAZ) Pedestrian Trips Trip Assignment All Trips Pedestrian Trips Vehicular Trips 10

12 MoPeD Contributions Operates at a smaller spatial scale, more relevant to pedestrians (PAZ) Utilizes spatially fine-grained archived information on the built environment Incorporates knowledge of influences on pedestrian travel behavior Designed to work with regional travel demand model or as standalone tool 11


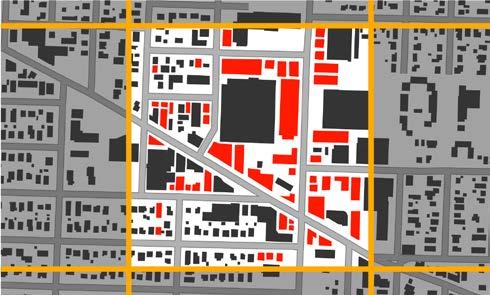
13 Pedestrian analysis zones 264 feet = 80 m 1 minute walk Metro: ~2,000 TAZs ~1.5 million PAZs TAZs PAZs Home-based work trip productions 12
14 Travel survey data Oregon Household Activity Survey (OHAS) Household-based survey One-day travel diary Portland region dataset (2011) 6,100 households 13,400 people 56,000 trips 4,500 walk trips 8% walk mode share 13
15 PEDESTRIAN INDEX OF THE ENVIRONMENT (PIE) 14
 20")
 People & job density")


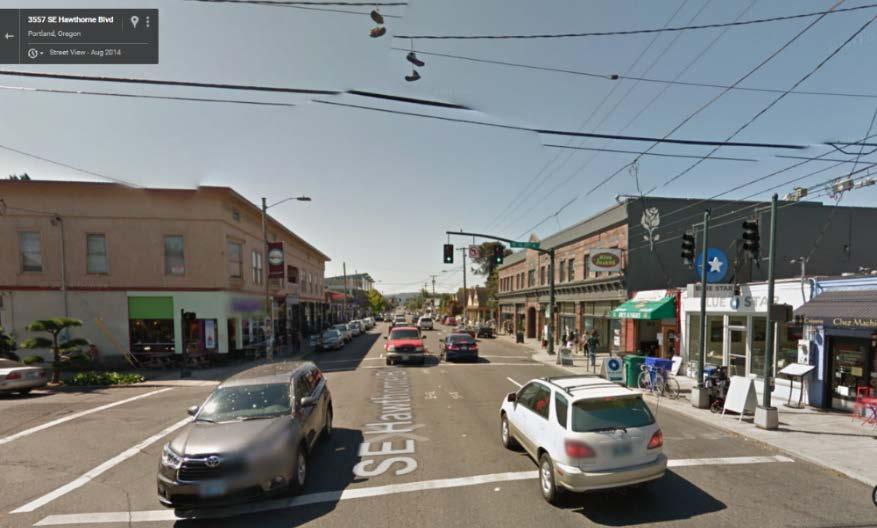
16 Pedestrian environment Pedestrian Index of the Environment (PIE) score = calibrated (6 dimensions) People & job density Transit access Urban living infrastructure Block size Sidewalk extent Comfortable facilities ULI = Urban Living Infrastructure: pedestrian-friendly shopping and service destinations used in daily life. 15

17


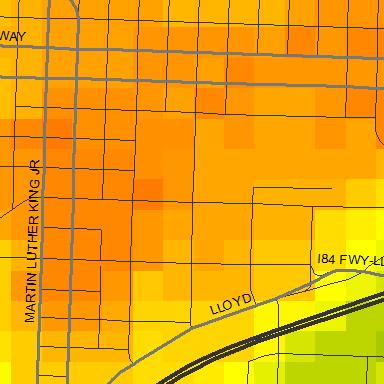

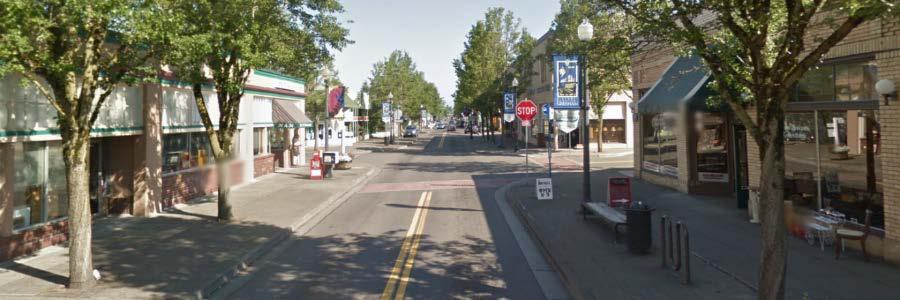
18 Visualizing PIE 100 Downtown core Downtown 80 Major neighborhood centers Lloyd District 17


19 Visualizing PIE 70 Suburban downtowns Gresham 60 Residential inner-city neighborhoods Laurelhurst 18


20 Visualizing PIE 50 Suburban shopping malls Clackamas Town Center 40 Suburban neighborhoods/subdivisions Aloha 19


21 Visualizing PIE 30 Isolated business and light industry N. Marine Drive 20 Rural, undeveloped, forested Forest Park 20
22 I. TRIP GENERATION 21
23 Trip Generation I Trip Generation (PAZ) TAZ = transportation analysis zone PAZ = pedestrian analysis zone Walk Mode Split (PAZ) Trip Distribution or Destination Choice (TAZ) III Destination Choice (PAZ) Mode Choice (TAZ) Pedestrian Trips Trip Assignment All Trips Pedestrian Trips Vehicular Trips 22
24 Trip Generation Metro currently has 8 trip production models applied to ~2,000 TAZs: HBW Home-based work; HBshop Home-based shopping; HBrec Home-based recreation; HBoth Home-based other (excludes school and college); NHBW Non-home-based work; NHBNW Non-home-based non-work; HBcoll Home-based college; and HBsch Home-based school. After testing for scalability, we applied the same models to our pedestrian scale ~1.5M PAZs 23
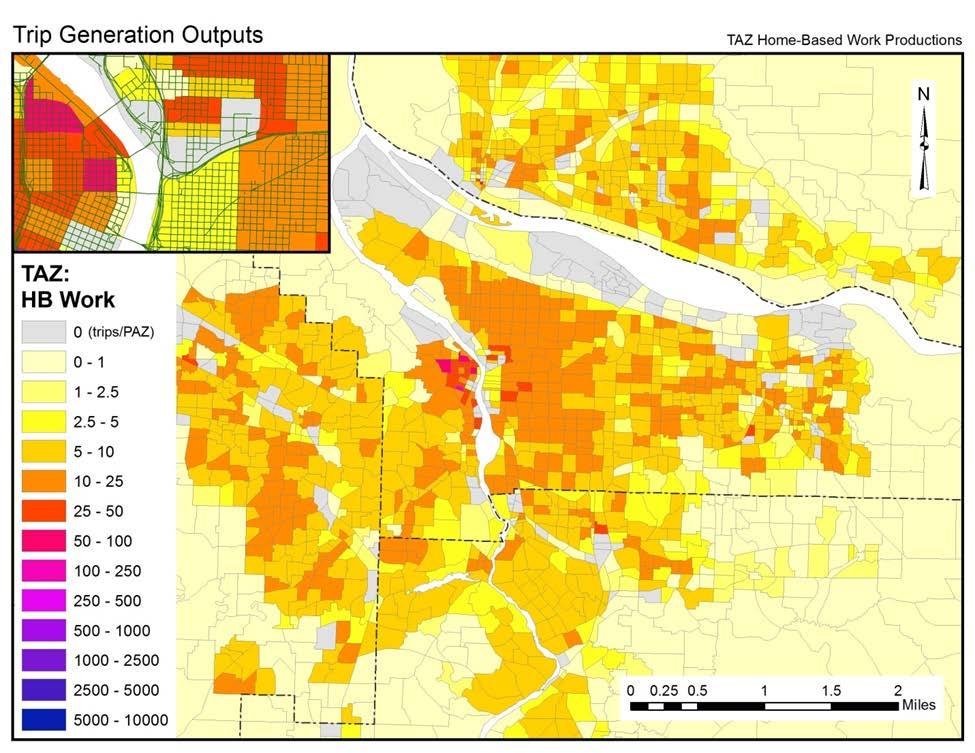

25 24
26 II. WALK MODE SPLIT 25
27 Walk mode split I Trip Generation (PAZ) TAZ = transportation analysis zone PAZ = pedestrian analysis zone Walk Mode Split (PAZ) Trip Distribution or Destination Choice (TAZ) III Destination Choice (PAZ) Mode Choice (TAZ) Pedestrian Trips Trip Assignment All Trips Pedestrian Trips Vehicular Trips 26
28 II Walk mode split Walk Mode Split (PAZ) Vehicular Trips Pedestrian Trips Prob(walk) = f(traveler characteristics, PIE) Data: Method: Spatial unit: 2011 OHAS, Production trip ends, 90% sample binary logit model pedestrian analysis zone (PAZ) 27

29 II Walk mode split models Traveler characteristics: Built environment: Household size, income, age, # of workers, # children, # vehicles PIE 28
30 II Walk model results Traveler characteristics: + positively related to walking negatively related to walking number of children in HH age of household head HH vehicle ownership Ped. Environment: odds of choosing to walk + 10 points PIE 43% increase (HBW) 54% increase (HBNW) 67% increase (NHB) Pseudo R (HBNW) (NHB) 29
31 Mode Split Validation 1. Apply the final model equations to trips in the validation sample (10% of data) and calculate the walk probability for each trip; 2. Average the probabilities to get the predicted walk mode share of trip ends (called sample enumeration) Model HBW HBO NHB Observed Walk Mode Share 2.9% 9.4% 6.7% Predicted Walk Mode Share 3.0% 9.5% 8.6% 30


32 Walk model application 31
33 Walk mode split I Trip Generation (PAZ) TAZ = transportation analysis zone PAZ = pedestrian analysis zone Walk Mode Split (PAZ) Trip Distribution or Destination Choice (TAZ) III Destination Choice (PAZ) Mode Choice (TAZ) Pedestrian Trips Trip Assignment All Trips Pedestrian Trips Vehicular Trips 32
34 III. DESTINATION CHOICE 33
35 Destination choice I Trip Generation (PAZ) TAZ = transportation analysis zone PAZ = pedestrian analysis zone Walk Mode Split (PAZ) Trip Distribution or Destination Choice (TAZ) III Destination Choice (PAZ) Mode Choice (TAZ) Pedestrian Trips Trip Assignment All Trips Pedestrian Trips Vehicular Trips 34
36 III Destination choice Prob(dest.) = function of Data: network distance size / # of destinations pedestrian environment traveler characteristics 2011 OHAS Destination Choice (PAZ) Pedestrian Trips Method: Spatial unit: multinomial logit model super-pedestrian analysis zone Six trip types: home-based: work (HBW), shopping (HBS), recreation (HBR), & other (HBO); non-home-based: work (NHBW) and non-work (NHBNW) 35

37 Destination choice 36

38 III Destination Choice superpaz: a grid of 5 5 = 25 PAZs Choice set generation: Random sample of 10 superpazs within 3 miles 99% of OHAS walk trips < 3 miles (4.8 km) 37
39 III Destination Choice Key variables Impedance Size network distance btw. zones Additional variables employment by category, households Pedestrian supports PIE, parks Pedestrian barriers slope, freeway, industrial LUs Traveler attributes auto own., children 38
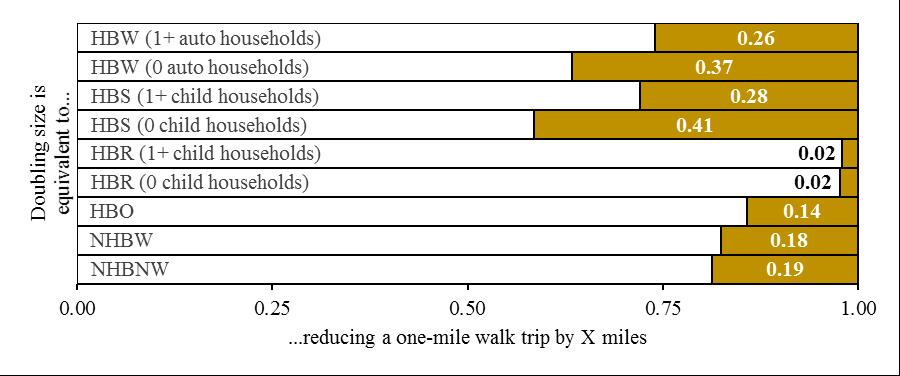
40 III Destination Choice Impedance Size + 1 mile of distance by auto own.: by children: by children: 2 # destinations minimum: maximum: odds of walking to destination 76 86% decrease (*) -62% (no), -74% (yes) (HBW) -78% (no), -83% (yes) (HBR) -78% (no), -90% (yes) (HBS) * Except for HBW, HBR, and HBS. odds of walking to destination 28 42% increase ( ) 4% increase (HBR) 88% increase (HBS) Except for HBR and HBS. 39
41 III Destination Choice Ped. supports odds of walking to destination + 10 points PIE: 16 34% increase (*) presence of park: 58% increase (HBR) Ped. Barriers * Except for HBS and HBR. odds of walking to destination + 1 mean slope: 14 35% decrease (2,3,4) presence of freeway: 64% decrease (2) + 1% industrial jobs: 33 82% decrease (1,2,3,4) 1 HBW, 2 HBS, 3 HBO, 4 NHBW. Pseudo R (HBR) (HBS) 40

42 III Destination Choice 41

43 III Destination Choice PIE = 75 PIE = 85 42

44 Destination choice Model Validation % Correct Destination 43

45 Destination Choice Model Validation Avg. Distance Walked 44

46 Destination Choice 45
47 CONCLUSIONS & FUTURE WORK 46

48 Conclusions Nests within current model but can be used alone Pedestrian scale analysis (PAZs) Pedestrian-relevant variables (PIE) One of the first studies to examine pedestrian destination choice in modeling framework Highlights policy relevant variables: distance, size, pedestrian supports & barriers 47
/regions Examine relationships in other contexts Assess PIE s transferability Provide agency guidance for")
49 Future work Before application: Relate PIE more explicitly to policy changes Forecasting inputs Test method in other area(s)/regions Examine relationships in other contexts Assess PIE s transferability Provide agency guidance for implementation 48

50 Future work Research & Model Improvements: Trip Generation Multinomial Logit model Destination Choice Allocate from superpaz to PAZ level Explore non-linear effects & other interactions Route choices or potential pathways Need fundamental research to improve understanding 49

51 Questions? Project info & reports: Kelly J. Clifton, PhD Patrick A. Singleton Christopher Muhs Robert Schneider, PhD Portland State University DKS & Associates Univ. Wisconsin Milwaukee 50
A Framework For Integrating Pedestrians into Travel Demand Models
 A Framework For Integrating Pedestrians into Travel Demand Models Kelly J. Clifton Intersections Seminar University of Toronto September 22, 2017 Portland, Oregon, USA Region Population~ 2.4 M Urban Growth
Development of a Pedestrian Demand Estimation Tool
 Portland State University PDXScholar Civil and Environmental Engineering Faculty Publications and Presentations Civil and Environmental Engineering 9-2015 Development of a Pedestrian Demand Estimation
Pedestrian Demand Modeling: Evaluating Pedestrian Risk Exposures
 Pedestrian Demand Modeling: Evaluating Pedestrian Risk Exposures Kelly J. Clifton National Center for Smart Growth University of Maryland May 19, 2008 Study Team University of Maryland National Center
Rerouting Mode Choice Models: How Including Realistic Route Options Can Help Us Understand Decisions to Walk or Bike
 Portland State University PDXScholar TREC Friday Seminar Series Transportation Research and Education Center (TREC) 4-1-2016 Rerouting Mode Choice Models: How Including Realistic Route Options Can Help
Memorandum. Drive alone
 Memorandum To: Cc: From: Kimberly Kerr, Assistant Chief Administrative Officer Natalie Porter, PE, TE Shawna Purvines Claudia Wade, PE Michael Schmitt, AICP CTP, PTP Re: Technical Memorandum #2: Model
TRANSPORTATION RESEARCH CENTER
 The 2009 NHTS Vermont Uses of the Add-On Data for ing and Research in Vermont James Sullivan, M.S., P.E. Research Analyst TRANSPORTATION RESEARCH CENTER Research Sponsors Research Collaborators Brian Lee,
Incorporating Health in Regional Transportation Planning
 Mayor Karl Dean, Chairman Incorporating Health in Regional Transportation Planning Leslie A. Meehan, AICP Center TRT Intervention Webinar January 29, 2013 Objectives for Today Background About the Nashville
Bike Planner Overview
 Bike Planner Overview A Web-based Sketch Planning Tool for Los Angeles County presented by William E. Walter, GISP April 12, 2017 GIS-T Transportation leadership you can trust. Bike Planner Overview Guiding
Incorporating Health in Regional Transportation Planning
 Mayor Karl Dean, Chairman Incorporating Health in Regional Transportation Planning Leslie A. Meehan, AICP Center TRT Intervention Webinar January 29, 2013 Objectives for Today Background About the Nashville
2010 Pedestrian and Bicyclist Special Districts Study Update
 2010 Pedestrian and Bicyclist Special Districts Study Update Pedestrian and Bicyclist Special Districts Program Overview H-GAC s Special Districts Program aims to provide strategic investments in pedestrian
ADOT Statewide Bicycle and Pedestrian Program Summary of Phase IV Activities APPENDIX B PEDESTRIAN DEMAND INDEX
 ADOT Statewide Bicycle and Pedestrian Program Summary of Activities APPENDIX B PEDESTRIAN DEMAND INDEX May 24, 2009 Pedestrian Demand Index for State Highway Facilities Revised: May 29, 2007 Introduction
Roadway Bicycle Compatibility, Livability, and Environmental Justice Performance Measures
 Roadway Bicycle Compatibility, Livability, and Environmental Justice Performance Measures Conference on Performance Measures for Transportation and Livable Communities September 7-8, 2011, Austin, Texas
WALKNBIKE DRAFT PLAN NASHVILLE, TENNESSEE EXECUTIVE SUMMARY NASHVILLE, TENNESSEE
 NASHVILLE, TENNESSEE EXECUTIVE SUMMARY Executive Summary A world-class multi-modal transportation system is essential to a vibrant city and better quality of life. -Mayor Barry The WalknBike plan aims
San Mateo County Comprehensive Bicycle and Pedestrian Plan Open House
 San Mateo County Comprehensive Bicycle and Pedestrian Plan Open House October 28, 2010 Presented to San Mateo County residents and interested parties by Lauren Ledbetter, Alta Planning + Design Matt Haynes,
Delta Planning Workshop Team
 Portland State University PDXScholar TREC Friday Seminar Series Transportation Research and Education Center (TREC) 5-27-2016 Delta Planning Workshop Team Curtis Fisher Portland State University Let us
Urban planners have invested a lot of energy in the idea of transit-oriented
 DOES TRANSIT-ORIENTED DEVELOPMENT NEED THE TRANSIT? D A N I E L G. C H AT M A N Urban planners have invested a lot of energy in the idea of transit-oriented developments (TODs). Developing dense housing
Determining bicycle infrastructure preferences A case study of Dublin
 *Manuscript Click here to view linked References 1 Determining bicycle infrastructure preferences A case study of Dublin Brian Caulfield 1, Elaine Brick 2, Orla Thérèse McCarthy 1 1 Department of Civil,
Bike/Multipurpose Trail Study for Glynn County, Georgia MAY 16, 2016
 Bike/Multipurpose Trail Study for Glynn County, Georgia MAY 16, 2016 Agenda» Project Status Update» Draft Recommendations Overview» Next Steps» Questions/Discussion Project Overview» Comprehensive Bikeway
Impact of Bike Facilities on Residential Property Prices
 Portland State University PDXScholar TREC Friday Seminar Series Transportation Research and Education Center (TREC) 2-24-2017 Impact of Bike Facilities on Residential Property Prices Wei Shi Portland State
APPENDIX E BIKEWAY PRIORITIZATION METHODOLOGY
 APPENDIX E BIKEWAY PRIORITIZATION METHODOLOGY INTRODUCTION The network of bikeways recommended in the Bicycle Master Plan is extensive and is likely to be only partially completed during the 25-year life
Corpus Christi Metropolitan Transportation Plan Fiscal Year Introduction:
 Introduction: The Safe, Accountable, Flexible, Efficient Transportation Equity Act: A Legacy for Users (SAFETEA-LU) has continued the efforts started through the Intermodal Surface Transportation Efficiency
Pocatello Regional Transit Master Transit Plan Draft Recommendations
 Pocatello Regional Transit Master Transit Plan Draft Recommendations Presentation Outline 1. 2. 3. 4. What is the Master Transit Plan? An overview of the study Where Are We Today? Key take-aways from existing
Where do People Bicycle? The Role of Infrastructure in Determining Bicycle Behavior
 Portland State University PDXScholar Urban Studies and Planning Faculty Publications and Presentations Nohad A. Toulan School of Urban Studies and Planning 4-11-2008 Where do People Bicycle? The Role of
City of Davenport CitiBus Public Transportation Study. April 2015
 City of Davenport CitiBus Public Transportation Study April 2015 Overview Project Background Key Findings CitiBus Service Allocation Policy Discussion 2 Project Background 3 About CitiBus Operates 17 routes
WELCOME. City of Greater Sudbury. Transportation Demand Management Plan
 WELCOME City of Greater Sudbury Transportation Demand Management Plan Public Consultation Session St. Andrew s Place, Activity Hall 111 Larch Street Wednesday September 13, 2017 6:00 to 8:00 pm Welcome
How Policy Drives Mode Choice in Children s Transportation to School
 How Policy Drives Mode Choice in Children s Transportation to School Physical Activity through Active Transportation Ruth L. Steiner 2011 Technical Conference and Exhibit Lake Buena Vista, FL April 3-6,
A New Approach in the GIS Bikeshed Analysis Considering of Topography, Street Connectivity, and Energy Consumption
 A New Approach in the GIS Bikeshed Analysis Considering of Topography, Street Connectivity, and Energy Consumption ACSP Conference, Cincinnati, OH November 1, 2012 Hiroyuki Iseki, Ph.D. & Matthew Tingstrom
Guidelines for Providing Access to Public Transportation Stations APPENDIX C TRANSIT STATION ACCESS PLANNING TOOL INSTRUCTIONS
 APPENDIX C TRANSIT STATION ACCESS PLANNING TOOL INSTRUCTIONS Transit Station Access Planning Tool Instructions Page C-1 Revised Final Report September 2011 TRANSIT STATION ACCESS PLANNING TOOL INSTRUCTIONS
Travel Behavior of Baby Boomers in Suburban Age Restricted Communities
 Travel Behavior of Baby Boomers in Suburban Age Restricted Communities TRB Conference Impact of Changing Demographics on the Transportation System 27 October 2008 P. Christopher Zegras Frank Hebbert Eran
The Transit Last-Mile Problem
 The Transit Last-Mile Problem Thus far, we have treated the travel time thresholds as if they were the same in all environments. However, the experience of a short walk to or from a transit stop can be
Active Travel and Exposure to Air Pollution: Implications for Transportation and Land Use Planning
 Active Travel and Exposure to Air Pollution: Implications for Transportation and Land Use Planning Steve Hankey School of Public and International Affairs, Virginia Tech, 140 Otey Street, Blacksburg, VA
Thresholds and Impacts of Walkable Distance for Active School Transportation in Different Contexts
 Thresholds and Impacts of Walkable Distance for Active School Transportation in Different Contexts Xuemei Zhu, Chanam Lee, Zhipeng Lu, Chia-Yuan Yu College of Architecture, Texas A&M University CONTENT
METRO Light Rail: Changing Transit Markets in the Phoenix Metropolitan Area
 METRO Light Rail: Changing Transit Markets in the Phoenix Metropolitan Area Abhishek Dayal, AICP Planner III, METRO Light Rail Phoenix, AZ BACKGROUND Transit in the Phoenix Region Transit services in the
GIS Based Data Collection / Network Planning On a City Scale. Healthy Communities Active Transportation Workshop, Cleveland, Ohio May 10, 2011
 The Purpose of GIS Based Network Planning GIS Based Data Collection / Network Planning Healthy Communities Active Transportation Conference Tuesday, May 10, 2011 10:00 AM Norman Cox, LLA, ASLA. Ann Arbor,
Kelowna On the Move. Pedestrian and Bicycle Master Plan
 Kelowna On the Move Pedestrian and Bicycle Master Plan Executive Summary April 2016 Purpose of the Plan The Pedestrian and Bicycle Master Plan identifies infrastructure, planning, and policy requirements
Living Streets Policy
 Living Streets Policy Introduction Living streets balance the needs of motorists, bicyclists, pedestrians and transit riders in ways that promote safety and convenience, enhance community identity, create
5. Pedestrian System. Accomplishments Over the Past Five Years
 5. Pedestrian System Accomplishments Over the Past Five Years The Alamo Area Metropolitan Planning Organization (MPO) and its partner agencies recognize the importance of improving pedestrian mobility.
Webinar: The Association Between Light Rail Transit, Streetcars and Bus Rapid Transit on Jobs, People and Rents
 Portland State University PDXScholar TREC Webinar Series Transportation Research and Education Center (TREC) 11-15-2016 Webinar: The Association Between Light Rail Transit, Streetcars and Bus Rapid Transit
Motorized Transportation Trips, Employer Sponsored Transit Program and Physical Activity
 Motorized Transportation Trips, Employer Sponsored Transit Program and Physical Activity Ugo Lachapelle Msc. Lawrence D. Frank, PhD Active Living Research Washington, DC April 12, 2008 Outline Background:
Eric Sundquist Managing Director State Smart Transportation Initiative (SSTI) Urban Sustainability Accelerator
 Urban Sustainability Accelerator") New tools for making better transportation system decisions Eric Sundquist Managing Director State Smart Transportation Initiative (SSTI) Urban Sustainability Accelerator Accessibility and trip-making
New tools for making better transportation system decisions Eric Sundquist Managing Director State Smart Transportation Initiative (SSTI) Urban Sustainability Accelerator Accessibility and trip-making
Connecting Sacramento: A Trip-Making and Accessibility Study
 Connecting Sacramento: A Trip-Making and Accessibility Study Study Overview and Highlights July 2017 Purpose of this study Local governments and transportation agencies often make challenging decisions
Goodlettsville Bicycle and Pedestrian Plan Executive Summary
 Goodlettsville Bicycle and Pedestrian Plan July 2010 In Cooperation with the Nashville Area Metropolitan Planning Executive Organization Summary Introduction Progressive and forward thinking communities
Presentation Summary Why Use GIS for Ped Planning? What Tools are Most Useful? How Can They be Applied? Pedestrian GIS Tools What are they good for?
 1 2 Pedestrian GIS Tools What are they good for? Pro Walk / Pro Bike 2006 Presentation Summary Why Use GIS for Ped Planning? What Tools are Most Useful? How Can They be Applied? Matt Haynes Fehr & Peers
Bicycle Master Plan Goals, Strategies, and Policies
 Bicycle Master Plan Goals, Strategies, and Policies Mobilizing 5 This chapter outlines the overarching goals, action statements, and action items Long Beach will take in order to achieve its vision of
Designing a Bicycle and Pedestrian Count Program in Blacksburg, VA
 Designing a Bicycle and Pedestrian Count Program in Blacksburg, VA Steve Hankey (Virginia Tech) Andrew Mondschein (U or Virginia) Ralph Buehler (Virginia Tech) Issue/objective Issue No systematic traffic
Stress Bikeway Network
 Building Portland s Low- Stress Bikeway Network Photo credit: Michael Anderson Bikeportland.org Designing Streets 2015 Austin, TX October 29 2015 Roger Geller Portland Background Existing low- and lower-stress
TR NEWS. Public Health and Transportation. Innovation, Intervention, and Improvements NUMBER 299 SEPTEMBER OCTOBER 2015
 TR NEWS NUMBER 299 SEPTEMBER OCTOBER 2015 Public Health and Transportation Innovation, Intervention, and Improvements Public Health and Transportation Measuring the Health Benefits of Walking and Bicycling
Frequently asked questions about how the Transport Walkability Index was calculated are answered below.
 Transport Walkability Index The Transport Walkability Index is a relative indicator of how well the built environment in different areas supports walking for transport. The index is frequently used in
LONG-RANGE TRANSPORTATION MODELING IN THE BRISTOL URBANIZED AREA March 2008
 LONG-RANGE TRANSPORTATION MODELING IN THE BRISTOL URBANIZED AREA March 2008 Good planning is essential to the transportation process Bristol Metropolitan Planning Organization - Smallest urbanized area
Bikeway action plan. Bicycle Friendly Community Workshop March 5, 2007 Rochester, MN
 Bikeway action plan Summary The was held on March 5, 2007 at the Rochester Mayo Civic Center. The workshop was hosted by Rochester-Olmsted County Planning Department in collaboration with the League of
Preliminary Transportation Analysis
 Preliminary Transportation Analysis Goals of a Robust, Multimodal Transportation Network Safe Accessible/Connected Efficient Comfortable Context-Sensitive Motor Vehicle: Continue to analyze the data to
Building Community Partnerships for Mobility:
 Building Community Partnerships for Mobility: San Francisco 2008 Presented by: Cynthia Hoyle, AICP Transportation Planning Consultant Champaign-Urbana Mass Transit District Background The Heartland Champaign-Urbana,
El Paso to Las Cruces Proposed Rail Service Estimated Ridership and Proposed Schedule
 to Las Cruces Proposed Rail Service Estimated Ridership and Proposed Schedule Ridership estimation is a central consideration when assessing the feasibility of a proposed transit line. A sketch model is
DaySim Standard Technical Documentation
 DaySim Standard Technical Documentation Introduction DaySim Standard 1 is a travel demand microsimulation software package that works in conjunction with any of a number of traffic and transit assignment
Planning Guidance in the 2012 AASHTO Bike Guide
 Planning Guidance in the 2012 AASHTO Bike Guide Presentation by: RJ Eldridge Peter Lagerwey August 22, 2012 WEBINAR 2: PLANNING GUIDANCE IN THE 2012 AASHTO BIKE GUIDE Today s Webinar Significant Updates
Rolling Out Measures of Non-Motorized Accessibility: What Can We Now Say? Kevin J. Krizek University of Colorado
 Rolling Out Measures of Non-Motorized Accessibility: What Can We Now Say? Kevin J. Krizek University of Colorado www.kevinjkrizek.org Acknowledgements Mike Iacono Ahmed El-Geneidy Chen-Fu Liao Outline
Active Transportation on the Rise
 Integrated Approaches to Shared-Use Paths Doug Sarkkinen, PE Windi Shapley, PE Mandi Roberts, AICP, PLA Why? Biking and walking are important active transportation options. Shared-use paths are critical
Webinar: Exploring Pedestrian Responsive Traffic Signal Timing Strategies in Urban Areas
 Portland State University PDXScholar TREC Webinar Series Transportation Research and Education Center (TREC) 1-29-2015 Webinar: Exploring Pedestrian Responsive Traffic Signal Timing Strategies in Urban
Understanding Travel Modes to Non-work Destinations: Analysis of an Establishment Survey in Portland, Oregon
 Portland State University PDXScholar Dissertations and Theses Dissertations and Theses Spring 6-21-2013 Understanding Travel Modes to Non-work Destinations: Analysis of an Establishment Survey in Portland,
GIS Based Non-Motorized Transportation Planning APA Ohio Statewide Planning Conference. GIS Assisted Non-Motorized Transportation Planning
 The Purpose of GIS Assisted Network GIS Assisted Non-Motorized Transportation 2011 APA Ohio Statewide Conference Friday, 10:45 AM to Noon Focus on near-term projects wwwgreenwaycollabcom The purpose of
Travel Characteristics on Weekends:
 Travel Characteristics on Weekends: Implications for Planning and Policy Making Ram M. Pendyala Department of Civil and Environmental Engineering University of South Florida, Tampa Ashish Agarwal Cambridge
Annual Metro Regional Trail Count and Why Local Extrapolation Factors Matter
 Portland State University PDXScholar TREC Friday Seminar Series Transportation Research and Education Center (TREC) 5-26-2017 Annual Metro Regional Trail Count and Why Local Extrapolation Factors Matter
RIDERSHIP PREDICTION
 RIDERSHIP PREDICTION Outline 1. Introduction: route ridership prediction needs and issues. 2. Alternative approaches to route ridership prediction. Professional judgement Survey-based methods Cross-sectional
Towards Effective Design Treatment for Right Turns at Intersections with Bicycle Traffic
 Portland State University PDXScholar TREC Friday Seminar Series Transportation Research and Education Center (TREC) 2-5-2016 Towards Effective Design Treatment for Right Turns at Intersections with Bicycle
PRINCE GEORGE S PLAZA METRO AREA PEDESTRIAN PLAN
 PRINCE GEORGE S PLAZA METRO AREA PEDESTRIAN PLAN May 28, 2008 Agenda Welcome and introductions Project overview and issue identification Planning context and strengths Design challenges and initial recommendations
1999 On-Board Sacramento Regional Transit District Survey
 SACOG-00-009 1999 On-Board Sacramento Regional Transit District Survey June 2000 Sacramento Area Council of Governments 1999 On-Board Sacramento Regional Transit District Survey June 2000 Table of Contents
ACTIVE TRANSPORTATION
 ACTIVE TRANSPORTATION Mobility 2040 Supported Goals Improve the availability of transportation options for people and goods. Support travel efficiency measures and system enhancements targeted at congestion
Community Transportation Plan Acknowledgements
 Community Transportation Plan Acknowledgements The Decatur CTP was developed with participation and guidance from City of Decatur staff, its Resident Boards and Commissions, and numerous residents, business
WHITE PAPER: TRANSIT SERVICE FOR SOUTH SHAGANAPPI
 9/27/2012 TRANSIT PLANNING WHITE PAPER: TRANSIT SERVICE FOR SOUTH SHAGANAPPI 2012 Calgary Transit 1 Table of Contents Purpose... 3 Area of Change... 3 Background... 3 Access to destinations... 5 Connecting
Traffic Safety Barriers to Walking and Bicycling Analysis of CA Add-On Responses to the 2009 NHTS
 Traffic Safety Barriers to Walking and Bicycling Analysis of CA Add-On Responses to the 2009 NHTS NHTS Users Conference June 2011 Robert Schneider, Swati Pande, & John Bigham, University of California
2011 Origin-Destination Survey Bicycle Profile
 TRANS Committee 2011 Origin-Destination Survey National Capital Region December 2012 TRANS Committee Members: City of Ottawa, including OC Transpo Ville de Gatineau Société de transport de l Outaouais
SOUTH JERSEY TRANSPORTATION PLANNING ORGANIZATION
 SOUTH JERSEY TRANSPORTATION PLANNING ORGANIZATION Model Validation Analysis January 16, 2013 Acknowledgements The preparation of this report has been financed in part by the U.S. Department of Transportation,
Bike Share Social Equity and Inclusion Target Neighborhoods
 Bike Share Social Equity and Inclusion Target Neighborhoods Target Neighborhoods West End/Visitation Park/Academy/Hamilton Heights Wellsgoodfellow/Kingsway West The Ville/Greater Ville Kingsway East/Fountain
AMATS Complete Streets Policy
 AMATS Complete Streets Policy Table of Contents: Section 1. Definition of Complete Streets Section 2. Principles of Complete Streets Section 3. Complete Streets Policy Section 4. Consistency Section 5.
Rochester Area Bike Sharing Program Study
 roc bike share Rochester Area Bike Sharing Program Study Executive Summary ~ January 2015 JANUARY 2015 8484 Georgia Avenue, Suite 800 Silver Spring, MD 20910 3495 Winton Pl., Bldg E, Suite 110 Rochester,
 Time of Change We Are Growing We Are An Attractive Place To Live We Are Age Diverse + Living Longer 50000 40000 30000 20000 10000 0 2010 Census Job Density Housing Sheds Transit Sheds The Project FUNDING
Gordon Proctor Director Policy on Accommodating Bicycle and Pedestrian Travel on ODOT Owned or Maintained Facilities
 Approved: Policy: 20-004(P) Responsible Office: Planning Gordon Proctor Director Policy on Accommodating Bicycle and Pedestrian Travel on ODOT Owned or Maintained Facilities I. POLICY STATEMENT: This policy
Plant City Walk-Bike Plan
 Plant City Walk-Bike Plan Plant City Commute Mode Share 2.2% 1.4% 2.9% Drove alone 10.2% Carpooled Public transportation (0.1%) Walked Used a Bike (0.4%) 82.9% Taxicab, motorcycle, or other means Worked
DRAFT for a State Policy for Healthy Spaces and Places
 DRAFT for a State Policy for Healthy Spaces and Places 1 DRAFT State Policy for Healthy spaces and Places 1. Purpose To encourage the use and development of land that builds healthy communities through
PEDESTRIAN ACTION PLAN
 ATTACHMENT 2 CITY OF SANTA MONICA PEDESTRIAN ACTION PLAN CITY OF SANTA MONICA PEDESTRIAN ACTION PLAN This page intentionally left blank EXECUTIVE SUMMARY CHAPTER 1 EXECUTIVE SUMMARY Setting the Stage
Perryville TOD and Greenway Plan
 Perryville TOD and Greenway Plan Greenway Glossary Pathway: A bicycle and pedestrian path separated from motorized vehicular traffic by an open space, barrier or curb. Multi-use paths may be within the
2. Transportation in Ottawa Today and Tomorrow
 2. Transportation in Ottawa Today and Tomorrow 2.1 Transportation System Overview The City. The City of Ottawa is the largest municipality in the National Capital Region (NCR). Urban development covers
o n - m o t o r i z e d transportation is an overlooked element that can greatly enhance the overall quality of life for the community s residents.
 N o n - m o t o r i z e d transportation is an overlooked element that can greatly enhance the overall quality of life for the community s residents. 84 Transportation CHAPTER 11 INTRODUCTION Transportation
TRANSIT & NON-MOTORIZED PLAN DRAFT FINAL REPORT Butte County Association of Governments
 1 INTRODUCTION Maintaining a high quality of life is the essence of this plan for transit and non-motorized transportation in Butte County. Curbing greenhouse gas emissions (GHG) by reducing congestion,
The Case for New Trends in Travel
 The Case for New Trends in Travel The Future of Cities and Travel Steven E. Polzin, PhD. Center for urban Transportation Research University of South Florida October 19, 2008 Successful Strategies from
APPROVE A RESOLUTION ADOPTING A COMPLETE STREETS POLICY
 STAFF REPORT MEETING DATE: September 13, 2016 TO: FROM: City Council Bob Brown, Community Development Director Russ Thompson, Public Works Director Patrick Filipelli, Management Analyst 922 Machin Avenue
Built Environment and Older Adults: Supporting Smooth Transitions Across the Life- Span. Dr. Lawrence Frank, Professor and Bombardier UBC
 Built Environment and Older Adults: Supporting Smooth Transitions Across the Life- Span Dr. Lawrence Frank, Professor and Bombardier Chair @ UBC The Hidden Health Costs of Transportation - Frank et al
Chapter 2 Current and Future Conditions
 Chapter 2 Current and Future Conditions 2.1 An Overview of Ottawa s Transportation System The City of Ottawa is home to about 870,700 people. The city covers an area of 2,760 square kilometres of which
Using GIS and CTPP Data for Transit Ridership Forecasting in Central Florida
 Using GIS and CTPP Data for Transit Ridership Forecasting in Central Florida Xiaobo Liu, Jeffery Stiles Jacobs Engineering Group Mei Chen University of Kentucky For GIS in Transit Conference, 2009 St.
Network Preamble: CNU Statement of Principles on Transportation Networks
 Network Preamble: CNU Statement of Principles on Transportation Networks Cities and their surrounding regions are the social, cultural, and economic drivers of human civilization. Of especial importance
Physical Implications of Complete Streets Policies
 Presentation Overview Physical Implications of Complete Norm Cox, ASLA, LLA Landscape Architect Ann Arbor, Michigan, 10:45 to Noon What Are Complete Streets? What Matters to Bicyclists and Pedestrians
Webinar: A Comprehensive Evaluation of Protected Cycling Facilities: Lessons from Five Cities
 Portland State University PDXScholar TREC Webinar Series Transportation Research and Education Center (TREC) 3-19-2015 Webinar: A Comprehensive Evaluation of Protected Cycling Facilities: Lessons from
BUILDING THE CASE FOR TRAVEL OPTIONS IN WASHING TON COUNTY. Image: Steve Morgan. Image: Steve Morgan
 BUILDING THE CASE FOR TRAVEL OPTIONS IN WASHING TON COUNTY Image: Steve Morgan Image: Steve Morgan Image: TriMet Image: TriMet WHAT ARE TRAVEL OPTIONS PROGRAMS? Travel options programs encourage residents,
Exhibit 1 PLANNING COMMISSION AGENDA ITEM
 Exhibit 1 PLANNING COMMISSION AGENDA ITEM Project Name: Grand Junction Circulation Plan Grand Junction Complete Streets Policy Applicant: City of Grand Junction Representative: David Thornton Address:
Kevin Manaugh Department of Geography McGill School of Environment
 Kevin Manaugh Department of Geography McGill School of Environment Outline Why do people use active modes? Physical (Built environment) Factors Psychological Factors Empirical Work Neighbourhood Walkability
2015 Florida Main Street Annual Conference. Complete Streets Equal Stronger Main Streets
 WHAT ARE COMPLETE STREETS? CASE STUDIES COMPLETING YOUR MAIN STREET 2015 Florida Main Street Annual Conference St. Petersburg, Florida August 19, 2015 WHAT ARE COMPLETE STREETS? CASE STUDIES COMPLETING
Characteristics from these programs were used to compare to and evaluate existing conditions in Howard County.
 EXECUTIVE SUMMARY Bike share is a mobility option that allows users to access a fleet of public bicycles throughout a community. Bike share systems have successfully been implemented in communities throughout
METROPOLITAN TRANSPORTATION PLAN OUTREACH: INTERACTIVE MAP SUMMARY REPORT- 10/03/14
 METROPOLITAN TRANSPORTATION PLAN OUTREACH: INTERACTIVE MAP SUMMARY REPORT- 10/03/14 INTRODUCTION This document summarizes the results of the online interactive mapping exercise implemented by MIG for the
Travel Demand Methodology and Results Report
 URS DIN 01623 Travel Demand Methodology and Results Report Durham-Orange Light Rail Transit Project July 24, 2015 K.2-1 The NEPA Preferred Alternative for the D-O LRT Project would generally follow NC
Acknowledgements. Ms. Linda Banister Ms. Tracy With Mr. Hassan Shaheen Mr. Scott Johnston
 Acknowledgements The 2005 Household Travel Survey was funded by the City of Edmonton and Alberta Infrastructure and Transportation (AIT). The survey was led by a steering committee comprised of: Dr. Alan