A Framework For Integrating Pedestrians into Travel Demand Models
|
|
|
- Ethan Fitzgerald
- 5 years ago
- Views:
Transcription

1 A Framework For Integrating Pedestrians into Travel Demand Models Kelly J. Clifton Intersections Seminar University of Toronto September 22, 2017


2 Portland, Oregon, USA Region Population~ 2.4 M Urban Growth Boundary Only elected regional government in US City 25 th largest in US Population ~ 640k Area ~ 376 km 2 Density ~ 1,689/km 2 2

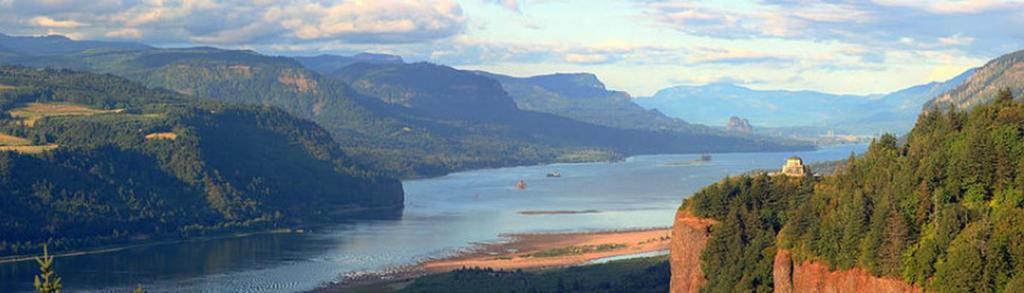

3 Portland, Oregon 3

4 My Research Group Travel behavior & built environment Residential Location Active travel Planning applications & modelling tools Behavioral theory Equity Assessing transport impacts of new development Data collection methods 4

5 Outline A Framework For Integrating Pedestrians into Travel Demand Models Policy & planning context Experiences in modeling pedestrians MoPeD Model of Pedestrian Demand What is on the horizon? Behavioral research Data & models Next steps 5

6 POLICY & PLANNING CONTEXT 6
 Minutes of walking Physical activity levels (METs) Classified by Geographic location Personal characteristics")
7 Pedestrian modeling outputs Direct transportation outputs Walk trips generated Walk trips with origins & destinations Walk trips with routes Distances walked Pedestrian miles traveled (PMT) Minutes of walking Physical activity levels (METs) Classified by Geographic location Personal characteristics (socio-demographics) 7


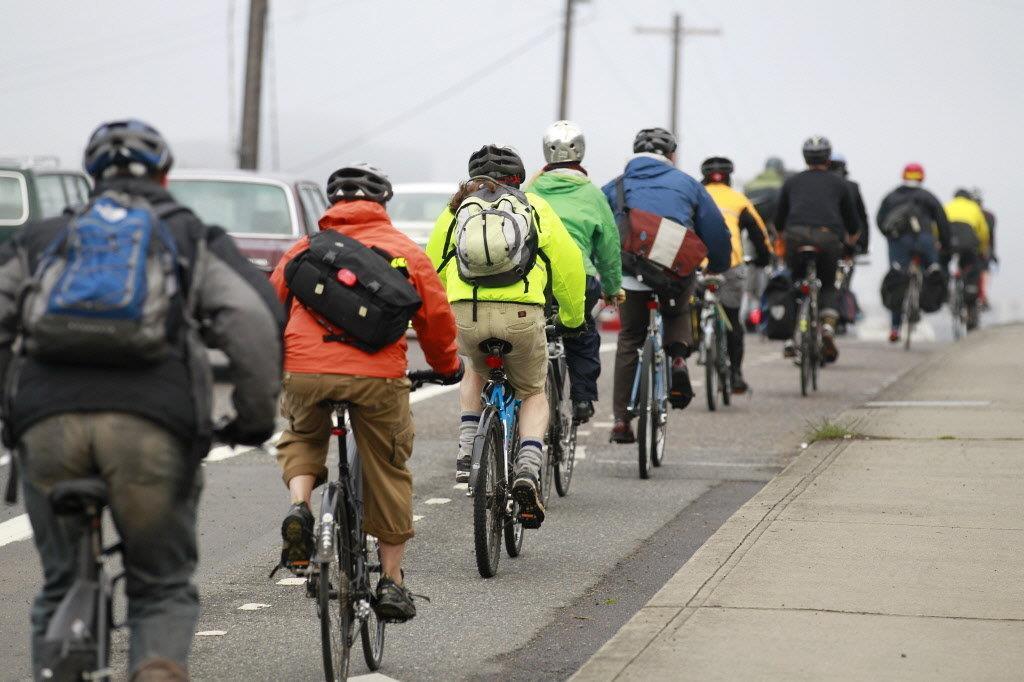
8 Why model pedestrians? Pedestrian investments Mode shifts Greenhouse gas emissions Health & safety Transit access/egress New research opportunities 8
9 State of the Practice How do travel models estimate walking? Among 48 large MPOs in US: 38% did not estimate walking 33% estimated non-motorized (walking + bicycling) travel 29% estimated walking Lacking pedestrian built environment measures & small spatial units Trip-based model sequence 1. Generation 2. Distribution 3. Mode choice 4. Assignment Source: Singleton, P. A., & Clifton, K. J. (2013). Pedestrians in regional travel demand forecasting models: State-of-the-practice. 9
10 Pedestrian modeling applications Project prioritization Scenario planning Corridor planning Traffic safety analysis Health impact assessment Infrastructure gap analysis Currently Future interest 61% (14) 78% (18) 43% (10) 65% (15) 43% (10) 61% (14) 35% (8) 57% (13) 35% (8) 57% (13) 30% (7) 57% (13) 10
11 Incorporating pedestrians Ready Challenging Most Challenging Adapted from: Wegener and Fürst,
12 Incorporating pedestrians Ready Adapted from: Wegener and Fürst,

13 EXPERIENCES IN MODELING PEDESTRIANS - MoPeD 13


14 Project overview 12 years of research/development in modeling pedestrian demand Early work funded by Maryland DOT Pedestrian risk exposure Recent research projects funded by NITC and Portland Metro Improve representation of pedestrians in current 4-step method Develop stand alone tool Transferability & forecasting of built environment measures 14
15 New MoPeD method I Trip Generation (PAZ) TAZ = transportation analysis zone PAZ = pedestrian analysis zone Walk Mode Split (PAZ) Trip Distribution or Destination Choice (TAZ) III Destination Choice (PAZ) Mode Choice (TAZ) Pedestrian Trips Trip Assignment All Trips Pedestrian Trips Vehicular Trips 15

16 Contributions Nests within current structure but can be used alone Pedestrian scale analysis (PAZs) Pedestrian-relevant variables (PIE) One of the first studies to examine pedestrian destination choice in demand modeling framework Highlights policy relevant variables: distance, size, pedestrian supports & barriers 16


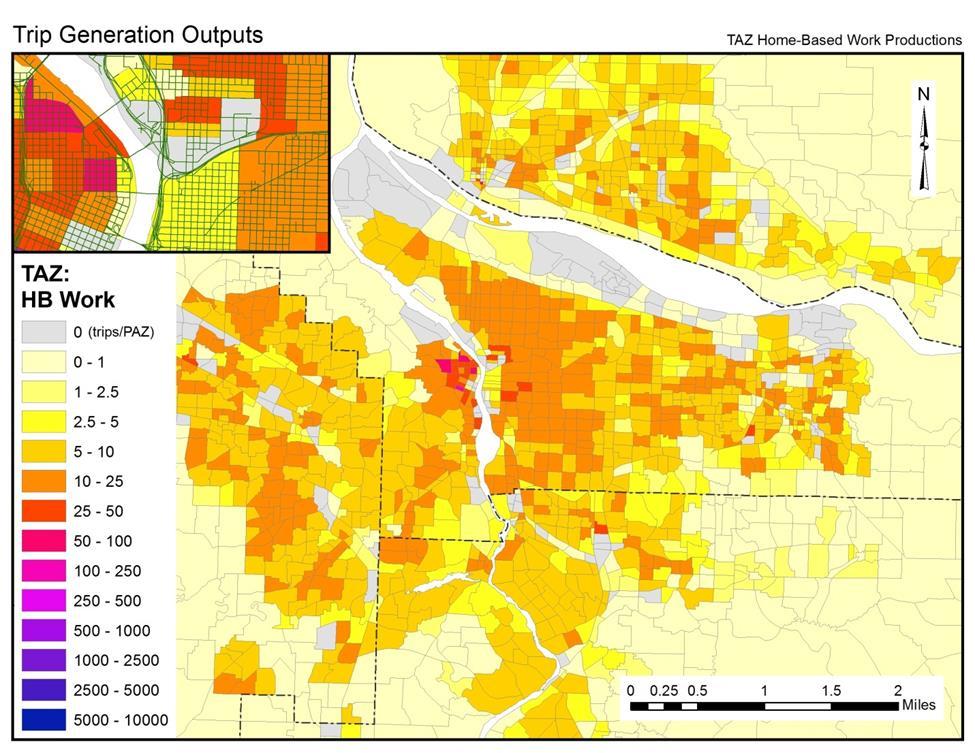
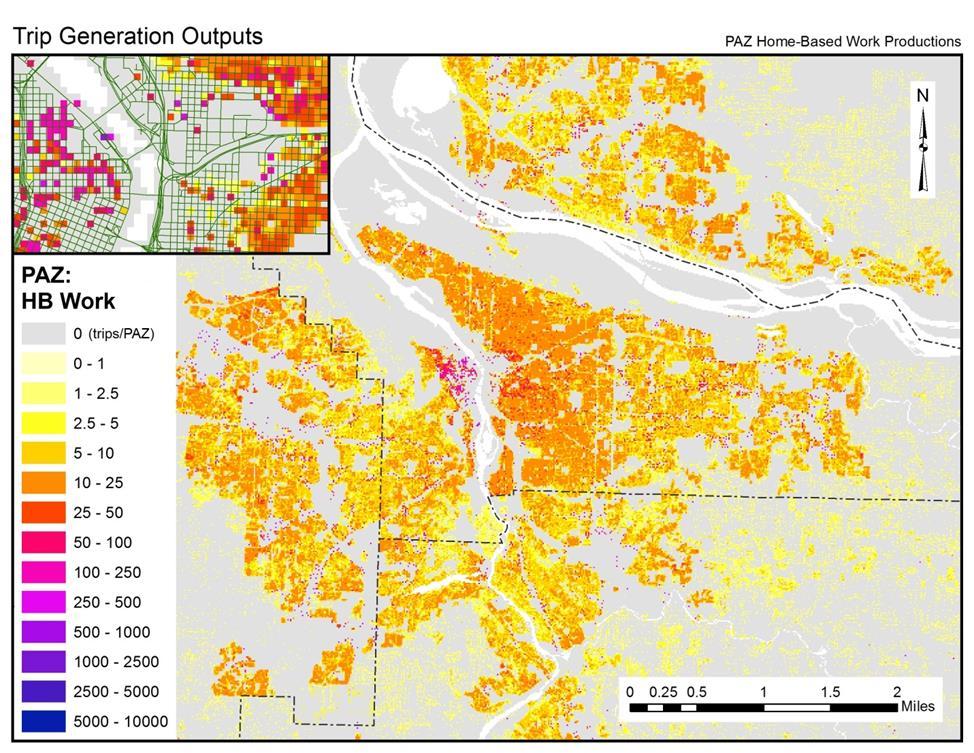
17 Pedestrian analysis zones 264 feet = 80 m 1 minute walk Metro: ~2,000 TAZs ~1.5 million PAZs TAZs PAZs Home-based work trip productions 17
 20")
 People & job density")


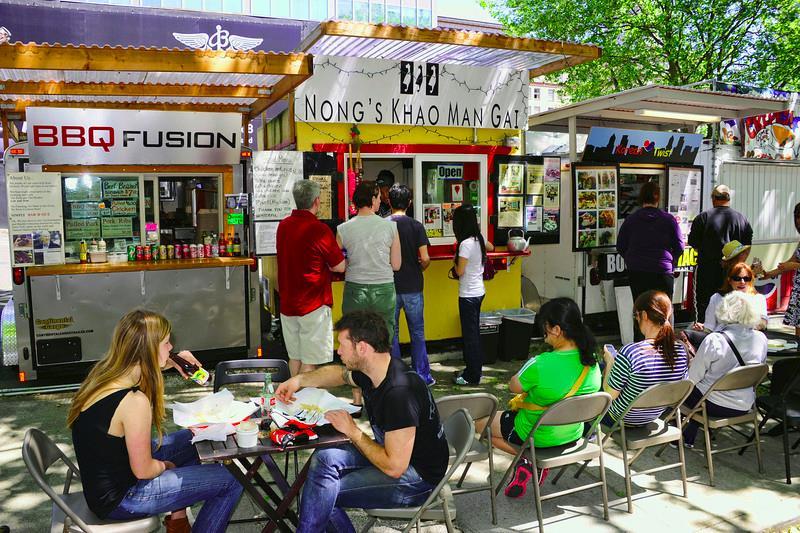
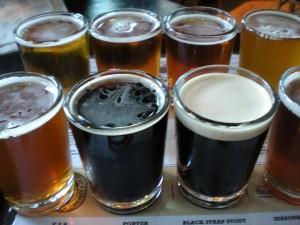
18 Pedestrian environment Pedestrian Index of the Environment (PIE) score = calibrated (6 dimensions) People & job density Transit access Urban living infrastructure Block size Sidewalk extent Comfortable facilities ULI = Urban Living Infrastructure: pedestrian-friendly shopping and service destinations used in daily life. 18
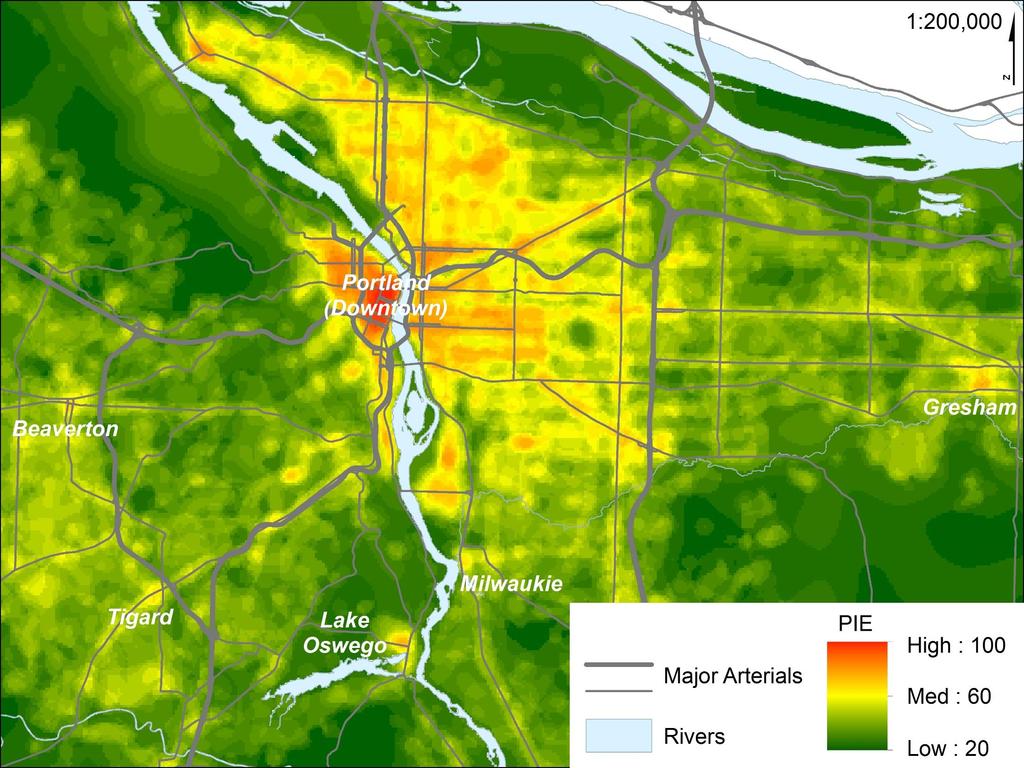
19 19
20 Trip Generation I Trip Generation (PAZ) TAZ = transportation analysis zone PAZ = pedestrian analysis zone Walk Mode Split (PAZ) Trip Distribution or Destination Choice (TAZ) III Destination Choice (PAZ) Mode Choice (TAZ) Pedestrian Trips Trip Assignment All Trips Pedestrian Trips Vehicular Trips 20
21 Trip Generation Metro currently has 8 trip production models applied to ~2,000 TAZs: HBW Home-based work; HBshop Home-based shopping; HBrec Home-based recreation; HBoth Home-based other (excludes school and college); NHBW Non-home-based work; NHBNW Non-home-based non-work; HBcoll Home-based college; and HBsch Home-based school. After testing for scalability, we applied the same models to our pedestrian scale ~1.5M PAZs 21
22 22
23 Walk mode split I Trip Generation (PAZ) TAZ = transportation analysis zone PAZ = pedestrian analysis zone Walk Mode Split (PAZ) Trip Distribution or Destination Choice (TAZ) III Destination Choice (PAZ) Mode Choice (TAZ) Pedestrian Trips Trip Assignment All Trips Pedestrian Trips Vehicular Trips 23
24 II Walk mode split Walk Mode Split (PAZ) Vehicular Trips Pedestrian Trips Prob(walk) = f(traveler characteristics, PIE) Data: Method: Spatial unit: 2011 OHAS, Production trip ends, 90% sample binary logit model pedestrian analysis zone (PAZ) 24

25 II Walk mode split models Traveler characteristics: Built environment: Household size, income, age, # of workers, # children, # vehicles PIE 25


26 Walk model application 26
27 Destination choice I Trip Generation (PAZ) TAZ = transportation analysis zone PAZ = pedestrian analysis zone Walk Mode Split (PAZ) Trip Distribution or Destination Choice (TAZ) III Destination Choice (PAZ) Mode Choice (TAZ) Pedestrian Trips Trip Assignment All Trips Pedestrian Trips Vehicular Trips 27
28 Destination choice 28
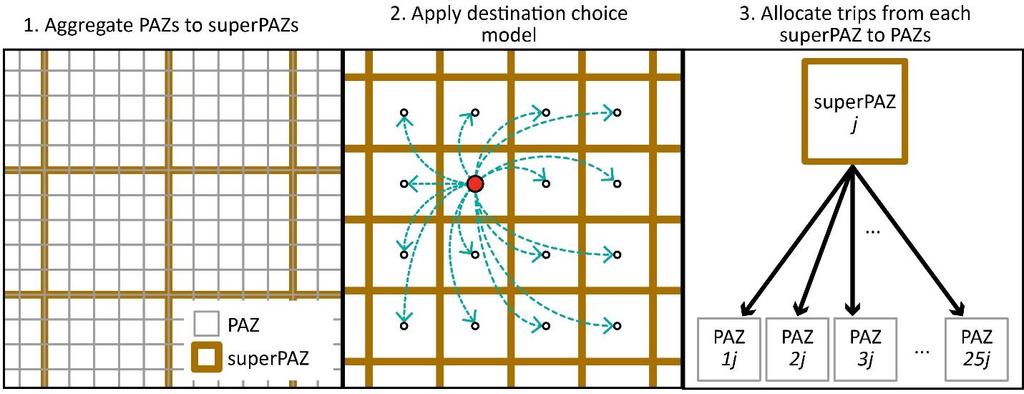
29 III Destination choice Prob(dest.) = function of network distance, - size / # of destinations pedestrian environment, traveler characteristics Data: 2011 OHAS Method: multinomial logit model Spatial unit: super-pedestrian analysis zone Six trip types: home-based: non-home-based: work (HBW) work (NHBW) shopping (HBS) non-work (NHBNW) recreation (HBR) other (HBO) 29
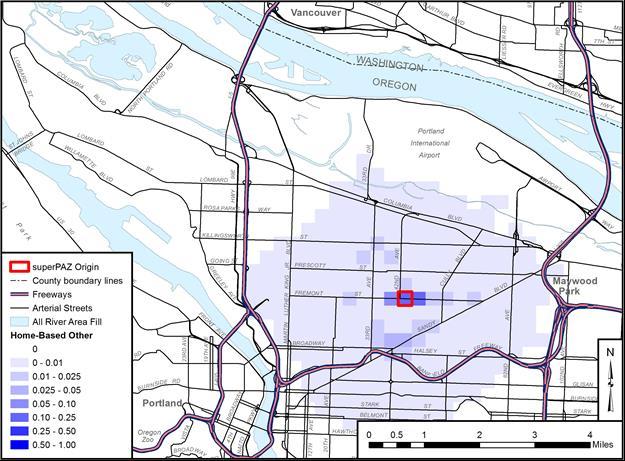
30 Destination Choice 30

31 Destination choice Model Validation % Correct Destination 31

32 Destination Choice Model Validation Avg. Distance Walked 32


33 ON THE HORIZON Behavioral research/data/methods Adapted from: Wegener and Fürst, 1999
34 Behavioral research Decision sequencing: activity, mode, destination; mode, destination, activity; destination, activity, mode Destination choice considerations choice set generation Willingness to walk Path/route choice considerations 34


35 Behavioral Research Built environment Thresholds & nonlinearities Mixing Scale Lifestyle questions: Vehicle ownership & residential location Attitudes, motivations & values Positive Utility of Travel What aspects? Diminishing returns? Mode feedbacks to trip generation 35


36 Spatial/Temporal Scale How much detail do we need? Depends on output needed for policy/research Capture variations in the pedestrian built & natural environment Spatial accuracy Theory/Behavior 36


37 Trip distance & scale 37

38 Walking Behavior Passive data sources Trip-level information Multi-day Multi-modal Destinations Routes & speeds But also need Motivations & considerations Barriers Trips not made 38
:171 186 S.R. Gehrke, & K.J. Clifton.")

39 Built environment How & what to represent? Indices, proxies Forecasting S.R. Gehrke, & K.J. Clifton. (2016). Toward a spatialtemporal measure of land-use mix. Journal of Transport and Land Use, 9(1): S.R. Gehrke, & K.J. Clifton. (2014). Operationalizing land use diversity at varying geographic scales and its connection to mode choice: Evidence from Portland, Oregon. Transportation Research Record: Journal of the Transportation Research Board 2453:
.")
.")
40 Networks Network representation How do we attribute networks? Feedbacks of travel costs Broach, J. P. (2016). Travel mode choice framework incorporating realistic bike and walk routes (Order No ). Available from Dissertations & Portland State University; ProQuest Dissertations & Theses Global. 40

41 Network assignment? 41

42 Validation Set aside estimation sample Compare to intersection counts Transferability: Evaluate the performance of models in many different communities Compare the performance of several different types of models in the same study area Have practitioners and advocates carefully review predicted volumes against their local knowledge 42
. Barengo NC, ed. PLoS ONE.")
43 Link to Health Outcomes Health impact analysis Total time spent walking + speeds Physical activity budgets Crash risk exposure Pollutant exposure Feedback into life expectancy Woodcock J, Givoni M, Morgan AS. Health Impact Modelling of Active Travel Visions for England and Wales Using an Integrated Transport and Health Impact Modelling Tool (ITHIM). Barengo NC, ed. PLoS ONE. 2013;8(1):e

44 Conclusions Tools for pedestrian (& bicycle) demand have matured Still lag behind motorized modes in sophistication and application Expanding list of policy issues More information & data Plenty of research questions! 44
45 Questions? Kelly J. Clifton Project info & reports: Singleton, P. A., Schneider, R. J., Muhs, C. D., & Clifton, K. J. (2014). The Pedestrian Index of the Environment (PIE): Representing the Walking Environment in Planning Applications, Proceedings of the 93rd Annual Meeting of the Transportation Research Board, Clifton, K. J., Singleton, P. A., Muhs, C. D., & Schneider, R. J Representing pedestrian activity in travel demand models: Framework and applications, Journal of Transport Geography, Vol. 52: Clifton, K. J., Singleton, P. A., Muhs, C. D., & Schneider, R. J Development of destination choice models for pedestrian travel, Transportation Research Part A, 94:
Webinar: Development of a Pedestrian Demand Estimation Tool
 Portland State University PDXScholar TREC Webinar Series Transportation Research and Education Center (TREC) 2-18-2016 Webinar: Development of a Pedestrian Demand Estimation Tool Kelly Clifton Portland
Rerouting Mode Choice Models: How Including Realistic Route Options Can Help Us Understand Decisions to Walk or Bike
 Portland State University PDXScholar TREC Friday Seminar Series Transportation Research and Education Center (TREC) 4-1-2016 Rerouting Mode Choice Models: How Including Realistic Route Options Can Help
Development of a Pedestrian Demand Estimation Tool
 Portland State University PDXScholar Civil and Environmental Engineering Faculty Publications and Presentations Civil and Environmental Engineering 9-2015 Development of a Pedestrian Demand Estimation
Pedestrian Demand Modeling: Evaluating Pedestrian Risk Exposures
 Pedestrian Demand Modeling: Evaluating Pedestrian Risk Exposures Kelly J. Clifton National Center for Smart Growth University of Maryland May 19, 2008 Study Team University of Maryland National Center
Memorandum. Drive alone
 Memorandum To: Cc: From: Kimberly Kerr, Assistant Chief Administrative Officer Natalie Porter, PE, TE Shawna Purvines Claudia Wade, PE Michael Schmitt, AICP CTP, PTP Re: Technical Memorandum #2: Model
Roadway Bicycle Compatibility, Livability, and Environmental Justice Performance Measures
 Roadway Bicycle Compatibility, Livability, and Environmental Justice Performance Measures Conference on Performance Measures for Transportation and Livable Communities September 7-8, 2011, Austin, Texas
WALKNBIKE DRAFT PLAN NASHVILLE, TENNESSEE EXECUTIVE SUMMARY NASHVILLE, TENNESSEE
 NASHVILLE, TENNESSEE EXECUTIVE SUMMARY Executive Summary A world-class multi-modal transportation system is essential to a vibrant city and better quality of life. -Mayor Barry The WalknBike plan aims
Incorporating Health in Regional Transportation Planning
 Mayor Karl Dean, Chairman Incorporating Health in Regional Transportation Planning Leslie A. Meehan, AICP Center TRT Intervention Webinar January 29, 2013 Objectives for Today Background About the Nashville
Goal 3: Foster an environment of partnerships and collaboration to connect our communities and regions to one another.
 Non-Motorized Transportation Plan (NMTP) Draft Vision, Goal and,, Tri-County Regional Planning Commission (TCRPC) Purpose The purpose of the Tri-County Regional Planning Commission (TCRPC) Non-Motorized
TR NEWS. Public Health and Transportation. Innovation, Intervention, and Improvements NUMBER 299 SEPTEMBER OCTOBER 2015
 TR NEWS NUMBER 299 SEPTEMBER OCTOBER 2015 Public Health and Transportation Innovation, Intervention, and Improvements Public Health and Transportation Measuring the Health Benefits of Walking and Bicycling
2010 Pedestrian and Bicyclist Special Districts Study Update
 2010 Pedestrian and Bicyclist Special Districts Study Update Pedestrian and Bicyclist Special Districts Program Overview H-GAC s Special Districts Program aims to provide strategic investments in pedestrian
Bike Planner Overview
 Bike Planner Overview A Web-based Sketch Planning Tool for Los Angeles County presented by William E. Walter, GISP April 12, 2017 GIS-T Transportation leadership you can trust. Bike Planner Overview Guiding
May 12, 2016 Metro Potential Ballot Measure Issue Brief: Local Return
 Summary: Local return is an important revenue source for cities to maintain their local transportation infrastructure. Most cities use their local return to operate small bus systems and repave streets,
Incorporating Health in Regional Transportation Planning
 Mayor Karl Dean, Chairman Incorporating Health in Regional Transportation Planning Leslie A. Meehan, AICP Center TRT Intervention Webinar January 29, 2013 Objectives for Today Background About the Nashville
Transportation Master Plan Advisory Task Force
 Transportation Master Plan Advisory Task Force Network Alternatives & Phasing Strategy February 2016 BACKGROUND Table of Contents BACKGROUND Purpose & Introduction 2 Linking the TMP to Key Council Approved
PEDESTRIAN ACTION PLAN
 ATTACHMENT 2 CITY OF SANTA MONICA PEDESTRIAN ACTION PLAN CITY OF SANTA MONICA PEDESTRIAN ACTION PLAN This page intentionally left blank EXECUTIVE SUMMARY CHAPTER 1 EXECUTIVE SUMMARY Setting the Stage
Goodlettsville Bicycle and Pedestrian Plan Executive Summary
 Goodlettsville Bicycle and Pedestrian Plan July 2010 In Cooperation with the Nashville Area Metropolitan Planning Executive Organization Summary Introduction Progressive and forward thinking communities
Eric Sundquist Managing Director State Smart Transportation Initiative (SSTI) Urban Sustainability Accelerator
 Urban Sustainability Accelerator") New tools for making better transportation system decisions Eric Sundquist Managing Director State Smart Transportation Initiative (SSTI) Urban Sustainability Accelerator Accessibility and trip-making
New tools for making better transportation system decisions Eric Sundquist Managing Director State Smart Transportation Initiative (SSTI) Urban Sustainability Accelerator Accessibility and trip-making
Canada s Capital Region Delegation to the Velo-City Global 2010 Conference
 Canada s Capital Region Delegation to the Velo-City Global 2010 Conference Report of Findings from Visits, Meetings & Presentations In Amsterdam-Den Haag, Utrecht, Berlin & Copenhagen The Itinerary Copenhagen
ADOT Statewide Bicycle and Pedestrian Program Summary of Phase IV Activities APPENDIX B PEDESTRIAN DEMAND INDEX
 ADOT Statewide Bicycle and Pedestrian Program Summary of Activities APPENDIX B PEDESTRIAN DEMAND INDEX May 24, 2009 Pedestrian Demand Index for State Highway Facilities Revised: May 29, 2007 Introduction
Health and Transportation: Integrated Transport and Health Impact Model in the Nashville Region. Leslie Meehan, AICP June 2015
 THE HONORABLE Mayor KEN WILBER, Karl Dean, CHAIRMAN Chairman Health and Transportation: Integrated Transport and Health Impact Model in the Nashville Region Leslie Meehan, AICP June 2015 Metropolitan Planning
Active Travel and Exposure to Air Pollution: Implications for Transportation and Land Use Planning
 Active Travel and Exposure to Air Pollution: Implications for Transportation and Land Use Planning Steve Hankey School of Public and International Affairs, Virginia Tech, 140 Otey Street, Blacksburg, VA
Understanding changing travel demand in Greater Manchester
 Understanding changing travel demand in Greater Manchester Which aspects of travel demand have changed in ways which have not been anticipated by traditional forecasting approaches in the past twenty years?
Bicycle and Pedestrian Connectivity Study. Old Colony Planning Council
 Bicycle and Pedestrian Connectivity Study Old Colony Planning Council Outline Why consider bike/peds in road designs? Why are measures needed? Connecting Land Use with Transportation Evaluation Tools:
Urban Transport Policy-making changing perspectives and consequences
 Urban Transport Policy-making changing perspectives and consequences Peter Jones, UCL ITLS, University of Sydney, 28 th March 2018 Overview Changing urban transport policy perspectives From car-based to
Bicycle and Pedestrian Planning in a Historically Car-Centric Culture: A Focus on Connectivity, Safety, & Accessibility
 Bicycle and Pedestrian Planning in a Historically Car-Centric Culture: A Focus on Connectivity, Safety, & Accessibility Kate Horton and Zylavian Watley Transportation Planners Memphis MPO Date: October
Update on Regional Bicycle, Pedestrian, & Trail Planning. Presented to TCC November 21, 2014
 Update on Regional Bicycle, Pedestrian, & Trail Planning Presented to TCC November 21, 2014 Survey Measure Assess Focus Area Performance- Driven Process Policy Policy Implement Plan Criteria Criteria Criteria
About the Active Transportation Alliance
 About the Active Transportation Alliance Chicagoland s voice for better biking, walking and transit Founded 1985 7,000 members, ~33 full time staff Serve Chicago metro region 1 More Cars, More Driving
Transportation and Health Tool
 Working together to evolve the Transportation and Health Tool APHA Webinar March 22, 2016 Ann Steedly, PE Overview THT Development Context Development of Indicators Strategies, Interventions & Policies
Bike Share Social Equity and Inclusion Target Neighborhoods
 Bike Share Social Equity and Inclusion Target Neighborhoods Target Neighborhoods West End/Visitation Park/Academy/Hamilton Heights Wellsgoodfellow/Kingsway West The Ville/Greater Ville Kingsway East/Fountain
City of Jacksonville Mobility Fee Update
 City of Jacksonville Mobility Fee Update 2017 Preliminary Analysis May 3, 2017 Carnival Cruise lines photo credit Presentation Overview Public Outreach Process Pedestrian and Bicycle Master Plan Study
City of Novi Non-Motorized Master Plan 2011 Executive Summary
 City of Novi Non-Motorized Master Plan 2011 Executive Summary Prepared by: February 28, 2011 Why Plan? Encouraging healthy, active lifestyles through pathway and sidewalk connectivity has been a focus
Kevin Manaugh Department of Geography McGill School of Environment
 Kevin Manaugh Department of Geography McGill School of Environment Outline Why do people use active modes? Physical (Built environment) Factors Psychological Factors Empirical Work Neighbourhood Walkability
Toronto Complete Streets Guidelines
 88 90 5.1 Cycling Design Principles 92 5.2 Context-sensitive Cycling Facilities 96 5.3 Key Cycling Elements Cycling infrastructure provides choice in how people are able to move around the city. Cyclists
Welcome. Background. Goals. Vision
 Welcome The formal Public Information Centre (PIC) for the Transportation Master Plan How We GO will be held in early 2017. At that time we will present the recommended transportation system for Niagara
Prioritizing Transportation Policy and Funding for Active Transportation, Safety, Equity and Health
 Mayor Karl Dean, Chairman Prioritizing Transportation Policy and Funding for Active Transportation, Safety, Equity and Health Leslie A. Meehan, AICP Planning and Implementing the Active Community Webinar
PEDALING FORWARD. A Glance at the SFMTA s Bike Program for SFMTA.COM
 PEDALING FORWARD A Glance at the SFMTA s Bike Program for 2017-2021 SFMTA.COM INTRODUCTION About This Booklet More people from all walks of life see their bicycle as a more convenient way to get where
Greenhouse gas emissions from transport have been rising and are expected to continue to rise both in higher & lower income countries.
 1 Greenhouse gas emissions from transport have been rising and are expected to continue to rise both in higher & lower income countries. Transport is seen as a hard area for mitigation 2 However, there
STUDY ADVISORY COMMITTEE. October 8, 2015
 STUDY ADVISORY COMMITTEE October 8, 2015 Study Purpose evaluate the long-term transportation strategies and investments needed to sustain the county s economic health and quality of life in the coming
CITY OF BLOOMINGTON COMPLETE STREETS POLICY
 CITY OF BLOOMINGTON COMPLETE STREETS POLICY POLICY OBJECTIVE: The City of Bloomington will enhance safety, mobility, accessibility and convenience for transportation network users of all ages and abilities,
Determining bicycle infrastructure preferences A case study of Dublin
 *Manuscript Click here to view linked References 1 Determining bicycle infrastructure preferences A case study of Dublin Brian Caulfield 1, Elaine Brick 2, Orla Thérèse McCarthy 1 1 Department of Civil,
The Limassol SUMP Planning for a better future. Apostolos Bizakis Limassol, May 16, th Cyprus Sustainable Mobility and ITS conference
 The Limassol SUMP Planning for a better future Apostolos Bizakis Limassol, May 16, 2017 5 th Cyprus Sustainable Mobility and ITS conference Αbout Limassol Αbout Limassol The second largest city in Cyprus
Bicycle Master Plan Goals, Strategies, and Policies
 Bicycle Master Plan Goals, Strategies, and Policies Mobilizing 5 This chapter outlines the overarching goals, action statements, and action items Long Beach will take in order to achieve its vision of
The Transit Last-Mile Problem
 The Transit Last-Mile Problem Thus far, we have treated the travel time thresholds as if they were the same in all environments. However, the experience of a short walk to or from a transit stop can be
Perryville TOD and Greenway Plan
 Perryville TOD and Greenway Plan Greenway Glossary Pathway: A bicycle and pedestrian path separated from motorized vehicular traffic by an open space, barrier or curb. Multi-use paths may be within the
Preliminary Transportation Analysis
 Preliminary Transportation Analysis Goals of a Robust, Multimodal Transportation Network Safe Accessible/Connected Efficient Comfortable Context-Sensitive Motor Vehicle: Continue to analyze the data to
Kelowna On the Move. Pedestrian and Bicycle Master Plan
 Kelowna On the Move Pedestrian and Bicycle Master Plan Executive Summary April 2016 Purpose of the Plan The Pedestrian and Bicycle Master Plan identifies infrastructure, planning, and policy requirements
Identifying and Prioritizing Biking and Walking Needs
 Identifying and Prioritizing Biking and Walking Needs The 2012 Utah Bicycle and Pedestrian Barriers Survey TRB Planning Applications Conference May 6, 2013 RSG, Inc Chloe Ritter Elizabeth Greene James
GIS Based Data Collection / Network Planning On a City Scale. Healthy Communities Active Transportation Workshop, Cleveland, Ohio May 10, 2011
 The Purpose of GIS Based Network Planning GIS Based Data Collection / Network Planning Healthy Communities Active Transportation Conference Tuesday, May 10, 2011 10:00 AM Norman Cox, LLA, ASLA. Ann Arbor,
T1-A - Service Reduction (Re-sizing)
") Key T1-A Choice A Key T1-B Choice B Key T1-C Choice C Key T1-D Choice D Key T1-E Choice E Key T1-F Choice F Key Choice G T2 T1-A - Service Reduction (Re-sizing) Description This key choice would represent
Key T1-A Choice A Key T1-B Choice B Key T1-C Choice C Key T1-D Choice D Key T1-E Choice E Key T1-F Choice F Key Choice G T2 T1-A - Service Reduction (Re-sizing) Description This key choice would represent
Typical Rush Hour Commute. PennyforTransportation.com
 Typical Rush Hour Commute In the News Overview of the Plan Collaborative plan with projects in every community Prioritizing connectivity and congestion relief Dedicated transportation-specific funding;
Eastern PA Trail Summit October 1, 2018
 Eastern PA Trail Summit October 1, 2018 WHO WE ARE + WHY + WE RE * HERE * * * * * * Session Goals: Discuss how to coordinate planning and design in small, urbanized towns Consider how to develop alternative
Appendix T 1: Additional Supporting Data
 Appendix T 1: Additional Supporting Data Project Delivery Delays with the implementation of the 2000 TIP became apparent early in the decade. In response to direction among policy officials, ARC began
The Traffic Monitoring Guide: Counting Bicyclists and Pedestrians. APBP 2017 June 28: 11:15am-12:45pm
 The Traffic Monitoring Guide: Counting Bicyclists and Pedestrians APBP 2017 June 28: 11:15am-12:45pm 2 Presentation Organization Why count bicyclists and pedestrians? Why report count data? What resources
APPENDIX E BIKEWAY PRIORITIZATION METHODOLOGY
 APPENDIX E BIKEWAY PRIORITIZATION METHODOLOGY INTRODUCTION The network of bikeways recommended in the Bicycle Master Plan is extensive and is likely to be only partially completed during the 25-year life
2. Context. Existing framework. The context. The challenge. Transport Strategy
 Transport Strategy Providing quality connections Contents 1. Introduction 2. Context 3. Long-term direction 4. Three-year priorities 5. Strategy tree Wellington City Council July 2006 1. Introduction Wellington
Assessment of socio economic benefits of non-motorized transport (NMT) integration with public transit (PT)
 integration with public transit (PT)") Assessment of socio economic benefits of non-motorized transport (NMT) integration with public transit (PT) Case study of Bike share (BS) system in Pune, India Parvesh Kumar Sharawat Department of Policy
Assessment of socio economic benefits of non-motorized transport (NMT) integration with public transit (PT) Case study of Bike share (BS) system in Pune, India Parvesh Kumar Sharawat Department of Policy
Konstantin Glukhenkiy Economic Affairs Officer
 Konstantin Glukhenkiy Economic Affairs Officer Rapid growth of urban areas Very rapid increase in motorisation Substantial increases in traffic congestion Relative decline of public transport usage and
Forecasting High Speed Rail Ridership Using Aggregate Data:
 Transportation Research Board 2015, Washington D.C. Forecasting High Speed Rail Ridership Using Aggregate Data: A Case Revisit of High Speed Rail in Taiwan Yu-Ting Hsu, Wei-Ren Lin, Yung-Cheng (Rex) Lai,
NACTO Designing Cities 2014 Dongho Chang, City Traffic Engineer October 23, 2014
 NACTO Designing Cities 2014 Dongho Chang, City Traffic Engineer October 23, 2014 Presentation overview Perspective on Safety Changing needs of our cities How Seattle is meeting those needs Challenge for
Goals, Objectives, and Policies
 Goals, Objectives, and Policies ADVISORY GROUP INPUT PUBLIC INPUT SNS PREVIOUS STUDIES RBPP Goals Vision Statement Southern Nevada will develop a safe, connected, and convenient walking and bicycling system
2014 Regional Bicycle and Pedestrian Study Evaluation Tools Leslie A. Meehan, AICP MPO Technical Coordinating Committee Meeting April 1, 2015
 Mayor Mayor Kenneth Karl Dean, Wilber, Chairman 2014 Regional Bicycle and Pedestrian Study Evaluation Tools Leslie A. Meehan, AICP MPO Technical Coordinating Committee Meeting April 1, 2015 Evaluation
Moving Cambridge. City of Cambridge Transportation Master Plan Public Consultation Centre. March 7, :00 8:00 PM.
 City of Cambridge Transportation Master Plan Public Consultation Centre March 7, 2018 5:00 8:00 PM Region of Waterloo City of Cambridge Transportation Master Plan Public Consultation Centre March 7, 2018
Gdynia s bicycle model
 Gdynia s bicycle model Problems related to cycling network and demand modelling Michał Miszewski, city of Gdynia Development of tool for transport analysis - MST Statistical data (baseline and forecasts)
GIS Based Non-Motorized Transportation Planning APA Ohio Statewide Planning Conference. GIS Assisted Non-Motorized Transportation Planning
 The Purpose of GIS Assisted Network GIS Assisted Non-Motorized Transportation 2011 APA Ohio Statewide Conference Friday, 10:45 AM to Noon Focus on near-term projects wwwgreenwaycollabcom The purpose of
2015 Florida Main Street Annual Conference. Complete Streets Equal Stronger Main Streets
 WHAT ARE COMPLETE STREETS? CASE STUDIES COMPLETING YOUR MAIN STREET 2015 Florida Main Street Annual Conference St. Petersburg, Florida August 19, 2015 WHAT ARE COMPLETE STREETS? CASE STUDIES COMPLETING
Bike/Multipurpose Trail Study for Glynn County, Georgia MAY 16, 2016
 Bike/Multipurpose Trail Study for Glynn County, Georgia MAY 16, 2016 Agenda» Project Status Update» Draft Recommendations Overview» Next Steps» Questions/Discussion Project Overview» Comprehensive Bikeway
San Mateo County Comprehensive Bicycle and Pedestrian Plan Open House
 San Mateo County Comprehensive Bicycle and Pedestrian Plan Open House October 28, 2010 Presented to San Mateo County residents and interested parties by Lauren Ledbetter, Alta Planning + Design Matt Haynes,
Scope of Services BICYCLE/PEDESTRIAN PLAN FOR THE INDIAN RIVER COUNTY MPO
 I. INTRODUCTION Scope of Services BICYCLE/PEDESTRIAN PLAN FOR THE INDIAN RIVER COUNTY MPO The Indian River County Metropolitan Planning Organization (MPO) Bicycle and Pedestrian Plan was completed in 1997.
Lord Overpass Multi-Modal Boulevard. Nicolas Bosonetto, P.E.
 Lord Overpass Multi-Modal Boulevard Nicolas Bosonetto, P.E. City of Lowell Fourth Largest City in Commonwealth Population of 109,945 Gateway City Diverse 20% Southeast Asian 17% Hispanic 25% Foreign Born
Transport attitudes, residential preferences, and urban form effects on cycling and car use.
 Downloaded from orbit.dtu.dk on: Mar 10, 2019 Transport attitudes, residential preferences, and urban form effects on cycling and car use. Nielsen, Thomas Alexander Sick; Olafsson, Anton Stahl; Carstensen,
7 Complete Streets & Roadway Aesthetics
 7 Complete Streets & Roadway Aesthetics 7.1 OVERVIEW Our streets lay the foundation for how we interface with travel needs, physical exercise, social exchanges and access to goods and services. They are
LONG-RANGE TRANSPORTATION MODELING IN THE BRISTOL URBANIZED AREA March 2008
 LONG-RANGE TRANSPORTATION MODELING IN THE BRISTOL URBANIZED AREA March 2008 Good planning is essential to the transportation process Bristol Metropolitan Planning Organization - Smallest urbanized area
Linking Transportation and Health in Nashville & Middle Tennessee
 Linking Transportation and Health in Nashville & Middle Tennessee Fit Nation New Orleans CPPW Mentoring Grant Built Environment Program May 14, 2011 Local Transportation Planning Framework Federal U.S.
Cities Connect. Cities Connect! How Urbanity Supports Social Inclusion
 Cities Connect! How Urbanity Supports Social Inclusion Todd Litman Victoria Transport Policy Institute Metropolis Toronto, Canada - 14 June 2006 Cities Connect People with people. People with jobs. People
Understanding Travel Modes to Non-work Destinations: Analysis of an Establishment Survey in Portland, Oregon
 Portland State University PDXScholar Dissertations and Theses Dissertations and Theses Spring 6-21-2013 Understanding Travel Modes to Non-work Destinations: Analysis of an Establishment Survey in Portland,
Climate Change Action Plan: Transportation Sector Discussion Paper: Cycling
 Climate Change Action Plan: Transportation Sector Discussion Paper: Cycling ontario.ca/climatechange Contents 1. Minister of Transportation s message... 3 2. Introduction... 5 3. Sector Overview and Support
Driverless Vehicles Potential Influence on Bicyclist Facility Preferences
 Driverless Vehicles Potential Influence on Bicyclist Facility Preferences MICHAEL BLAU, MCRP, LCI O T E C O C T O B E R 2 6, 2 0 1 6 S E S S I O N # 8 2 - E V A L U AT I N G T H E P E R F O R M A N C E
RE-CYCLING A CITY: EXAMINING THE GROWTH OF CYCLING IN DUBLIN
 Proceedings ITRN2013 5-6th September, Caulfield: Re-cycling a city: Examining the growth of cycling in Dublin RE-CYCLING A CITY: EXAMINING THE GROWTH OF CYCLING IN DUBLIN Brian Caulfield Abstract In the
York Region Population and Employment Growth
 March 1, 2016 1 York Region Population and Employment Growth York Region needs to comply with The Provincial Growth Plan and new forecasts introduced to 2036 and 2041 2 Regional Official Plan Review York
Appendix B: Forecasting and Traffic Operations Analysis Framework Document
 Existing Conditions Report - Appendix Appendix B: Forecasting and Traffic Operations Analysis Framework Document This document defines the methodology and assumptions that will be used in the traffic forecasting
Helsinki. Explaining Active Transportation Success in a City with Winter. Karl Saidla, Ph.D. Candidate, University of Ottawa, Human Kinetics
 Helsinki Explaining Active Transportation Success in a City with Winter Karl Saidla, Ph.D. Candidate, University of Ottawa, Human Kinetics Thanks! University of Ottawa Finland Futures Research Centre-University
BUILDING THE CASE FOR TRAVEL OPTIONS IN WASHING TON COUNTY. Image: Steve Morgan. Image: Steve Morgan
 BUILDING THE CASE FOR TRAVEL OPTIONS IN WASHING TON COUNTY Image: Steve Morgan Image: Steve Morgan Image: TriMet Image: TriMet WHAT ARE TRAVEL OPTIONS PROGRAMS? Travel options programs encourage residents,
92% COMMUTING IN THE METRO. Congested Roadways Mode Share. Roadway Congestion & Mode Share
 COMMUTING IN THE METRO Roadway Congestion & Mode Share The majority of major roadways in Greater Des Moines are without congestion and have underutilized capacity. This surplus capacity could be used for
FACTS AND FIGURES: MAKING THE CASE FOR COMPLETE STREETS IN LEE COUNTY
 FACTS AND FIGURES: MAKING THE CASE FOR COMPLETE STREETS IN LEE COUNTY Safety: Close to 5,000 pedestrians and bicyclists die each year on U.S. roads, and more than 70,000 are injured. [Mean Streets, Surface
Linking Land Use & Transportation in Minneapolis
 CITY OF MINNEAPOLIS Linking Land Use & Transportation in Minneapolis Presentation to All Transportation is Local Council President Lisa Bender March 22, 2018 1 Overview Minneapolis and the Twin Cities
The Case for New Trends in Travel
 The Case for New Trends in Travel The Future of Cities and Travel Steven E. Polzin, PhD. Center for urban Transportation Research University of South Florida October 19, 2008 Successful Strategies from
Parallel Workshop: Avoid
 Parallel Workshop: Avoid Vitoria-Gasteiz The commitment of a city towards active and sustainable mobility. Juan Carlos Escudero Environmental Studies Centre Vitoria-Gasteiz City Council A compact, diverse
CITY OF COCOA BEACH 2025 COMPREHENSIVE PLAN. Section VIII Mobility Element Goals, Objectives, and Policies
 CITY OF COCOA BEACH 2025 COMPREHENSIVE PLAN Section VIII Mobility Element Goals, Objectives, and Policies Adopted August 6, 2015 by Ordinance No. 1591 VIII MOBILITY ELEMENT Table of Contents Page Number
Hennepin County Pedestrian Plan Public Comment Report
 Hennepin County Pedestrian Plan Public Comment Report On May 31, 2013, the draft Hennepin County Pedestrian Plan was released for a 45-day public comment period ending July 15, 2013. The county received
Public transport and town planning from a retroactive point of view C. Wallstrom, S. Johansson et al
 Public transport and town planning from a retroactive point of view C. Wallstrom, S. Johansson et al The aim of this project is to estimate the effect of town planning on traffic volumes and modal split
Physical Implications of Complete Streets Policies
 Presentation Overview Physical Implications of Complete Norm Cox, ASLA, LLA Landscape Architect Ann Arbor, Michigan, 10:45 to Noon What Are Complete Streets? What Matters to Bicyclists and Pedestrians
Bikeway action plan. Bicycle Friendly Community Workshop March 5, 2007 Rochester, MN
 Bikeway action plan Summary The was held on March 5, 2007 at the Rochester Mayo Civic Center. The workshop was hosted by Rochester-Olmsted County Planning Department in collaboration with the League of
 Time of Change We Are Growing We Are An Attractive Place To Live We Are Age Diverse + Living Longer 50000 40000 30000 20000 10000 0 2010 Census Job Density Housing Sheds Transit Sheds The Project FUNDING
Presentation Summary Why Use GIS for Ped Planning? What Tools are Most Useful? How Can They be Applied? Pedestrian GIS Tools What are they good for?
 1 2 Pedestrian GIS Tools What are they good for? Pro Walk / Pro Bike 2006 Presentation Summary Why Use GIS for Ped Planning? What Tools are Most Useful? How Can They be Applied? Matt Haynes Fehr & Peers
MTP BICYCLE ELEMENT UPDATE. November 2017
 MTP BICYCLE ELEMENT UPDATE November 2017 TIME FOR AN UPDATE Bicycle Element adopted in July 2008 Almost 10 years old Many planned facilities have been implemented 10 years more experience in planning,
ACTIVE TRANSPORTATION
 ACTIVE TRANSPORTATION Mobility 2040 Supported Goals Improve the availability of transportation options for people and goods. Support travel efficiency measures and system enhancements targeted at congestion
A Matter of Fairness: ROCOG s Environmental Justice Protocol. What is Mobility Limitation?
 No Person Left Behind What is Mobility Limitation? What is the Access Limitation? Environmental Justice population should be provided adequate mobility & access to meet their needs; Identify acceptable
Laurier Segregated Bike Lane Pilot Project July 2013 update
 Laurier Segregated Bike Lane Pilot Project July 2013 update Presentation Overview Background Pilot Monitoring Results Mitigation Recommendations Next Steps Laurier 2 Background Laurier Avenue Segregated
METHODOLOGY. Signalized Intersection Average Control Delay (sec/veh)
") Chapter 5 Traffic Analysis 5.1 SUMMARY US /West 6 th Street assumes a unique role in the Lawrence Douglas County transportation system. This principal arterial street currently conveys commuter traffic
Chapter 5 Traffic Analysis 5.1 SUMMARY US /West 6 th Street assumes a unique role in the Lawrence Douglas County transportation system. This principal arterial street currently conveys commuter traffic