TRANSPORTATION RESEARCH CENTER
|
|
|
- Caren Simmons
- 5 years ago
- Views:
Transcription

1 The 2009 NHTS Vermont Uses of the Add-On Data for ing and Research in Vermont James Sullivan, M.S., P.E. Research Analyst TRANSPORTATION RESEARCH CENTER

2 Research Sponsors Research Collaborators Brian Lee, Ph.D., Assistant Professor Justine Sears, Research Specialist Lisa Aultman-Hall, Ph. D., Professor Paul Hines, Ph. D., Assistant Professor
3 The 2009 NHTS Vermont Spatial Analysis of Electric Vehicle Charging Demand
 Resulted in a statewide sampling rate 5x")
4 Over-sampling Vermont: 1. Allocate samples randomly outside of Chittenden County up to 913 (1,041) 2. Over-sample the 2 most rural counties until 1,000 total households is reached (1,188) Resulted in a statewide sampling rate 5x greater than the national average
 2.")
5 Over-sampling Chittenden County: 1. Allocate samples randomly up to 350 (317) 2. Over-sample the rural towns until 500 total households is reached (502)
6 Research Objectives Use Vermont-specific travel behavior information to complete the first comprehensive update of the trip-generation and trip-distribution sub-modules of the statewide travel demand model Evaluate the improvement in the quality and usefulness of the model following the update
7 Uses of the NHTS Regression Factors for Trip Rate Table Home-Based Trip Rates Regression Equations for Trip Attraction and Non-Home-Based Trip Production Vehicle Occupancies by Purpose Transit Fractions by Purpose Friction-Factor Equations by Purpose for Trip Distribution
8 Uses of the NHTS Internal Trip Distributions Vehicle Occupancy Rates I E Home- Avg. Trip Length Distributions Based New (min.) % of Trips Existing New Existin Trip Transit Purpose I-I I E I-I I E g New Rates %s Existing New Existing New HBO % 21% 52% % 35% HBSHOP % 15% 0.4% % 21% HBW % 9% 6% % 13% NHB % 55% 42% % 31% Existing βs New βs HBSHOP HBSHOP HBSHOP HBSHOP Variable NHB HBW (Urban) (Rural) HBO NHB HBW (Urban) (Rural) HBO No. of Households Retail Jobs Manufacturing Jobs Non-Manufacturing Government Jobs Primary School Jobs University Jobs
9 Uses of the NHTS Internal Trip Distributions Vehicle Occupancy Rates I E Home- Avg. Trip Length Distributions Based New (min.) % of Trips Existing New Existin Trip Transit Purpose I-I I E I-I I E g New Rates %s Existing New Existing New HBO % 21% 52% % 35% HBSHOP % 15% 0.4% % 21% HBW % 9% 6% % 13% NHB % 55% 42% % 31% Existing βs New βs HBSHOP HBSHOP HBSHOP HBSHOP Variable NHB HBW (Urban) (Rural) HBO NHB HBW (Urban) (Rural) HBO No. of Households Retail Jobs Manufacturing Jobs Non-Manufacturing Government Jobs Primary School Jobs University Jobs
10 Research Objectives Understanding the interaction between travel demand and electric vehicle charging Research Questions: 1. Who are the ideal candidates for electric vehicle ownership? 2. What are ideal locations for charging stations?

11 Methods Current distribution from our DMV records can be used as a seed predictor Attach these hybrid vehicle owners to certain spatially-based travel patterns Use characteristics of the households and drivers to attribute travel patterns to all hybrid owners in the state Hybrid Electric Vehicle Owners in Vermont

12 Use of the NHTS Analyze the variation in home-to-home tour length to characterize total travel by vehicle spatially Hot-Spot Analysis of Home-to- Home Tour Length
13 Research Objectives Using stated-preference surveys from the AARP to rank community-attributes according to their contribution to livability for seniors Sub-classified the ranks by age (55 to 64 and 65+) and geography (urban and rural) Geographic Class Rural Urban Age Class (years) % Respondents % Respondents , , ,363
14 Results suggest a distinction between age classifications and geographic classifications Rank Rural Urban Age 55 to 64 Age 65+ All 1 2 Safe Neighborhood Hospital in the Community Safe Neighborhood Hospital in the Community Safe Neighborhood Hospital in the Community Safe Neighborhood Hospital in the Community Safe Neighborhood Hospital in the Community 3 Housing Variety of Senior Housing Options Housing Variety of Senior Housing Options Variety of Senior Housing Options 4 Variety of Senior Housing Options Maintenance of Streets Variety of Senior Housing Options Place of Worship Housing 5 Place of Worship Housing Maintenance of Streets Housing Place of Worship 6 Shopping Convenient Public Transport Place of Worship Convenient Public Transport Maintenance of Streets 7 Grocery Store Within ½ Mile Place of Worship Shopping Access to Shopping Convenient Public Transport
15 Results suggest a distinction between age classifications and geographic classifications Rank Rural Urban Age 55 to 64 Age 65+ All 1 2 Safe Neighborhood Hospital in the Community Safe Neighborhood Hospital in the Community Safe Neighborhood Hospital in the Community Safe Neighborhood Hospital in the Community Safe Neighborhood Hospital in the Community 3 Housing Variety of Senior Housing Options Housing Variety of Senior Housing Options Variety of Senior Housing Options 4 Variety of Senior Housing Options Maintenance of Streets Variety of Senior Housing Options Place of Worship Housing 5 Place of Worship Housing Maintenance of Streets Housing Place of Worship 6 Shopping Convenient Public Transport Place of Worship Convenient Public Transport Maintenance of Streets 7 Grocery Store Within ½ Mile Place of Worship Shopping Access to Shopping Convenient Public Transport
16 Uses of the NHTS To confirm the importance of these classifications: Description Rural Urban Age 55 to 64 Age 65+ All Average no. of trips per week per person Average no. of walk/bike trips per week per person Average no. of transit trips per week per person Average no. of shopping trips per week per person Average length of shopping trip (miles)
17 Uses of the NHTS To confirm the importance of these classifications: Description Rural Urban Age 55 to 64 Age 65+ All Average no. of trips per week per person Average no. of walk/bike trips per week per person Average no. of transit trips per week per person Average no. of shopping trips per week per person Average length of shopping trip (miles)
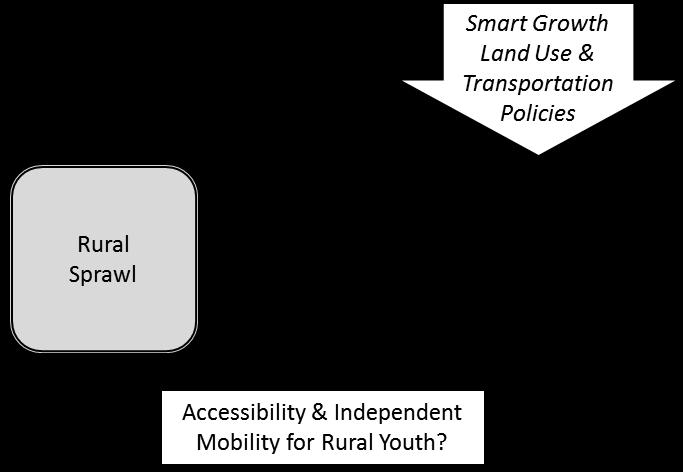
18 Research Objectives Research Questions In what ways do existing transportation and land use patterns in rural communities impact youth in terms of their access to activities in different places (social and physical availability) and mobility (ability to reach destinations)? What forms of rural built environment are more conducive to independent mobility among youth? Which characteristics of these different rural forms have most significant influence on young people s access to activities and destinations?
19 Research
20 Uses of the NHTS Identify travel behaviors that will inform the development of a household survey HHs with Youth HHs without Youth Purpose Count Rank Count Rank Home ,442 1 Social / recreational Shopping / errands Work Transport someone School / daycare / religious activity Meals Family personal business / obligations Medical / dental services Other reason Don't know Grand Total 1,771 4,407
21 Uses of the NHTS Identify travel behaviors that will inform the development of a household survey HHs with Youth HHs without Youth Purpose Count Rank Count Rank Home ,442 1 Social / recreational Shopping / errands Work Transport someone School / daycare / religious activity Meals Family personal business / obligations Medical / dental services Other reason Don't know Grand Total 1,771 4,407
22 Child 01 Person 02 Person 01 Uses of the NHTS Household , Rural, With One Youth Aged 14-18, 3 Drivers, 3 Vehicles; Tuesday 9/23/2008 Time # on Trip Activity 8:15-8:45am 1 Drove veh 02 to Technology Park to attend meeting 4:37-5:05pm 1 Drove veh 02 to Unleash Pet Store to buy goods 5:15-5:40pm 1 Drove veh 02 home 6:30-6:45pm 1 Drove veh 02 to pick up Child 01 at MMU 6:46-7:00pm 2 Drove veh 02 home with Child 01 7:50-8:00am 2 Drove veh 01 to drop off Child 01 at MMU 8:01-8:20am 1 Drove veh 01 to go to work 10:45-10:53am 1 Walked to go to gym/exercise/play sports 1054:11:00am 1 Walked back to work 1:20-1:43pm 1 Walked to go to gym/exercise/play sports 1:44-1:55pm 1 Walked back to work 2:55-3:10pm 1 Drove veh 01 to Chittenden East Sup. Union to attend business meeting 4:40-4:50pm 1 Drove veh 01 home 6:20-6:30pm 1 Drove veh 01 back to Chittenden East Sup. Union to attend business meeting 8:00-8:10pm 1 Drove veh 01 back home 7:50-8:00am 2 Passenger in veh 01 to be dropped off at High School 1:45-2:30pm 1 Passenger in school bus to go to Bellows Free Academy for gym/play sports 5:30-6:15pm 1 Passenger in school bus to go back to High School as student 6:46-7:00om 2 Passenger in veh 02 picked up from school to be driven back home
23 Child 01 Person 02 Person 01 Uses of the NHTS Household , Rural, With One Youth Aged 14-18, 3 Drivers, 3 Vehicles; Tuesday 9/23/2008 Time # on Trip Activity 8:15-8:45am 1 Drove veh 02 to Technology Park to attend meeting 4:37-5:05pm 1 Drove veh 02 to Unleash Pet Store to buy goods 5:15-5:40pm 1 Drove veh 02 home 6:30-6:45pm 1 Drove veh 02 to pick up Child 01 at MMU 6:46-7:00pm 2 Drove veh 02 home with Child 01 7:50-8:00am 2 Drove veh 01 to drop off Child 01 at MMU 8:01-8:20am 1 Drove veh 01 to go to work 10:45-10:53am 1 Walked to go to gym/exercise/play sports 1054:11:00am 1 Walked back to work 1:20-1:43pm 1 Walked to go to gym/exercise/play sports 1:44-1:55pm 1 Walked back to work 2:55-3:10pm 1 Drove veh 01 to Chittenden East Sup. Union to attend business meeting 4:40-4:50pm 1 Drove veh 01 home 6:20-6:30pm 1 Drove veh 01 back to Chittenden East Sup. Union to attend business meeting 8:00-8:10pm 1 Drove veh 01 back home 7:50-8:00am 2 Passenger in veh 01 to be dropped off at High School 1:45-2:30pm 1 Passenger in school bus to go to Bellows Free Academy for gym/play sports 5:30-6:15pm 1 Passenger in school bus to go back to High School as student 6:46-7:00om 2 Passenger in veh 02 picked up from school to be driven back home

24 Thank You Questions?
Travel Characteristics on Weekends:
 Travel Characteristics on Weekends: Implications for Planning and Policy Making Ram M. Pendyala Department of Civil and Environmental Engineering University of South Florida, Tampa Ashish Agarwal Cambridge
Webinar: Development of a Pedestrian Demand Estimation Tool
 Portland State University PDXScholar TREC Webinar Series Transportation Research and Education Center (TREC) 2-18-2016 Webinar: Development of a Pedestrian Demand Estimation Tool Kelly Clifton Portland
How Have Long-Distance Trips Changed Over the Past Decade? Experiences from AL, VT, and CA
 How Have Long-Distance Trips Changed Over the Past Decade? Experiences from AL, VT, and CA February 10, 2015 Alabama Transportation Conference Montgomery, AL Jeffrey LaMondia, PhD Asst. Professor Civil
City of Davenport CitiBus Public Transportation Study. April 2015
 City of Davenport CitiBus Public Transportation Study April 2015 Overview Project Background Key Findings CitiBus Service Allocation Policy Discussion 2 Project Background 3 About CitiBus Operates 17 routes
Transportation Trends, Conditions and Issues. Regional Transportation Plan 2030
 Transportation Trends, Conditions and Issues Regional Transportation Plan 2030 23 Regional Transportation Plan 2030 24 Travel Characteristics Why Do People Travel? Over one-half of trips taken in Dane
Aging & Mobility: Stranded Without A Choice
 Aging & Mobility: Stranded Without A Choice Linda Bailey, Policy Analyst This report was created in cooperation with AARP. Why This Study? [Taking away someone s license] really takes away a person s independence
The Case for New Trends in Travel
 The Case for New Trends in Travel The Future of Cities and Travel Steven E. Polzin, PhD. Center for urban Transportation Research University of South Florida October 19, 2008 Successful Strategies from
The Impact of Placemaking Attributes on Home Prices in the Midwest United States
 The Impact of Placemaking Attributes on Home Prices in the Midwest United States 2 0 1 3 C O N S T R U C T E D E N V I R O N M E N T C O N F E R E N C E M A R Y B E T H G R A E B E R T M I C H I G A N
A Framework For Integrating Pedestrians into Travel Demand Models
 A Framework For Integrating Pedestrians into Travel Demand Models Kelly J. Clifton Intersections Seminar University of Toronto September 22, 2017 Portland, Oregon, USA Region Population~ 2.4 M Urban Growth
SoundCast Design Intro
 SoundCast Design Intro Basic Design SoundCast and Daysim 3 Land use attributes Households & Individuals SoundCast DaySim Travel demand simulator Trips and Households, Excel Summary Sheets, EMME network
Modal Shift in the Boulder Valley 1990 to 2009
 Modal Shift in the Boulder Valley 1990 to 2009 May 2010 Prepared for the City of Boulder by National Research Center, Inc. 3005 30th Street Boulder, CO 80301 (303) 444-7863 www.n-r-c.com Table of Contents
Pedestrian Demand Modeling: Evaluating Pedestrian Risk Exposures
 Pedestrian Demand Modeling: Evaluating Pedestrian Risk Exposures Kelly J. Clifton National Center for Smart Growth University of Maryland May 19, 2008 Study Team University of Maryland National Center
Travel Behavior of Baby Boomers in Suburban Age Restricted Communities
 Travel Behavior of Baby Boomers in Suburban Age Restricted Communities TRB Conference Impact of Changing Demographics on the Transportation System 27 October 2008 P. Christopher Zegras Frank Hebbert Eran
University of Michigan & Urban Land Institute Real Estate Forum. Mary Beth Graebert Michigan State University
 University of Michigan & Urban Land Institute Real Estate Forum Mary Beth Graebert Michigan State University November 20, 2013 Michigan State University Land Policy Institute Strong focus on research and
Chapter 4 Traffic Analysis
 Chapter 4 Traffic Analysis PURPOSE The traffic analysis component of the K-68 Corridor Management Plan incorporates information on the existing transportation network, such as traffic volumes and intersection
Urban planners have invested a lot of energy in the idea of transit-oriented
 DOES TRANSIT-ORIENTED DEVELOPMENT NEED THE TRANSIT? D A N I E L G. C H AT M A N Urban planners have invested a lot of energy in the idea of transit-oriented developments (TODs). Developing dense housing
Attitude towards Walk/Bike Environments and its Influence on Students Travel Behavior: Evidence from NHTS, 2009
 Attitude towards Walk/Bike Environments and its Influence on Students Travel Behavior: Evidence from NHTS, 2009 Dr. Mintesnot Woldeamanuel California State University Northridge The 9 th Active Living
THE 2010 MSP REGION TRAVEL BEHAVIOR INVENTORY (TBI) REPORT HOME INTERVIEW SURVEY. A Summary of Resident Travel in the Twin Cities Region
 REPORT HOME INTERVIEW SURVEY. A Summary of Resident Travel in the Twin Cities Region") THE 2010 MSP REGION TRAVEL BEHAVIOR INVENTORY (TBI) REPORT HOME INTERVIEW SURVEY A Summary of Resident Travel in the Twin Cities Region October 2013 WHAT IS THE TBI? The Travel Behavior Inventory (TBI)
THE 2010 MSP REGION TRAVEL BEHAVIOR INVENTORY (TBI) REPORT HOME INTERVIEW SURVEY A Summary of Resident Travel in the Twin Cities Region October 2013 WHAT IS THE TBI? The Travel Behavior Inventory (TBI)
Project Team. Refined Pedestrian Crossing Toolbox. Problem Statement. Aerial of Study Corridor. Crossing Accommodations and Pedestrian Fatalities
 Project Team Refined Pedestrian Crossing Toolbox Treatments on Wide, High Speed Urban Roadways Developed as Part of the Springfield Main Street (OR 126) Safety Study Consultants Scott Mansur, P.E., P.T.O.E.
TR NEWS. Public Health and Transportation. Innovation, Intervention, and Improvements NUMBER 299 SEPTEMBER OCTOBER 2015
 TR NEWS NUMBER 299 SEPTEMBER OCTOBER 2015 Public Health and Transportation Innovation, Intervention, and Improvements Public Health and Transportation Measuring the Health Benefits of Walking and Bicycling
Project Report for. "Estimating Modal Splits"
 Project Report for "Estimating Modal Splits" prepared for Delaware Transportation Institute and The State of Delaware Department of Transportation by David P. Racca Center for Applied Demography & Survey
Built Environment and Older Adults: Supporting Smooth Transitions Across the Life- Span. Dr. Lawrence Frank, Professor and Bombardier UBC
 Built Environment and Older Adults: Supporting Smooth Transitions Across the Life- Span Dr. Lawrence Frank, Professor and Bombardier Chair @ UBC The Hidden Health Costs of Transportation - Frank et al
2016 APS Go! Surveys Summary Results for Oakridge Elementary School
 2016 APS Go! Surveys Summary Results for Oakridge Elementary School This report summarizes results from the 2016 APS Go! surveys for Oakridge Elementary School. Student, parent/caregiver and staff surveys
METRO Light Rail: Changing Transit Markets in the Phoenix Metropolitan Area
 METRO Light Rail: Changing Transit Markets in the Phoenix Metropolitan Area Abhishek Dayal, AICP Planner III, METRO Light Rail Phoenix, AZ BACKGROUND Transit in the Phoenix Region Transit services in the
2016 APS Go! Surveys Summary Results for Arlington Traditional School
 2016 APS Go! Surveys Summary Results for Arlington Traditional School This report summarizes results from the 2016 APS Go! surveys for Arlington Traditional School. Student, parent/caregiver and staff
Relationship Between Child Pedestrian Accidents and City Planning in Zarqa, Jordan
 112 TRANSPORTATION RESEARCH RECORD 1281 Relationship Between Child Pedestrian Accidents and City Planning in Zarqa, Jordan ADU H. AL-BALBISSI, MOHAMED T. ABOUL-ELA, AND SABAH SAMMOUR The relationship between
REGIONAL HOUSEHOLD TRAVEL SURVEY:
 Defining the Vision. Shaping the Future. REGIONAL HOUSEHOLD TRAVEL SURVEY: Profile Why we travel How we travel Who we are and how often we travel When we travel Where we travel How far and how long we travel
SACRAMENTO AREA TRAVEL SURVEY: BEFORE BIKE SHARE
 SACRAMENTO AREA TRAVEL SURVEY: BEFORE BIKE SHARE August 2017 A Research Report from the National Center for Sustainable Transportation Susan Handy, University of California, Davis Drew Heckathorn, University
Lisa Quinn Executive Director
 Transforming Injury and Violence Prevention: Innovations in Policy, Practice, and Partnerships Advocating for Prevention: Enacting and Reacting to Legislation Lisa Quinn Executive Director Feet First works
Birmingham Connected. Edmund Salt. Transportation Policy Birmingham City Council
 Birmingham Connected Edmund Salt Transportation Policy Birmingham City Council www.birmingham.gov.uk/connected Birmingham Connected the story so far Broadly following EU Guidance We ve done all of this
2018 Transportation Survey October 17, Prepared by:
 Transportation Survey October 17, Prepared by: Overview Methodology Systemwide results Strengths/Weaknesses by mode Importance of possible improvements Conclusions Methodology 500 Chittenden County residents
EXPLORING THE CHARACTERISTICS OF SHORT TRIPS: IMPLICATIONS FOR WALK MODE CHOICE
 1 1 1 1 1 1 1 1 0 1 0 1 0 1 EXPLORING THE CHARACTERISTICS OF SHORT TRIPS: IMPLICATIONS FOR WALK MODE CHOICE Sanjay Paul (corresponding author) Arizona State University, School of Sustainable Engineering
Guidelines for Providing Access to Public Transportation Stations APPENDIX C TRANSIT STATION ACCESS PLANNING TOOL INSTRUCTIONS
 APPENDIX C TRANSIT STATION ACCESS PLANNING TOOL INSTRUCTIONS Transit Station Access Planning Tool Instructions Page C-1 Revised Final Report September 2011 TRANSIT STATION ACCESS PLANNING TOOL INSTRUCTIONS
Bike BR. A Tool for Baton Rouge, Louisiana by the City-Parish Planning Commission
 A Tool for Baton Rouge, Louisiana by the City-Parish Planning Commission APT 206 Function Code: S207 Title: Community Bikeability Tool APA s 2012 National Planning Conference April 15, 2012 Presented by:
Active Travel and Exposure to Air Pollution: Implications for Transportation and Land Use Planning
 Active Travel and Exposure to Air Pollution: Implications for Transportation and Land Use Planning Steve Hankey School of Public and International Affairs, Virginia Tech, 140 Otey Street, Blacksburg, VA
R&D Initiatives for Sustainable Mobility
 Centre for Infrastructure Systems (CIS) Director: A/Prof Wong Yiik Diew Email: cydwong@ntu.edu.sg 27 June 2014 R&D Initiatives for Sustainable Mobility 1 Population Density (thousand persons per square
Walking in New Zealand May 2013
 May 2013 Walking makes up 13 percent of total time travelled and 16 percent of the number of trip legs. On average women spend more time walking than men, walking 57 minutes per person per week, compared
Author Acknowledgements
 EXPLORING TRANSIT S CONTRIBUTION TO LIVABILITY IN RURAL COMMUNITIES WEBCAST PRESENTATION HOSTED BY CENTER FOR URBAN TRANSPORTATIONRESEARCH UNIVERSITY OF SOUTHFLORIDA OCTOBER 27, 2016 12:00 PM EST JONATHAN
THE NEXUS OF LIVABILITY, TRANSIT, AND PERFORMANCE MEASUREMENT
 THE NEXUS OF LIVABILITY, TRANSIT, AND PERFORMANCE MEASUREMENT CALACT SPRING CONFERENCE 2013 MAY 17, 2013 FRIDAY MORNING SESSION JONATHAN BROOKS ASSOCIATE TRANSPORTATION RESEARCHER TRANSIT MOBILITY PROGRAM
Safety culture in professional road transport in Norway and Greece
 Safety culture in professional road transport in Norway and Greece Tor-Olav Nævestad 1, Ross O. Phillips 1, Alexandra Laiou 2, George Yannis 2 1 Institute of Transport Economics, Norway 2 National Technical
Flyaway Bus: GIS Analysis on Current and Potential Ridership, Revenue, and Prospective Stations
 ProfessorBarry Waite & Bonnie Shrewsbury Flyaway Bus: GIS Analysis on Current and Potential Ridership, Revenue, and Prospective Stations 1. Abstract The Flyaway Bus is a long distance non-stop shuttle
Ridership Demand Analysis for Palestinian Intercity Public Transport
 Ridership Demand Analysis for Palestinian Intercity Public Transport Khaled A. Al-Sahili and Abdelmajid H. Sadeq An-Najah National University Abstract This article presents results of research to study
MIDCOAST MAINE TRANSIT STUDY. In Association with: MORRIS COMMUNICATIONS
 MIDCOAST MAINE TRANSIT STUDY In Association with: MORRIS COMMUNICATIONS Public Meetings June, 2013 Project Background Four coastal towns of Knox County have agreed on the importance of a transit study
Investigating Commute Mode and Route Choice Variability in Jakarta using multi-day GPS Data
 Investigating Commute Mode and Route Choice Variability in Jakarta using multi-day GPS Data Zainal N. Arifin Kay W. Axhausen Conference paper STRC 2011 Investigating Commute Mode and Route Choice Variability
2014 Ontario Works Transit Survey: Final Results
 2014 Ontario Works Transit Survey: Final Results Irena Pozgaj-Jones, Project Manager, Transportation September 2014 Overview Background Survey Purpose and Objectives Methodology Respondent Demographics
Washington County, Oregon
 Washington County, Oregon Photo add here 1 Washington County, Oregon Total population: 536,370 City population: 320,000 Based on 2010 Census Rural population: 26,000 Urban Unincorporated Population: 190,000
Capital Bikeshare 2011 Member Survey Executive Summary
 Capital Bikeshare 2011 Member Survey Executive Summary Prepared by: LDA Consulting Washington, DC 20015 (202) 548-0205 June 14, 2012 EXECUTIVE SUMMARY Overview This report presents the results of the 2012
Rationale. Previous research. Social Network Theory. Main gap 4/13/2011. Main approaches (in offline studies)
") Boots are Made for Walking: The Spatiality of Social Networks in a Pedestrian, Phone-Free Society Patterns of social interaction in regions without: Implications Rationale Annual Meeting of the Association
Boots are Made for Walking: The Spatiality of Social Networks in a Pedestrian, Phone-Free Society Patterns of social interaction in regions without: Implications Rationale Annual Meeting of the Association
Traffic Safety Barriers to Walking and Bicycling Analysis of CA Add-On Responses to the 2009 NHTS
 Traffic Safety Barriers to Walking and Bicycling Analysis of CA Add-On Responses to the 2009 NHTS NHTS Users Conference June 2011 Robert Schneider, Swati Pande, & John Bigham, University of California
The previous chapters in this plan have established the value of this plan (Chapter 1), the
, the") 4 Making Madison an Even Better Place to Walk: Vision, Goals, Objectives The previous chapters in this plan have established the value of this plan (Chapter 1), the importance of walking (Chapter 2), and
4 Making Madison an Even Better Place to Walk: Vision, Goals, Objectives The previous chapters in this plan have established the value of this plan (Chapter 1), the importance of walking (Chapter 2), and
Cheryl Thole CUTR/NBRTI, Senior Research Associate Tampa, Florida
 A Change in Accessibility and Convenience? Implementing BRT and the Impact on Transit Riders Cheryl Thole CUTR/NBRTI, Senior Research Associate Tampa, Florida Project Background Greater station spacing
Walking and Biking in California: Summary of Findings
 Walking and Biking in California: Summary of Findings Nancy McGuckin Travel Behavior Analyst www.travelbehavior.us Goal for California Add-on to the National Household Travel Survey: Obtain data for performance
PASSENGER SURVEY RESULTS
 ROGUE VALLEY TRANSPORTATION DISTRICT PASSENGER SURVEY RESULTS Date: December 12, 2018 Project #: 21289 To: Paige West, RVTD From: Susan Wright, PE; Molly McCormick; (Kittelson & Associates, Inc.) Subject:
Determining bicycle infrastructure preferences A case study of Dublin
 *Manuscript Click here to view linked References 1 Determining bicycle infrastructure preferences A case study of Dublin Brian Caulfield 1, Elaine Brick 2, Orla Thérèse McCarthy 1 1 Department of Civil,
Dowds and Sullivan 1 APPLYING A VEHICLE-MILES OF TRAVEL CALCULATION METHODOLOGY TO A COUNTY-WIDE CALCULATION OF BICYCLE AND PEDESTRIAN MILES OF TRAVEL
 Dowds and Sullivan 1 1 2 3 4 5 6 7 8 9 10 11 12 13 14 15 16 17 18 19 20 21 22 23 24 APPLYING A VEHICLE-MILES OF TRAVEL CALCULATION METHODOLOGY TO A COUNTY-WIDE CALCULATION OF BICYCLE AND PEDESTRIAN MILES
Tulane Transportation Survey
 2008-09 Tulane Transportation Survey The following are results of survey of Tulane students and employees that was conducted via telephone during the 2008-2009 academic year by service learning students
14. Sponsoring Agency Code P.O. Box 5051 Austin, Texas 78763
 TECHNICAL REPORT STANDARD TITLE PAGE 1. Report No. 2. Government Accession No. 3. Recipient's Catalog No. FHWA/TX-92/1099 4. Title and Subtitle 5. Report Date Urban Travel in Texas: An Overview of Travel
Geo-coding of the 2012 WMATA Rail Survey. Travel Forecasting Subcommittee January 25, 2012 Clara Reschovsky
 Geo-coding of the 2012 WMATA Rail Survey Travel Forecasting Subcommittee January 25, 2012 Clara Reschovsky 1 2012 WMATA Rail Survey Period of study: April 13 May 25, 2012 Forms distributed to 40% of riders
Summary of Travel Trends Findings from the 2017 NHTS. Nancy McGuckin, Travel Behavior Analyst Anthony Fucci, Westat
 1 Summary of Travel Trends Findings from the 2017 NHTS Nancy McGuckin, Travel Behavior Analyst Anthony Fucci, Westat 2 A BIG thank you to: FHWA Team: Danny Jenkins, FHWA Stacey Bricka, Macrosys Tim Reusher,
Eric Sundquist Managing Director State Smart Transportation Initiative (SSTI) Urban Sustainability Accelerator
 Urban Sustainability Accelerator") New tools for making better transportation system decisions Eric Sundquist Managing Director State Smart Transportation Initiative (SSTI) Urban Sustainability Accelerator Accessibility and trip-making
New tools for making better transportation system decisions Eric Sundquist Managing Director State Smart Transportation Initiative (SSTI) Urban Sustainability Accelerator Accessibility and trip-making
Rider Satisfaction Survey Phoenix Riders 2004
 Rider Satisfaction Survey Riders Prepared For: Valley Metro Spring 2720 E. Thomas Rd. Bldg. A, Arizona 85016-8296 602-707-0050 answers@westgroupresearch.com Valley Metro Rider Satisfaction Survey - Page
West Dimond Blvd Upgrade Jodhpur Street to Sand Lake Road
 West Dimond Blvd Jodhpur St to Sand Lake CSS Transportation Project Summary Municipality of Anchorage Project # 05 005 Project Manager: John Smith, P.E. (MOA PM&E) Project Administrator: Julie Makela,
Life Transitions and Travel Behaviour Study. Job changes and home moves disrupt established commuting patterns
 Life Transitions and Travel Behaviour Study Evidence Summary 2 Drivers of change to commuting mode Job changes and home moves disrupt established commuting patterns This leaflet summarises new analysis
MODELING THE ACTIVITY BASED TRAVEL PATTERN OF WORKERS OF AN INDIAN METROPOLITAN CITY: CASE STUDY OF KOLKATA
 MODELING THE ACTIVITY BASED TRAVEL PATTERN OF WORKERS OF AN INDIAN METROPOLITAN CITY: CASE STUDY OF KOLKATA WORK ARITRA CHATTERJEE HOME SHOPPING PROF. DR. P.K. SARKAR SCHOOL OF PLANNING AND ARCHITECTURE,
Pocatello Regional Transit Master Transit Plan Draft Recommendations
 Pocatello Regional Transit Master Transit Plan Draft Recommendations Presentation Outline 1. 2. 3. 4. What is the Master Transit Plan? An overview of the study Where Are We Today? Key take-aways from existing
Fixed Guideway Transit Outcomes on Rents, Jobs, and People and Housing
 Fixed Guideway Transit Outcomes on Rents, Jobs, and People and Housing Arthur C. Nelson, Ph.D., ASCE, FAICP Professor of Planning and Real Estate Development University of Arizona 1 Changing Transportation
Planning Guidance in the 2012 AASHTO Bike Guide
 Planning Guidance in the 2012 AASHTO Bike Guide Presentation by: RJ Eldridge Peter Lagerwey August 22, 2012 WEBINAR 2: PLANNING GUIDANCE IN THE 2012 AASHTO BIKE GUIDE Today s Webinar Significant Updates
Transport attitudes, residential preferences, and urban form effects on cycling and car use.
 Downloaded from orbit.dtu.dk on: Mar 10, 2019 Transport attitudes, residential preferences, and urban form effects on cycling and car use. Nielsen, Thomas Alexander Sick; Olafsson, Anton Stahl; Carstensen,
Travel and Rider Characteristics for Metrobus
 Travel and Rider Characteristics for Metrobus 040829040.15 Travel and Rider Characteristics for Metrobus: 2012-2015 Overview The Miami Dade County Metropolitan Planning Organization (MPO) conducted a series
Market Factors and Demand Analysis. World Bank
 Market Factors and Demand Analysis Bank Workshop and Training on Urban Transport Planning and Reform. Baku, April 14-16, 2009 Market Factors The market for Public Transport is affected by a variety of
Bike Planner Overview
 Bike Planner Overview A Web-based Sketch Planning Tool for Los Angeles County presented by William E. Walter, GISP April 12, 2017 GIS-T Transportation leadership you can trust. Bike Planner Overview Guiding
A GIS APPROACH TO EVALUATE BUS STOP ACCESSIBILITY
 Advanced OR and AI Methods in Transportation A GIS APPROACH TO EVALUATE BUS STOP ACCESSIBILITY Giuseppe SALVO 1, Simona SABATINI 2 Abstract. This paper proposes a methodology to assess public transportation
Location Matters: Where America Is Moving
 Location Matters: Where America Is Moving Nearly half of all American households plan to move at some point in the future. While some will move for a larger or nicer home, or perhaps to purchase a home
SHORT RANGE TRANSIT PLAN: Survey Results and Analysis
 GOLD COAST TRANSIT DISTRICT SHORT RANGE TRANSIT PLAN: Survey Results and Analysis FY 2014-15 to FY 2018-19 Overview As part of the Short Range Transit Plan (SRTP) community outreach process, Gold Coast
o n - m o t o r i z e d transportation is an overlooked element that can greatly enhance the overall quality of life for the community s residents.
 N o n - m o t o r i z e d transportation is an overlooked element that can greatly enhance the overall quality of life for the community s residents. 84 Transportation CHAPTER 11 INTRODUCTION Transportation
Safe Routes to School Program in California: An Update
 Safe Routes to School Program in California: An Update Claudia Chaufan, MD, PhD Jarmin Yeh, MSSW, MPH Leslie Ross, PhD Pat Fox, PhD, MSW Institute for Health & Aging, Department of Social and Behavioral
Webinar: The Association Between Light Rail Transit, Streetcars and Bus Rapid Transit on Jobs, People and Rents
 Portland State University PDXScholar TREC Webinar Series Transportation Research and Education Center (TREC) 11-15-2016 Webinar: The Association Between Light Rail Transit, Streetcars and Bus Rapid Transit
Accessibility, mobility and social exclusion
 Accessibility, mobility and social exclusion Dionisis Balourdos Kostas Sakellaropoulos Aim The aim of this paper is to present data from the four cities in the project SceneSusTech concerning the issues
Rolling Out Measures of Non-Motorized Accessibility: What Can We Now Say? Kevin J. Krizek University of Colorado
 Rolling Out Measures of Non-Motorized Accessibility: What Can We Now Say? Kevin J. Krizek University of Colorado www.kevinjkrizek.org Acknowledgements Mike Iacono Ahmed El-Geneidy Chen-Fu Liao Outline
1999 On-Board Sacramento Regional Transit District Survey
 SACOG-00-009 1999 On-Board Sacramento Regional Transit District Survey June 2000 Sacramento Area Council of Governments 1999 On-Board Sacramento Regional Transit District Survey June 2000 Table of Contents
Rerouting Mode Choice Models: How Including Realistic Route Options Can Help Us Understand Decisions to Walk or Bike
 Portland State University PDXScholar TREC Friday Seminar Series Transportation Research and Education Center (TREC) 4-1-2016 Rerouting Mode Choice Models: How Including Realistic Route Options Can Help
Walking New Zealand Household Travel Survey September 2015
 Walking New Zealand Household Travel Survey 2011-2014 September 2015 Disclaimer: All reasonable endeavours are made to ensure the accuracy of the information in this report. However, the information is
Travel Patterns and Characteristics
 DRAFT 2006 Transportation Fact Book SECTION 4 Travel Patterns and Characteristics 43 2006 Transportation Fact Book DRAFT 44 DRAFT 2006 Transportation Fact Book Why do we conduct travel surveys? The main
Free Ride Transit System 2014 On Board Passenger Survey
 Free Ride Transit System 2014 On Board Passenger Survey March 28, 2014 INTRODUCTION The last on-board passenger survey was conducted by the Breckenridge Free Ride on March 30, 2012. The 2012 survey had
Introduction Overview This document summarizes the Gateway Gold Line Bus Rapid Transit (Gold Line BRT) health impact assessment (HIA) process and reco
 health impact assessment (HIA) process and reco") Gateway Gold Line Bus Rapid Transit: A Closer Look at Health and Land Use Project Summary May 2016 Introduction Overview This document summarizes the Gateway Gold Line Bus Rapid Transit (Gold Line BRT)
Gateway Gold Line Bus Rapid Transit: A Closer Look at Health and Land Use Project Summary May 2016 Introduction Overview This document summarizes the Gateway Gold Line Bus Rapid Transit (Gold Line BRT)
Operationalizing Accessibility
 Operationalizing Accessibility March 30, 2017 Chris McCahill State Smart Transportation Initiative Matt Pettit Citilabs State Smart Transportation Initiative A network of reform-oriented state DOTs, founded
THESE DAYS IT S HARD TO MISS the story that Americans spend
 WHICH COMES FIRST: THE NEIGHBORHOOD OR THE WALKING? BY SUSAN HANDY AND PATRICIA MOKHTARIAN THESE DAYS IT S HARD TO MISS the story that Americans spend more time stuck in traffic than ever, that they re
Acknowledgements. Ms. Linda Banister Ms. Tracy With Mr. Hassan Shaheen Mr. Scott Johnston
 Acknowledgements The 2005 Household Travel Survey was funded by the City of Edmonton and Alberta Infrastructure and Transportation (AIT). The survey was led by a steering committee comprised of: Dr. Alan
21/02/2018. How Far is it Acceptable to Walk? Introduction. How Far is it Acceptable to Walk?
 21/2/218 Introduction Walking is an important mode of travel. How far people walk is factor in: Accessibility/ Sustainability. Allocating land in Local Plans. Determining planning applications. Previous
Society for Behavioral Medicine, New Orleans, LA. April 12, 2012
 The Impact of the Built Environment and Safe Routes to School-Related Policies on Youth Active Travel in a National Sample of Public Elementary Schools Society for Behavioral Medicine, New Orleans, LA
Midtown Corridor Alternatives Analysis
 Midtown Corridor Alternatives Analysis Ridership Forecast Methodology and Results December 2013 Prepared by the SRF Consulting Group Team for Table of Contents Introduction... 1 Methodology... 1 Assumptions...
Analysis of the Interrelationship Among Traffic Flow Conditions, Driving Behavior, and Degree of Driver s Satisfaction on Rural Motorways
 Analysis of the Interrelationship Among Traffic Flow Conditions, Driving Behavior, and Degree of Driver s Satisfaction on Rural Motorways HIDEKI NAKAMURA Associate Professor, Nagoya University, Department
COLUMBUS AVENUE NEIGHBORHOOD TRANSPORTATION STUDY
 COLUMBUS AVENUE NEIGHBORHOOD TRANSPORTATION STUDY Pedestrian Survey Findings Survey Main Findings: Transit and walking are the main two modes used by both visitors and residents of the area, regardless
Cyclists gaze behavior in urban space: an eye-tracking experiment on bicycle facilities.
 Scientific Seminar SIDT 2015 Torino 15.09.2015 Cyclists gaze behavior in urban space: an eye-tracking experiment on bicycle facilities. Alessandra Mantuano, Silvia Bernardi, Federico Rupi DICAM Department
The Limassol SUMP Planning for a better future. Apostolos Bizakis Limassol, May 16, th Cyprus Sustainable Mobility and ITS conference
 The Limassol SUMP Planning for a better future Apostolos Bizakis Limassol, May 16, 2017 5 th Cyprus Sustainable Mobility and ITS conference Αbout Limassol Αbout Limassol The second largest city in Cyprus
RIDERSHIP PREDICTION
 RIDERSHIP PREDICTION Outline 1. Introduction: route ridership prediction needs and issues. 2. Alternative approaches to route ridership prediction. Professional judgement Survey-based methods Cross-sectional
Integrated Pedestrian Simulation in VISSIM
 Integrated Pedestrian Simulation in VISSIM PTV worldwide MUGS Conference October 30-31, 2008 Wellington Founded > 1979 30 years fast approaching Employees > Approximately 800 persons in the PTV Group worldwide
Parent Survey Report: One School in One Data Collection Period
 Parent Survey Report: One School in One Data Collection Period School Name: Bilquist Elementary School Set ID: 15803 School Group: Clackamas County Month and Year Collected: December 2016 School Enrollment:
Exhibit B: Proposed amendments to the Transportation Element of the Oakland Comprehensive Plan
 Exhibit B: Proposed amendments to the Transportation Element of the Oakland Comprehensive Plan TRANSPORTATION Introduction An important aspect of any community is its transportation system, the means by
Bike Share Social Equity and Inclusion Target Neighborhoods
 Bike Share Social Equity and Inclusion Target Neighborhoods Target Neighborhoods West End/Visitation Park/Academy/Hamilton Heights Wellsgoodfellow/Kingsway West The Ville/Greater Ville Kingsway East/Fountain