TABLE OF CONTENTS TABLE OF CONTENTS... I APPENDICES... III LIST OF EXHIBITS... V LIST OF TABLES... VII LIST OF ABBREVIATED TERMS...
|
|
|
- Dylan Lester Nelson
- 6 years ago
- Views:
Transcription
1
2
3 TABLE OF CONTENTS TABLE OF CONTENTS... I APPENDICES... III LIST OF EXHIBITS... V LIST OF TABLES... VII LIST OF ABBREVIATED TERMS... IX 1 INTRODUCTION Project Overview Analysis Scenarios Study Area Summary of Intersection Analysis Site Access Improvements On Site Parking METHODOLOGIES Level of Service Intersection Capacity Analysis Roadway Segment Capacity Analysis Traffic Signal Warrant Analysis Methodology Thresholds of Significance CEQA Compliance and Documentation AREA CONDITIONS Existing Circulation Network City of Imperial Beach General Plan Circulation Element Transit Service Bicycle & Pedestrian Facilities Existing (2015) Traffic Counts Intersection Operations Analysis Existing Conditions Roadway Segment Capacity Analysis Traffic Signal Warrants Analysis Recommended Improvements PROJECTED FUTURE TRAFFIC Project Trip Generation Project Trip Distribution Modal Split Project Trip Assignment Background Traffic Cumulative Development Traffic Traffic Forecasts E+P TRAFFIC CONDITIONS Roadway Improvements E+P Traffic Volume Forecasts Intersection Operations Analysis Roadway Segment Capacity Analysis Traffic Signal Warrants Analysis TIA Report REV2 i
4 5.6 Project Impacts and Mitigation Measures OPENING YEAR CUMULATIVE (2017) TRAFFIC CONDITIONS Roadway Improvements Opening Year Cumulative (2017) Without Project Traffic Volume Forecasts Opening Year Cumulative (2017) With Project Traffic Volume Forecasts Intersection Operations Analysis Roadway Segment Capacity Analysis Traffic Signal Warrants Analysis Opening Year Cumulative Deficiencies and Recommended Improvements HORIZON YEAR (2040) TRAFFIC CONDITIONS Roadway Improvements Horizon Year (2040) Without Project Traffic Volume Forecasts Horizon Year (2040) With Project Traffic Volume Forecasts Intersection Operations Analysis Roadway Segment Capacity Analysis Traffic Signal Warrants Analysis Horizon Year Deficiencies and Recommended Improvements REFERENCES TIA Report REV2 ii
5 APPENDICES APPENDIX 1.1: APPROVED TRAFFIC STUDY SCOPING AGREEMENT APPENDIX 3.1: EXISTING TRAFFIC COUNTS OCTOBER 2015 APPENDIX 3.2: EXISTING (2015) CONDITIONS INTERSECTION OPERATIONS ANALYSIS WORKSHEETS APPENDIX 3.3: EXISTING (2015) CONDITIONS TRAFFIC SIGNAL WARRANT ANALYSIS WORKSHEETS APPENDIX 5.1: E+P CONDITIONS INTERSECTION OPERATIONS ANALYSIS WORKSHEETS APPENDIX 5.2: E+P CONDITIONS TRAFFIC SIGNAL WARRANT ANALYSIS WORKSHEETS APPENDIX 6.1: OPENING YEAR CUMULATIVE (2017) WITHOUT PROJECT CONDITIONS INTERSECTION OPERATIONS ANALYSIS WORKSHEETS APPENDIX 6.2: OPENING YEAR CUMULATIVE (2017) WITH PROJECT CONDITIONS INTERSECTION OPERATIONS ANALYSIS WORKSHEETS APPENDIX 6.3: OPENING YEAR CUMULATIVE (2017) WITHOUT PROJECT CONDITIONS TRAFFIC SIGNAL WARRANT ANALYSIS WORKSHEETS APPENDIX 6.4: OPENING YEAR CUMULATIVE (2017) WITH PROJECT CONDITIONS TRAFFIC SIGNAL WARRANT ANALYSIS WORKSHEETS APPENDIX 7.1: HORIZON YEAR (2040) WITHOUT PROJECT CONDITIONS INTERSECTION OPERATIONS ANALYSIS WORKSHEETS APPENDIX 7.2: HORIZON YEAR (2040) WITH PROJECT CONDITIONS INTERSECTION OPERATIONS ANALYSIS WORKSHEETS APPENDIX 7.3: HORIZON YEAR (2040) WITHOUT PROJECT CONDITIONS TRAFFIC SIGNAL WARRANT ANALYSIS WORKSHEETS APPENDIX 7.4: HORIZON YEAR (2040) WITH PROJECT CONDITIONS TRAFFIC SIGNAL WARRANT ANALYSIS WORKSHEETS TIA Report REV2 iii
6 This Page Intentionally Left Blank TIA Report REV2 iv
7 LIST OF EXHIBITS EXHIBIT 1 1: PRELIMINARY SITE PLAN... 2 EXHIBIT 1 2: LOCATION MAP... 5 EXHIBIT 3 1: EXISTING NUMBER OF THROUGH LANES AND INTERSECTION CONTROLS EXHIBIT 3 2: CITY OF IMPERIAL BEACH GENERAL PLAN STREET CLASSIFICATIONS EXHIBIT 3 3: EXISTING TRANSIT ROUTES EXHIBIT 3 4: CITY OF IMPERIAL BEACH GENERAL PLAN BIKEWAYS PLAN EXHIBIT 3 5: CITY OF IMPERIAL BEACH GENERAL PLAN ECOROUTE BIKEWAY EXHIBIT 3 6: EXISTING PEDESTRIAN FACILITIES EXHIBIT 3 7: EXISTING (2015) TRAFFIC VOLUMES EXHIBIT 3 8: SUMMARY OF PEAK HOUR INTERSECTION LOS FOR EXISTING (2015) CONDITIONS EXHIBIT 4 1: PROJECT TRIP DISTRIBUTION EXHIBIT 4 2: PROJECT ONLY TRAFFIC VOLUMES EXHIBIT 4 3: CUMULATIVE DEVELOPMENT PROJECTS LOCATION MAP EXHIBIT 4 4: CUMULATIVE DEVELOPMENT ONLY TRAFFIC VOLUMES EXHIBIT 5 1: E+P TRAFFIC VOLUMES EXHIBIT 5 2: SUMMARY OF PEAK HOUR INTERSECTION LOS FOR E+P CONDITIONS EXHIBIT 6 1: OPENING YEAR CUMULATIVE (2017) WITHOUT PROJECT TRAFFIC VOLUMES EXHIBIT 6 2: OPENING YEAR CUMULATIVE (2017) WITH PROJECT TRAFFIC VOLUMES EXHIBIT 6 3: SUMMARY OF PEAK HOUR INTERSECTION LOS FOR OPENING YEAR CUMULATIVE (2017) WITHOUT PROJECT CONDITIONS EXHIBIT 6 4: SUMMARY OF PEAK HOUR INTERSECTION LOS FOR OPENING YEAR CUMULATIVE (2017) WITH PROJECT CONDITIONS EXHIBIT 7 1: HORIZON YEAR (2040) WITHOUT PROJECT TRAFFIC VOLUMES EXHIBIT 7 2: HORIZON YEAR (2040) WITH PROJECT TRAFFIC VOLUMES EXHIBIT 7 3: SUMMARY OF PEAK HOUR INTERSECTION LOS FOR HORIZON YEAR (2040) WITHOUT PROJECT CONDITIONS EXHIBIT 7 4: SUMMARY OF PEAK HOUR INTERSECTION LOS FOR HORIZON YEAR (2040) WITH PROJECT CONDITIONS TIA Report REV2 v
8 This Page Intentionally Left Blank TIA Report REV2 vi
9 LIST OF TABLES TABLE 1 1: INTERSECTION ANALYSIS LOCATIONS... 4 TABLE 1 2: ROADWAY SEGMENT ANALYSIS LOCATIONS... 6 TABLE 1 3: SUMMARY OF INTERSECTION LEVEL OF SERVICE... 7 TABLE 1 4: SUMMARY OF ROADWAY SEGMENT LEVEL OF SERVICE... 8 TABLE 2 1: SIGNALIZED INTERSECTION LOS THRESHOLDS TABLE 2 2: UNSIGNALIZED INTERSECTION LOS THRESHOLDS TABLE 2 3: ROADWAY SEGMENT CAPACITY (ADT METHOD) LOS THRESHOLDS TABLE 2 4: ROADWAY SEGMENT CAPACITY (FLORIDA METHOD) LOS THRESHOLDS TABLE 3 1: INTERSECTION ANALYSIS FOR EXISTING (2015) CONDITIONS TABLE 3 2: ROADWAY SEGMENT VOLUME/CAPACITY ANALYSIS FOR EXISTING (2015) CONDITIONS.. 31 TABLE 4 1: PROJECT TRIP GENERATION RATES & TRIP GENERATION SUMMARY TABLE 4 2: CUMULATIVE DEVELOPMENT LAND USE SUMMARY TABLE 5 1: INTERSECTION ANALYSIS FOR E+P CONDITIONS TABLE 5 2: ROADWAY SEGMENT VOLUME/CAPACITY ANALYSIS FOR E+P CONDITIONS TABLE 6 1: INTERSECTION ANALYSIS FOR OPENING YEAR CUMULATIVE (2017) CONDITIONS TABLE 6 2: ROADWAY SEGMENT VOLUME/CAPACITY ANALYSIS (ADT METHOD) FOR OPENING YEAR CUMULATIVE (2017) CONDITIONS TABLE 6 3: ROADWAY SEGMENT VOLUME/CAPACITY ANALYSIS (FLORIDA METHOD) FOR OPENING YEAR CUMULATIVE (2017) CONDITIONS TABLE 7 1: INTERSECTION ANALYSIS FOR HORIZON YEAR (2040) CONDITIONS TABLE 7 2: ROADWAY SEGMENT VOLUME/CAPACITY ANALYSIS FOR HORIZON YEAR (2040) CONDITIONS TABLE 7 3: ROADWAY SEGMENT VOLUME/CAPACITY ANALYSIS (FLORIDA METHOD) FOR HORIZON YEAR (2040) CONDITIONS TIA Report REV2 vii
10 This Page Intentionally Left Blank TIA Report REV2 viii
11 LIST OF ABBREVIATED TERMS (1) Reference ADT Average Daily Traffic Caltrans California Department of Transportation CEQA California Environmental Quality Act CFR Code of Federal Regulations CMP Congestion Management Program E+P Existing Plus Project FDOT State of Florida Department of Transportation FHWA Federal Highway Administration HCM Highway Capacity Manual ITE Institute of Transportation Engineers LOS Level of Service MTS Metropolitan Transit System MUTCD Manual on Uniform Traffic Control Devices NA Not Applicable NP No Project (or Without Project) PHF Peak Hour Factor Project Imperial Beach Resort SANDAG San Diego Association of Governments SANTEC San Diego Traffic Engineers Council sf Square Feet TIS Traffic Impact Study V/C Volume to capacity WP With Project TIA Report REV2 ix
12 This Page Intentionally Left Blank TIA Report REV2 x
13 1 INTRODUCTION This report presents the results of the traffic impact study (TIS) for the proposed Imperial Beach Resort development ( Project ) located west of Seacoast Drive between Imperial Beach Boulevard and Ebony Avenue in the City of Imperial Beach as shown on Exhibit 1-1. The purpose of this traffic impact analysis is to evaluate the potential circulation system deficiencies that may result from the development of the proposed Project, and to recommend improvements to achieve acceptable circulation system operational conditions. This traffic study has been prepared in accordance with the San Diego Traffic Engineers Council (SANTEC) /Institute of Transportation Engineers (ITE) Guidelines for Traffic Impact Studies in the San Diego Region and consultation with City of Imperial Beach staff during the scoping process. (1) The approved Project Traffic Study Scoping agreement is provided in Appendix 1.1 of this TIS. 1.1 PROJECT OVERVIEW It is our understanding that the Project is to consist of 100 hotel rooms, 4,937 square feet (sf) of quality restaurant, and 1,971 square feet of retail uses as part of the hotel (e.g., gift shop). An Opening Year of 2017 will be used for the purposes of this TIS. Vehicular access will be provided via the western extension of Imperial Beach Boulevard, west of Seacoast Drive (see Exhibit 1-1). Regional access to the site is provided via the I-5 Freeway at the Imperial Beach Boulevard interchange. Trips generated by the Project s proposed land uses have been estimated based on trip generation rates collected by the San Diego Association of Governments (SANDAG) (Not So) Brief Guide of Vehicular Traffic Generation Rates for the San Diego Region. (2) The Project is estimated to generate a net total of 1,494 trip-ends per day, with 65 AM peak hour trips and 120 PM peak hour trips. The assumptions and methods used to estimate the Project s trip generation characteristics are discussed in greater detail in Section 4.1 Project Trip Generation of this report. 1.2 ANALYSIS SCENARIOS For the purposes of this traffic study, potential impacts to traffic and circulation have been assessed for each of the following conditions: Existing (2015) (1 scenario) Existing plus Project (E+P), Without and With Indian Street Bridge (2 scenarios) Opening Year Cumulative (2017), Without and With Project (2 scenarios) Horizon Year (2040), Without and With Project (2 scenarios) TIA Report REV2 1 1


14 2
15 1.2.1 EXISTING (2015) CONDITIONS Information for Existing (2015) conditions is disclosed to represent the baseline traffic conditions as they existed at the time this report was prepared EXISTING PLUS PROJECT CONDITIONS The Existing plus Project (E+P) analysis determines circulation system deficiencies that would occur on the existing roadway system in the scenario of the Project being placed upon Existing conditions OPENING YEAR CUMULATIVE (2017) CONDITIONS To account for background traffic, other known cumulative development projects in the study area were included in addition to 4.04% of ambient growth for Opening Year Cumulative traffic conditions in conjunction with traffic associated with the proposed Project. Although it is unlikely that these cumulative projects would be fully built and occupied by Year 2017, they have been included in an effort to conduct a conservative analysis and overstate and opposed to understate potential cumulative traffic impacts HORIZON YEAR (2040) CONDITIONS The Horizon Year (2040) With Project traffic conditions were derived from an average of the regional growth forecasts for the San Diego Region for population, housing, and employment. The traffic forecasts reflect the area-wide growth anticipated between Existing conditions and Horizon Year conditions. The Horizon Year With Project traffic forecasts were determined by adding the Project traffic to the Horizon Year Without Project traffic forecasts. The SANDAG Series 13 Regional Growth Forecasts for the San Diego Region identifies projected growth in population of 3,143,429 in 2012 to 4,068,759 in 2050, or a percent increase over the 38-year period. (3) The change in population equates to roughly a 0.68 percent growth rate, compounded annually. Similarly, growth over the same 38-year period in households is projected to increase by percent, or 0.65 percent annual growth rate. Finally, growth in employment over the same 38-year period is projected to increase by percent, or a 0.73 percent annual growth rate. Based on a comparison of Existing traffic volumes to the Horizon Year (2040) forecasts, the average growth rate is estimated at approximately 2.17 percent per year, compounded annually between Existing and Horizon Year traffic conditions. The annual growth rate at each individual intersection is not lower than 1.41 percent per year, compounded annually to as high as 2.68 percent per year, compounded annually over the same time period. Therefore, the annual growth rate utilized for the purposes of this analysis would appear to conservatively approximate the anticipated regional growth in traffic volumes in the City of Imperial Beach for both Opening Year Cumulative and Horizon Year traffic conditions, especially when considered along with the addition of project-related traffic. As such, the growth in traffic volumes assumed in this traffic impact analysis would tend to overstate as opposed to understate the potential impacts to traffic and circulation TIA Report REV2 3 3
16 1.3 STUDY AREA To ensure that this TIS satisfies the SANTEC TIS requirements, Urban Crossroads, Inc. prepared a Project traffic study scoping package for review by City of Imperial Beach staff prior to the preparation of this report. The scoping agreement provides an outline of the Project study area, trip generation, trip distribution, and analysis methodology and is included in Appendix INTERSECTIONS The following 6 study area intersections listed in Table 1-1 and shown on Exhibit 1-2 were selected for this TIS based on the SANTEC TIS guidelines and consultation with City of Imperial Beach staff. The study area includes intersections where the Project is anticipated to contribute 50 or more peak hour trips per TIS guidelines. (1) TABLE 1-1: INTERSECTION ANALYSIS LOCATIONS ID Intersection Location Jurisdiction 1 Seacoast Drive / Palm Avenue City of Imperial Beach 2 Seacoast Drive / Elm Avenue City of Imperial Beach 3 Seacoast Drive / Ebony Avenue City of Imperial Beach 4 Seacoast Drive / Imperial Beach Boulevard City of Imperial Beach 5 3 rd Street / Palm Avenue City of Imperial Beach 6 3 rd Street / Imperial Beach Boulevard City of Imperial Beach The intent of a Congestion Management Program (CMP) is to more directly link land use, transportation, and air quality, thereby prompting reasonable growth management programs that will effectively utilize new transportation funds, alleviate traffic congestion and related impacts, and improve air quality. Counties within California have developed CMPs with varying methods and strategies to meet the intent of the CMP legislation. The County of San Diego CMP became effective with the passage of Proposition 111 in 1990 and provided regular updates for the state CMP from However, in October 2009, the San Diego region elected to be exempt from the State CMP and since 2009, SANDAG has been abiding by 23 CFR to ensure the region s continued compliance with the federal congestion management process TIA Report REV2 4 4
17 5
18 1.3.2 ROADWAY SEGMENTS The roadway segment study area utilized for this analysis is based on a review of the key roadway segments in which the Project is anticipated to contribute 50 or more peak hour trips. The study area identifies a total of 10 existing/future roadway segments. The roadway segments include the segments on either side of the study area intersections and are listed in Table 1-2. TABLE 1-2: ROADWAY SEGMENT ANALYSIS LOCATIONS ID Street Segment Jurisdiction 1 South of Palm Avenue City of Imperial Beach 2 North of Elm Avenue City of Imperial Beach 3 Seacoast Drive Between Elm Avenue and Ebony Avenue City of Imperial Beach 4 Between Ebony Avenue and Imperial Beach Boulevard City of Imperial Beach 5 Between Seacoast Drive and 3 rd Street City of Imperial Beach Palm Avenue 6 East of 3 rd Street City of Imperial Beach 7 Elm Avenue East of Seacoast Drive City of Imperial Beach 8 Ebony Avenue East of Seacoast Drive City of Imperial Beach 9 Imperial Beach Between Seacoast Drive and 3 rd Street City of Imperial Beach 10 Boulevard East of 3 rd Street City of Imperial Beach 1.4 SUMMARY OF INTERSECTION ANALYSIS A summary of the peak hour intersection level of service (LOS) is provided on Table 1-3 for each of the analysis scenarios and on Table 1-4 for the study area roadway segments. As shown on Table 1-3 and Table 1-4, study area intersections and roadway segments are anticipated to operate at acceptable LOS for all analysis scenarios. This section provides a summary of the analysis results for Existing, E+P, Opening Year Cumulative, and Horizon Year traffic conditions INTERSECTIONS Existing (2015) Conditions For Existing traffic conditions, all the study area intersections were found to operate at an acceptable LOS based on the City of Imperial Beach s LOS standard. E+P Conditions For E+P traffic conditions, all the study area intersections were found to operate at an acceptable LOS based on the City of Imperial Beach s LOS standard TIA Report REV2 6 6
19 Table 1 3 Summary of Intersection Level of Service Delay 1 Level of Delay 1 Level of Delay 1 Level of Delay 1 Level of Delay 1 Level of Delay 1 Level of (secs.) Service (secs.) Service (secs.) Service (secs.) Service (secs.) Service (secs.) Service # Intersection AM PM AM PM AM PM AM PM AM PM AM PM AM PM AM PM AM PM AM PM AM PM AM PM 1 Seacoast Dr. / Palm Av A A A A A B A B A B A B 2 Seacoast Dr. / Elm Av B B B B B B B B B B B B 3 Seacoast Dr. / Ebony Av A B B B B B B B B B B B 4 Seacoast Dr. / Imperial Beach Bl A A A A A A A A A A 9 10 A B 5 3rd St. / Palm Av B B B B B C C C C C C C 6 3rd St. / Imperial Beach Bl A A A A A B A B A B A B 1 Existing E+P 2017 Without Project 2017 With Project Per the 2010 Highway Capacity Manual, overall average intersection delay and level of service are shown for intersections with a traffic signal or all way stop control. For intersections with cross street stop control, the delay and level of service for the worst individual movement (or movements sharing a single lane) are shown Without Project 2040 With Project 7
20 Table 1 4 Summary of Roadway Segment Level of Service Significant Acceptable # Roadway Segment Limits V/C LOS V/C LOS V/C LOS V/C LOS V/C LOS V/C LOS Impact? 2 LOS 0.63 B 0.71 C 0.93 E 1.02 F 1.02 F 1.10 F No 3 D 0.23 C 0.24 C 0.27 C 0.45 C No D 0.56 A 0.65 B 0.80 C 0.88 D 0.88 D 0.96 E No 3 D 0.39 C 0.43 C No D 3 Between Elm Av. and Ebony Av A 0.59 A 0.69 B 0.79 C 0.76 C 0.86 D No D 4 Between Ebony Av. and Imperial Beach Bl A 0.53 A 0.56 A 0.66 B 0.62 B 0.72 C No D 5 Between Seacoast Dr. and 3rd St A 0.35 A 0.49 A 0.54 A 0.53 A 0.58 A No D 6 Seacoast Dr. Palm Av. South of Palm Av. South of Palm Av. (Florida Method) NA North of Elm Av. East of 3rd St D 0.86 D 1.10 F 1.15 F 1.22 F 1.26 F No 3 D East of 3rd St. (Florida Method) NA NA 0.75 D 0.79 D 0.85 D 0.87 D No D 7 Elm Av. East of Seacoast Dr A 0.35 A 0.48 A 0.52 A 0.53 A 0.56 A No D 8 Ebony Av. East of Seacoast Dr A 0.15 A 0.22 A 0.25 A 0.23 A 0.27 A No D 9 Between Seacoast Dr. and 3rd St A 0.30 A 0.31 A 0.35 A 0.34 A 0.39 A No D Imperial Beach Bl. 10 East of 3rd St A 0.51 A 0.53 A 0.57 A 0.59 A 0.64 B No D BOLD = LOS does not meet the applicable jurisdictional requirements (i.e., unacceptable LOS). Existing (2015) E+P 2017 NP North of Elm Av. (Florida Method) NA NA 2017 WP 2040 NP 1 These maximum roadway capacities have been extracted from the following source: SANTEC/ITE Guidelines for Traffic Impact Studies [TIS] in the San Diego Region (Table 2) for NA NA NA each road facility type. These roadway capacities are "rule of thumb" estimates for planning purposes. The LOS "E" service volumes are estimated maximum daily capacity for respective classifications. By using the LOS "E" capacity for each roadway facility type, volume to capacity (v/c) values between will represent LOS "A", will represent LOS "B", will represent LOS "C", will represent LOS "D", will represent LOS "E", and v/c values greater than 1.00 will represent LOS "F" operations. Capacity is affected by such factors as intersections (spacing, configuration and control features), degree of access control, roadway grades, design geometrics (horizontal and vertical alignment standards), sight distance, vehicle mix (truck and bus traffic) and pedestrian and bicycle traffic WP A project is determined to significantly impact either a roadway segment or intersection if the addition of the project generated trips results in a change in LOS from acceptable to unacceptable. However, if a roadway segment is operating at an unacceptable LOS E or F prior to the addition of the project generated traffic, then a significant impact is identified if the V/C increases by 0.02 or more on a deficient roadway segment. 2 Although the roadway segment is anticipated to increase by a V/C of more than 0.02 due to the addition of Project traffic, the Florida method demonstrates acceptable LOS without additional widening. As such, additional widening has not been recommended. 3 8
21 Opening Year Cumulative (2017) Conditions For Opening Year Cumulative Without and With Project traffic conditions, all the study area intersections were found to operate at an acceptable LOS based on the City of Imperial Beach s LOS standard. Horizon Year (2040) Conditions For Horizon Year Without and With Project traffic conditions, all the study area intersections were found to operate at an acceptable LOS based on the City of Imperial Beach s LOS standard ROADWAY SEGMENTS Existing (2015) Conditions Based on the recommended daily roadway thresholds identified in the San Diego Street Design Manual, all the study roadway segments are anticipated to operate at acceptable LOS for Existing traffic conditions. E+P Conditions Based on the recommended daily roadway thresholds identified in the San Diego Street Design Manual, all the study roadway segments are anticipated to operate at acceptable LOS for E+P traffic conditions. Opening Year Cumulative (2017) Conditions Based on the recommended daily roadway thresholds identified in the San Diego Street Design Manual, all the study roadway segments are anticipated to operate at acceptable LOS for Opening Year Cumulative Without Project traffic conditions, with the exception of the following roadway segments: ID Street Segment 1 Seacoast Drive South of Palm Avenue LOS E 6 Palm Avenue East of 3 rd Street LOS F There are no additional roadway segments anticipated to operate at unacceptable LOS, with the addition of Project traffic for Opening Year Cumulative With Project traffic conditions, in addition to those identified for Opening Year Cumulative Without Project traffic conditions. These deficient roadway segments have been reevaluated using the Florida Method (based on peak hour volumes). Using the Florida Method, these segments are anticipated to operate at an acceptable LOS. As such, widening has not been recommended for these segments. Horizon Year (2040) Conditions Based on the recommended daily roadway thresholds identified in the San Diego Street Design Manual, there are no additional roadway segments anticipated to operate at an unacceptable TIA Report REV2 9 9
22 LOS for Horizon Year Without Project traffic conditions, in addition to those previously identified under Opening Year Cumulative (2017) traffic conditions. The following additional roadway segment is anticipated to operate at unacceptable LOS with the addition of Project traffic for Horizon Year With Project traffic conditions: ID Street Segment 2 Seacoast Drive North of Elm Avenue LOS E These deficient roadway segments have been reevaluated using the Florida Method (based on peak hour volumes). Using the Florida Method, these segments are anticipated to operate at an acceptable LOS. As such, widening has not been recommended for these segments. 1.5 SITE ACCESS IMPROVEMENTS Vehicular and will be provided via the western extension of Imperial Beach Boulevard, west of Seacoast Drive (see Exhibit 1-1). Regional access to the site is provided via the I-5 Freeway at the Imperial Beach Boulevard interchange SITE ADJACENT ROADWAY IMPROVEMENTS Roadway improvements necessary to provide site access and on-site circulation are assumed to be constructed in conjunction with site development and are described below. These improvements are required to be in place prior to occupancy. Construction of on-site and site adjacent improvements are recommended to occur in conjunction with adjacent Project development activity or as needed for Project access purposes. Seacoast Drive Seacoast Drive is a north-south oriented roadway located along the Project s eastern boundary. Seacoast Drive is currently built out at its ultimate full-section width as 2- lane collector along the Project s frontage, in compliance with applicable City of Imperial Beach standards. Wherever necessary, roadways adjacent to the Project, site access points and site-adjacent intersections will be constructed to be consistent with or within the recommended roadway classifications and respective cross-sections in the City of Imperial Beach General Plan Circulation Element SITE ACCESS IMPROVEMENTS The recommended site access driveway improvements for the Project are described below. Construction of on-site and site adjacent improvements shall occur in conjunction with adjacent Project development activity or as needed for Project access purposes. Seacoast Drive / Imperial Beach Boulevard (#4) Maintain the existing all-way (4-way) stop control and the existing intersection geometrics: Northbound Approach: One shared left-through-right turn lane. Southbound Approach: One shared left-through-right turn lane TIA Report REV
23 Eastbound Approach: One shared left-through-right turn lane. Westbound Approach: One left turn lane, one through lane, and one defacto right turn lane. On-site traffic signing and striping should be implemented in conjunction with detailed construction plans for the Project site. Sight distance at each project access point should be reviewed with respect to standard Caltrans and City of Imperial Beach sight distance standards at the time of preparation of final grading, landscape and street improvement plans. 1.6 ON-SITE PARKING A parking evaluation has also been prepared to calculate the number of parking space requirements based on the proposed land uses per the City s Municipal Code , evaluate the applicable reductions for vertical mixed use based on discussions with City staff, and provide a qualitative assessment of employee and guest parking for the site. A detailed parking study is being prepared for the proposed Project; however, it is our understating that the parking study has not yet been completed at the time of this traffic study. It is our understanding that the Project complies with the City s Municipal Code and provides adequate parking based on the proposed 100 room hotel TIA Report REV
24 This Page Intentionally Left Blank TIA Report REV
25 2 METHODOLOGIES This section of the report presents the methodologies used to perform the traffic analyses summarized in this report. The methodologies described are generally consistent with SANTEC TIS guidelines. (1) 2.1 LEVEL OF SERVICE Traffic operations of roadway facilities are described using the term "Level of Service" (LOS). LOS is a qualitative description of traffic flow based on several factors such as speed, travel time, delay, and freedom to maneuver. Six levels are typically defined ranging from LOS A, representing completely free-flow conditions, to LOS F, representing breakdown in flow resulting in stop-and-go conditions. LOS E represents operations at or near capacity, an unstable level where vehicles are operating with the minimum spacing for maintaining uniform flow. 2.2 INTERSECTION CAPACITY ANALYSIS The definitions of LOS for interrupted traffic flow (flow restrained by the existence of traffic signals and other traffic control devices) differ slightly depending on the type of traffic control. The LOS is typically dependent on the quality of traffic flow at the intersections along a roadway. The Highway Capacity Manual (HCM) methodology expresses the LOS at an intersection in terms of delay time for the various intersection approaches. (4) The HCM uses different procedures depending on the type of intersection control SIGNALIZED INTERSECTIONS City of Imperial Beach The City of Imperial Beach requires signalized intersection operations analysis based on the methodology described in the HCM. (4) Intersection LOS operations are based on an intersection s average control delay. Control delay includes initial deceleration delay, queue move-up time, stopped delay, and final acceleration delay. For signalized intersections LOS is directly related to the average control delay per vehicle and is correlated to a LOS designation as described in Table 2-1. Study area intersections have been evaluated using the Synchro (Version 9.1 Build 904) analysis software package. Synchro is a macroscopic traffic software program that is based on the signalized intersection capacity analysis as specified in the HCM. Macroscopic level models represent traffic in terms of aggregate measures for each movement at the study intersections. Equations are used to determine measures of effectiveness such as delay and queue length. The level of service and capacity analysis performed by Synchro takes into consideration optimization and coordination of signalized intersections within a network TIA Report REV
26 TABLE 2-1: SIGNALIZED INTERSECTION LOS THRESHOLDS Description Operations with very low delay occurring with favorable progression and/or short cycle length. Operations with low delay occurring with good progression and/or short cycle lengths. Operations with average delays resulting from fair progression and/or longer cycle lengths. Individual cycle failures begin to appear. Operations with longer delays due to a combination of unfavorable progression, long cycle lengths, or high V/C ratios. Many vehicles stop and individual cycle failures are noticeable. Operations with high delay values indicating poor progression, long cycle lengths, and high V/C ratios. Individual cycle failures are frequent occurrences. This is considered to be the limit of acceptable delay. Operation with delays unacceptable to most drivers occurring due to over saturation, poor progression, or very long cycle lengths Source: HCM Average Control Delay (Seconds), V/C 1.0 Level of Service, V/C 1.0 Level of Service, V/C > to A F to B F to C F to D F to E F and up F F The peak hour traffic volumes have been adjusted using a peak hour factor (PHF) to reflect peak 15 minute volumes. Common practice for LOS analysis is to use a peak 15-minute rate of flow. However, flow rates are typically expressed in vehicles per hour. The PHF is the relationship between the peak 15-minute flow rate and the full hourly volume (e.g. PHF = [Hourly Volume] / [4 x Peak 15-minute Flow Rate]). The use of a 15-minute PHF produces a more detailed analysis as compared to analyzing vehicles per hour. Existing PHFs have been used for all analysis scenarios. Per the HCM, PHF values over 0.95 often are indicative of high traffic volumes with capacity constraints on peak hour flows while lower PHF values are indicative of greater variability of flow during the peak hour. (4) UNSIGNALIZED INTERSECTIONS The City of Imperial Beach requires the operations of unsignalized intersections be evaluated using the methodology described the HCM. (4) The LOS rating is based on the weighted average control delay expressed in seconds per vehicle (see Table 2-2). At two-way or side-street stop-controlled intersections, LOS is calculated for each controlled movement and for the left turn movement from the major street, as well as for the intersection as a whole. For approaches composed of a single lane, the delay is computed as the average of all movements in that lane. For all-way stop controlled intersections, LOS is computed for the intersection as a whole TIA Report REV
27 TABLE 2-2: UNSIGNALIZED INTERSECTION LOS THRESHOLDS Description Average Control Delay Per Vehicle (Seconds) Level of Service, V/C 1.0 Level of Service, V/C > 1.0 Little or no delays. 0 to A F Short traffic delays to B F Average traffic delays to C F Long traffic delays to D F Very long traffic delays to E F Extreme traffic delays with intersection capacity exceeded. > F F Source: HCM 2.3 ROADWAY SEGMENT CAPACITY ANALYSIS ROADWAY SEGMENT CAPACITY ANALYSIS (ADT METHOD) Roadway segment operations have been evaluated using the City of San Diego Street Design Manual. (1) Per the TIS guidelines, the daily roadway segment capacities for each type of roadway are summarized in Table 2-3. TABLE 2-3: ROADWAY SEGMENT CAPACITY (ADT METHOD) LOS THRESHOLDS 1 Facility Type Level of Service Capacity 1 A B C D E Two Lanes Divided 4,000 5,500 7,500 9,000 10,000 Two Lanes Undivided 2,500 3,500 5,000 6,500 8,000 Residential , These maximum roadway capacities have been extracted from Table 2 of the SANTEC/ITE Guidelines for TIS in the San Diego Region. These roadway capacities are "rule of thumb" estimates for planning purposes. The LOS "E" service volumes are estimated maximum daily capacity for respective roadway classifications. Capacity is affected by such factors as intersections (spacing, configuration and control features), degree of access control, roadway grades, design geometrics (horizontal and vertical alignment standards), sight distance, vehicle mix (truck and bus traffic) and pedestrian and bicycle traffic. As noted in the SANTEC TIS guidelines, these roadway capacities are rule of thumb estimates for planning purposes and are affected by such factors as intersections (spacing, configuration and control features), degree of access control, roadway grades, design geometrics (horizontal and vertical alignment standards), sight distance, vehicle mix (truck and bus traffic) and pedestrian bicycle traffic. In other words, while using average daily traffic (ADT) for planning purposes is suitable with regards to evaluating potential volume to capacity with future forecasts, it is not suitable for operational analysis because it does not account for the factors listed previously. As such, where the ADT based roadway segment analysis indicates a deficiency (unacceptable LOS), a review of the more detailed peak hour intersection analysis and progression analysis are undertaken. The more detailed peak hour intersection analysis explicitly accounts for factors that affect roadway capacity. Therefore, roadway segment widening is typically only recommended if the peak hour intersection analysis indicates the need for additional through lanes TIA Report REV
28 2.3.2 ROADWAY SEGMENT CAPACITY ANALYSIS (FLORIDA METHOD) Roadway segments anticipated to operate at a deficient LOS using the ADT method have been reevaluated using the Florida Department of Transportation s Quality/Level of Service Handbook. (5) Per the TIS guidelines, the daily roadway segment capacities for each type of roadway are summarized in Table 2-4. TABLE 2-4: ROADWAY SEGMENT CAPACITY (FLORIDA METHOD) LOS THRESHOLDS 1 Facility Type Level of Service Capacity 1 A B C D E Two Lanes Divided ,260 1,344 Two Lanes Undivided ,200 1,280 1 These maximum roadway capacities have been extracted from Table 5 of the 2013 Quality/Level of Service Handbook from the State of Florida Department of Transportation. These roadway capacities are "rule of thumb" estimates for planning purposes. The LOS "E" service volumes are estimated maximum peak hour capacity for respective roadway classifications. Capacity is affected by such factors as intersections (spacing, configuration and control features), degree of access control, roadway grades, design geometrics (horizontal and vertical alignment standards), sight distance, vehicle mix (truck and bus traffic) and pedestrian and bicycle traffic. LOS A and B do not exist for this classification of roadway utilizing the Florida Method. In addition to the roadway segment capacity analysis (ADT Method), roadway segment capacity analysis is performed based on the Florida method as a secondary analysis to access the roadway segment condition. This method is based on the peak hour segment volume comparison with the threshold capacities. As the worst case condition occurs during the AM and PM peak hours, this method is used as a reasonable way to evaluate the LOS of the segment and to determine if any roadway segment widening is necessary. 2.4 TRAFFIC SIGNAL WARRANT ANALYSIS METHODOLOGY The term "signal warrants" refers to the list of established criteria used by Caltrans and other public agencies to quantitatively justify or ascertain the potential need for installation of a traffic signal at an otherwise unsignalized intersection. This TIS uses the signal warrant criteria presented in the latest edition of the Federal Highway Administration s (FHWA) Manual on Uniform Traffic Control Devices (MUTCD), as amended by the MUTCD 2014 California Supplement, for all study area intersections. (6) The signal warrant criteria for Existing study area intersections are based upon several factors, including volume of vehicular and pedestrian traffic, frequency of accidents, and location of school areas. Both the FHWA s MUTCD and the MUTCD 2014 California Supplement indicate that the installation of a traffic signal should be considered if one or more of the signal warrants are met. (6) Specifically, this TIS utilizes the Peak Hour Volume-based Warrant 3 as the appropriate representative traffic signal warrant analysis for existing traffic conditions. Warrant 3 criteria are basically identical for both the FHWA s MUTCD and the MUTCD 2014 California Supplement. Warrant 3 is appropriate to use for this TIS because it provides specialized warrant criteria for intersections with rural characteristics (e.g. located in communities with populations of less than 10,000 persons or with adjacent major streets TIA Report REV
29 operating above 40 miles per hour). For the purposes of this study, the speed limit was the basis for determining whether Urban or Rural warrants were used for a given intersection. Future unsignalized intersections, that currently do not exist, have been assessed regarding the potential need for new traffic signals based on future average daily traffic (ADT) volumes, using the Caltrans planning level ADT-based signal warrant analysis worksheets. Traffic signal warrant analyses were performed for all unsignalized study area intersections during the peak weekday conditions wherein the Project is anticipated to contribute the highest trips. The Existing conditions traffic signal warrant analysis is presented in the subsequent section, Section 3 Area Conditions of this report. The traffic signal warrant analyses for future conditions are presented in Section 5 E+P Traffic Analysis, Section 6 Opening Year Cumulative (2017) Traffic Analysis, and Section 7 Horizon Year (2040) Traffic Analysis of this report. It is important to note that a signal warrant defines the minimum condition under which the installation of a traffic signal might be warranted. Meeting this threshold condition does not require that a traffic control signal be installed at a particular location, but rather, that other traffic factors and conditions be evaluated in order to determine whether the signal is truly justified. It should also be noted that signal warrants do not necessarily correlate with LOS. An intersection may satisfy a signal warrant condition and operate at or above acceptable LOS or operate below acceptable LOS and not meet a signal warrant. 2.5 THRESHOLDS OF SIGNIFICANCE The definition of an intersection/roadway segment deficiency has been obtained from each of the applicable surrounding jurisdictions. The following thresholds of significance will be utilized to determine if the addition of project-related traffic will result in significant impacts, and whether the implementation of the recommended feasible improvements would result in exceeding the LOS thresholds for each applicable jurisdiction CITY OF IMPERIAL BEACH A Project is determined to significantly impact either a roadway segment or intersection if the addition of the project-generated trips results in a change in LOS from acceptable to unacceptable. However, if an intersection is operating at an unacceptable LOS E or F prior to the addition of the project-generated traffic, then a significant impact is identified as follows: An increase in delay of more than 2.0 seconds at a deficient intersection would result in a significant impact. An increase to the volume to capacity (v/c) of 0.02 on a deficient roadway segment would result in a significant impact. 2.6 CEQA COMPLIANCE AND DOCUMENTATION This section outlines the methodology used in this analysis related to identifying circulation system deficiencies. The following types of traffic deficiencies are considered to be significant under the California Environmental Quality Act (CEQA): TIA Report REV
30 When project traffic, added to existing traffic, will deteriorate the LOS to below the target LOS. When cumulative traffic exceeds the target LOS TIA Report REV
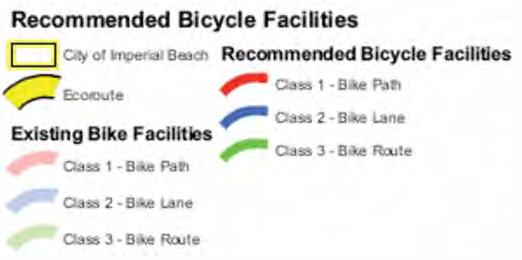
31 3 AREA CONDITIONS This section provides a summary of the existing circulation network, the City of Imperial Beach General Plan Circulation Network, and a review of existing peak hour intersection operations, roadway segment, and traffic signal warrant analyses. 3.1 EXISTING CIRCULATION NETWORK Pursuant to the agreement with City of Imperial Beach staff (Appendix 1.1), the study area includes a total of 6 existing and future intersections as shown previously on Exhibit 1-2 where the Project is anticipated to contribute 50 or more peak hour trips. Exhibit 3-1 illustrates the study area intersections located near the proposed Project and identifies the number of through traffic lanes for existing roadways and intersection traffic controls. 3.2 CITY OF IMPERIAL BEACH GENERAL PLAN CIRCULATION ELEMENT As noted previously, the Project site is located within the City of Imperial Beach CITY OF IMPERIAL BEACH The roadway classifications and planned (ultimate) roadway cross-sections of the major roadways within the study area, as identified on the City of Imperial Beach General Plan Street Classifications. Exhibit 3-2 shows the City of Imperial Beach General Plan Street Classifications. 3.3 TRANSIT SERVICE The study area is currently served by the San Diego Metropolitan Transit System (MTS), a public transit agency serving the San Diego region. As shown on Exhibit 3-3, there is currently 1 existing bus route that serves the roadways within the study area in close proximity to the proposed Project. MTS Route 934 serves Palm Avenue, Seacoast Drive, and Imperial Beach Boulevard. Transit service is reviewed and updated by MTS periodically to address ridership, budget and community demand needs. Changes in land use can affect these periodic adjustments which may lead to either enhanced or reduced service where appropriate. 3.4 BICYCLE & PEDESTRIAN FACILITIES In an effort to promote alternative modes of transportation, the City of Imperial Beach also includes a bikeway system. The City of Imperial Beach bikeway system are shown on Exhibit 3-4 and EcoRoute Bikeways are shown on Exhibit 3-5. There are Class II bike lanes striped along Imperial Beach Boulevard near the vicinity of the proposed Project and Class III bike routes are accommodated along Seacoast Drive near the vicinity of the proposed Project. Class II bike lanes are striped on the road and Class III bike lanes are on-road shared lanes with vehicular traffic. Typically, Class III bike lanes are signed, but not striped TIA Report REV
32 20
33 21
34 22

35 23
36 24
37 Field observations conducted in September 2015 indicate pedestrian and bicycle activity within the study area. Exhibit 3-6 illustrates the existing pedestrian facilities, including crosswalk locations and bus stop locations. Most if not all of the study area roadways include sidewalks and curb and gutter improvements. 3.5 EXISTING (2015) TRAFFIC COUNTS The intersection LOS analysis is based on the traffic volumes observed during the peak hour conditions using traffic count data collected in October The following peak hours were selected for analysis: Weekday AM Peak Hour (peak hour between 7:00 AM and 9:00 AM) Weekday PM Peak Hour (peak hour between 4:00 PM and 6:00 PM) The weekday AM and weekday PM peak hour count data is representative of typical weekday peak hour traffic conditions in the study area. There were no observations made in the field that would indicate atypical traffic conditions on the count dates, such as construction activity or detour routes and near-by schools were in session and operating on normal schedules. The raw manual peak hour turning movement traffic count data sheets are included in Appendix 3.1. These raw turning volumes have been flow conserved between intersections with limited access, no access and where there are currently no uses generating traffic (e.g., between rampto-arterial intersections, etc.). Existing weekday average daily traffic (ADT) volumes on arterial highways throughout the study area are shown on Exhibit 3-7. Existing ADTs are based on actual 24-hour tube count data collected in the field (see Appendix 3.1). Existing weekday AM and weekday PM peak hour intersection volumes are also shown on Exhibit INTERSECTION OPERATIONS ANALYSIS Existing peak hour traffic operations have been evaluated for the study area intersections based on the analysis methodologies presented in Section 2.2 Intersection Capacity Analysis of this report. The intersection operations analysis results are summarized in Table 3-1 which indicates that the existing study area intersections are currently operating at an acceptable LOS during the peak hours (i.e., LOS B or better). Consistent with Table 3-1, a summary of the peak hour intersection LOS for Existing conditions are shown on Exhibit 3-8. The intersection operations analysis worksheets are included in Appendix 3.2 of this TIS TIA Report REV

38 26
39 27
40 28
41 Table 3 1 Intersection Analysis for Existing (2015) Conditions Intersection Approach Lanes 1 Delay 2 Level of Traffic Northbound Southbound Eastbound Westbound (secs.) Service Acceptable # Intersection Control 3 L T R L T R L T R L T R AM PM AM PM LOS 1 Seacoast Dr. / Palm Av. AWS 0 1 d A A D 2 Seacoast Dr. / Elm Av. CSS B B D 3 Seacoast Dr. / Ebony Av. CSS A B D 4 Seacoast Dr. / Imperial Beach Bl. AWS d A A D 5 3rd St. / Palm Av. AWS B B D 6 3rd St. / Imperial Beach Bl. AWS A A D 1 When a right turn is designated, the lane can either be striped or unstriped. To function as a right turn lane there must be sufficient width for right turning vehicles to travel outside the through lanes. 2 3 L = Left; T = Through; R = Right; d= Defacto Right Turn Lane Per the 2010 Highway Capacity Manual, overall average intersection delay and level of service are shown for intersections with a traffic signal or all way stop control. For intersections with cross street stop control, the delay and level of service for the worst individual movement (or movements sharing a single lane) are shown. CSS = Cross street Stop; AWS = All Way Stop 29
42 3.7 EXISTING CONDITIONS ROADWAY SEGMENT CAPACITY ANALYSIS The SANTEC/ITE TIS guidelines provides roadway volume capacity values presented previously on Table 2-3. The roadway segment capacities are approximate figures only, and are used at the General Plan level to assist in determining the roadway functional classification (number of through lanes) needed to meet traffic demand. Table 3-2 provides a summary of the Existing (2015) conditions roadway segment capacity analysis based on the City of Imperial Beach General Plan Circulation Element Roadway Segment Capacity/ (LOS) Thresholds identified previously on Table 2-3. As shown on Table 3-2, all of the study area roadway segments currently operate at an acceptable LOS based on the City s planning level daily roadway capacity thresholds. 3.8 TRAFFIC SIGNAL WARRANTS ANALYSIS Traffic signal warrants for Existing traffic conditions are based on existing peak hour intersection turning volumes. There are no study area intersections that currently warrant a traffic signal under Existing traffic conditions. Existing conditions traffic signal warrant analysis worksheets are provided in Appendix RECOMMENDED IMPROVEMENTS RECOMMENDED IMPROVEMENTS TO ADDRESS DEFICIENCIES AT INTERSECTIONS All study area intersections are anticipated to operate at acceptable LOS (i.e., LOS B or better) for Existing (2015) traffic conditions. As such, no intersection improvements have been recommended RECOMMENDED IMPROVEMENTS TO ADDRESS DEFICIENCIES ON ROADWAY SEGMENTS All study area roadways segments are currently operating at acceptable LOS (i.e., LOS D or better) for Existing (2015) traffic conditions. As such, no roadway segment improvements have been recommended TIA Report REV
43 Table 3 2 Roadway Segment Volume/Capacity Analysis for Existing (2015) Conditions Roadway LOS Existing Acceptable # Roadway Segment Limits Section Capacity 1 (2015) V/C LOS LOS 1 South of Palm Av. 2U 8,000 5, B D 2 North of Elm Av. 2U 8,000 4, A D Seacoast Dr. 3 Between Elm Av. and Ebony Av. 2U 8,000 3, A D 4 Between Ebony Av. and Imperial Beach Bl. 2U 8,000 3, A D 5 Between Seacoast Dr. and 3rd St. 2D 15,000 4, A D Palm Av. 6 East of 3rd St. 2D 15,000 12, D D 7 Elm Av. East of Seacoast Dr. 2U 2, A D 8 Ebony Av. East of Seacoast Dr. 2U 2, A D 9 Between Seacoast Dr. and 3rd St. 2D 15,000 3, A D Imperial Beach Bl. 10 East of 3rd St. 2D 15,000 6, A D 1 These maximum roadway capacities have been extracted from the following source: SANTEC/ITE Guidelines for Traffic Impact Studies [TIS] in the San Diego Region (Table 2) for each road facility type. These roadway capacities are "rule of thumb" estimates for planning purposes. The LOS "E" service volumes are estimated maximum daily capacity for respective classifications. By using the LOS "E" capacity for each roadway facility type, volumeto capacity (v/c) values between will represent LOS "A", will represent LOS "B", will represent LOS "C", will represent LOS "D", will represent LOS "E", and v/c values greater than 1.00 will represent LOS "F" operations. Capacity is affected by such factors as intersections (spacing, configuration and control features), degree of access control, roadway grades, design geometrics (horizontal and vertical alignment standards), sight distance, vehicle mix (truck and bus traffic) and pedestrian and bicycle traffic. 31
44 This Page Intentionally Left Blank TIA Report REV
45 4 PROJECTED FUTURE TRAFFIC This section presents the traffic volumes estimated to be generated by the Project, as well as the Project s trip assignment onto the study area roadway network. The Project is proposed to consist of 100 hotel rooms, 4,937 square foot (sf) quality restaurant, and 1,971 square feet of retail uses as part of the hotel (e.g., gift shop). An Opening Year of 2017 will be used for the purposes of this TIS. Vehicular and will be provided via the western extension of Imperial Beach Boulevard, west of Seacoast Drive (see Exhibit 1-1). Regional access to the site is provided via the I-5 Freeway at the Imperial Beach Boulevard interchange. 4.1 PROJECT TRIP GENERATION Trip generation represents the amount of traffic which is both attracted to and produced by a development. Determining traffic generation for a specific project is therefore based upon forecasting the amount of traffic that is expected to be both attracted to and produced by the specific land uses being proposed for a given development. Trips generated by the Project s proposed land uses have been estimated based on trip generation rates collected by the San Diego Association of Governments (SANDAG) (Not So) Brief Guide of Vehicular Traffic Generation Rates for the San Diego Region. (2) Trip generation rates used to estimate Project traffic are shown in Table 4-1. A summary of the Project s trip generation is also shown in Table 4-1. For purposes of this analysis, ITE land use code 841 (New Car Sales) has been utilized to derive site specific trip generation estimates. As shown on Table 4-1, the Project is estimated to generate a net total of 1,494 trip-ends per day, with 65 AM peak hour trips and 120 PM peak hour trips. Trips for 1,971 square foot specialty retail is part of the Hotel use (e.g., gift shop, etc.). As such, trip generation associated with the specialty retail is reflected in the trip generation for the hotel use. 4.2 PROJECT TRIP DISTRIBUTION Trip distribution is the process of identifying the probable destinations, directions or traffic routes that will be utilized by Project traffic. The potential interaction between the planned land uses and surrounding regional access routes are considered, to identify the route where the Project traffic would distribute. The Project trip distribution was developed based on anticipated travel patterns to and from the Project site. The Project trip distribution patterns were developed based on an understanding of existing travel patterns in the area, the geographical location of the site, and the site s proximity to the regional arterial and state highway system. Trip distribution patterns for the proposed Project are illustrated on Exhibit TIA Report REV
46 Table 4 1 Project Trip Generation Rates & Trip Generation Summary Weekday AM Peak Hour Weekday PM Peak Hour Units 2 Weekday Land Use In Out Total In Out Total Daily Project Trip Generation Rates 1 Hotel Rooms Restaurant, Quality TSF Weekday AM Peak Hour Weekday PM Peak Hour Quantity Units 2 Weekday Project In Out Total In Out Total Daily Project Trip Generation Summary Hotel Rooms ,000 Restaurant, Quality TSF Total Trips ,494 1 Source: SANDAG "(Not So) Brief Guide of Vehicular Traffic Generation Rates For The San Diego Region", April TSF = Thousand Square Feet 3 Trips for 1,971 square foot specialty retail is part of the Hotel use (e.g., gift shop, etc.). 34


47 35
48 4.3 MODAL SPLIT The traffic reducing potential of public transit, walking or bicycling have not been considered in this TIS. Essentially, the traffic projections are "conservative" in that these alternative travel modes might be able to reduce the forecasted traffic volumes (employee and guest/patron trips). 4.4 PROJECT TRIP ASSIGNMENT The assignment of traffic from the Project area to the adjoining roadway system is based upon the Project trip generation, trip distribution, and the arterial highway and local street system improvements that would be in place by the time of initial occupancy of the Project. Based on the identified Project traffic generation and trip distribution patterns, Project ADT and peak hour intersection turning movement volumes are shown Exhibit BACKGROUND TRAFFIC Future year traffic forecasts have been based upon background (ambient) growth at 2% per year, compounded annually, for 2017 traffic conditions. The ambient growth factor is intended to approximate regional traffic growth. This ambient growth rate is added to existing traffic volumes to account for area-wide growth not reflected by cumulative development projects. Ambient growth has been added to daily and peak hour traffic volumes on surrounding roadways, in addition to traffic generated by the development of future projects that have been approved but not yet built and/or for which development applications have been filed and are under consideration by governing agencies. The SANDAG Series 13 Regional Growth Forecasts for the San Diego Region identifies projected growth in population of 3,143,429 in 2012 to 4,068,759 in 2050, or a percent increase over the 38-year period. (3) The change in population equates to roughly a 0.68 percent growth rate, compounded annually. Similarly, growth over the same 38-year period in households is projected to increase by percent, or 0.65 percent annual growth rate. Finally, growth in employment over the same 38-year period is projected to increase by percent, or a 0.73 percent annual growth rate. 4.6 CUMULATIVE DEVELOPMENT TRAFFIC California Environmental Quality Act (CEQA) guidelines require that other reasonably foreseeable development projects which are either approved or being processed concurrently in the study area also be included as part of a cumulative analysis scenario. A cumulative project list was developed for the purposes of this analysis through consultation with planning and engineering staff from the City of Imperial Beach, the cumulative project list includes known and foreseeable projects that are anticipated to contribute traffic to the study area intersections TIA Report REV
49 37
50 Where applicable, cumulative projects anticipated to contribute measurable traffic (i.e. 50 or more peak hour trips) to study area intersections have been manually added to the study area network to generate both Opening Year Cumulative and Horizon Year traffic forecasts. In other words, this list of cumulative development projects has been reviewed to determine which projects would likely contribute measurable traffic through the study area intersections (e.g., those cumulative projects in close proximity to the proposed Project). Any additional traffic generated by other projects is accounted for through background ambient growth factors that have been applied to the peak hour volumes at study area intersections as discussed in Section 4.5 Background Traffic. Exhibit 4-3 illustrates the cumulative development location map. A summary of cumulative development projects and their proposed land uses are shown on Table 4-2. Where applicable, the traffic generated by individual cumulative projects has been manually added to both the Opening Year Cumulative and Horizon Year traffic forecasts to ensure that traffic generated by the listed cumulative development projects in Table 4-2 are reflected as part of the background traffic. 4.7 TRAFFIC FORECASTS To provide a comprehensive assessment of potential transportation network deficiencies buildup analyses were performed in support of this work effort. The buildup method was used to approximate both the Opening Year Cumulative and Horizon Year traffic forecasts, and is intended to identify the cumulative impacts on both the existing and planned circulation system. The Opening Year Cumulative and Horizon Year traffic forecasts include background traffic, traffic generated by other cumulative development projects within the study area, and the traffic generated by the proposed Project. The buildup approach combines existing traffic counts with a background ambient growth factor to forecast the near-term 2017 traffic conditions. An ambient growth factor of 4.04% (2017) accounts for background (area-wide) traffic increases that occur over time, up to the year 2017 from the year 2015 (compounded two percent per year growth over a 2-year period). Similarly, an ambient growth factor of 18.17% (2040) accounts for background (area-wide) traffic increases that occur over time, up to the year 2040 from the year 2015 (based on the Series 13 SANDAG Regional Growth Forecasts). Traffic volumes generated by the Project are then added to assess both the Opening Year Cumulative and Horizon Year traffic conditions. The 2017 and Horizon Year roadway network is similar to the existing conditions roadway network with the exception of future roadways and intersections proposed to be developed by the Project TIA Report REV
51 Imperial Beach ResortsTraffic Impact Analysis EXHIBIT 4-3: CUMULATIVE DEVELOPMENT PROJECTS LOCATION MAP SITE _N cd.mxd 3 Sources: Esri, HERE, DeLorme, Intermap, increment P Corp., GEBCO, USGS, FAO, NPS, NRCAN, GeoBase, IGN, Kadaster NL, Ordnance Survey, Esri Japan, METI, Esri China (Hong Kong), swisstopo, MapmyIndia, OpenStreetMap contributors, and the GIS User Community 39
52 40
53 Table 4 2 Cumulative Development Land Use Summary # Project/Location Description General Commercial and Mixed Use (C/MU 1) Seacoast Commercial and Mixed Use (C/MU 2) Neighborhood Commercial and Mixed Use (C/MU 3) Residential up to 43 DU/ac Commercial 60% minimum Residential up to DU/ac Commercial 60% minimum Residential up to DU/ac Commercial 60% minimum 4 Rezone from C 3 to R 3000 Residential up to 14 DU/ac 5 Bernardo Shores Townhomes 194 DUs 6 Breakwater Shopping Center (9th and Palm) Commercial (market, specialty retail, food service, fast food, drug store) 7 Navy NBC Coastal Campus Naval Base 8 Imperial Beach Bikeway Village 18,983 SF of strip commercial space & 50 bed hostel 9 Residential at Coronado/Marian Catholic HS 175 DUs 10 Pier South (Seacoast Inn) 78 room hotel and 3,700 SF of restaurant space 11 American Legion Post 1 SF = Square Feet; DU = Dwelling Unit; AC = Acres Redevelopment of 30 residential units and 3,600 SF American Legion Post 41
54 As noted previously, an analysis of the proposed Project at various development tiers has been assessed for the purposes of this traffic study. This TIS includes the following traffic conditions, with the various traffic components: Opening Year Cumulative (2017) o Existing 2015 counts o Ambient growth traffic (4.04%) o Cumulative Development Project traffic o Project traffic Horizon Year (2040) o Existing 2015 counts o Ambient growth traffic (18.17%) o Cumulative Development Project traffic o Project traffic TIA Report REV
55 5 E+P TRAFFIC CONDITIONS This section discusses the traffic forecasts for Existing plus Project (E+P) conditions and the resulting intersection operations, roadway segment, and traffic signal warrant analyses. 5.1 ROADWAY IMPROVEMENTS The lane configurations and traffic controls assumed to be in place for E+P conditions are consistent with those shown previously on Exhibit 3-1, with the exception of the following: Project driveways and those facilities assumed to be constructed by the Project to provide site access are also assumed to be in place for E+P conditions only (e.g., intersection and roadway improvements at the Project s frontage and driveways). 5.2 E+P TRAFFIC VOLUME FORECASTS This scenario includes Existing traffic volumes plus Project traffic and assumes the existing roadway network. Exhibit 5-1 shows the ADT and peak hour intersection turning movement volumes, which can be expected for E+P traffic conditions. 5.3 INTERSECTION OPERATIONS ANALYSIS E+P peak hour traffic operations have been evaluated, for the study area intersections based on the analysis methodologies presented in Section 2 Methodologies of this TIS. The intersection analysis results are summarized in Table 5-1, which show that consistent with Existing conditions, the study area intersections are anticipated to continue to operate at acceptable LOS with the addition of Project traffic for E+P traffic conditions. A summary of the peak hour intersection LOS for E+P conditions are shown on Exhibit 5-2. The intersection operations analysis worksheets for E+P traffic conditions are included in Appendix 5.1 of this TIS. 5.4 ROADWAY SEGMENT CAPACITY ANALYSIS As noted previously, the roadway segment capacities are approximate figures only, and are used at the General Plan level to assist in determining the roadway functional classification (number of through lanes) needed to meet future traffic demand. Table 5-2 provides a summary of the E+P conditions roadway segment capacity analysis based on the roadway segment capacities/thresholds identified previously on Table 2-3. As shown on Table 5-2, there are no study area roadway segments that are anticipated to operate at an unacceptable LOS under E+P traffic conditions, consistent with Existing traffic conditions TIA Report REV

56 44
57 45
58 Table 5 1 Intersection Analysis for E+P Conditions Existing (2015) E+P Change Traffic Delay 1 (secs.) LOS Delay 1 (secs.) LOS in Delay Significant # Intersection Control 2 AM PM AM PM AM PM AM PM AM PM Impact? 3 1 Seacoast Dr. / Palm Av. AWS A A A A No 2 Seacoast Dr. / Elm Av. CSS B B B B No 3 Seacoast Dr. / Ebony Av. CSS A B B B No 4 Seacoast Dr. / Imperial Beach Bl. AWS A A A A No 5 3rd St. / Palm Av. AWS B B B B No 6 3rd St. / Imperial Beach Bl. AWS A A A A No 1 Per the 2010 Highway Capacity Manual, overall average intersection delay and level of service are shown for intersections with a traffic signal or allway stop control. For intersections with cross street stop control, the delay and level of service for the worst individual movement (or movements sharing a single lane) are shown. 2 CSS = Cross street Stop; AWS = All Way Stop 3 A project is determined to significantly impact either a roadway segment or intersection if the addition of the project generated trips results in a change in LOS from acceptable to unacceptable. However, if an intersection is operating at an unacceptable LOS E or F prior to the addition of the project generated traffic, then a significant impact is identified if the delay increases by 2.0 seconds or more at a deficient intersection. 46
59 Table 5 2 Roadway Segment Volume/Capacity Analysis for E+P Conditions Roadway LOS Existing Change Significant Acceptable E+P # Roadway Segment Limits Section Capacity 1 (2015) V/C LOS V/C LOS in V/C Impact? 2 LOS 1 South of Palm Av. 2U 8,000 5, B 5, C 0.08 No D 2 North of Elm Av. 2U 8,000 4, A 5, B 0.08 No D Seacoast Dr. 3 Between Elm Av. and Ebony Av. 2U 8,000 3, A 4, A 0.09 No D 4 Between Ebony Av. and Imperial Beach Bl. 2U 8,000 3, A 4, A 0.10 No D 5 Between Seacoast Dr. and 3rd St. 2D 15,000 4, A 5, A 0.04 No D Palm Av. 6 East of 3rd St. 2D 15,000 12, D 12, D 0.04 No D 7 Elm Av. East of Seacoast Dr. 2U 2, A A 0.03 No D 8 Ebony Av. East of Seacoast Dr. 2U 2, A A 0.03 No D 9 Between Seacoast Dr. and 3rd St. 2D 15,000 3, A 4, A 0.04 No D Imperial Beach Bl. 10 East of 3rd St. 2D 15,000 6, A 7, A 0.04 No D 1 These maximum roadway capacities have been extracted from the following source: SANTEC/ITE Guidelines for Traffic Impact Studies [TIS] in the San Diego Region (Table 2) for each road facility type. These roadway capacities are "rule of thumb" estimates for planning purposes. The LOS "E" service volumes are estimated maximum daily capacity for respective classifications. By using the LOS "E" capacity for each roadway facility type, volume to capacity (v/c) values between will represent LOS "A", will represent LOS "B", will represent LOS "C", will represent LOS "D", will represent LOS "E", and v/c values greater than 1.00 will represent LOS "F" operations. Capacity is affected by such factors as intersections (spacing, configuration and control features), degree of access control, roadway grades, design geometrics (horizontal and vertical alignment standards), sight distance, vehicle mix (truck and bus traffic) and pedestrian and bicycle traffic. A project is determined to significantly impact either a roadway segment or intersection if the addition of the project generated trips results in a change in LOS from acceptable to unacceptable. However, if a roadway segment is operating at an unacceptable LOS E or F prior to the addition of the project generated traffic, then a significant impact is identified if the V/C increases by 0.02 or more on a deficient roadway segment. 2 47
60 Although the volume to capacity (V/C) ratio for the roadway segments of Palm Avenue west of 3 rd Street and east of 3 rd Street are anticipated to increase by more than 0.02 due to the addition of Project traffic, the peak hour intersection operations for the adjacent study area intersections indicate the adjacent intersections are anticipated to accommodate peak hour traffic flows without additional widening. As such, additional widening has not been recommended for these segments. 5.5 TRAFFIC SIGNAL WARRANTS ANALYSIS There are no study area intersections that are anticipated to meet peak hour volume based traffic signal warrants under E+P traffic conditions, consistent with Existing traffic conditions (see Appendix 5.2). 5.6 PROJECT IMPACTS AND MITIGATION MEASURES RECOMMENDED IMPROVEMENTS TO ADDRESS DEFICIENCIES AT INTERSECTIONS All study area intersections are anticipated to continue to operate at acceptable LOS (i.e., LOS B or better) for E+P traffic conditions. As such, no intersection improvements have been recommended RECOMMENDED IMPROVEMENTS TO ADDRESS DEFICIENCIES ON ROADWAY SEGMENTS All study area roadway segments are anticipated to continue to operate at acceptable LOS (i.e., LOS D or better) for E+P traffic conditions. As such, no roadway segment improvements have been recommended TIA Report REV
61 6 OPENING YEAR CUMULATIVE (2017) TRAFFIC CONDITIONS This section discusses the methods used to develop Opening Year Cumulative (2017) traffic forecasts, and the resulting intersection operations, roadway segment, and traffic signal warrant analyses. 6.1 ROADWAY IMPROVEMENTS The lane configurations and traffic controls assumed to be in place for Opening Year Cumulative (2017) conditions are consistent with those shown previously on Exhibit 3-1, with the exception of the following: Project driveways and those facilities assumed to be constructed by the Project to provide site access are also assumed to be in place for Opening Year Cumulative conditions only (e.g., intersection and roadway improvements along the Project s frontage and driveways). Driveways and those facilities assumed to be constructed by cumulative developments to provide site access are also assumed to be in place for Opening Year Cumulative conditions only (e.g., intersection and roadway improvements along the cumulative development s frontages and driveways). 6.2 OPENING YEAR CUMULATIVE (2017) WITHOUT PROJECT TRAFFIC VOLUME FORECASTS To account for background traffic, other known cumulative development projects in the study area were included in addition to 4.04% of ambient growth for Opening Year Cumulative traffic conditions. The weekday ADT and weekday AM and PM peak hour volumes which can be expected for Opening Year Cumulative (2017) Without Project traffic conditions are shown on Exhibit OPENING YEAR CUMULATIVE (2017) WITH PROJECT TRAFFIC VOLUME FORECASTS To account for background traffic, other known cumulative development projects in the study area were included in addition to 4.04% of ambient growth for Opening Year Cumulative traffic conditions in conjunction with traffic associated with the proposed Project. The weekday ADT and weekday AM and PM peak hour volumes which can be expected for Opening Year Cumulative (2017) With Project traffic conditions are shown on Exhibit INTERSECTION OPERATIONS ANALYSIS LOS calculations were conducted for the study intersections to evaluate their operations under Opening Year Cumulative conditions with roadway and intersection geometrics consistent with Section 6.1 Roadway Improvements. As shown in Table 6-1, the study area intersections are anticipated to continue to operate at acceptable LOS during the peak hours under Opening Year Cumulative (2017) traffic conditions, consistent with Existing traffic conditions. A summary of the peak hour intersection LOS for Opening Year Cumulative (2017) Without Project conditions are shown on Exhibit 6-3 and on Exhibit 6-4 for Opening Year Cumulative (2017) With Project traffic conditions TIA Report REV
62 50
63 51
64 52
65 53
66 Table 6 1 Intersection Analysis for Opening Year Cumulative (2017) Conditions 2017 Without Project 2017 With Project Change Traffic Delay 1 (secs.) LOS Delay 1 (secs.) LOS in Delay Significant # Intersection Control 2 AM PM AM PM AM PM AM PM AM PM Impact? 3 1 Seacoast Dr. / Palm Av. AWS A B A B No 2 Seacoast Dr. / Elm Av. CSS B B B B No 3 Seacoast Dr. / Ebony Av. CSS B B B B No 4 Seacoast Dr. / Imperial Beach Bl. AWS A A A A No 5 3rd St. / Palm Av. AWS B C C C No 6 3rd St. / Imperial Beach Bl. AWS A B A B No 1 Per the 2010 Highway Capacity Manual, overall average intersection delay and level of service are shown for intersections with a traffic signal or allway stop control. For intersections with cross street stop control, the delay and level of service for the worst individual movement (or movements 2 sharing a single lane) are shown. CSS = Cross street Stop; AWS = All Way Stop 3 A project is determined to significantly impact either a roadway segment or intersection if the addition of the project generated trips results in a change in LOS from acceptable to unacceptable. However, if an intersection is operating at an unacceptable LOS E or F prior to the addition of the project generated traffic, then a significant impact is identified if the delay increases by 2.0 seconds or more at a deficient intersection. 54
67 The intersection operations analysis worksheets for Opening Year Cumulative (2017) Without and With Project traffic conditions are included in Appendix 6.1 and Appendix 6.2 of this TIS, respectively. 6.5 ROADWAY SEGMENT CAPACITY ANALYSIS ROADWAY SEGMENT CAPACITY ANALYSIS (ADT METHOD) As noted previously, the roadway segment capacities are approximate figures only, and are typically used at the General Plan level to assist in determining the roadway functional classification (number of through lanes) needed to meet future forecasted traffic demand. Table 6-2 provides a summary of the Opening Year Cumulative (2017) conditions roadway segment capacity analysis based on the roadway segment capacities/thresholds identified previously on Table 2-3. As shown on Table 6-2, the following study area roadway segments are anticipated to operate at an unacceptable LOS (based on daily roadway segment capacities ADT Method) under Opening Year Cumulative (2017) Without Project traffic conditions: ID Street Segment 1 Seacoast Drive South of Palm Avenue LOS E 6 Palm Avenue East of 3 rd Street LOS F There are no additional roadway segments anticipated to operate at unacceptable LOS with the addition of Project traffic for Opening Year Cumulative (2017) With Project traffic conditions, in addition to those previously identified for Opening Year Cumulative Without Project traffic conditions ROADWAY SEGMENT CAPACITY ANALYSIS (FLORIDA METHOD) The previously mentioned roadway segments that are anticipated to operate at an unacceptable LOS were reevaluated utilizing the roadway capacity analysis based on the Florida Method. As shown on Table 6-3, the following study area roadway segments are anticipated to operate at an acceptable LOS (based on daily roadway segment capacities Florida Method) under Opening Year Cumulative (2017) Without Project traffic conditions: ID Street Segment 1 Seacoast Drive South of Palm Avenue LOS C AM and PM peak hour 6 Palm Avenue East of 3 rd Street LOS C AM peak hour; LOS D PM peak hour As such, there are no roadway segments anticipated to operate at unacceptable LOS with the addition of Project traffic for Opening Year Cumulative (2017) With Project traffic conditions and roadway widening does not appear to be necessary TIA Report REV
68 6.6 TRAFFIC SIGNAL WARRANTS ANALYSIS There are no study area intersections that are anticipated to meet either peak hour or planning level (ADT) volume based traffic signal warrants for Opening Year Cumulative traffic conditions (see Appendix 6.3 and Appendix 6.4). 6.7 OPENING YEAR CUMULATIVE DEFICIENCIES AND RECOMMENDED IMPROVEMENTS RECOMMENDED IMPROVEMENTS TO ADDRESS DEFICIENCIES AT INTERSECTIONS All study area intersections are anticipated to continue to operate at acceptable LOS (i.e., LOS C or better) for Opening Year Cumulative traffic conditions. As such, no intersection improvements have been recommended RECOMMENDED IMPROVEMENTS TO ADDRESS DEFICIENCIES ON ROADWAY SEGMENTS Although the ADT based roadway segment analysis indicates a deficiency (unacceptable LOS) at the aforementioned study area roadway segments, a review of the roadway segments using the Florida Method (peak hour volume based) (see Table 6 3) indicates acceptable peak hour operations without additional widening. As such, no roadway segment widening improvements have been recommended TIA Report REV2.docx 56 56
69 Table 6 2 Roadway Segment Volume/Capacity Analysis (ADT Method) for Opening Year Cumulative (2017) Conditions Roadway LOS 2017 Without Project 2017 With Project Change Significant Acceptable # Roadway Segment Limits Section Capacity 1 Vol V/C LOS Vol V/C LOS in V/C Impact? 2 LOS 1 South of Palm Av. 2U 8,000 7, E 8, F 0.08 No 3 D 2 North of Elm Av. 2U 8,000 6, C 7, D 0.08 No D Seacoast Dr. 3 Between Elm Av. and Ebony Av. 2U 8,000 5, B 6, C 0.09 No D 4 Between Ebony Av. and Imperial Beach Bl. 2U 8,000 4, A 5, B 0.10 No D 5 Between Seacoast Dr. and 3rd St. 2D 15,000 7, A 8, A 0.04 No D Palm Av. 6 East of 3rd St. 2D 15,000 16, F 17, F 0.04 No 3 D 7 Elm Av. East of Seacoast Dr. 2U 2,200 1, A 1, A 0.03 No D 8 Ebony Av. East of Seacoast Dr. 2U 2, A A 0.03 No D 9 Between Seacoast Dr. and 3rd St. 2D 15,000 4, A 5, A 0.04 No D Imperial Beach Bl. 10 East of 3rd St. 2D 15,000 7, A 8, A 0.04 No D 1 These maximum roadway capacities have been extracted from the following source: SANTEC/ITE Guidelines for Traffic Impact Studies [TIS] in the San Diego Region (Table 2) for each road facility type. These roadway capacities are "rule of thumb" estimates for planning purposes. The LOS "E" service volumes are estimated maximum daily capacity for respective classifications. By using the LOS "E" capacity for each roadway facility type, volume to capacity (v/c) values between will represent LOS "A", will represent LOS "B", will represent LOS "C", will represent LOS "D", will represent LOS "E", and v/c values greater than 1.00 will represent LOS "F" operations. Capacity is affected by such factors as intersections (spacing, configuration and control features), degree of access control, roadway grades, design geometrics (horizontal and vertical alignment standards), sight distance, vehicle mix (truck and bus traffic) and pedestrian and bicycle traffic. A project is determined to significantly impact either a roadway segment or intersection if the addition of the project generated trips results in a change in LOS from acceptable to unacceptable. However, if a roadway segment is operating at an unacceptable LOS E or F prior to the addition of the project generated traffic, then a significant impact is identified if the V/C increases by 0.02 or more on a deficient roadway segment. 2 Although the roadway segment is anticipated to increase by a V/C of more than 0.02 due to the addition of Project traffic, the Florida method demonstrates acceptable LOS without additional widening (see Table 6 3). As such, additional widening has not been recommended. 3 57
70 Table 6 3 Roadway Segment Volume/Capacity Analysis (Florida Method) for Opening Year Cumulative (2017) Conditions Roadway LOS 2017 Without Project 2017 With Project Change Significant Acceptable # Roadway Segment Limits Section Capacity 1,2 Peak Hour Vol V/C LOS Peak Hour Vol V/C LOS in V/C Impact? 3 LOS AM Peak Hour 1 Seacoast Dr. South of Palm Av. FL 2U 1, C C 0.01 No D 6 Palm Av. East of 3rd St. FL 2D 1, C C 0.02 No D PM Peak Hour 1 Seacoast Dr. South of Palm Av. FL 2U 1, C C 0.02 No D 6 Palm Av. East of 3rd St. FL 2D 1,344 1, D 1, D 0.04 No D 1 These maximum roadway capacities have been extracted from the following source: 2013 Quality/Level of Service Handbook from the State of Florida Department of Transportation for two way undivided lanes. These roadway capacities are "rule of thumb" estimates for planning purposes. The LOS "E" service volumes are estimated maximum daily capacity for respective classifications. By using the LOS "E" capacity for each roadway facility type, peak hour volumes between will represent LOS "C", 581 1,200 will represent LOS "D", 1,201 1,280 will represent LOS "E", and peak hour volumes greater than 1,280 will represent LOS "F" operations. Capacity is affected by such factors as intersections (spacing, configuration and control features), degree of access control, roadway grades, design geometrics (horizontal and vertical alignment standards), sight distance, vehicle mix (truck and bus traffic) and pedestrian and bicycle traffic. LOS A and B do not exist for this classification of 2 For two way divided lanes with an exclusive left turn lane, an adjustment factor of +5% must be applied to the LOS capacity. Source: Table 8 of the 2013 Quality/Level of Service Handbook from the State of Florida Department of Transportation. 3 A project is determined to significantly impact either a roadway segment or intersection if the addition of the project generated trips results in a change in LOS from acceptable to unacceptable. However, if a roadway segment is operating at an unacceptable LOS E or F prior to the addition of the project generated traffic, then a significant impact is identified if the V/C increases by 0.02 or more on a deficient roadway segment. 58
71 7 HORIZON YEAR (2040) TRAFFIC CONDITIONS This section discusses the methods used to develop Horizon Year (2040) traffic forecasts, and the resulting intersection operations, roadway segment, and traffic signal warrant analyses. 7.1 ROADWAY IMPROVEMENTS The lane configurations and traffic controls assumed to be in place for Horizon Year (2040) conditions are consistent with those shown previously on Exhibit 3-1, with the exception of the following: Project driveways and those facilities assumed to be constructed by the Project to provide site access are also assumed to be in place for Horizon Year conditions only (e.g., intersection and roadway improvements along the Project s frontage and driveways). Driveways and those facilities assumed to be constructed by cumulative developments to provide site access are also assumed to be in place for Horizon Year conditions only (e.g., intersection and roadway improvements along the cumulative development s frontages and driveways). 7.2 HORIZON YEAR (2040) WITHOUT PROJECT TRAFFIC VOLUME FORECASTS To account for background traffic, other known cumulative development projects in the study area were included in addition to 18.17% of ambient growth for Horizon Year (2040) traffic conditions. The weekday ADT and weekday AM and PM peak hour volumes which can be expected for Horizon Year (2040) Without Project traffic conditions are shown on Exhibit HORIZON YEAR (2040) WITH PROJECT TRAFFIC VOLUME FORECASTS To account for background traffic, other known cumulative development projects in the study area were included in addition to 18.17% of ambient growth for Horizon Year (2040) traffic conditions in conjunction with traffic associated with the proposed Project. The weekday ADT and weekday AM and PM peak hour volumes which can be expected for Horizon Year (2040) With Project traffic conditions are shown on Exhibit INTERSECTION OPERATIONS ANALYSIS LOS calculations were conducted for the study intersections to evaluate their operations under Horizon Year (2040) conditions with roadway and intersection geometrics consistent with Section 7.1 Roadway Improvements. As shown in Table 7-1, the study area intersections are anticipated to continue to operate at acceptable LOS during the peak hours under Horizon Year (2040) traffic conditions, consistent with Existing traffic conditions. A summary of the peak hour intersection LOS for Horizon Year (2040) Without Project conditions are shown on Exhibit 7-3 and on Exhibit 7-4 for Horizon Year (2040) With Project traffic conditions TIA Report REV
72 60


73 61
74 62


75 63
Prescott Plaza TRAFFIC IMPACT ANALYSIS TOWN OF YUCCA VALLEY
 Prescott Plaza TRAFFIC IMPACT ANALYSIS TOWN OF YUCCA VALLEY PREPARED BY: Aric Evatt, PTP aevatt@urbanxroads.com (949) 660-1994 x204 Charlene So, PE cso@urbanxroads.com (949) 660-1994 x222 OCTOBER 18, 2018
3.9 - Transportation and Traffic
 Transportation and Traffic 3.9 - Transportation and Traffic This section describes the potential transportation and traffic effects of project implementation on the project site and its surrounding area.
List of Attachments. Location Map... Site Plan... City of Lake Elsinore Circulation Element... City of Lake Elsinore Roadway Cross-Sections...
 List of Attachments Exhibits Location Map... Site Plan... City of Lake Elsinore Circulation Element... City of Lake Elsinore Roadway Cross-Sections... Existing Lane Geometry and Traffic Controls... Existing
Magnolia Place. Traffic Impact Analysis. Prepared for: City of San Mateo. Prepared by: Hexagon Transportation Consultants, Inc.
 Magnolia Place Traffic Impact Analysis Prepared for: City of San Mateo Prepared by: Hexagon Transportation Consultants, Inc. Updated January 4, 2010 Table of Contents 1. Introduction...1 2. Existing Conditions...6
TRAFFIC STUDY GUIDELINES Clarksville Street Department
 TRAFFIC STUDY GUIDELINES Clarksville Street Department 9/1/2009 Introduction Traffic studies are used to help the city determine potential impacts to the operation of the surrounding roadway network. Two
D.13 Transportation and Traffic
 This section addresses transportation and traffic issues and impacts related to the Proposed Project. Section D.13.1 provides a description of the affected environment for the Proposed Project. Applicable
TABLE TRAFFIC ANALYSIS SCENARIOS
 4.11 TRANSPORTATION The potential traffic impacts of the proposed project are evaluated in the Buena Park Beach/Orangethorpe Mixed Use Project Traffic Analysis (Traffic Analysis) by Austin-Foust Associates
Project Report. South Kirkwood Road Traffic Study. Meadows Place, TX October 9, 2015
 Meadows Place, TX October 9, 2015 Contents 1 Introduction... 1 2 Data Collection... 1 3 Existing Roadway Network... 2 4 Traffic Volume Development... 2 5 Warrant Analysis... 3 6 Traffic Control Alternative
Traffic Impact Study. Westlake Elementary School Westlake, Ohio. TMS Engineers, Inc. June 5, 2017
 TMS Engineers, Inc. Traffic Impact Study Westlake Elementary School Westlake, Ohio June 5, 2017 Prepared for: Westlake City Schools - Board of Education 27200 Hilliard Boulevard Westlake, OH 44145 TRAFFIC
Traffic Impact Analysis Walton Acres at Riverwood Athletic Club Clayton, NC
 Traffic Impact Analysis Walton Acres at Riverwood Athletic Club Clayton, NC 1. TABLE OF CONTENTS INTRODUCTION...1 1.1. Site Location and Study Area...1 1.2. Proposed Land Use and Site Access...2 1.3.
Transportation Impact Study for Abington Terrace
 Transportation Impact Study for Abington Terrace Abington Township, Montgomery County, PA Sandy A. Koza, P.E., PTOE PA PE License Number PE059911 Prepared by McMahon Associates, Inc. 425 Commerce Drive,
Traffic Impact Analysis Chatham County Grocery Chatham County, NC
 Chatham County Grocery Chatham County, NC TABLE OF CONTENTS 1. INTRODUCTION... 1 1.1. Location and Study Area... 1 1.2. Proposed Land Use and Access... 2 1.3. Adjacent Land Uses... 2 1.4. Existing ways...
TRAFFIC IMPACT STUDY COMPREHENSIVE UPDATE TOWN OF THOMPSON S STATION, TENNESSEE PREPARED FOR: THE TOWN OF THOMPSON S STATION
 TRAFFIC IMPACT STUDY COMPREHENSIVE UPDATE TOWN OF THOMPSON S STATION, TENNESSEE PREPARED FOR: THE TOWN OF THOMPSON S STATION Transportation Consultants, LLC 1101 17 TH AVENUE SOUTH NASHVILLE, TN 37212
 TRAFFIC IMPACT STUDY CANYON HILLS PROJECT LOS ANGELES, CALIFORNIA INTRODUCTION This traffic analysis has been conducted to identify and evaluate the potential traffic impacts of the proposed Canyon Hills
5858 N COLLEGE, LLC N College Avenue Traffic Impact Study
 5858 N COLLEGE, LLC nue Traffic Impact Study August 22, 2016 Contents Traffic Impact Study Page Preparer Qualifications... 1 Introduction... 2 Existing Roadway Conditions... 5 Existing Traffic Conditions...
1609 E. FRANKLIN STREET HOTEL TRAFFIC IMPACT STUDY EXECUTIVE SUMMARY
 1609 E. FRANKLIN STREET HOTEL TRAFFIC IMPACT STUDY EXECUTIVE SUMMARY Prepared for: The Town of Chapel Hill Public Works Department Traffic Engineering Division Prepared by: HNTB North Carolina, PC 343
THIS PAGE LEFT BLANK INTENTIONALLY
 GA SR 25 Spur at Canal Road Transportation Impact Analysis PREPARED FOR GLYNN COUNTY, GEORGIA 1725 Reynolds Street, Suite 300 Brunswick, Georgia 31520 PREPARED BY 217 Arrowhead Boulevard Suite 26 Jonesboro,
5.3 TRAFFIC, CIRCULATION AND PARKING
 5.3 TRAFFIC, CIRCULATION AND PARKING This section is based upon the Downtown Lancaster Specific Plan Traffic Impact Analysis (April 2, 2008) and the Downtown Lancaster Specific Plan Parking Analysis (May
CarMax Auto Superstore/ Reconditioning Center #6002 Murrieta, California
 CarMax Auto Superstore/ Reconditioning Center #6002 Murrieta, California TUSTIN 17782 17th Street Suite 200 Tustin, CA 92780-1947 714.665.4500 Fax: 714.665.4501 LOS ANGELES 145 S. Spring Street Suite 120
TRAFFIC IMPACT STUDY CRITERIA
 Chapter 6 - TRAFFIC IMPACT STUDY CRITERIA 6.1 GENERAL PROVISIONS 6.1.1. Purpose: The purpose of this document is to outline a standard format for preparing a traffic impact study in the City of Steamboat
TRAFFIC IMPACT STUDY And A TRAFFIC SIGNAL WARRANT ANALYSIS FOR A SENIOR LIVING AND APARTMENT DEVELOPMENT
 TRAFFIC IMPACT STUDY And A TRAFFIC SIGNAL WARRANT ANALYSIS FOR A SENIOR LIVING AND APARTMENT DEVELOPMENT DEERFIELD TOWNSHIP, WARREN COUNTY, OHIO Nantucket Circle and Montgomery Road () Prepared for: ODLE
Los Coyotes Country Club Development Plan Traffic Impact Analysis
 Los Coyotes Country Club Development Plan Traffic Impact Analysis Prepared For: Phil Martin Associates 2073007450 Los Coyotes Country Club Development Plan Traffic Impact Analysis June 19, 2014 Prepared
EAST AND SOUTH STREET CITY OF ANAHEIM, CALIFORNIA
 T R A F F I C I M P A C T A N A LY S I S EAST AND SOUTH STREET CITY OF ANAHEIM, CALIFORNIA April 217 T R A F F I C I M P A C T A N A LY S I S EAST AND SOUTH STREET CITY OF ANAHEIM, CALIFORNIA Submitted
4.0 TRAFFIC IMPACT STUDIES
 SECTION 4 4.0 TRAFFIC IMPACT STUDIES 4.1 TRAFFIC IMPACT STUDY REQUIREMENTS The City has established Traffic Impact Study (TIS) requirements for the purpose of ensuring that both the quantitative and qualitative
Abrams Associates. Transportation Impact Analysis. City of Rocklin. Prepared for: David Mohlenbrok City of Rocklin 4081 Alvis Court Rocklin, CA 95677
 Transportation Impact Analysis Sierra College Boulevard Commercial Project City of Rocklin Prepared for: David Mohlenbrok City of Rocklin 081 Alvis Court Rocklin, CA 95677 Prepared by: 1875 Olympic Boulevard,
TRANSPORTATION ANALYSIS REPORT US Route 6 Huron, Erie County, Ohio
 TRANSPORTATION ANALYSIS REPORT US Route 6 Huron, Erie County, Ohio December 12, 2012 Prepared for: The City of Huron 417 Main Huron, OH 44839 Providing Practical Experience Technical Excellence and Client
DUNBOW ROAD FUNCTIONAL PLANNING
 DUNBOW ROAD FUNCTIONAL PLANNING Final Report August 3, 216 #31, 316 5th Avenue NE Calgary, AB T2A 6K4 Phone: 43.273.91 Fax: 43.273.344 wattconsultinggroup.com Dunbow Road Functional Planning Final Report
Traffic Impact Study. Roderick Place Columbia Pike Thompson s Station, TN. Transportation Group, LLC Traffic Engineering and Planning
 F i s c h b a c h Transportation Group, LLC Traffic Engineering and Planning Traffic Impact Study Roderick Place Columbia Pike Thompson s Station, TN Prepared March 2016 Ms. Gillian L. Fischbach, P.E.,
MEETING FACILITY 2901 GIBFORD DRIVE CITY OF OTTAWA TRANSPORTATION BRIEF. Prepared for: Holiday Inn Express 2881 Gibford Drive Ottawa, ON K1V 2L9
 MEETING FACILITY 2901 GIBFORD DRIVE CITY OF OTTAWA TRANSPORTATION BRIEF Prepared for: Holiday Inn Express 2881 Gibford Drive Ottawa, ON K1V 2L9 December 18, 2012 112-566 Brief_1.doc D. J. Halpenny & Associates
4. ENVIRONMENTAL IMPACT ANALYSIS 9. TRANSPORTATION AND TRAFFIC
 4. ENVIRONMENTAL IMPACT ANALYSIS 9. TRANSPORTATION AND TRAFFIC 4.9.1 INTRODUCTION The following section addresses the Proposed Project s impact on transportation and traffic based on the Traffic Study
INDUSTRIAL BUILDING 3009 HAWTHORNE ROAD CITY OF OTTAWA TRANSPORTATION OVERVIEW REVISED. Prepared for: Canada Inc.
 INDUSTRIAL BUILDING 3009 HAWTHORNE ROAD CITY OF OTTAWA TRANSPORTATION OVERVIEW REVISED Prepared for: 7849648 Canada Inc. Octiober 1, 2015 114-598 Overview_2.doc D. J. Halpenny & Associates Ltd. Consulting
TRAFFIC IMPACT ANALYSIS
 TRAFFIC IMPACT ANALYSIS FOR THE CHAMPAIGN UNIT#4 SCHOOL DISTRICT PROPOSED HIGH SCHOOL (SPALDING PARK SITE) IN THE CITY OF CHAMPAIGN Final Report Champaign Urbana Urbanized Area Transportation Study 6/24/2014
List of Exhibits...ii
 One Brickell Traffic Study TABLE OF CONTENTS List of Exhibits...ii EXECUTIVE SUMMARY...1 1. INTRODUCTION...2 1.1 Study Area...2 1.2 Study Objective...5 2. EXISTING TRAFFIC CONDITIONS...6 2.1 Data Collection...6
Highway 111 Corridor Study
 Highway 111 Corridor Study June, 2009 LINCOLN CO. HWY 111 CORRIDOR STUDY Draft Study Tea, South Dakota Prepared for City of Tea Sioux Falls Metropolitan Planning Organization Prepared by HDR Engineering,
Technical Memorandum TRAFFIC IMPACT STUDY. RIDLEY ROAD CONVENIENCE STORE Southampton County, VA. Prepared for: Mr. David Williams.
 Technical Memorandum TRFFIC IMPCT STUDY RIDLEY ROD CONVENIENCE STORE Southampton County, V Prepared for: Mr. David Williams By: Charles Smith, P.E., PTOE EPR Charlottesville, V July 2014 1 TBLE OF CONTENTS
Walmart (Store # ) 60 th Street North and Marion Road Sioux Falls, South Dakota
 60 th Street North and Marion Road Sioux Falls, South Dakota") Walmart (Store #4865-00) 60 th Street North and Marion Road Sioux Falls, South Dakota Prepared for: Wal-Mart Stores, Inc. Bentonville, Arkansas Prepared by: Kimley-Horn and Associates, Inc. ã2013 Kimley-Horn
Walmart (Store #4865-00) 60 th Street North and Marion Road Sioux Falls, South Dakota Prepared for: Wal-Mart Stores, Inc. Bentonville, Arkansas Prepared by: Kimley-Horn and Associates, Inc. ã2013 Kimley-Horn
TRAFFIC ASSESSMENT River Edge Colorado
 TRAFFIC ASSESSMENT River Edge Colorado Submitted by: Fehr & Peers 621 17th Street, Ste. 231 Denver, CO 8293 (33) 296-43 December, 21 App. M-2 Traffic Assessment River Edge Colorado December 21 TABLE OF
METHODOLOGY. Signalized Intersection Average Control Delay (sec/veh)
") Chapter 5 Traffic Analysis 5.1 SUMMARY US /West 6 th Street assumes a unique role in the Lawrence Douglas County transportation system. This principal arterial street currently conveys commuter traffic
Chapter 5 Traffic Analysis 5.1 SUMMARY US /West 6 th Street assumes a unique role in the Lawrence Douglas County transportation system. This principal arterial street currently conveys commuter traffic
6060 North Central Expressway Mixed-Use Site Dallas, Texas
 Volume 1 Traffic Impact Analysis 6060 North Central Expressway Mixed-Use Site Dallas, Texas April 30, 2018 Kimley-Horn and Associates, Inc. Dallas, Texas Project #063238300 Registered Firm F-928 Traffic
Mission Street Medical Office Development
 reet Medical Office Development Traffic Impact Analysis Prepared for: Palo Alto Medical Foundation February 23, 2012 Hexagon Office: 7888 Wren Avenue, Suite B121 Gilroy, CA 95020 Hexagon Job Number: 11RD11
Subject: Solberg Avenue / I-229 Grade Separation: Traffic Analysis
 MEMORANDUM Transportation Bill Troe, AICP Jason Carbee, AICP 12120 Shamrock Plaza Suite 300 Omaha, NE 68154 (402) 334-8181 (402) 334-1984 (Fax) To: Project File Date: Subject: Solberg Avenue / I-229 Grade
Traffic Impact Study WestBranch Residential Development Davidson, NC March 2016
 Traffic Impact Study WestBranch Residential Development Davidson, NC March 216 TRAFFIC IMPACT STUDY FOR THE WestBranch Residential Development LOCATED IN DAVIDSON, NC Prepared For: Lennar Carolinas, LLC
Glenn Avenue Corridor Traffic Operational Evaluation
 Glenn Avenue Corridor Traffic Operational Evaluation PREPARED FOR: THE CITY OF AUBURN PREPARED BY: DECEMBER 2007 Glenn Avenue Corridor Study--Auburn, Alabama TABLE OF CONTENTS Introduction... 1 Background
MEMORANDUM. To: 1.0 PURPOSE
 MEMORANDUM To: Scott Holland, Elements Architecture From: Brian Grover, Dudek Date: July 16, 2014 1.0 PURPOSE In response to the November 4, 2013 request (RE: Incomplete Application Southern California
CHAPTER 4 TRANSPORTATION IMPACT STUDY TABLE OF CONTENTS
 CHAPTER 4 TRANSPORTATION IMPACT STUDY TABLE OF CONTENTS Section Title Page 4.1 Introduction... 4-1 4.1.1 General... 4-1 4.1.2 Applicant Responsibility... 4-1 4.1.3 Capacity and Safety Issues... 4-1 A.
4.11 TRANSPORTATION 4.11 TRANSPORTATION Environmental Setting Intersection, Roadway, and Freeway Evaluation Methodology
 4.11 TRANSPORTATION This section describes the road transportation system in the vicinity of the proposed Project and the potential impacts to this system from the proposed Project. The analysis in this
Figure 1: Vicinity Map of the Study Area
 ARIZONA TEXAS NEW MEXICO OKLAHOMA May 5, 2016 Mr. Anthony Beach, P.E. BSP Engineers 4800 Lakewood Drive, Suite 4 Waco, Texas 76710 Re: Intersection and Access Analysis along Business 190 in Copperas Cove
TRAFFIC IMPACT STUDY. Creekside Thornton, Colorado. For. August 2015 November 2015 Revised: August Prepared for:
 TRAFFIC IMPACT STUDY For Creekside Thornton, Colorado August 215 November 215 Revised: August 216 Prepared for: Jansen Strawn Consulting Engineers 45 West 2 nd Avenue Denver, Colorado 8223 Prepared by:
Table of Contents FIGURES TABLES APPENDICES. Traffic Impact Study Hudson Street Parking Garage MC Project No.: A Table of Contents
 Traffic Impact Study Hudson Street Parking Garage MC Project No.: 151714A Table of Contents Table of Contents I. INTRODUCTION... 2 II. EXISTING CONDITIONS... 5 III. 215 EXISTING TRAFFIC CONDITIONS... 6
Complete Street Analysis of a Road Diet: Orange Grove Boulevard, Pasadena, CA
 Complete Street Analysis of a Road Diet: Orange Grove Boulevard, Pasadena, CA Aaron Elias, Bill Cisco Abstract As part of evaluating the feasibility of a road diet on Orange Grove Boulevard in Pasadena,
City of Wayzata Comprehensive Plan 2030 Transportation Chapter: Appendix A
 A1. Functional Classification Table A-1 illustrates the Metropolitan Council s detailed criteria established for the functional classification of roadways within the Twin Cities Metropolitan Area. Table
Chapter 4 Traffic Analysis
 Chapter 4 Traffic Analysis PURPOSE The traffic analysis component of the K-68 Corridor Management Plan incorporates information on the existing transportation network, such as traffic volumes and intersection
Road Conversion Study Plumas Street
 Plumas Street Phase I Submitted to The Regional Transportation Commission of Washoe County Submitted by Zong Tian, Ph.D., P.E. Saeedeh Farivar Haiyuan Li, Ph.D. Center for Advanced Transportation Education
TRAFFIC IMPACT ANALYSIS. Photo here CAL MET ROYAL MRF EXPANSION. City of Paramount, CA. arch beach C O N S U L T I N G.
 TRAFFIC IMPACT ANALYSIS z Photo here CAL MET ROYAL MRF EXPANSION City of Paramount, CA arch beach C O N S U L T I N G June 23, 214 TRAFFIC IMPACT ANALYSIS CAL MET ROYAL MATERIALS RECOVERY FACILITY (MRF)
MEDICAL/OFFICE BUILDING 1637 BANK STREET OTTAWA, ONTARIO TRANSPORTATION OVERVIEW. Prepared for:
 MEDICAL/OFFICE BUILDING 1637 BANK STREET OTTAWA, ONTARIO TRANSPORTATION OVERVIEW Prepared for: 2434984 Ontario Inc. 13-5510 Canotek Road Ottawa, Ontario K1J 9J5 June 4, 2015 115-613 Report_2.doc D. J.
Planning Committee STAFF REPORT March 7, 2018 Page 2 of 4 The following MTSOs are being used across the five subregions: Intersection Level of Service
 Planning Committee STAFF REPORT Meeting Date: March 7, 2018 Subject Summary of Issues Recommendations Financial Implications Options Attachments Changes from Committee Review Draft 2017 Multimodal Transportation
HENDERSON DEVELOPMENT 213, 217, 221, 221 ½, 223 HENDERSON AVENUE and 65 TEMPLETON STREET OTTAWA, ONTARIO TRANSPORTATION OVERVIEW.
 HENDERSON DEVELOPMENT 213, 217, 221, 221 ½, 223 HENDERSON AVENUE and 65 TEMPLETON STREET OTTAWA, ONTARIO TRANSPORTATION OVERVIEW Prepared for: 2294170 Ontario Inc. February 2, 2017 117-652 Report_1.doc
Bridge Street Corridor Study Report
 Bridge Street Corridor Study Report Prepared for: Prepared by: BRIDGE STREET CORRIDOR STUDY REPORT PREPARED FOR: CITY OF ARROYO GRANDE COMMUNITY DEVELOPMENT DEPARTMENT 300 EAST BRANCH STREET ARROYO GRANDE,
REDEVELOPMENT TRAFFIC IMPACT STUDY
 REDEVELOPMENT TRAFFIC IMPACT STUDY For Wendy s Parker, Colorado January 215 Prepared for: Sterling Design Associates, LLC 29 W. Littleton Boulevard #3 Littleton, Colorado 812 Prepared by: 1233 Airport
QUICKIE C STORE AND GAS BAR 1780 HERON ROAD OTTAWA, ONTARIO TRANSPORTATION BRIEF. Prepared for:
 QUICKIE C STORE AND GAS BAR 1780 HERON ROAD OTTAWA, ONTARIO TRANSPORTATION BRIEF Prepared for: Quickie Convenience Stores Larny Holdings Ltd. c/o PBC Group April 15, 2015 115-615 Report_1.doc D. J. Halpenny
OFFICE/RETAIL DEVELOPMENT 1625 BANK STREET OTTAWA, ONTARIO TRANSPORTATION BRIEF. Prepared for: Canada Inc.
 OFFICE/RETAIL DEVELOPMENT 1625 BANK STREET OTTAWA, ONTARIO TRANSPORTATION BRIEF Prepared for: 9402209 Canada Inc. December 15, 2015 115-625 Report_2.doc D. J. Halpenny & Associates Ltd. Consulting Transportation
FORM A PASCO COUNTY ACCESS CONNECTION PERMIT APPLICATION
 FORM 901.3.A PASCO COUNTY ACCESS CONNECTION PERMIT APPLICATION The following information is required from all applicants directly or indirectly accessing any collector or arterial road or as otherwise
Traffic Impact Study Little Egypt Road Development Denver, North Carolina June 2017
 Traffic Impact Study Little Egypt Road Development Denver, North arolina June 2017 N. Little Egypt Road DQ\ QDQFLQJ VDOHV RU RWKHU SHUIRUPDQFH EDVHG FULWHULD Proposed Site Driveways Site Driveway 1 TRAFFI
9 Leeming Drive Redevelopment Ottawa, ON Transportation Brief. Prepared By: Stantec Consulting Ltd.
 9 Leeming Drive Redevelopment Ottawa, ON Transportation Brief Prepared By: Stantec Consulting Ltd. TIA GUIDELINES CHECKLIST Report Context Municipal Address Comment: Section 1.1 Location relative to major
DRAFT. Corridor study. Honeysuckle Road. October Prepared for the City of Dothan, AL. Prepared by Gresham, Smith and Partners
 DRAFT Corridor study Honeysuckle Road October 2017 Prepared for the City of Dothan, AL Prepared by TABLE OF CONTENTS SECTION I... 1 STUDY SUMMARY... 1 INTRODUCTION... 1 CONCLUSIONS... 5 SECTION II... 7
Clay Street Realignment Project Traffic Study
 Final Clay Street Realignment Project Traffic Study November 24, 2009 Prepared for: City of Placerville RS07-2466 2990 Lava Ridge Court, Suite 200 Roseville, CA 95661 (916) 773-1900 Fax (916) 773-2015
Traffic Circulation Study for Neighborhood Southwest of Mockingbird Lane and Airline Road, Highland Park, Texas
 ARIZONA TEXAS NEW MEXICO OKLAHOMA February 13, 2015 Mr. Meran Dadgostar P.E., R.S. Town of Highland Park 4700 Drexel Dr. Highland Park, Texas 75205 Re: Traffic Circulation Study for Neighborhood Southwest
TRAFFIC OPERATIONS ANALYSIS REPORT. Pacheco Boulevard Alignment Study and Alternatives Analysis
 TRAFFIC OPERATIONS ANALYSIS REPORT Pacheco Boulevard Alignment Study and Alternatives Analysis PREPARED FOR: CITY OF MARTINEZ AND CONTRA COSTA COUNTY OCTOBER 2016 FINAL REPORT Prepared By: under contract
6.14 Traffic and Circulation
 6.14 Traffic and Circulation 6.14.1 Introduction The analysis in this section summarizes the findings and recommendations presented in the "Marywood Development Traffic Impact Study, City of Orange, California"
Troutbeck Farm Development
 Troutbeck Farm Development Willistown Township, Chester County PA For Submission To: Willistown Township Last Revised: October, 4 TPD# INLM.A. 5 E. High Street Suite 65 Pottstown, PA 9464 6.36.3 TPD@TrafficPD.com
Henderson Avenue Mixed-Use Development
 Zoning Case: Z145-3 Traffic Impact Analysis Henderson Avenue Mixed-Use Development Dallas, TX October 26 th, 216 Kimley-Horn and Associates, Inc. Dallas, Texas Project #644827 Registered Firm F-928 Traffic
3 Department of Development Services Tim Snellings, Director Pete Calarco, Assistant Director
 3 Department of Development Services Tim Snellings, Director Pete Calarco, Assistant Director 7 County Center Drive T: 53.552.37 Oroville, California 95965 F: 53.538.7785 buttecounty.net/dds BUTTE COUNTY
Traffic Analysis and Design Report. NW Bethany Boulevard. NW Bronson Road to NW West Union Road. Washington County, Oregon
 Traffic Analysis and Design Report NW Bethany Boulevard NW Bronson Road to NW West Union Road Washington County, Oregon May 2011 Table of Contents Table of Contents Section 1 Executive Summary... 2 Section
V. ENVIRONMENTAL IMPACT ANALYSIS K. TRANSPORTATION AND CIRCULATION
 V. ENVIRONMENTAL IMPACT ANALYSIS K. TRANSPORTATION AND CIRCULATION ENVIRONMENTAL SETTING The following section is based on the Draft Traffic Circulation Study for the Malibu La Paz Project (Traffic Study),
Route 7 Corridor Study
 Route 7 Corridor Study Executive Summary Study Area The following report analyzes a segment of the Virginia State Route 7 corridor. The corridor study area, spanning over 5 miles in length, is a multi
Traffic Impact Analysis (TIA) Process and Procedures Manual. September 2017
 Process and Procedures Manual. September 2017") Traffic Impact Analysis (TIA) Process and Procedures Manual Post Office Box 664 101 Huntersville-Concord Road Huntersville, NC 28070 Phone 704-766-2220 Fax 704-992-5528 www.huntersville.org (c) 2017, Town
Traffic Impact Analysis (TIA) Process and Procedures Manual Post Office Box 664 101 Huntersville-Concord Road Huntersville, NC 28070 Phone 704-766-2220 Fax 704-992-5528 www.huntersville.org (c) 2017, Town
City of Homewood Transportation Plan
 City of Homewood Transportation Plan Prepared for: City of Homewood, Alabama Prepared by: Skipper Consulting, Inc. May 2007 TABLE OF CONTENTS INTRODUCTION... 1 BACKGROUND INFORMATION... 1 EXISTING TRANSPORTATION
COMMERCIAL DEVELOPMENT 2015 ROBERTSON ROAD OTTAWA, ONTARIO TRANSPORTATION BRIEF. Prepared for:
 COMMERCIAL DEVELOPMENT 2015 ROBERTSON ROAD OTTAWA, ONTARIO TRANSPORTATION BRIEF Prepared for: First Bay Properties Inc. 311 Richmond Road, Suite 203 Ottawa, ON K1Z 6X3 August 8, 2017 117-663 Brief_1.doc
FAIRFIELD INN & SUITES HOTEL 135 THAD JOHNSON PRIVATE OTTAWA TRANSPORTATION BRIEF. Prepared for:
 FAIRFIELD INN & SUITES HOTEL 135 THAD JOHNSON PRIVATE OTTAWA TRANSPORTATION BRIEF Prepared for: Bona Building & Management Co. Ltd. Place Vanier, 333 North River Road Vanier, Ontario K1L 8B9 August 12,
Lyons Avenue/Dockweiler Road Extension Project Draft Environmental Impact Report. Appendix I Traffic Impact Study
 Lyons Avenue/Dockweiler Road Extension Project Draft Environmental Impact Report Appendix I Traffic Impact Study Street 0 80-1947 500.4501 RITA ld Court 0 91355-1096 400.7401 LA n Avenue 0 590-3745 300-9301
MEMORANDUM. Our project study area included the following locations:
 MEMORANDUM Date: To: From: Subject: Najib O. Habesch Nick M. Fomenko, PE, PTOE Bushnell Park North Traffic Assessment BETA Project #: 4461 As part of our contract to undertake the design of the Bushnell
Donahue Drive Corridor Traffic Operational Evaluation
 Donahue Drive Corridor Traffic Operational Evaluation PREPARED FOR: THE CITY OF AUBURN PREPARED BY: JANUARY 2007 Donahue Drive Corridor Study--Auburn, Alabama TABLE OF CONTENTS Introduction... 1 Background
OTTAWA TRAIN YARDS PHASE 3 DEVELOPMENT CITY OF OTTAWA TRANSPORTATION IMPACT STUDY. Prepared for:
 OTTAWA TRAIN YARDS PHASE 3 DEVELOPMENT CITY OF OTTAWA TRANSPORTATION IMPACT STUDY Prepared for: The Ottawa Train Yards Inc. 223 Colonnade Road South, Suite 212 Nepean, Ontario K2E 7K3 January 17, 2012
JONESBORO HIGHWAY 63 HIGHWAY 18 CONNECTOR STUDY
 JONESBORO HIGHWAY 63 HIGHWAY 18 CONNECTOR STUDY Craighead County May 2007 JONESBORO HIGHWAY 63 HIGHWAY 18 CONNECTOR STUDY Craighead County May 2007 Prepared by Planning and Research Division Arkansas State
EXECUTIVE SUMMARY. Page 1 of 6
 EXECUTIVE SUMMARY The purpose of this report is to identify conformance with the original traffic impact study for the proposed retail development on Lot 5 of Riverdale Retail Filing No. 1 located on the
Bistro 6. City of Barrie. Traffic Impact Study for Pratt Hansen Group Inc. Type of Document: Final Report. Project Number: JDE 1748
 City of Barrie Traffic Impact Study for Pratt Hansen Group Inc. Type of Document: Final Report Project Number: JDE 1748 Date Submitted: June 12 th, 2017 06/12/17 John Northcote, P.Eng. Professional License
FINAL DESIGN TRAFFIC TECHNICAL MEMORANDUM
 FINAL DESIGN TRAFFIC TECHNICAL MEMORANDUM July 2014 FINAL (SR 43) Project Development and Environment Study From State Road 60 (Adamo Drive) to I-4 (SR 400) Hillsborough County, Florida Work Program Item
Truck Climbing Lane Traffic Justification Report
 ROUTE 7 (HARRY BYRD HIGHWAY) WESTBOUND FROM WEST MARKET STREET TO ROUTE 9 (CHARLES TOWN PIKE) Truck Climbing Lane Traffic Justification Report Project No. 6007-053-133, P 101 Ι UPC No. 58599 Prepared by:
FRONT RANGE CROSSINGS TRAFFIC IMPACT STUDY
 FRONT RANGE CROSSINGS TRAFFIC IMPACT STUDY Prepared for: City of Thornton And Colorado Department of Transportation Prepared by: 11 Blake Street, Suite 2 Denver, Colorado 822 Contact: Brian Bern, PE, PTOE
DRAFT TRAFFIC STUDY BOULDER AVENUE BRIDGE REPLACEMENT CITY OF HIGHLAND SAN BERNARDINO COUNTY, CALIFORNIA
 DRAFT CITY OF HIGHLAND SAN BERNARDINO COUNTY, CALIFORNIA August 8, 2006 DRAFT CITY OF HIGHLAND SAN BERNARDINO COUNTY, CALIFORNIA Prepared for: City of Highland 27215 Baseline Highland, California 92346
CITY OF OAKLAND. 27th Street Bikeway Feasibility and Design. Final Report (v3) March 23, Kimley-Horn and Associates, Inc.
 March 23, Kimley-Horn and Associates, Inc.") CITY OF OAKLAND 27th Street Bikeway Feasibility and Design Final Report (v3) March 23, 2007 PREPARED BY: Kimley-Horn and Associates, Inc. Table of Contents 1. Introduction 3 2. 27 th Street/Bay Place Corridor
CITY OF OAKLAND 27th Street Bikeway Feasibility and Design Final Report (v3) March 23, 2007 PREPARED BY: Kimley-Horn and Associates, Inc. Table of Contents 1. Introduction 3 2. 27 th Street/Bay Place Corridor
Shockoe Bottom Preliminary Traffic and Parking Analysis
 Shockoe Bottom Preliminary Traffic and Parking Analysis Richmond, Virginia August 14, 2013 Prepared For City of Richmond Department of Public Works Prepared By 1001 Boulders Pkwy Suite 300, Richmond, VA
SECTION 1 - TRAFFIC PLANNING
 SECTION 1 - TRAFFIC PLANNING 1.1 TRAFFIC OPERATIONS 1.1.1 Roadway Functional Classification The Multnomah County Comprehensive Framework Plan s Policy 34: Trafficways and the Functional Classification
Figure 1: East West Connector Alignment Alternatives Concept Drawing
 Page 2 of 9 Figure 1: East West Connector Alignment Alternatives Concept Drawing The Montebello Drive extension will run north south and connect Wilsonville Road to the Boones Ferry Road to Brown Road
TRANSPORTATION IMPACT STUDY PROPOSED RIVERFRONT 47 MIXED USE DEVELOPMENT
 November 2016 TRANSPORTATION IMPACT STUDY PROPOSED RIVERFRONT 47 MIXED USE DEVELOPMENT & Aspinwall Borough, Sharpsburg Borough & O Hara Township, Allegheny County, Pennsylvania Prepared for: Riverfront
APPENDIXB. Traffic Operations Technical Memorandum
 APPENDIXB Traffic Operations Technical Memorandum Environmental Assessment - Lincoln County, SD 85 th Street: Sundowner Avenue to Louise Avenue November 2017 MEMORANDUM Transportation Jim Kollbaum, PE
HILTON GARDEN INN HOTEL HOTEL EXPANSION 2400 ALERT ROAD, OTTAWA TRANSPORTATION BRIEF. Prepared for:
 HILTON GARDEN INN HOTEL HOTEL EXPANSION 2400 ALERT ROAD, OTTAWA TRANSPORTATION BRIEF Prepared for: Bona Building & Management Co. Ltd. Place Vanier, 333 North River Road Vanier, Ontario K1L 8B9 October
T R A N S P O R T A T I O N M E M O R A N D U M
 WILKINSON LLC t raffic engineering and t ransportation p lanning 3405 Harbor Way Fort Collins, CO 80524 phone: 970-988-0143 fax: 970-472-0223 martinawilkinson@msn.com T R A N S P O R T A T I O N M E M
Traffic Impact Statement
 Traffic Impact Statement Mixed Use Development, US 41 and Old Trail Drive aka Tide-Starbucks 4900 9 th Street North General Development Site Plan (GDSP) Collier County, FL 10/6/2015 Prepared for: Prepared
Design Traffic Technical Memorandum
 State Road 7 Extension PD&E Study Design Traffic Technical Memorandum Palm Beach County, FL October 2010 State Road 7 Extension PD&E Study Design Traffic Technical Memorandum Palm Beach County, FL Prepared