Figure 1. Total SNAP Sales at Food Trust Farmers Markets in Philadelphia,
|
|
|
- Clifton Lane
- 5 years ago
- Views:
Transcription
1 1
2 2
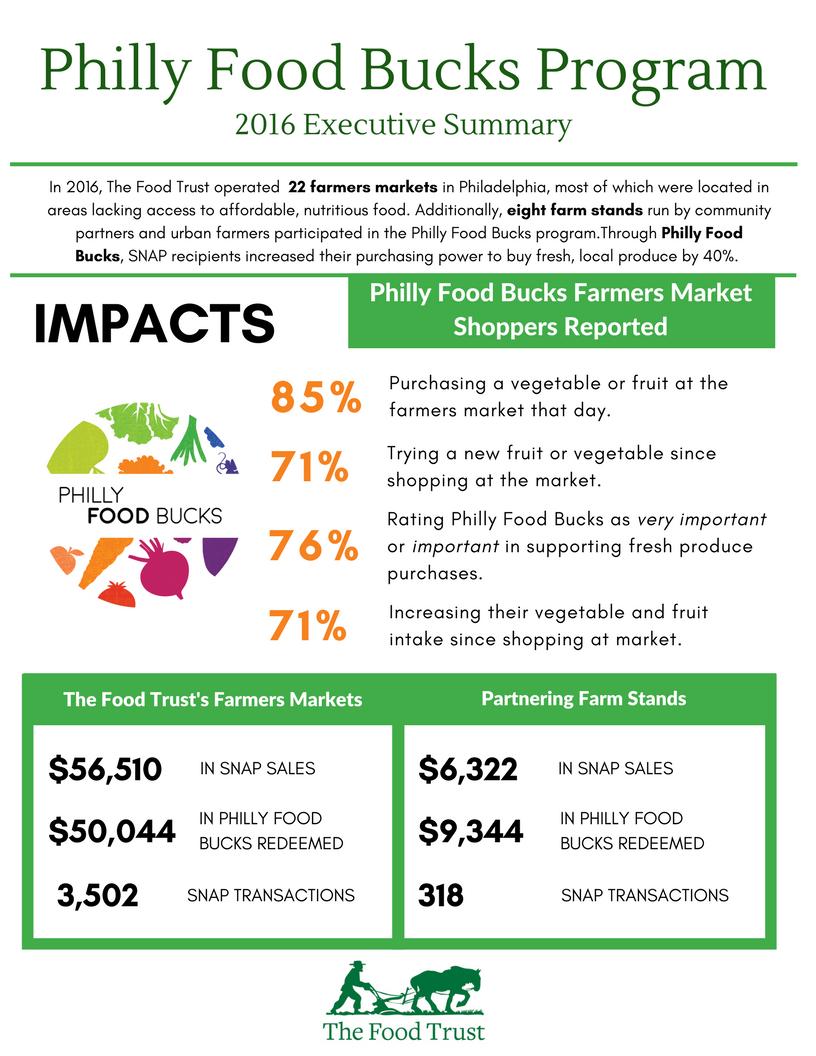
3 Philly Food Bucks are a healthy food incentive coordinated by The Food Trust. At The Food Trust s farmers markets and other participating farmers markets and on-farm stands, SNAP customers earn $2 in Philly Food Bucks to spend on fresh fruits and vegetables for every $5 spent using their SNAP benefits. Additionally, The Food Trust distributes Philly Food Bucks through healthcare partnerships, community partnerships and market-based programming such as cooking demonstrations and Learn and Earn Market Walks. Since the program launched in 2010, $760,852 in Philly Food Bucks have been distributed and $357,068 in Philly Food Bucks have been redeemed for fresh, locally-grown produce. SNAP Philly Food Bucks continued to promote redemption of SNAP benefits at farmers markets. In 2016, SNAP sales at The Food Trust s farmers markets were $56,510, with 3,502 transactions. This was a 4% overall increase in SNAP sales despite operating fewer markets in 2016 compared to SNAP sales at partner farmers market sites reached $6,322, with 318 transactions. Total annual SNAP sales at The Food Trust s farmers markets from 2005 to 2016 are shown in Figure 1. SNAP sales for individual farmers markets in 2015 and 2016 are outlined in Appendix Table 1. $80,000 $60,000 $40,000 $20,000 $0 Figure 1. Total SNAP Sales at Food Trust Farmers Markets in Philadelphia, (14) 2006 (14) 2007 (19) 2008 (21) 2009 (19) 2010 (21) 2011 (26) 2012 (26) Year and Amount of Markets 2013 (23) 2014 (25) 2015 (21) 2016 (20) Distribution and Redemption During the 2016 season, Philly Food Bucks valued at $125,012 were distributed, with $59,388 of those ultimately being redeemed (48% overall redemption rate) (Figure 2). Community partnerships are the primary source of distribution of Philly Food Bucks (Figure 3). However, Philly Food Bucks distributed through farmers markets SNAP point-of-sale transactions and market-based programming, including cooking demonstrations and Learn and Earn Market Walks, account for over half (55%) of Philly Food 3
4 Buck redemptions and have the highest redemption rates (77%) (Figures 4 and 5). For a full breakdown of Philly Food Bucks distributed via point-of-sale SNAP use and cooking demonstrations, see Appendix Table 2. Overall in 2016, there was a 6% increase in Philly Food Buck redeemed at The Food Trust s farmers markets and across all participating markets compared to Ten of The Food Trust s farmers markets experienced an over 10% increase in Philly Food Bucks use in 2016 versus Overall, the PFB redemption rate was 48% in 2016, and the average amount of Philly Food Bucks redeemed per Food Trust farmers market increased from $2,060 in 2015 to $2,502 in 2016 (Table 1). Figure 2. Philly Food Bucks Distribution and Redemption, $160,000 $140,000 $120,000 $100,000 $80,000 $60,000 Distributed Redeemed $40,000 $20,000 $ Table 1. Philly Food Bucks at The Food Trust s farmers markets, Philly Food Bucks PARTICIPATING MARKETS TOTAL SALES $11,488 $28,396 $43,854 $52,870 $67,998 $47,378 $50,044 AVERAGE PER MARKET $574 $1,092 $1,687 $2,298 $2,720 $2,060 $2502 OVERALL REDEMPTION RATE 38% 45% 39% 42% 61% 54% 48% TOTAL DISTRIBUTION $38,318 $80,388 $147,394 $132,826 $133,618 $103,296 $125,012 Note: Philly Food Bucks sales above encompass The Food Trust s markets only. 4
5 Figure Philly Food Buck Distribution 19% 3% TFT Markets Non-TFT Markets Healthcare Partnerships Market-Based Programming Community Partners 55% 11% 12% Figure Philly Food Bucks Redemption TFT Markets 35% 34% Non-TFT Markets Healthcare Partnerships Market-Based Programming 21% 6% 4% Community Partners 5
6 Figure 5. Philly Food Bucks Redemption Rates by Distributor, $80,000 $70,000 27% $60,000 $50,000 $40,000 Distributed $30,000 $20,000 77% 17% 77% Redeemed $10,000 53% $0 TFT Markets Non-TFT Markets Healthcare Partnerships Market-Based Programming Community Partners Healthcare Partnerships Farmers Market Program staff collaborated with regional healthcare providers to support Philly Food Bucks distribution. For example, Lankenau Medical Associates provided $10 packets of Philly Food Bucks to patients that expressed a need for assistance with purchasing fruits and vegetables during a food security screening question. Diabetes Prevention Programs at Temple Hospital and Freedom Valley YMCA promoted eating nutritious fruits and vegetables by providing participants with Philly Food Bucks. Focusing on its employee wellness program, Einstein Hospital used Philly Food Bucks as an incentive for staff to purchase healthy foods at the Park and Tabor Farmers Market. These partnerships, in addition to distribution at Philadelphia health centers, account for $3,328, or 6%, of the total redemption of Philly Food Bucks in 2016 (Figure 4). Community Partnerships The Food Trust promoted use of Philly Food Bucks and expanded access to affordable, nutritious food by distributing $6 packets of Philly Food Bucks through community partners. Through an application process, community partners are identified they must serve primarily SNAP-eligible households living within 10 blocks of a farmers market location. Community partnerships constitute 55% of Philly Food Bucks distribution (Figure 3). Key channels of partnerships include food pantries and community development organizations. Partners with the highest redemption rates include East Park Revitalization Alliance, Strawberry Mansion Neighborhood Action Center, and the Greater Philadelphia Coalition Against Hunger. (See Appendix Table 3 for Key Philly Food Bucks community distribution partners for each farmers market). 6
7 Learn and Earn Market Walks During the 2016 season, Food Trust staff hosted 21 Learn and Earn Market Walks (formerly called farmers market tours) at 9 farmers market locations. Of the 167 adults and 81 children that participated, 127 attendees took a post-evaluation survey (76% of participating adults). Results show that Learn and Earn Market Walks help bring new shoppers to market (47% were first time shoppers), educate participants on a range of topics (Figure 6), and that most participants are likely or very likely to return to the farmers market (74%) and tell a friend about the market (85%)(Figure 7). These data show that Learn and Earn Tours are a beneficial and informative feature of farmers markets. 100% 80% 60% 40% 20% 0% Figure 6. Topics Learned about from Learn and Earn Market Walks 61% Choosing Healthy Foods 55% 54% 54% 54% Benefits of Eating Local Hours of Market Preparing Fruits and Veggies Saving Money While Shopping 43% Community of Market Figure 7. Intentions from Learn and Earn Market Walks 6% Learned Nothing 100% 80% 85% 74% 60% Likely or Very Likely 40% 20% 0% 15% Tell a Friend About the Market 26% Return to Market in next 30 Days Not sure, Unlikely, or Very Unlikely 7
8 Cooking Demonstrations From June through September 2016, eight farmers markets hosted cooking demonstrations led by The Food Trust s SNAP-Ed funded nutrition education team. At the Hunting Park Farmers Market, The Food Trust collaborated with Vetri Community Partnership to bring their Mobile Teaching Kitchen to the market in November Following participation in these interactive demonstrations that feature recipes using produce from the market, 3,359 participants took a post-evaluation survey. Results from the survey show that cooking demonstrations improve knowledge in a variety of ways (Figure 8), and motivate participants (77% reported they will prepare the recipe at home and 75% reported they will eat more fruits and vegetables after the workshop). As cooking demonstrations provide shoppers with skills and motivate participants to eat healthier, they are an innovative and effective complement to farmers market programming. 100% Figure 8. Topics learned about from Cooking Demonstrations 80% 60% 71% 61% 40% 35% 34% 20% 0% Preparing Fruits and Vegetables Choosing Healthy Foods Saving Money While Shopping Keeping Food Safe 2% I didn't Learn Anything New 8
9 A total of 904 customer surveys were collected at 22 of The Food Trust s farmers markets in Philadelphia from September to October Over 75% of surveys (N=725) were collected from 17 farmers markets located in low-income neighborhoods. Impact of Philly Food Bucks Results of the 2016 Farmers Market Customer Survey demonstrate that Philly Food Bucks customers at low-income farmers markets are more likely to purchase fruits or vegetables, increase fruit and vegetable intake, try new fruits and vegetables, receive nutrition education, visit market more frequently (every week or more), and Who Are Farmers Market Shoppers? 72% of customers were women 43% African American, 42% White, 10% Hispanic, 3% Asian 40% were ages 41 and 65 62% participated in at least one food assistance program (SNAP, PFB, WIC, or FMNP) in the past year 30% of customers had used SNAP at the market 39% had participated in Philly Food Bucks have positive perceptions of the selection and prices of fruits and vegetables at market (Table 2). The Philly Food Bucks program makes farmers markets more affordable for low-income customers and keeps customers coming back. Overall, PFB users reported the program was important in helping purchase fruits and vegetables (82%), in their decision to shop at farmers markets (76%), and in increasing their fruit and vegetable consumption (69%). Philly Food Bucks play a critical role in attracting customers in low-income areas to local farmers markets, expanding customers purchasing power, promoting participation in nutrition education opportunities, and increasing consumption of fruits and vegetables. 1 Methods for the survey and additional results are described elsewhere: Young CR, Aquilante JL, Solomon S, Colby L, Kawinzi MA, Uy N, Mallya G. Improving fruit and vegetable consumption among low-income customers at farmers markets: Philly Food Bucks, Philadelphia, Pennsylvania, Preventing Chronic Disease 2013;10:
10 Table 2. How Do PFB Users Compare to Non-PFB Users at Farmers Markets in Low-Income Neighborhoods? PFB Users Non-PFB Users Reported that quality of fruits and vegetables at FM is better than other neighborhood food stores 91% 88% Received information about healthy eating while at FM*** 91% 58% Purchased fruits or vegetables at market* 85% 78% Reported that selection of fruits and vegetables at FM is better than other neighborhood food stores* 84% 78% Reported that prices of fruits and vegetables at FM is better than other neighborhood food stores* 74% 61% Increased fruit and vegetable intake since shopping at FM*** 71% 52% Tried new fruits or vegetables since shopping at FM*** 71% 49% Increased fruit and vegetable consumption since using PFB 69% n/a Observed a cooking demo at FM*** 65% 26% Visit market every week or more*** 60% 41% African-American** 55% 49% Hispanic** 16% 8% First visit to market*** 7% 24% * p<0.05; ** p<0.01; *** p<0.001 The chi-square test of independence was used to assess statistical significance SNAP and Philly Food Buck Use over Time The Food Trust has conducted a farmers market survey since SNAP usage and Philly Food Bucks participation follow an upward trend over time (Figure 9). The percent of customers that reported ever using SNAP at market increased from 7.6% in 2006 to 30% in The percent that reported ever using Philly Food Bucks increased from 13% in 2010 (the year the program started), to 39% in These results show The Food Trust s farmers markets are reaching ever more low-income customers. 40% Figure 9. SNAP / PFB Use at The Food Trust's Farmers' Markets, 2006 to % 20% 10% 0% Ever Used SNAP at this Market Ever Used PFB *-launched in
11 The Farmers Market Program continues to promote The Food Trust s mission of ensuring that everyone has access to affordable, nutritious food and information to make healthy decisions. Data show that accepting SNAP and offering Philly Food Bucks at our markets, along with providing market-based programming, are expanding The Food Trust s reach and participation among low-income populations. Since 2010, Philly Food Bucks have expanded lower-income Philadelphia shoppers fresh produce purchasing power by $357,068. In 2016 alone, $59,388 of Philly Food Bucks were redeemed for locally grown produce, supporting the triple bottom line of improving nutrition, the regional food system, and the environment. 11
12 Appendix Table 1. SNAP Sales per Food Trust farmers market (2015 and 2016) Farmers Market 18th & Christian $75.95 N/A 22nd & Tasker $19.00 N/A 26th & Allegheny $ $ th & Wharton $2, N/A 33rd & Diamond $1, $1, th & Lehigh $ $ nd & Haverford $ $ th & Chester $1, $1, Common Ground $1, $ Broad & Snyder $1, $1, Cecil B. Moore $1, $2, Chester $ $ Clark Park (Thursday) $3, $1, Clark Park (Saturday) $22, $28, Dickinson Square* N/A $ Fairmount $1, $1, Fitler Square N/A N/A Frankford Transportation Center $1, $1, Germantown $1, $1, Greensgrow* N/A $4, Headhouse Market $3, $5, Hunting Park $3, $3, Liberty Lands Park $ $57.50 Norristown $ $ Park and Tabor $1, $1, Philly Urban Creators* N/A $0.00 Overbrook Farms $1, $ Oxford Circle $1, $ Schuylkill River Park N/A N/A SHARE* $ $ Urban Tree Connection: 21st and Cecil B Moore* N/A $ Urban Tree Connection: 42nd and Girard* N/A $79.75 Walnut Hill Community Farm* N/A $47.50 West Oak Lane $ $ Total SNAP Sales $55, $63, *Partnering farm stand not operated by The Food Trust 12
13 Appendix Table 2. Philly Food Bucks Distribution and Redemption for SNAP Point-of-Sale and Cooking Demonstration Distribution (2015 and 2016) 2015 Distribution 2016 Distribution 2015 Redemption 2016 Redemption SNAP SNAP SNAP SNAP Cooking Cooking SNAP POS Cooking Total PFB SNAP POS Cooking Point of Point of Point of CD Rate* Point of CD Rate* Demos Demos Rate* Demos Sales Rate* Demos Sale Sale Sale Sale Total PFB Sales Farmers Market 18th & Christian $ 28 N/A N/A N/A $10 36% N/A N/A $202 N/A N/A N/A N/A N/A 22nd and Tasker $ 10 $ 142 N/A N/A $10 100% $ 54 38% $116 N/A N/A N/A N/A N/A 26th and Allegheny $ 210 $ 1,448 $ 282 $ 2,032 $142 68% $ 1,176 81% $2,588 $ % $ 1,288 63% $2,018 29th and Wharton $ 1,002 N/A N/A N/A $666 66% N/A N/A $962 N/A N/A N/A N/A $0 33rd and Diamond $ 352 N/A $ 754 N/A $266 76% N/A N/A $4,382 $ % N/A N/A $5,130 4th and Lehigh $ 206 $ 1,416 $ 284 $ 1,948 $130 63% $ 1,226 87% $2,202 $ % $ 1,664 85% $3,196 52nd and Haverford $ 270 $ 852 $ 300 $ 572 $146 54% $ % $1,392 $ 92 31% $ % $1,032 58th and Chester $ 406 $ 628 $ 822 $ 1,672 $210 52% $ % $2,878 $ % $ 1,270 76% $3,482 Broad & Snyder $ 590 N/A $ 762 N/A $452 77% N/A N/A $782 $ % N/A N/A $1,180 Cecil B. Moore $ 488 N/A $ 750 N/A $264 54% N/A N/A $824 $ % N/A N/A $924 Clark Park - Saturday $ 7,592 N/A $ 10,918 N/A $5,998 79% N/A N/A $10,188 $ 8,728 80% N/A N/A $12,494 Clark Park - Thursday $ 1,132 $ 1,980 $ 790 $ 2,094 $628 55% $ 1,228 62% $3,506 $ % $ 1,180 56% $2,838 Common Ground Market $ 746 $ 1,430 $ 294 $ 1,408 $316 42% $ % $2,384 $ % $ 1,018 72% $1,900 Dickinson Square Farmers' Market* $ 428 N/A $ 248 N/A $144 34% N/A N/A $300 $ % N/A N/A $406 Fair Food Farmstand* N/A N/A N/A N/A N/A N/A N/A N/A $5,482 N/A N/A N/A N/A $5,358 Fairmount $ 444 N/A $ 458 N/A $202 45% N/A N/A $594 $ % N/A N/A $758 Far Northeast (2015 only)* N/A N/A N/A N/A N/A N/A N/A N/A $52 N/A N/A N/A N/A $0 Fitler Square N/A N/A N/A N/A N/A N/A N/A N/A $18 N/A N/A N/A N/A $166 Frankford Transportation Center $ 574 $ 1,128 $ 722 $ 1,200 $228 40% $ % $1,742 $ % $ % $1,818 Germantown $ 486 N/A $ 604 N/A $314 65% N/A N/A $986 $ % N/A N/A $754 Greensgrow Farm* $ 2,750 N/A $ 2,390 N/A $876 32% N/A N/A $2,490 $ % N/A N/A $1,522 Headhouse - Sunday $ 1,644 N/A $ 2,872 N/A $1,250 76% N/A N/A $1,982 $ 2,342 82% N/A N/A $2,914 Hunting Park $ 836 N/A $ 1,484 $ 708 $490 59% N/A N/A $4,004 $ % $ % $4,200 Liberty Lands Park $ 138 N/A $ 22 N/A $76 55% N/A N/A $272 $ - 0% N/A N/A $36 Overbrook Farms $ 340 N/A $ 248 N/A $258 76% N/A N/A $640 $ % N/A N/A $674 Oxford Circle $ 690 $ 750 $ 580 $ 940 $510 74% $ % $2,690 $ % $ % $2,286 Park and Tabor $ 432 N/A $ 744 N/A $248 57% N/A N/A $794 $ % N/A N/A $1,644 Philly Urban Creators** N/A N/A $ - N/A N/A N/A N/A N/A N/A $ - 0% N/A N/A $0 Schuylkill River Park N/A N/A N/A N/A N/A N/A N/A N/A $78 N/A N/A N/A N/A $14 SHARE Nice Roots Farm** $ 140 N/A $ 242 N/A $8 5% N/A N/A $242 $ 90 37% N/A N/A $716 Urban Tree Connection: 21st and Cecil B Moore**N/A N/A $ 164 $ 600 N/A N/A N/A N/A N/A $ % $ % $840 Urban Tree Connection: 42nd and Girard** N/A N/A $ 80 N/A N/A N/A N/A N/A N/A $ 44 55% N/A N/A $342 Walnut Hill Community Farm** N/A N/A $ 22 N/A N/A N/A N/A N/A N/A $ 4 20% N/A N/A $14 West Oak Lane $ 352 $ 792 $ 176 N/A $152 43% $ % $1,172 $ 54 31% N/A N/A $586 Across All Markets $ 22,286 $ 10,566 $ 27,012 $ 13,174 $ 13,994 57% Avg $ 7,234 64% Avg $ 56,124 $ 17,598 52% Avg $ 8,758 63% Avg $ 59,388 *Redemption rate for the same farmers market location. **Partnering farm stand not operated by The Food Trust. *** Total Philly Food Buck sales include additional sales of $180 in 2015 and $146 in 2016 redeemed by participating farmers outside of the network of official farmers markets.
14 Appendix Table 3. Key Philly Food Bucks community distribution partners for The Food Trust s Philly Food Bucks at farmers market network. Community Distribution Partners Total PFBs from Farmers Market Organization #1 PFBs Redeemed Organization #2 PFBs Redeemed Organization #3 PFBs Redeemed Community Partners 18th & Christian 22nd and Tasker 26th and Allegheny Devereux United Methodist Church $330 Health Center Nutrionist $12 Coalition Against Hunger $16 $400 29th and Wharton 33rd and Diamond East Park Revitalization Alliance $2,744 Strawberry Mansion NAC $694 Strawberry Mansion CDC $512 $4,272 4th and Lehigh HACE CDC $378 Dorado Village $186 State Representative Leslie Acosta $112 $938 52nd and Haverford Wednesday Lankenau Hospital $156 Freedom Valley YMCA DPP $52 Philadelphia Housing Authority $38 $506 58th and Chester Southwest CDC $162 Diversified Community Services $150 FJ Meyers Recreation Center $144 $1,292 Broad & Snyder Diversified Community Services $142 BenePhilly Center at United Communities $58 Philadelphia Access Center $40 $398 Cecil B. Moore Coalition Against Hunger $72 Strawberry Mansion CDC $52 Sharswood Townhouses Block Captain $44 $490 Clark Park - Saturday Philadelphia Housing Authority $506 Allison Street Association $122 Supportive Older Women's Network $112 $1,866 Clark Park - Thursday Allison Street Association $318 Lankenau Hospital $70 BenePhilly Center at United Communities $60 $846 Common Ground Philadelphia FIGHT $162 BenePhilly Center at Project HOME $60 Freedom Valley YMCA DPP $56 $560 Dickinson Square Farmers Market* Philadelphia Access Center $48 CHOP Social Workers $46 Diversified Community Center $24 $162 Fair Food Farmstand* Ready Set Grow at Brightside Academy $358 Coalition Against Hunger $228 Penn State Extension $208 $4,098 Fairmount Sharswood Townhouses Block Captain $44 Bebashi $38 Strawberry Mansion CDC $32 $336 Fitler Square Diversified Community Services $58 Sharswood Townhouses Block Captain $24 Penn State Extension $24 $106 Frankford Transportation Center Oxford Circle Mennonite Church $100 Esperanza Health Center $42 State Representative Leslie Acosta $38 $464 Germantown West Oak Lane Senior Center $84 Dorado Village $58 Southern Tabernacle Baptist Church - Acts of Kindness $48 $292 Greensgrow Farms* 11th Street Family Health Services $666 Philadelphia County Assistance Office $42 Esperanza Health Center $20 $804 Headhouse - Sunday Democratic Ward 2 $156 Supportive Older Women's Network $8 Sharswood Townhouses Block Captain $6 $188 Hunting Park Hunting Park Fun and Fitness Day 2016 $770 Hunting Park United $728 Hunting Park Community Garden $226 $2,830 Liberty Lands Park Sharswood Townhouses Block Captain $10 11th Street Family Health Services $10 Health Center Nutrionists $10 $24 Overbrook Farms Lankenau Hospital $174 Strawberry Mansion CDC $90 Strawberry Mansion NAC $28 $410 Oxford Circle Oxford Circle Mennonite Church $522 Fresh For All at Houseman Recreation Center $114 Health Center Nutrionists $64 $1,032 Park and Tabor Einstein Hospital $784 Sharswood Townhouses Block Captain $60 Philadelphia County Assistance Office $42 $1,084 Philly Urban Creators* N/A N/A N/A N/A N/A N/A N/A Schuylkill River Park N/A N/A N/A N/A N/A N/A N/A SHARE Nice Roots Farm* Abbottsford Falls Family Practice $302 Strawberry Mansion NAC $104 PDPH, Division of Maternal, Child, and Family Health $60 $602 Urban Tree Connection: 21st and Cecil B Moore* Freedom Valley YMCA DPP $78 Health Center Nutrionist $36 Coalition Against Hunger $32 $272 Urban Tree Connection: 42nd and Girard* Philadelphia County Assistance Office $102 Freedom Valley YMCA DPP $12 WIC $6 $124 Walnut Hill Community Farm* N/A N/A N/A N/A N/A N/A N/A West Oak Lane West Oak Lane Senior Center $204 Dorado Village $80 Coalition Against Hunger $64 $510 Across All Markets East Park Revitalization Alliance $2,760 Strawberry Mansion NAC $980 Coalition Against Hunger $902 $25,054 *Partnering farm stand not operated by The Food Trust. 2
The Ten Toe Express Program
 The Ten Toe Express Program A campaign to promote walking and transit use in St. Louis Rail~Volution Conference November 3, 2007 Jessi Erickson, MPH Purpose of Presentation Background on physical activity
Childhood Obesity: A Policy Perspective
 Leadership for Healthy Communities Advancing Policies to Support Healthy Eating and Active Living Childhood Obesity: A Policy Perspective Elizabeth Hinman elizabeth@leadershipforhealthycommunities.org
Strategies to Promote the Availability of Affordable Healthy Food and Beverages
 Strategies to Promote the Availability of Affordable Healthy Food and Beverages CDC Recommended Strategies and Measurements Strategy #1: Communities Should Increase Availability of Healthier Food and Beverage
The best indicator of an individual s and expanding access to parks and open space.
 Health & Wellness Create a Safe and Healthy Built Environment Artist s rendering, 2014 Health is important to Loveland residents, and stakeholders see the many strong connections between quality of life,
Healthy Kids Need Healthy Communities. Addressing Active Living and Healthy Eating through Equitable Policy and Environmental Change
 Healthy Kids Need Healthy Communities Addressing Active Living and Healthy Eating through Equitable Policy and Environmental Change Greetings From Team ALBD! Who We Are National program of RWJF launched
Strawberry Mansion To Pier 70
 7 Effective June 19, 2011 SEPTA Strawberry Mansion To via th, reets Customer Service 215-580-7800 TDD/TTY 215-580-7853 www.septa.org REVISED Dell Music Center 61 rd St East Park Reservoir 32nd St Lehigh
BUILDING THE CASE FOR TRAVEL OPTIONS IN WASHING TON COUNTY. Image: Steve Morgan. Image: Steve Morgan
 BUILDING THE CASE FOR TRAVEL OPTIONS IN WASHING TON COUNTY Image: Steve Morgan Image: Steve Morgan Image: TriMet Image: TriMet WHAT ARE TRAVEL OPTIONS PROGRAMS? Travel options programs encourage residents,
Prioritizing Transportation Policy and Funding for Active Transportation, Safety, Equity and Health
 Mayor Karl Dean, Chairman Prioritizing Transportation Policy and Funding for Active Transportation, Safety, Equity and Health Leslie A. Meehan, AICP Planning and Implementing the Active Community Webinar
Making the Case for Healthy Planning & Initiatives
 Making the Case for Healthy Planning & Initiatives George Berger, AICP NC-ARTS Region 4 Coordinator Cabarrus REACH Safe Routes to School Coordinator Counties Served: Alexander, Cabarrus, Catawba, Cleveland,
Creating Healthy Communities
 Creating Healthy Communities How to Make the Healthy Choice the Easy Choice Sensible Land Use Coalition Saint Louis Park, MN April 24, 2013 as a kid, how did you GET TO SCHOOL? OR GET A GALLON OF MILK?
Cascade Bicycle Club Strategic Plan
 The Greater Context Bicycling has become fundamentally important as large-scale currents of change threaten the health, economy and livability of communities throughout the United States and the world
Sistrunk Corridor DOTMOCRACY SUMMARY
 DOTMOCRACY SUMMARY The TOUCH initiative is a true collaborative working with multi- sector community organizations and agencies to reduce tobacco use and exposure to secondhand smoke, improve access to
Pier 70 to 33rd-Dauphin
 7 SEPTA Effective September 3, 2017 to rd-dauphin Serving Center City Customer Service 215-580-7800 TDD/TTY 215-580-7853 www.septa.org REVISED Dell Music Center 34th St 35th St 36th St 37th St S c huylkill
Access to Nutritious Foods in the Stores of Eeyou Istchee
 Access to Nutritious Foods in the Stores of Eeyou Istchee P r e s e n t e d b y P a u l L i n t o n, A s s i s t a n t D i r e c t o r P u b l i c H e a l t h - C h i s h a a y i y u u M i y u p i m a
Physical activity has a number of benefits
 Health Policy Brief September 2018 Walking Among California Adults Susan H. Babey, Joelle Wolstein, and Allison L. Diamant SUMMARY: This policy brief describes two types of walking among California adults:
PATHS TO PARTICIPATION. How to help hunters and target shooters try new shooting sports activities.
 PATHS TO PARTICIPATION How to help hunters and target shooters try new shooting sports activities. Overview The purpose of this project is to help improve hunting and shooting sports marketing efforts
SHAPE UP SAN FRANCISCO 10 YEAR ANNIVERSARY WATER IS LIFE
 Shape Up SF celebrated its 10 year anniversary in October 2016. To shine a spotlight on chronic disease prevention, Shape Up SF offered mini-grants ranging from $500-$1500 for community organizations to
50th-Parkside to Pier 70
 64 Effective August 26, 2018 SEPTA 50th-Parkside to Serving South and West Philadelphia Customer Service 215-580-7800 TDD/TTY 215-580-7853 www.septa.org 48th St Fairmount Park 52 Park West Town Center
Perryville TOD and Greenway Plan
 Perryville TOD and Greenway Plan Greenway Glossary Pathway: A bicycle and pedestrian path separated from motorized vehicular traffic by an open space, barrier or curb. Multi-use paths may be within the
Everyone Swims Stakeholder and Focus Group Summary
 Everyone Swims Stakeholder and Focus Group Summary Sarah Stempski, MPHc Elizabeth Bennett, MPH, CHES 2010-2011 Background King County is a region surrounded and defined by water, where swimming is a lifetime
PATHS TO PARTICIPATION. How to help hunters and target shooters try new shooting sports activities.
 PATHS TO PARTICIPATION How to help hunters and target shooters try new shooting sports activities. Overview The purpose of this project is to help improve hunting and shooting sports marketing efforts
Leadership for Healthy Communities A 10 Year Retrospective Dr. Kristen Welker-Hood November 15, 2014
 Leadership for Healthy Communities A 10 Year Retrospective Dr. Kristen Welker-Hood November 15, 2014 About Us Leadership for Healthy Communities (LHC) is a national program of the Robert Wood Johnson Foundation
Designing Healthier Environments to Conquer Disease Epidemics: Successes in NYC and Elsewhere. Karen K. Lee, MD, MHSc
 Designing Healthier Environments to Conquer Disease Epidemics: Successes in NYC and Elsewhere Karen K. Lee, MD, MHSc Can Design Help Address Today s Health Epidemics? THE 19th CENTURY: Infectious Diseases
PATHS TO PARTICIPATION. How to help hunters and target shooters try new shooting sports activities.
 PATHS TO PARTICIPATION How to help hunters and target shooters try new shooting sports activities. Overview The purpose of this project is to help improve hunting and shooting sports marketing efforts
Increasing Exercise Adherence through Environmental Interventions. Chapter 8
 + Increasing Exercise Adherence through Environmental Interventions Chapter 8 + Environmental Influences on Eating & Physical Activity (French, Story, & Jeffrey, 2001) Consumption of daily fat doubled
Higher Education and Safe Routes to School
 Higher Education and Safe Routes to School Higher Education & SRTS Michael Hoffman Georgia Tech School of Public Policy michael.hoffmann@pubpolicy.gatech.edu Higher Education & SRTS Dr. Jim Lidstone Live
Get Healthy Walk n Talk Toolkit
 Get Healthy Walk n Talk Toolkit www.gethealthyct.org Last Updated 12/16/16 Get Healthy CT Overview Get Healthy CT (GHCT) is a coalition dedicated to preventing and reducing obesity by removing the barriers
PATHS TO PARTICIPATION. How to help hunters and target shooters try new shooting sports activities.
 PATHS TO PARTICIPATION How to help hunters and target shooters try new shooting sports activities. Overview The purpose of this project is to help improve hunting and shooting sports marketing efforts
U.S. Bicycling Participation Study
 U.S. Bicycling Participation Study Report of findings from the 2016 survey Conducted by Corona Insights Commissioned by PeopleForBikes Released July 2017 Table of Contents Background and Objectives 3 Research
City of Novi Non-Motorized Master Plan 2011 Executive Summary
 City of Novi Non-Motorized Master Plan 2011 Executive Summary Prepared by: February 28, 2011 Why Plan? Encouraging healthy, active lifestyles through pathway and sidewalk connectivity has been a focus
City of Jeffersonville Complete Streets Workshop
 City of Jeffersonville Complete Streets Workshop Planning for a Healthy Community Proudly brought to you by: WORKSHOP OVERVIEW 1. Complete Streets 101 2. Bloomington-Monroe County MPO Policy 3. Mobile
Agenda. US-1 Corridor Study and HIA Update. Pathway Diagram / Primary Indicators. Research Questions. Linking Multimodal Improvements to Indicators
 Icebreaker Agenda US-1 Corridor Study and HIA Update Pathway Diagram / Primary Indicators Research Questions Linking Multimodal Improvements to Indicators Vulnerable Populations US-1 Corridor Study Vision
Neighborhood Assessment: Ketelsen Study Area Implementation Projects
 Neighborhood Assessment: Ketelsen Study Area Implementation Projects May, 2013 WY WE NEED A CANGE 1 in 3 children (33%) are overweight or obese 43% of kids at Ketelsen are overweight or obese 1 in 3 children
EvaluationoftheAARPRed HatSocietyStep&Stride WithRuby:AYear-Long WalkingProgram. ExecutiveSummary
 EvaluationoftheAARPRed HatSocietyStep&Stride WithRuby:AYear-Long WalkingProgram ExecutiveSummary July2008 EXECUTIVE SUMMARY Introduction In 2007, AARP developed a year-long walking program, Step & Stride
PUBLIC OPINION STRATEGIES
 PUBLIC OPINION STRATEGIES National Association of REALTORS The key findings from a national survey of 1,000 adults conducted October 5, 7, 9-10, 2007. 07574 Methodology Public Opinion Strategies is pleased
Bowling Green, KY Technical Appendices
 Bowling Green, KY Technical Appendices 2018 2955 Valmont Road Suite 300 777 North Capitol Street NE Suite 500 Boulder, Colorado 80301 Washington, DC 20002 n-r-c.com 303-444-7863 icma.org 800-745-8780 Contents
WALK- AND bike-friendly TURLOCK
 WALK- AND bike-friendly TURLOCK Ideas to Encourage Walking and Biking Benefits to the COMMUNITY Get Connected People who walk and bike have many more opportunities for casual interactions with friends
TRANSPORTATION & ACCESS
 STATE OF CENTER CITY PHILADELPHIA TRANSPORTATION & ACCESS Matt Stanley Center City is well-positioned at the center of an extensive, multi-modal transportation system. It is located just seven miles from
2013 Pilot. PFBC Mission: To protect, conserve, and enhance the Commonwealth s aquatic resources and provide fishing and boating opportunities
 2013 Pilot PFBC Mission: To protect, conserve, and enhance the Commonwealth s aquatic resources and provide fishing and boating opportunities What s the recipe for an angler? Ingredients Introduction/initiation
Public Healthy and Community Design
 Public Healthy and Community Design Jeffery Rosenhall, MA, LCI #2312 Health Program Manager, CDPH April 24, 2017 Stairwell interventions Urban bike track Public health and planning: A Road Map Planning,
Summary Report: Built Environment, Health and Obesity
 Research and education Built Environment Edmonton Project Summary Report: Built Environment, Health and Obesity Introduction In 2007 the Canadian Institutes of Health Research and the Heart and Stroke
2018 HEALTHY WAY OF LIFE CHALLENGE
 2018 HEALTHY WAY OF LIFE CHALLENGE 0 LIFE TIME TORCHLIGHT 5K July 18, 2018 Whether you re a dedicated runner or just someone who jogs from the couch to the fridge, the Life Time Torchlight Minneapolis
What s Health Got to Do With It? Health and Land Use Planning
 What s Health Got to Do With It? Health and Land Use Planning CANDACE RUTT, PH.D. EXECUTIVE DIRECTOR APRIL 13 TH, 2016 Planning and Public Health Planning + Public Health Healthy Communities Healthier
SAMPLE REPORT SUPPLEMENTAL REPORT
 SAMPLE REPORT SUPPLEMENTAL REPORT Handgun Consumers: An In-Depth Exploration Supplement to the Consumer Segmentation Analysis on the Commercial Firearms & Accessories Market 2017 Southwick Associates,
EAST VILLAGE SHOPPERS STUDY A SNAPSHOT OF TRAVEL AND SPENDING PATTERNS OF RESIDENTS AND VISITORS IN THE EAST VILLAGE
 EAST VILLAGE SHOPPERS STUDY A SNAPSHOT OF TRAVEL AND SPENDING PATTERNS OF RESIDENTS AND VISITORS IN THE EAST VILLAGE CONTENTS 2 4 5 6 7 16 17 19 SUMMARY INTRODUCTION BACKGROUND METHODOLOGY RESULTS CONCLUSION
INTRODUCTION. Specifically, the objectives are to:
 INTRODUCTION The River to Sea Transportation Planning Organization (TPO) conducts the Tell the TPO Transportation Trends Survey to better understand the transportation preferences and priorities for the
Impacts and opportunities: Results from a discussion of Cycles for Change s work in the Twin Cities metropolitan area
 Cycles for Change Impacts and opportunities: Results from a discussion of Cycles for Change s work in the Twin Cities metropolitan area In 2013, Cycles for Change received funding from the Center for Prevention
2nd-Lombard to Conshohocken- Monument
 40 Effective August 26, 2018 SEPTA 2nd-Lombard to Conshohocken- Monument Serving Society Hill and West Park Customer Service 215-580-7800 TDD/TTY 215-580-7853 www.septa.org NEW on this Route... Improved
Transportation Issues Poll for New York City
 2016-17 Transportation Issues Poll for New York City 82% support Vision Zero and reducing traffic deaths 72% on average, support more street space for children to play, protected bike lanes and other safety
The Bailey Green Initiative
 The Bailey Green Initiative May 8 th Panel; Buffalo-Niagara Partnership Full service, award winning contract manufacturer of single use medical devices Serving the global marketplace for 35 years; U.S.,
2007 Quad Cities Community Vitality Scan
 2007 Quad Cities Community Vitality Scan SPONSORED BY Amy Helpenstell Foundation Community Foundation of the Great River Bend Moline Foundation Quad City Health Initiative United Way of the Quad Cities
Appendix 21 Sea angling from the shore
 Appendix 21 Sea angling from the shore LUC SMRTS2015 Final Report 342 March 2016 Appendix 21 Sea angling from the shore Table A21.1: Summary of sample confidence levels Responses Spatial data Questionnaire
On Tuesday, October 24, No Stopping signs will be posted along the route to notify the public. 1
 Philly Free is a people-powered initiative of the City of Philadelphia. Philly Free temporarily closes streets to cars, inviting people to walk, bike, and play. Join us on Saturday, October 28 (8AM 1PM)
Breaking Barriers to Bike Share: Lessons on Bike Share Equity
 ITE STRATEGIC PLAN Breaking Barriers to Bike Share: Lessons on Bike Share Equity shutterstock/william Perugini By Nathan McNeil, Joseph Broach, and Jennifer Dill The number of public bike share systems
The Impact of Transportation on Health: Evidence, Practice and the Case for Mode Shift
 The Impact of Transportation on Health: Evidence, Practice and the Case for Mode Shift WE BUILD A BRIGHTER FUTURE Loel Solomon, Ph.D. Vice President, Community Health Kaiser Permanente Transportation Research
The National Citizen Survey. Bowling Green, KY. Technical Appendices
 The National Citizen Survey Bowling Green, KY Technical Appendices 2014 National Research Center, Inc. Boulder, CO International City/County Management Association Washington, DC Contents Appendix A: Complete
Molalla HEAL MAPPS Community Report
 Molalla HEAL MAPPS Community Report This report was collaboratively generated by Beret Halverson, Oregon State University Extension, Clackamas County, OR and D. John, K. Gunter, and L. Etuk, Oregon State
RESEARCH James F. Sallis San Diego State University
 An Active Living Program supported by The Robert Wood Johnson Foundation and administered by San Diego State University. Active Living and Parks: Using Research to Inform Practice Active Living RESEARCH
Target population involvement in urban ciclovias: a preliminary evaluation of St. Louis Open Streets
 Washington University in St. Louis Washington University Open Scholarship Brown School Faculty Publications Brown School 2012 Target population involvement in urban ciclovias: a preliminary evaluation
Complete Streets Basics and Benefits
 Complete Streets Basics and Benefits November 14, 2017 Complete Streets Workshop Ann Ogoreuc, AICP, Allegheny County Economic Development Hannah E. Hardy, Allegheny County Health Department Benefits of
Diversity & Inclusion 9
 Diversity & Inclusion 9 Diversity and inclusion (D&I) is a top strategic priority for the USTA. As such, the USTA created four subcommittees for the four major target demographic areas African-American,
WALK Friendly Communities: Creating Vibrant, Inclusive Places for People
 WALK Friendly Communities: Creating Vibrant, Inclusive Places for People Walkers are the indicator species for vibrant communities ~ Dr. Rodney Tolley, Director, Walk21 Imagine yourself walking safely
Public Health in the Public Realm: Influencing Street Design with Health in Mind Dr. David McKeown Medical Officer of Health
 Public Health in the Public Realm: Influencing Street Design with Health in Mind Dr. David McKeown Medical Officer of Health Complete Streets Forum April 23, 2010 Common Goals of Public Health and Complete
APPENDIX A COUNTY-LEVEL HOUSING CHARACTERISTICS IN 2000
 APPENDIX A COUNTY-LEVEL HOUSING CHARACTERISTICS IN 2000 Overview There are 67 counties in Pennsylvania, some of which are urban and others rural. Pennsylvania is home to the major cities of Philadelphia
Access of West Michigan WALK FOR GOOD FOOD HEALTHY - GREEN - FAIR - AFFORDABLE MAY 6, 2018
 Access of West Michigan WALK FOR GOOD FOOD HEALTHY - GREEN - FAIR - AFFORDABLE MAY 6, 2018 SPONSORSHIP PACKET 2018 Help make a difference in your community by partnering with us today! The Access Hunger
Safe Routes to School
 Safe Routes to School Amy Paxton-Aiken, Center TRT University of North Carolina Chapel Hill, NC and Ian Thomas, Executive Director PedNet Coalition Columbia, MO Housekeeping If you are calling in on a
Healthy Toronto by Design: The role of public health in shaping a healthy city
 Healthy Toronto by Design: The role of public health in shaping a healthy city Monica Campbell, Ronald Macfarlane and Carol Mee Healthy Public Policy, Toronto Public Health Presented at the 141 st American
SAMPLE REPORT. Supplement to the Consumer Segmentation Analysis on the Commercial Firearms & Accessories Market
 SAMPLE REPORT SUPPLEMENTAL REPORT Modern Sporting Rifle Owners: An In-Depth Exploration Supplement to the Consumer Segmentation Analysis on the Commercial Firearms & Accessories Market 2017 Southwick Associates,
Active People, Healthy Nation Creating an Active America, Together
 National Center for Chronic Disease Prevention and Health Promotion Division of Nutrition, Physical Activity, and Obesity Active People, Healthy Nation Creating an Active America, Together October 19,
Growing Bicycle Travel & Tourism for Economic Development Jeff Miller, VP North America
 Growing Bicycle Travel & Tourism for Economic Development Jeff Miller, VP North America 202-445-4415 Jeff@CycleLifeHQ.com 1 2 3 4 Growing Bicycle Travel & Tourism for Economic Development Jeff Miller,
Trail Use in Itasca County
 ACTIVE LIVING FOR ALL Trail Use in Itasca County 2016 Report Get Fit Itasca was founded in 2008 with the goal of engaging community members in making healthy choices and participating in activities that
EXTRACTS OF THYME. Fall Produce Picks. October, November, December eatsmartmd.blogspot.com/2018/10/fall-produce-picks.html
 EXTRACTS OF THYME Fall Produce Picks October, November, December 2018 eatsmartmd.blogspot.com/2018/10/fall-produce-picks.html Fall brings cooler temperatures and shorter days, but great produce at the
GRAHAM PEDESTRIAN TRANSPORTATION PLAN
 GRAHAM PEDESTRIAN TRANSPORTATION PLAN Chapter 1 I 1.1 Scope and Purpose n March of 2005, the City of Graham contracted with Greenways Incorporated (GWI) to create a Pedestrian Transportation Plan. The
2nd-Lombard to Conshohocken- Monument
 40 Effective June 17, 2012 SEPTA 2nd-Lombard to Conshohocken- Monument Serving Society Hill and West Park Customer Service 2-580-7800 TDD/TTY 2-580-7853 www.septa.org 40th St CYNWYD BALA Bala St Joseph
Incorporating Health in Regional Transportation Planning
 Mayor Karl Dean, Chairman Incorporating Health in Regional Transportation Planning Leslie A. Meehan, AICP Center TRT Intervention Webinar January 29, 2013 Objectives for Today Background About the Nashville
PEOPLE ARE PEDESTRIANS BY DESIGN JOIN THE MOVEMENT AT
 PEOPLE ARE PEDESTRIANS BY DESIGN JOIN THE MOVEMENT AT WWW.WALKDENVER.ORG Our Vision: In 2040, Denver will be the most walkable city in the United States. As a result, its residents will be the country
Healthy by Design. Planning & Development for Vibrant Communities. October 9, 2013 State House, Boston, MA. Sponsored by
 Healthy by Design Planning & Development for Vibrant Communities October 9, 2013 State House, Boston, MA Sponsored by Massachusetts Public Health Association Partners HealthCare Metropolitan Area Planning
CML s 91 st Annual Conference June 18 21, 2013 Vail, Colorado. Why a Campaign? Learn More. City of Brush! 6/13/2013
 REVITALI ZE Your Community with LiveWell Colorado s HEAL Cities & Towns Campaign CML s 91 st Annual Conference June 18 21, 2013 Vail, Colorado Vicky Quinlin, Council Member, Brush! Monty Torres, City Administrator,
FACTS AND FIGURES: MAKING THE CASE FOR COMPLETE STREETS IN LEE COUNTY
 FACTS AND FIGURES: MAKING THE CASE FOR COMPLETE STREETS IN LEE COUNTY Safety: Close to 5,000 pedestrians and bicyclists die each year on U.S. roads, and more than 70,000 are injured. [Mean Streets, Surface
About the Active Transportation Alliance
 About the Active Transportation Alliance Chicagoland s voice for better biking, walking and transit Founded 1985 7,000 members, ~33 full time staff Serve Chicago metro region 1 More Cars, More Driving
WILMAPCO Public Opinion Survey Summary of Results
 Wilmington Area Planning Council WILMAPCO Public Opinion Survey Summary of Results Prepared by: 2955 Valmont Road, Suite 300 Boulder, Colorado 80301 t: 303-444-7863 f: 303-444-1145 www.n-r-c.com Table
Objectives. Required Materials:
 Objectives 1. Children will explain one reason salad greens are healthy for them. 2. Children will explain that salad greens come from a plant that grows in the ground. 3. Children will experience salad
OC Healthy Communities Forum. The proportion of the population that live within a half mile of a major transit access point.
 OC Healthy Communities Forum Transit Access The proportion of the population that live within a half mile of a major transit access point. Use of public transit can result in decreased greenhouse gas emissions
CONNECTING PEOPLE TO PLACES
 CONNECTING PEOPLE TO PLACES 82 EAST BENCH MASTER PLAN 07 Introduction The East Bench transportation system is a collection of slow moving, treelined residential streets and major arteries that are the
Incorporating Health in Regional Transportation Planning
 Mayor Karl Dean, Chairman Incorporating Health in Regional Transportation Planning Leslie A. Meehan, AICP Center TRT Intervention Webinar January 29, 2013 Objectives for Today Background About the Nashville
U.S. Hot Tub Market YE 2017
 U.S. Hot Tub Market YE 2017 Industry sales finished up 5.7%, the fifth consecutive yearly increase However, the rate of older spas taken out of service is outpacing new unit sales, thus decreasing the
Built Environment and Older Adults: Supporting Smooth Transitions Across the Life- Span. Dr. Lawrence Frank, Professor and Bombardier UBC
 Built Environment and Older Adults: Supporting Smooth Transitions Across the Life- Span Dr. Lawrence Frank, Professor and Bombardier Chair @ UBC The Hidden Health Costs of Transportation - Frank et al
After a round of introductions of all on the line, Rick Kelly of the Food Security Network provided some introductory comments and information on:
 Teleconference Summary Notes Sustainable Fisheries Teleconference Wednesday, Sept. 21, 2011 1. Participants Approximately 25 people joined in this teleconference presentation and discussion session. Participants
good walking is good business making massachusetts more walkable
 good walking is good business making massachusetts more walkable Nothing draws a crowd like a crowd. P.T. Barnum 15 minutes with WalkBoston who we are / what we do why walkability makes economic sense
Citizens for Modern Transit in Partnership with the Missouri Foundation for Health
 Citizens for Modern Transit in Partnership with the Missouri Foundation for Health Will you lead the next Ten Toe Express? What are the Benefits? Inexpensive: For the price of a bus ticket, seniors can
Bonanza, Oregon HEAL MAPPS Community Report
 Bonanza, Oregon HEAL MAPPS Community Report This report was generated by Laurie Wayne and Patty Case in partnership with Generating Rural Options for Weight Healthy Kids and Communities (GROW HKC) using
What if YOU could help plan Northern Virginia s transportation future?
 What if YOU could help plan Northern Virginia s transportation future? Photo credits: Washington Metropolitan Area Transit Authority And improve the quality of life in your community -- for yourself, your
Getting Bike Shops and Advocates to Collaborate on Safe Routes to School
 Getting Bike Shops and Advocates to Collaborate on Safe Routes to School Safe Routes to School National Partnership Sponsored by the SRAM Cycling Fund Agenda, March 3 rd, 2011 Welcome and Administrative
COMMUNITY PARTICIPATION CHAPTER 8
 COMMUNITY PARTICIPATION CHAPTER 8 8.1 ROLE OF THE CITY S BICYCLE ADVISORY COMMISION 8.2 BICYCLE TRANSPORTATION PLAN STAKEHOLDERS 8.2.1 Stakeholders 8.2.2 Stakeholders Letters of Recommendations 8.3 CITY
PARTNERSHIP OPPORTUNITIES
 PARTNERSHIP OPPORTUNITIES 2017 Since 1967, the Illinois Junior Golf Association (IJGA) has achieved success in developing Better People Through Junior Golf by providing a foundation of sportsmanship, integrity,
Memorial Little League Case Study How a small community-based league created a baseball participation movement
 Memorial Little League Case Study How a small community-based league created a baseball participation movement Summary Memorial Little League, in Omaha, Nebraska, was experiencing a decline in enrollment
DMU 332 Huron, Sanilac and Tuscola Counties Deer Management Unit
 DMU 332 Huron, Sanilac and Tuscola Counties Deer Management Unit Area Description The Greenleaf Deer Management Unit (DMU 332) lies in the Southeast Region of the Southern Lower Peninsula (SLP) and covers
phoenix regional bike share program sponsorship
 phoenix regional bike share program sponsorship High visibility opportunities to promote a healthy lifestyle and sustainable transportation in the Phoenix area what is bike share? Bike share programs are