Lessons from Cities across the Globe
|
|
|
- Mitchell Parsons
- 5 years ago
- Views:
Transcription


1 Cycling to the Future: Lessons from Cities across the Globe John Pucher, Rutgers University Ralph Buehler, Virginia Tech Photo: Susan Handy Photo: Photo: SF Greg Bike Coalition Raisman San Antonio Photo: Bike Texas Photo: Ralph Buehler Photo: Marie Demers
2 Advantages of Cycling: Economical: Affordable by everyone, requiring minimal costs for individuals and governments Good for business: Generate retail sales and profits from tourism No pollution: Clean and quiet Energy-efficient: Use up calories we need to burn off from eating too much Healthy: Many studies report on physical, social, mental health benefits Fun: Getting out into the fresh air with family and friends
3 Cycling Share of Daily Trips in Europe, North 30.0 America, and Australia, Percent of trips by cycling Source: Pucher and Buehler (eds.) City Cycling. Cambridge, MA: MIT Press, 2012


4 Bicycle Share of Work Commuters in the USA (2007) and Canada (2006) Source: Pucher, J., Buehler, R., Seinen, M., Bicycling Renaissance in North America? An Update and Re- Assessment of Cycling Trends and Policies, Transportation Research A, Vol. 45 (6), 2011, pp
5 Lots of Potential for Increased Cycling: Many daily trips in American urban areas are short enough to walk or bike! ~27% of all trips in the U.S. were a mile or shorter in 2009 ~41% of all trips were shorter than two miles
6 Share of Cycling for Short Trips NL 30 DK Percent of trips by cycling <2.5km 2.5km<4.5km 4.5km-6.5km 0<2.5km 2.5km<4.5km 4.5<6.5km 0<2.5km 2.5km<4.5km 4.5km-6.5km 0<2.5km 2.5km<4.5km 5<7.5km USA GER Trip distance category Source: Pucher and Buehler (eds.) City Cycling. Cambridge, MA: MIT Press, 2012
7 Women s Share of Bike Trips in Europe and North America 60% 55% 50% 49% 55% 56% 45% Percent of trips by women 40% 35% 30% 25% 25% 27% 30% 20% 15% 10% USA UK Canada Germany Denmark Netherlands Source: Pucher and Buehler (eds.) City Cycling. Cambridge, MA: MIT Press, 2012


8 Photo Susan Handy
9 70 Percent of bicyclists who are female Toronto Washington Vancouver Chicago More women on bikes = More cycling More cycling = More women on bikes Montreal Portland Minneapolis San Francisco Melbourne Sydney Berlin Tokyo Bicycle share of trips and percentage of female cyclists in 14 large cities Copenhagen Amsterdam 10 0 Source: Garard, Handy, and Dill, Women and Cycling, in Pucher and Buehler (eds.), City Cycling. Cambridge, MA: MIT Press, Percent of trips by bicycle
10 Percent of cyclists who are female 45% 40% 35% 30% 25% 20% 15% 10% 5% More women on bikes = More cycling More cycling = More women on bikes Wyndham Frankston Casey Knox Hume Banyule Glen Eira Kingston Whitehorse Maribyrnong Moonee valley Boroondara Bayside Stonnington Darebin Moreland Melbourne Port Phillip Source: Garard, Handy, and Dill, Women and Cycling, in Pucher and Buehler (eds.), City Cycling. Cambridge, MA: MIT Press, 2012 Yarra Bicycle share of commuter trips and percentage of female cyclists in Melbourne neighborhoods Cycling to work mode share 0% 0% 1% 2% 3% 4% 5% 6% 7% 8%
11 Bike Share of Trips by Age Group Percent of trips by cycling USA UK GER DK NL ' Age Group Source: Pucher and Buehler (eds.) City Cycling. Cambridge, MA: MIT Press, 2012


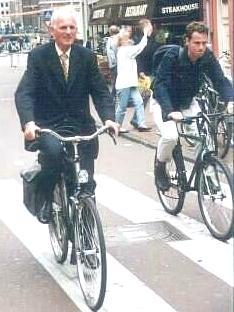

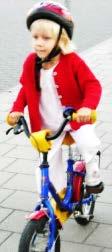

12 Cycling for ALL AGES

13 Photo: NJ Bike Walk Coalition Ann and Mike s Triple Take Tandem Cycling facilities should also be safe for persons with disabilities, and bikes CAN be adapted to their needs Pucher: Walking and Cycling for Health
14 Make Cycling Safe for Everyone! Especially important for the young, the old, for anyone with disabilities, for the timid or risk-averse Women more sensitive to safety than men Safety of cycling in the Netherlands, Denmark, and Germany helps explain high levels of cycling there
15 20.0 Cylists killed per 100 million km cycled 33.5* 18.0 Cylists injured per 10 million km cycled 16.0 Pedestrians killed per 100 million km walked Fatalitities and injuries per trip and per kilometer Pedestrians injured per 10 million km walked Cycling can be made very safe, as in the Netherlands and Denmark NL DK GER UK USA Source: Pucher and Buehler (eds.), City Cycling. Cambridge, MA: MIT Press, 2012
16 Trends in Cyclist Total cyclist fatalities relative to 1970 (= Fatalities USA UK Denmark Germany Netherlands Source: Pucher and Buehler (eds.), City Cycling. Cambridge, MA: MIT Press,
17 Reversal in Public Policies in Germany, Denmark, and the Netherlands in 1970s Pro-car policies in European cities in 1950s and 1960s caused huge decline in cycling and walking Dramatic policy turn-around since 1970s to limit car use and promote cycling, walking, and public transport in Dutch, Danish, and German cities


18 Bridge in Freiburg BEFORE and AFTER reforms 1960s Today

19 Typical residential street in Freiburg AFTER traffic calming reforms Typical residential street in Freiburg BEFORE traffic calming reforms
20 Rebound of Bike Share of Trips in German, Dutch, and Danish Cities Percent of all trips Nuremburg ('76-'12) Berlin ('92-'08) Cologne ('76-'09) Munich ('91-'11) Freiburg ('82-'12) Muenster ('82-'10) Amsterdam ('70-'10) Source: Pucher, Dill, and Handy, Infrastructure, Programs, and Policies to Increase Bicycling, Preventive Medicine, Jan 2010, Vol. 50, S.1, pp. S106-S125. Copenhagen ('98-'10)
21 Recent Boom in Pro-Bike Policies in Many Cities Especially since 2000, European and North American cities without a tradition of cycling for daily travel have dramatically raised cycling levels Improved cycling infrastructure and many other measures to encourage cycling
22 Percent of Trips More and better cycling facilities have dramatically increased bike share of trips in cities without any tradition of cycling for daily travel London ('03-'10) Barcelona ('05-'10) Paris ('01-'10) Bogota ('95-'10) Seville ('00-'12) Source: Pucher, Dill, and Handy, Infrastructure, Programs, and Policies to Increase Bicycling, Preventive Medicine, Jan 2010, Vol. 50, S.1, pp. S106-S125.

23 Photo: Robin Stallings Cycling in Sevilla, Spain increased more than 10-fold after these safe cycle tracks were installed
24 Boom in Cycling to Work in 14 Large US and Canadian Cities Source: Pucher, J. and Buehler, R. City Cycling, MIT Press, Cambridge, Mass, Bike Share of Regular Commutes (USA) / 1996 (Canada) 2011 (USA and Canada) * 2011 figures for Canadian cities are preliminary estimates *

25 6-fold increase in bike trips Sharp increase in cycling safety in Portland as cycling levels rose 70% fall in crash rate Source: City of Portland (2013)
26 How to Encourage More Cycling while Improving Safety Better cycling facilities Integration of cycling with public transport Traffic calming of residential neighborhoods Mixed-use zoning and improved urban design Restrictions on motor vehicle use Traffic education and Safe Routes to School Traffic regulations and enforcement

27 Most European cities have extensive carfree districts ideal for walking and cycling

28 Cycling is perfect for getting around car-free college campuses such as here at UC Santa Barbara Photo: Ralph Fertig Pucher and Buehler: Cycling for Everyone

29 Santa Barbara coastal path: Safe and attractive both for cyclists and pedestrians Conversion of two car lanes to bike path and wider sidewalk Source: Ralph Fertig

30 Source: Warren Salomon Bike paths in Dutch cities make it safe and comfortable for all to bike: including women, children, and seniors

31 One-way cycle track in The Hague Raised curb between cycle track and traffic lane Source: Peter Furth


32 Almost 100km of 2-way cycle tracks in Montreal Separation from traffic via bollards and parked cars Separation from traffic via concrete barriers Photo: Peter Furth Photo: Velo Quebec

33 Provision of cycle track at this key underpass in Montreal Separation from traffic via concrete barriers AND bollards Photo: Velo Quebec

34 380 mi of new bike lanes and paths since 2000 Quadrupling in bike trips since % decrease in serious cyclist injuries 56% increase in retail sales along cycle tracks Photo: NYC DOT Traffic-protected cycle track on 9 th Avenue, NYC

35 Mayor Boris Johnson s planned 15-mile east-west cycle track through the heart of London along Thames River Physically separated cycle track

36 Cycle track on Pennsylvania Avenue in Washington Photo: Ralph Buehler

37 Source: Alta Planning This cycle track in St. Petersburg, Florida has increased cycling by senior citizens and women


38 Construction and maintenance financed by private foundation Photos: Ralph Buehler Cultural Heritage cycle track in Indianapolis Tripling in cycling in Indianapolis since 2000


39 This cycle track in Arkansas was financed by Walmart for employees to bike to its headquarters office. Source: Alta Planning


40 Before After Photo: Paul Krueger Transformation of Hornby Street in Vancouver with installation of first-class cycle track


41 Carrall St Dunsmuir Photo: Paul Krueger Photo: Paul Krueger Photo: Paul Krueger Over 6km of cycle tracks in Vancouver with more planned Burrard Bridge Hornby Photo: Paul Krueger


42 Seattle s first cycle track in 2013 on Linden Avenue, many more planned

43 Photo: Warren Salomon Raised crossing for both cyclist and cars, with special pavement and markings Improving safety of cycle tracks at road crossings

44 Photo: Velo Quebec Safe cycle track crossing at busy intersection in Montreal


45 Bike lanes are much more typical in US cities Photo: Ralph Fertig Photo: Lewis Thorwaldson

46 All streets should come complete with safe facilities for pedestrians and cyclists


47 Pucher: Walking and Cycling for Health Special contraflow lanes in Toronto and Melbourne that permit cyclists to travel in both directions Contra-flow lanes facilitate bike travel in both directions on one-way streets for cars


48 Photo: Seattle DOT Photo: Seattle DOT Bike lanes in Seattle Photo: Seattle DOT Photo: Seattle DOT


49 But bike lanes are definitely better than no separate bike facilities, but they do not provide nearly as much protection of cyclists from motor vehicles as cycle tracks Bike lanes used for car parking Bike lanes used for truck deliveries Dooring of cyclists


50 Photo: Paul Krueger Photo: Nick Klein New York Vancouver Buffered bike lanes offer some additional separation from motor vehicle traffic but without physical barriers

51 Photo: Bob Edmiston How to destroy the benefits of a buffered bike lane: Dearborn Street in Seattle

52 Bridge connections crucial for an integrated cycling network About 20,000 daily bike trips over Portland bridges Photo: Greg Raisman

53 Bike paths on the four East River bridges provide crucial connections from Brooklyn and Queens to Manhattan Source: Transportation Alternatives NYC


54 Photos: Seattle DOT Overpass for cyclists and pedestrians in Seattle

55 Good bike bridge included as part of the Canada Line extension of Skytrain in Metro Vancouver Source: Translink

56 Bike path on south entry to Lion s Gate Bridge in Vancouver Foto: Gordon Price


57 Special traffic signals and signs improve cycling safety


58 Four-way all-green signal for cyclists in Portland Bike sensor in pavement

59 Red bike lanes for intersection crossings, connected with red brick sidepaths on both sides of every road Source: City of Muenster, Germany


60 Bike lane, advance stop line, and priority signal for cyclists in Muenster Bike lane, advance stop line, and special signal for cyclists in Germany

61 Photo: Seattle DOT Bike boxes in Seattle also


62 Bike boxes in Vancouver Foto: Gord Price Foto: Gord Price Foto: Rich Drdul Pucher and Buehler: Cycling for Everyone

63 Why Traffic Calming Saves Lives Speed Speed kills! kills! Source: World Health Organization (2008) and OECD Transport Research Centre (2006)

64 Traffic Calming in Freiburg, Germany Cheap, easy, fast, and effective improvement in cycling safety

65 Photo: Peter Berkeley These streets are, in effect, bike boulevards, neighborhood greenways, and local street bikeways 3,800 km of traffic-calmed streets in Berlin: ideal for cycling: 78% of ALL streets in Berlin!

66 7 km/hr speed limit Shared streets: Typical traffic calming in new German suburbs

67 Shared street in Indianapolis Photo: Ralph Buehler

68 Foto by Peter Berkeley Blockage of through car and truck traffic but convenient cut-through for cyclists and pedestrians


69 Photo: Transports Viables Cheap, easy, and very effective traffic diverters Traffic calming in Quebec City and Montreal Traffic Calming in Québec City Photo: Velo Quebec Source: Transports Viables

70 Source: Eric Anderson Bollard blocks passage of cars Traffic diverter in Berkeley which provides a through connection for two bike boulevards


71 Photo: Paul Krueger Photo: Paul Krueger Photo: Paul Krueger 152km of bike boulevards in Vancouver


72 Photo: Paul Krueger Photo: Paul Krueger Photo: Paul Krueger Cut-thrus along bike boulevards in Vancouver Photo: Paul Krueger Photo: Paul Krueger Photo: Paul Krueger

73 Passage for cyclists through median island at Burnaby intersection in Metro Vancouver Fotos: Rich Drdul Pucher and Buehler: Cycling for Everyone


74 Photo: Richard Drdul Photo: Paul Krueger Traffic calming in Vancouver that creates bike boulevards Photo: Paul Krueger Photo: Mark Seinen


75 Photos: Jonathan Maus Traffic calming turns these streets into bikeways 112 km of bike boulevards in Portland
76 Dutch bicycle facility selection matrix Lane Configuration Average daily traffic (vehicles / day) Urban local street Street type and speed limit Urban through street Rural local road Fast traffic road 30 km/h (19 mph) 50 km/h (31 mph) 60 km/h (37 mph) 70+ km/h (44+ mph) < 2500 advisory bike lane 4 2-way traffic with no centerline 2000 to to 5000 mixed traffic 1 bike lane 2 or cycletrack 3 bike lane 2 or cycle track 5 cycle track or low-speed service road > lanes (1+1) any 4 lanes (2 + 2) or more any bike lane or cycle track bike lane or cycle track (does not exist) bike lane or cycle track 3 bike lane or cycle track 3 Source: Peter Furth, Cycling Infrastructure, in Pucher and Buehler, eds. City Cycling, MIT Press, cycle track or low speed service road
77 Cycling facilities are much cheaper to build than new or widened roadways Germany $12-$150 million per km for new or widened roadway $ million per km for physically separated cycle track $40k-90k per km for on-street bike lane $100k-250k per km of bike boulevard (also known as neighborhood greenways or local street bikeways) Roads about TEN times more expensive than even the most elaborate urban cycle tracks!

78 Economic benefits of this cycle track exceed costs by over three-to-one! Photo: Fiona Campbell Cycling has doubled in Sydney, Australia since installation of its cycle track network


79 Photo: Peter Berkeley BIKE TRANSIT INTEGRATION Photo: Translink Photo: Translink

80 Over 50,000 buses in the USA now come equipped with bike racks, as here in Santa Barbara Source: Ralph Fertig

81 Bike on LRT in NJ and Minneapolis Photo: John Boyle Photo: Metro Transit

82 Capacity: 3,500 bikes Bike Station next to main train station in Muenster, Germany Photo: Peter Berkeley


83 Capacity: 150 bikes Bike Station next to Union Station in Washington, D.C. Photo: Ralph Buehler


84 300 bike parking spaces in two bike cages at northern terminus of subway line in Boston Bike-transit integration at Alewife Station on Red Line in Boston Photo: David Loutzenheiser


85 Bikes on Caltrain in San Francisco Photo: Ralph Buehler Photo: San Francisco Bicycling Coalition Photo: John Pucher

86 Bi-directional cycle track and bike sharing near metro station in Montréal Metro station BIXI bike docking station Cycle track Source: Vélo Québec


87 Nice Ride in Minneapolis Hubway Bikeshare in Cambridge, Boston, Somerville, and Brookline Over 50 bike sharing systems in North America by end of 2013 Capital Bikeshare in Washington, DC


88 Citi Bike in New York Launched May 27, ,000 bikes 330 bike stations Over 20,000 annual members Which is the cheaper and more sensible way to get exercise? Photo: Alta Planning


89 Photo by Susan Handy Innovative directional signs and bike trip counters in Denmark Photo by Susan Handy Pucher and Buehler: Cycling for Everyone

90 Photo: Paul Krueger Convenient, free air pumps for bikes on local neighborhood bikeways in Vancouver Pucher and Buehler: Cycling for Everyone


91 27 bike corrals in San Francisco Good bike parking benefits merchants 97 bike corrals in Portland
92 Children who bike or walk to school learn better: More attentive and able to concentrate Advanced mental alertness by half a school year More benefit for mental development than having breakfast and lunch Source: Egelund et al. (2012). Study of over 20,000 school children


93 Safe Routes to Schools Photos: Bike Texas

94 Photo: Warren Salomon Bike path leads directly to school in NL

95 Photo: Fiona Campbell After installation of this cycle track in Sydney, Australia, over a third of children now bike to school!


96 Photos: Ralph Buehler Cycling training and testing course in Berlin Most German and Dutch children take cycling lessons by the 3 rd or 4 th grade and must pass a police-administered cycling safety test!


97 Source: NJ Bike Walk Coalition Bike Training for Children in New Jersey Buehler and Pucher Promoting Walking and Cycling


98 Cycling training course for adults Photo: Bonnie Fenton Foto: Amy Walker

99 Source: Troels Andersen Guided Bicycle Tours for Seniors

100 Bike to Work Day in San Francisco Source: San Francisco Bicycle Coalition

101 Photo: Troels Andersen GIVE EMPLOYEES FREE BIKES! The perfect zero emissions vehicles!

102 Over 100,000 participants at LA s fourth annual CicLAvia in October 2012 Source: Ryan Snyder CicLAvia: 9 miles of car-free streets in Los Angeles
103 Expansion of Open Streets (Ciclovias) in the Americas (cities with at least two events per year) Source: Sarmiento et al. (2013). Open Streets: A Healthy Epidemic. Bogota, Colombia: Universidad de los Andes. Financed by Centers for Disease Control and Prevention

104 WNBR in 74 cities in 2010 Photo: Don Miller The Summer Solstice naked bike ride in Seattle can be fun as well, provided you have the right body!
105 Implementation Strategies 1. Publicize both individual and societal benefits 2. Ensure citizen participation at all stages of planning and implementation 3. Develop long-range bike plans; regularly update them 4. Implement controversial policies in stages, easiest first 5. Combine incentives for cycling and walking with disincentives for car use 6. Build alliances among ped/bike groups and with transit, environmentalists, public health, business leaders, politicians, and media 7. Coordinate ped/bike advocacy and planning through local, regional, and national organizations 8. Local political leadership is essential

106 New book with MIT Press About the authors:
107 CONCLUSIONS Many economic, environmental, social, and health benefits of cycling Even in North America, many local trips are short enough to cover by cycling Many cities throughout the USA and Canada are vastly improving their cycling facilities But much more could be done, and there are many ways to do it.
How to Increase Cycling for Daily Travel: Lessons from Cities across the Globe
 How to Increase Cycling for Daily Travel: Lessons from Cities across the Globe Joint Webinar for the Institute of Transportation Engineers and the Active Living Research Program of the Robert Wood Johnson
Streets for Everyone: Lessons from Cities across the Globe
 Streets for Everyone: Lessons from Cities across the Globe John Pucher, Rutgers University Photo: Susan Handy Complete Streets Forum, Toronto, Canada, Oct 6, 2014 Photo: Ralph Buehler Complete Streets
Promoting Walking and Cycling in Los Angeles: Lessons from Europe and North America
 Promoting Walking and Cycling in Los Angeles: Lessons from Europe and North America John Pucher, Rutgers University, and Ralph Buehler, Virginia Tech Walking and Cycling: the MOST sustainable transport
Promoting Safe Walking and Cycling: Lessons from Europe and North America. John Pucher, Rutgers University, and Ralph Buehler, Virginia Tech
 Promoting Safe Walking and Cycling: Lessons from Europe and North America John Pucher, Rutgers University, and Ralph Buehler, Virginia Tech Walking and Cycling: the MOST sustainable transport modes MOST
SUSTAINABILITY, TRANSPORT, & HEALTH. Ralph Buehler, Virginia Tech
 SUSTAINABILITY, TRANSPORT, & HEALTH Ralph Buehler, Virginia Tech Prepared for National Academies Roundtable on Science and Technology for Sustainability 6 December 2013 Overview Trends in Motorization
Walking and Cycling for Healthy Cities
 Walking and Cycling for Healthy Cities Prof. John Pucher, Rutgers University http://policy.rutgers.edu/faculty/pucher Walking and Bicycling: the MOST sustainable transport modes MOST environmentally friendly:
BIKE TRANSIT INTEGRATION IN NORTH AMERICA. John Pucher & Ralph Buehler
 BIKE TRANSIT INTEGRATION IN NORTH AMERICA John Pucher & Ralph Buehler Synergies: Bicycling and Public Transport: Perfect Together? Cycling extends catchment areas of transit stops far beyond walking range
Infrastructure and Programs. What does the data say? Advancing Non-motorized Transportation in Vermont 11/15/09
 Advancing Non-motorized Transportation in Vermont A reply from the university point of view Lisa Aultman-Hall Professor and Director Figure 4 Why Canadians Cycle more than Americans: A Comparative Analysis
Walking and Cycling for ALL New Jerseyans
 Walking and Cycling for ALL New Jerseyans Prof. John Pucher, Rutgers University http://policy.rutgers.edu/faculty/pucher Walking and Bicycling: the MOST sustainable transport modes MOST environmentally
Lessons from Copenhagen. John L Bowman 2013
 Lessons from Copenhagen John L Bowman 2013 Bicycle Strategy Official municipal policy Goals for the next 15 years Updated after 5-10 years 32 page glossy brochure BAC December 2, 2013 John L Bowman 2 Bicycle
Forhealth health, forfun, for transportation. Prof. John Pucher, Rutgers University
 BIKING FOR ALL TEXANS Forhealth health, forfun, for transportation Prof. John Pucher, Rutgers University Walking and Bicycling: the MOST sustainable ti transport tmodes MOST environmentally friendly: >Virtually
Travel Behavior, Transport Policy, and Sustainable Transport in Germany and the USA
 Travel Behavior, Transport Policy, and Sustainable Transport in Germany and the USA Similarities between Germany and the USA Federal system of government, tradition of local self-government Strong economy,
Canada. UK France. Walk, Bike, Transit Share of Trips
 1950s 1960s Today Relationship between Share of Urban Trips by Transit, Bicycle, and Foot and Per Capita Annual CO 2 Emissions from Road and Rail Transport in Australia, Canada, the USA and EU Countries,
Safety in numbers What comes first safety or numbers? Jan Garrard School of Health and Social Development Deakin University
 Safety in numbers What comes first safety or numbers? Jan Garrard School of Health and Social Development Deakin University The safety in numbers theory As the number of cyclists increases, injury rates
The Transformation of Portland into a Two-Wheeled Mecca. Mia Birk, Principal, Alta Planning + Design
 The Transformation of Portland into a Two-Wheeled Mecca Mia Birk, Principal, Alta Planning + Design Development of Portland s Bikeway Network 1990 Early 1990s Infrastructure Growing Public Support Growing
Canada s Capital Region Delegation to the Velo-City Global 2010 Conference
 Canada s Capital Region Delegation to the Velo-City Global 2010 Conference Report of Findings from Visits, Meetings & Presentations In Amsterdam-Den Haag, Utrecht, Berlin & Copenhagen The Itinerary Copenhagen
Complete Streets 101: The Basics
 Complete Streets 101: The Basics Michigan Municipal League - Capital Conference March 21, 2017 Chip Smith, AICP - Senior Planner - Wade Trim Inc. and City Council member City of Ann Arbor 2017 MML Capital
Cycle Tracks: Concept and Design Practices. February 17, 2010
 Cycle Tracks: Concept and Design Practices February 17, 2010 Today s webinar presenters APBP Board Member Host Brett Hondorp, Principal, Alta Planning + Design Guest Moderator Zach Vanderkooy, Bicycling
Facility preferences & safety
 Photo Flickr: Boegh Facility preferences & safety Evidence from two studies Kay Teschke School of Population & Public Health University of British Columbia Canadians don t cycle much % of trips by bike
Bicycle Facilities Planning
 Bicycle Facilities Planning Overview Types of Cyclists Purpose for Riding Types of Facilities Bike Lanes Bicycle Boulevards Cycle Tracks Intersections Signals Signing and Marking Discussion Types of Bicyclists
Cycling for Everyone:
 Cycling for Everyone: The Key to Public and Political Support John Pucher Rutgers University (http://policy.rutgers.edu/faculty/pucher.html) Reasons for everyone to support cycling: More daily physical
Policy Context & Network Planning Principles UBC Bike Design Course, Vancouver Dale Bracewell, Manager, Active Transportation
 Policy Context & Network Planning Principles UBC Bike Design Course, Vancouver Dale Bracewell, Manager, Active Transportation Work With our Partners Municipal Regional Provincial Federal Railways, borders,
Bike lanes for. Everyone
 Bike lanes for Everyone Goal: To increase the people riding bicycles as a normal part of every day life People riding bicycles as a normal part of every day life Regardless of age, gender, and social /
The City of Chicago s. Bike 2015 Plan. Nick Jackson, Deputy Director Chicagoland Bicycle Federation RAIL-VOLUTION 2006
 The City of Chicago s Bike 2015 Plan Nick Jackson, Deputy Director Chicagoland Bicycle Federation RAIL-VOLUTION 2006 Plan funded by $75,000 grant from the Unified Work Program (UWP) received from the Chicago
Child- and Youth-friendly Land-use and Transport Planning Guidelines
 Child- and Youth-friendly Land-use and Transport Planning Guidelines Richard Gilbert Centre for Sustainable Transportation (In April 2006, the Centre moved from Toronto, Canada, to the University of Winnipeg)
Land Use & Transportation
 21 st Century Transportation in Convenient Communities Prof. Paul Okamoto s Sustainable Design University of San Francisco 24 September 2014 Land Use & Transportation ASHRAE Golden Gate Seminar Sustainable
1
 swadle@wichita.gov 1 I expect not only to take all of their [Seattle and Portland s] bikers but I also want all the jobs that come with this, all the economic growth that comes with this, all the opportunities
Bicycle Boulevards and Neighborhood Greenways
 Bicycle Boulevards and Neighborhood Greenways Traffic Safety is Improving for Everyone 90 80 70 60 50 40 30 20 10 0 PORTLAND: TOTAL TRAFFIC FATALITIES 1986-2008 1986 1987 1988 1989 1990 1991 1992 1993
Bicycle Master Plan Goals, Strategies, and Policies
 Bicycle Master Plan Goals, Strategies, and Policies Mobilizing 5 This chapter outlines the overarching goals, action statements, and action items Long Beach will take in order to achieve its vision of
Appendix C 3. Bicycle / Pedestrian Planning
 Appendix C 3. Bicycle / Pedestrian Planning BICYCLE/PEDESTRIAN PLANNING 2005 Master Plan GOAL: Provide for safe and convenient bicycle and pedestrian circulation throughout the City. Develop a city-wide
Toronto Complete Streets Guidelines
 88 90 5.1 Cycling Design Principles 92 5.2 Context-sensitive Cycling Facilities 96 5.3 Key Cycling Elements Cycling infrastructure provides choice in how people are able to move around the city. Cyclists
South Bay Bicycle Master Plan American Planning Association National Conference Los Angeles, CA
 South Bay Bicycle Master Plan 2012 American Planning Association National Conference Los Angeles, CA April 17, 2012 Overview I. Background II. The Importance of Partnerships III. Approach and Success Stories
Who is Toole Design Group?
 2018 AASHTO Bike Guide Status Update NCHRP 15 60 Amalia Leighton Cody, PE, AICP & Kenneth Loen, PE Washington APWA October 4, 2018 Who is Toole Design Group? TDG is a full service engineering, planning
About the Active Transportation Alliance
 About the Active Transportation Alliance Chicagoland s voice for better biking, walking and transit Founded 1985 7,000 members, ~33 full time staff Serve Chicago metro region 1 More Cars, More Driving
Health, Transportation and Bicycling: Connecting the Dotted Lines
 Portland State University PDXScholar Urban Studies and Planning Faculty Publications and Presentations Nohad A. Toulan School of Urban Studies and Planning 11-17-2010 Health, Transportation and Bicycling:
Aaron s European Transportation Vacation Slide Show
 New York Metropolitan Transportation Council Brown Bag Lunch Speakers Series Aaron s European Transportation Vacation Slide Show Presentation by Aaron Naparstek Wednesday, November 16, 2005. Permission
Building a Toronto that Moves
 Building a Toronto that Moves Image courtesy of the City of Toronto Setting Election Priorities for Walking, Cycling & Public Transit Toronto is a fast-paced, dynamic city. It s a city that moves except
PEDALING FORWARD. A Glance at the SFMTA s Bike Program for SFMTA.COM
 PEDALING FORWARD A Glance at the SFMTA s Bike Program for 2017-2021 SFMTA.COM INTRODUCTION About This Booklet More people from all walks of life see their bicycle as a more convenient way to get where
SOCIALLY AND ENVIRONMENTALLY SUSTAINABLE URBAN TRANSPORT
 SOCIALLY AND ENVIRONMENTALLY SUSTAINABLE URBAN 1 Not only for clean air, but for basic human rights, those without cars must also be able to move without fear of being killed. 2 Bogotá is far from being
FEDERAL HIGHWAY ADMINISTRATION APPLICATION
 FEDERAL HIGHWAY ADMINISTRATION APPLICATION REQUEST FOR PERMISSION TO EXPERIMENT WITH A BICYCLE BOX INTERSECTION TREATMENT Submitted by: City of Columbus Department of Public Service Date: June 26, 2009
Arlington County, Virginia ~ National Capital Region Transportation Planning Board (TPB) Transportation and Land-Use Connections (TLC) Program
 Transportation and Land-Use Connections (TLC) Program") Arlington County, Virginia ~ National Capital Region Transportation Planning Board (TPB) Transportation and Land-Use Connections (TLC) Program May 4, 2011 Nature of the Problem European and US Best Practices
Arlington County, Virginia ~ National Capital Region Transportation Planning Board (TPB) Transportation and Land-Use Connections (TLC) Program May 4, 2011 Nature of the Problem European and US Best Practices
Public Transport and Development: Making It Work
 Public Transport and Development: Making It Work Robert T. Dunphy Urban Land Institute World Bank Transport Forum 2006 March 28, 2006 Transportation Development Disconnect Now Few Then places w/o car Many
PROPOSED HIGH STREET TRAFFIC CALMING PLAN
 PROPOSED HIGH STREET TRAFFIC CALMING PLAN Pottstown Borough has conducted two studies in recent years to revitalize its downtown area and make its main street, High Street, safer and more attractive for
Perryville TOD and Greenway Plan
 Perryville TOD and Greenway Plan Greenway Glossary Pathway: A bicycle and pedestrian path separated from motorized vehicular traffic by an open space, barrier or curb. Multi-use paths may be within the
Space for Cycling. Delivering healthy streets. Roger Geffen Policy Director, Cycling UK
 Space for Cycling Delivering healthy streets Roger Geffen Policy Director, Cycling UK About Cycling UK 65,000 members, founded 1878 Cycling activities, membership services (legal, insurance, magazine)
2.0 LANE WIDTHS GUIDELINE
 2.0 LANE WIDTHS GUIDELINE Road Engineering Design Guidelines Version 2.0.1 May 2018 City of Toronto, Transportation Services City of Toronto Page 0 Background In early 2014, Transportation Services initiated
Is St. Louis Ready for a Bike Share System? May 14, 2014 Public Open House
 Is St. Louis Ready for a Bike Share System? May 14, 2014 Public Open House PRESENTATION AGENDA 2 BIKE SHARE How does it work? What are the benefits? Who would use it? Will it be safe? Would it work in
Color your stress away
 Color your stress away Learn about the Bicycle Master Plan s comfortable, low-stress bicycling network in Montgomery County. Unwind as you color the bicycling scenes. Check out montgomeryplanning.org/bikeplan
Discussion: Bicycle Benefits
 Discussion: Bicycle Benefits 3 Bicycling has increased in popularity over the last decade as Americans realize its health, transportation, and financial benefits. Cities across the United States and within
Biking Culture In US Cities Compared to That of Amsterdam and Copenhagen
 Biking Culture In US Cities Compared to That of Amsterdam and Copenhagen Benefits of Biking Environmental Less Expensive Healthier Safer -No emissions (that contribute to air pollution and climate change)
Film Guide for Educators. Designing for Safety
 Film Guide for Educators Designing for Safety Designing For Safety Key Concepts Speeding While Driving Speeding is the number one cause of injuries and deaths from driving. The main reasons are because
NACTO Designing Cities 2014 Dongho Chang, City Traffic Engineer October 23, 2014
 NACTO Designing Cities 2014 Dongho Chang, City Traffic Engineer October 23, 2014 Presentation overview Perspective on Safety Changing needs of our cities How Seattle is meeting those needs Challenge for
outline 1. why cycle? 2. (safety health) 3. safe system 4. what next
 3. safe system 4. what next") outline 1. why cycle? 2. (safety health) 3. safe system 4. what next In a city of many cyclists, why do they ride? Copenhageners reasons for cycling to and from work (multiple answers) 56% it s faster
outline 1. why cycle? 2. (safety health) 3. safe system 4. what next In a city of many cyclists, why do they ride? Copenhageners reasons for cycling to and from work (multiple answers) 56% it s faster
Promoting Sustainable Urban Transport: Lessons from Germany Ralph Buehler and John Pucher
 Promoting Sustainable Urban Transport: Lessons from Germany Ralph Buehler and John Pucher Presented at: "Lessons from Europe Jean Monnet Research Workshop Rutgers Center for European Studies, September
Planning Suburban Bike Networks
 Planning Suburban Bike Networks Stacey Meekins, AICP 28 October, 2015 Bikeway design guidance Different Cyclists Have Different Needs No interest 33% Strong and Fearless 1% Enthused and Confident 7% Interested,
Cycling Economies. Economic Impacts of Bike Lanes. Daniel Arancibia
 Cycling Economies Economic Impacts of Bike Lanes Daniel Arancibia Introduction Research is showing that cyclists are good customers, that their numbers and economic impact increase with bike lanes, and
Sustainable Transportation Planning in the Portland Region
 Sustainable Transportation Planning in the Portland Region Jennifer Dill, Ph.D. Associate Professor School of Urban Studies & Planning jdill@pdx.edu http://web.pdx.edu/~jdill/ Outline Elements of a sustainable
LANCASTER CITY BICYCLE NETWORK
 LANCASTER CITY BICYCLE NETWORK Downtown Merchants Meeting Wednesday, July 19, 2017 http://www.lancasteratp. DOWNTOWN WALKABILITY ANALYSIS What changes can be made, in the least amount of time, and for
Win-Win Transportation Solutions
 Win-Win Transportation Solutions Todd Litman Victoria Transport Policy Institute Presented Lipinski Symposium on Transportation Policy Chicago, Illinois 15 October 2007 What is The Transportation Problem?
What route types best motivate cycling? Evidence about route preferences & safety
 What route types best motivate cycling? Evidence about route preferences & safety Photo: Ken Ohrn Kay Teschke School of Population & Public Health The University of British Columbia Canadians don t cycle
12 RECOMMENDATIONS Road Improvements. Short Term (generally the next five years)
") 12 RECOMMENDATIONS Recommendations are based on the technical analysis of existing and future road and active transportation conditions, the results of the review of existing City policies and public feedback.
12 RECOMMENDATIONS Recommendations are based on the technical analysis of existing and future road and active transportation conditions, the results of the review of existing City policies and public feedback.
Protected Bike Lanes in San Francisco Mike Sallaberry SFMTA NACTO Workshop - Chicago IL
 Protected Bike Lanes in San Francisco Mike Sallaberry SFMTA 10 14 2011 NACTO Workshop - Chicago IL San Francisco 2 nd Highest Density in the U.S. 47 square miles Mild Climate Market Population ~810,000
DOWNTOWN MIAMI PEDESTRIAN PRIORITY ZONE
 DOWNTOWN MIAMI PEDESTRIAN PRIORITY ZONE AUGUST 6, 2013 DOWNTOWN MIAMI BY THE NUMBERS more than 200,000 people live, work, and play here every day is home to more than 1,000 events each year hosts more
Proposed White Flint Separated Bike Lane Network September 2015
 Proposed White Flint Separated Bike Lane Network September 2015 Abstract This report includes a proposed separated bike lane network for the White Flint Sector Plan area. Separated bike lanes create a
WALK- AND bike-friendly TURLOCK
 WALK- AND bike-friendly TURLOCK Ideas to Encourage Walking and Biking Benefits to the COMMUNITY Get Connected People who walk and bike have many more opportunities for casual interactions with friends
Hennepin County Bicycle and Pedestrian Planning
 Hennepin County Bicycle and Pedestrian Planning 1 Value of bicycle and sidewalk systems Safety Livability Mobility Health Personal Finances Economic Sustainability Clean Air Recreation Parking and congestion
Solana Beach Comprehensive Active Transportation Strategy (CATS)
") Solana Beach Comprehensive Active Transportation Strategy (CATS) 3.0 Goals & Policies The Solana Beach CATS goals and objectives outlined below were largely drawn from the Solana Beach Circulation Element
Solana Beach Comprehensive Active Transportation Strategy (CATS) 3.0 Goals & Policies The Solana Beach CATS goals and objectives outlined below were largely drawn from the Solana Beach Circulation Element
Mobilising Business Communities to Support Safe Cycling Infrastructure. Daniel Arancibia, Mikey Bennington, Beth Savan
 Mobilising Business Communities to Support Safe Cycling Infrastructure Daniel Arancibia, Mikey Bennington, Beth Savan Introduction Cycling advocates lobby for bike lanes by praising the social/environmental
2015 Florida Main Street Annual Conference. Complete Streets Equal Stronger Main Streets
 WHAT ARE COMPLETE STREETS? CASE STUDIES COMPLETING YOUR MAIN STREET 2015 Florida Main Street Annual Conference St. Petersburg, Florida August 19, 2015 WHAT ARE COMPLETE STREETS? CASE STUDIES COMPLETING
Physical Implications of Complete Streets Policies
 Presentation Overview Physical Implications of Complete Norm Cox, ASLA, LLA Landscape Architect Ann Arbor, Michigan, 10:45 to Noon What Are Complete Streets? What Matters to Bicyclists and Pedestrians
EAST VILLAGE SHOPPERS STUDY A SNAPSHOT OF TRAVEL AND SPENDING PATTERNS OF RESIDENTS AND VISITORS IN THE EAST VILLAGE
 EAST VILLAGE SHOPPERS STUDY A SNAPSHOT OF TRAVEL AND SPENDING PATTERNS OF RESIDENTS AND VISITORS IN THE EAST VILLAGE CONTENTS 2 4 5 6 7 16 17 19 SUMMARY INTRODUCTION BACKGROUND METHODOLOGY RESULTS CONCLUSION
Board-Approved Funding Awards for Cycle 4 Active Transportation Grant Program Projects (in Order of Project Rankings) Approved on
 Approved on") CAPITAL Large Category Projects Board-Approved Funding Awards for Cycle 4 Active Transportation Grant Program Projects (in Order of Project Rankings) Approved on 07-27-18 1 La Mesa University Ave Pedestrian
CAPITAL Large Category Projects Board-Approved Funding Awards for Cycle 4 Active Transportation Grant Program Projects (in Order of Project Rankings) Approved on 07-27-18 1 La Mesa University Ave Pedestrian
REGIONAL BICYCLE AND PEDESTRIAN DESIGN GUIDELINES
 REGIONAL BICYCLE AND PEDESTRIAN DESIGN GUIDELINES November 16, 2011 Deb Humphreys North Central Texas Council of Governments Bicycle and Pedestrian Advisory Committee Snapshot of the Guide 1. Introduction
Better Market Street Project Update. Urban Forestry Council September 17, 2014
 Better Market Street Project Update Urban Forestry Council September 17, 2014 Project Area Limits Better Market Street Schedule Market Street City s busiest transit corridor Over 85 buses per hour 14 surface
PlaySafe and Live Well!
 PlaySafe and Live Well! Welcome to PlaySafe, LLC s informational column. Every month we will work hard to provide you with up-to-date information on topics related to parks, recreation, health, wellness,
Active Transportation Facility Glossary
 Active Transportation Facility Glossary This document defines different active transportation facilities and suggests appropriate corridor types. Click on a facility type to jump to its definition. Bike
Small Town & Rural Multimodal Networks
 Small Town & Rural Multimodal Networks Fred Young, PLA Andrea Clinkscales, AICP, PMP Alta Planning + Design Funding Partners Project Team Existing Design Guidance AASHTO Flexibility Guide 2004 AASHTO Bike
Watertown Complete Streets Prioritization Plan. Public Meeting #1 December 14, 2017
 Watertown Complete Streets Prioritization Plan Public Meeting #1 December 14, 2017 Goals for Public Meeting Overview of MassDOT Complete Streets Funding Program Educate the community on Complete Streets
Lessons Learned from Cycle Tracks (Class IV Bikeways) Design Practice
 Design Practice") Lessons Learned from Cycle Tracks (Class IV Bikeways) Design Practice By: Min Zhou, P.E., Principal/Vice President KOA Corporation 1 What is a Cycle Track (Class IV) TYPICAL BIKEWAY CLASSIFICATION CLASS
Lessons Learned from Cycle Tracks (Class IV Bikeways) Design Practice By: Min Zhou, P.E., Principal/Vice President KOA Corporation 1 What is a Cycle Track (Class IV) TYPICAL BIKEWAY CLASSIFICATION CLASS
ADVISORY BICYCLE LANES REALITY VERSUS DESIGN GUIDANCE
 Michael Williams 0 ADVISORY BICYCLE LANES REALITY VERSUS DESIGN GUIDANCE Michael Williams (Corresponding author) Alta Planning + Design SE Grand Avenue Portland, OR Email: michaelwilliams@altaplanning.com
Sustainable Transportation Initiatives and Plans in Caledon
 Sustainable Transportation Initiatives and Plans in Caledon Arash Olia, P.Eng., PhD. Coordinator, Transportation Development Finance & Infrastructure Services Town of Caledon Eric Chan, P.Eng., PMP Manager,
VISIONZEROPHL.COM #VISIONZEROPHL
 What is Vision Zero? What is Vision Zero? A policy that states clearly that traffic deaths are preventable and unacceptable. CORE PRINCIPLES: Human life takes priority over mobility; Human error is inevitable
Dowling/Beaty Cycling Route
 Public Meeting #2 Dowling/Beaty Cycling Route May 17, 2017 6:00 p.m. 8:00 p.m. Parkdale Public Library - Auditorium 1303 Queen Street West How to Participate Share your questions, ideas and concerns We
Chapter 2. Bellingham Bicycle Master Plan Chapter 2: Policies and Actions
 Chapter 2 Bellingham Bicycle Master Plan Chapter 2: Policies and Actions Chapter 2: Policies and Actions The Bicycle Master Plan provides a road map for making bicycling in Bellingham a viable transportation
NM-POLICY 1: Improve service levels, participation, and options for non-motorized transportation modes throughout the County.
 Transportation PRINCE WILLIAM COUNTY 2008 COMPREHENSIVE PLAN NON-MOTORIZED PLAN CONTENTS Goals, Policies, and Action Strategies Table 4 (Bike Facility Classifications and Descriptions) Table 5 (Bike Facility
Clackamas County Comprehensive Plan
 ROADWAYS The County s road system permits the movement of goods and people between communities and regions, using any of a variety of modes of travel. Roads provide access to virtually all property. They
Cycle Track Design Best Practices Cycle Track Sections
 Design Best Practices Sections It is along street segments where the separation and protection methods of cycle tracks offer more comfort than conventional bicycle lanes, and are more attractive to a wide
CITY OF HAMILTON PLANNING AND ECONOMIC DEVELOPMENT DEPARTMENT Transportation Planning and Parking Division
 CITY OF HAMILTON PLANNING AND ECONOMIC DEVELOPMENT DEPARTMENT Transportation Planning and Parking Division TO: Chair and Members Public Works Committee COMMITTEE DATE: June 18, 2018 SUBJECT/REPORT NO:
G AT E WAY PLAN. Community BRIEFING KIT GATEWAY BIKE
 G AT E WAY PLAN GATEWAY BIKE Community BRIEFING KIT PLAN August 2016 TABLE OF CONTENTS INTRODUCTION... 1 THE BENEFITS OF A BIKEABLE COMMUNITY... 2 ECONOMY...2 SAFETY...3 HEALTH...3 HOUSEHOLD SPENDING...3
Pedestrian injuries in San Francisco: distribution, causes, and solutions
 Pedestrian injuries in San Francisco: distribution, causes, and solutions Presentation to the San Francisco Health Commission RAJIV BHATIA, MD, MPH DIRECTOR OF OCCUPATIONAL AND ENVIRONMENTAL HEALTH, SAN
Off-Road Facilities Part 1: Shared Use Path Design
 Off-Road Facilities Part 1: Shared Use Path Design Presentation by: Eric Mongelli, P.E. Tom Huber October 9, 2012 FOLLOW THE CONVERSATION ON TWITTER Toole Design Group is live tweeting this webinar @tooledesign
Bikestation. Connecting Cyclists with Transit
 Bikestation www.bikestation.org Connecting Cyclists with Transit Brand 05 Railvolution: Last Mile Workshop 2 Mission Bikestation is a non-profit organization that seeks to improve the quality of life in
By: Bill Baranowski, PE TRAFFIC CALMING EXAMPLES IN SUGARHOUSE, DAYBREAK, AND WEST JORDAN CITY
 By: Bill Baranowski, PE TRAFFIC CALMING EXAMPLES IN SUGARHOUSE, DAYBREAK, AND WEST JORDAN CITY 1977 HIGHLAND RUGBY TOUR 1945 WHERE??? What is more contentious than traffic calming? 1951 LOOKING SOUTHEAST
National Safe Routes to School Program: Initial Results
 National Safe Routes to School Program: Initial Results Lauren Marchetti National Center for Safe Routes to School 9 th Annual New Partners for Smart Growth Thursday, February 4, 2010 Seattle, WA August
TOWN OF PORTLAND, CONNECTICUT COMPLETE STREETS POLICY
 TOWN OF PORTLAND, CONNECTICUT COMPLETE STREETS POLICY I. VISION, GOALS & PRINCIPLES VISION To improve the streets of Portland making them safer and more accessible for all users including pedestrians,
Safer Cycling: How the City of Vancouver is Proactively Improving Cycling Safety
 Safer Cycling: How the City of Vancouver is Proactively Improving Cycling Safety Brian Patterson, MCIP, RPP Urban Systems 2015 Canadian Association of Road Safety Professionals (CARSP) Conference Session
CHAIR AND MEMBERS CIVIC WORKS COMMITTEE MEETING ON JANUARY 10, 2017
 TO: FROM: SUBJECT: CHAIR AND MEMBERS CIVIC WORKS COMMITTEE MEETING ON JANUARY 10, 2017 KELLY SCHERR, P.ENG., MBA, FEC MANAGING DIRECTOR ENVIRONMENTAL & ENGINEERING SERVICES AND CITY ENGINEER QUEENS AVENUE
Infrastructure Elements of a Viable Cycling Network in the United States
 Pursuit - The Journal of Undergraduate Research at the University of Tennessee Volume 6 Issue 1 Article 19 April 2015 Infrastructure Elements of a Viable Cycling Network in the United States Kelly Nicholas
PBIC Webinar. How to Create a Bicycle Safety Action Plan: Planning for Safety [IMAGE] Oct. 2, 2014, 2 pm
![PBIC Webinar. How to Create a Bicycle Safety Action Plan: Planning for Safety [IMAGE] Oct. 2, 2014, 2 pm](/thumbs/86/93953441.jpg "PBIC Webinar. How to Create a Bicycle Safety Action Plan: Planning for Safety [IMAGE] Oct. 2, 2014, 2 pm") PBIC Webinar How to Create a Bicycle Safety Action Plan: Planning for Safety [IMAGE] Bill Schultheiss, Vice President, Toole Design Peter Lagerwey, Regional Director, Toole Design Oct. 2, 2014, 2 pm Today
PBIC Webinar How to Create a Bicycle Safety Action Plan: Planning for Safety [IMAGE] Bill Schultheiss, Vice President, Toole Design Peter Lagerwey, Regional Director, Toole Design Oct. 2, 2014, 2 pm Today
ACCESSIBLE LOADING ZONES AND PROTECTED BIKE LANES: A UNIVERSAL DESIGN APPROACH. Accessibility Coalition Dec. 2016
 ACCESSIBLE LOADING ZONES AND PROTECTED BIKE LANES: A UNIVERSAL DESIGN APPROACH Accessibility Coalition Dec. 2016 A myth exists that only able-bodied individuals can ride bicycles. In reality, people with