Promoting Safe Walking and Cycling: Lessons from Europe and North America. John Pucher, Rutgers University, and Ralph Buehler, Virginia Tech
|
|
|
- Gervais Hampton
- 5 years ago
- Views:
Transcription


1 Promoting Safe Walking and Cycling: Lessons from Europe and North America John Pucher, Rutgers University, and Ralph Buehler, Virginia Tech
2 Walking and Cycling: the MOST sustainable transport modes MOST environmentally friendly: >Virtually no pollution at all >Almost no nonrenewable resources used MOST equitable: >Financially affordable by virtually everyone >Physically possible by all but the severely disabled MOST economical: >Minimal private and public costs >Although they take more time, they provide exercise that reduces medical costs and greatly extends our healthy life expectancy
3 WALKING AND CYCLING ARE HEALTHY! GREAT source of physical activity: Both for daily travel and for recreation Cheaper, easier, and more dependable than formal exercise routines Can be integrated into daily lifestyle to achieve practical travel needs
4 50 Walking Cycling Share of Trips by Percent of trips by cycling and walking Cycling and Walking Source: Pucher and Buehler, City Cycling, MIT Press, 2012
5 Bike Share of Trips in Selected cities in UK, Canada, USA, and Australia ( ) Cambridge Oxfordshire Petersborough Norfolk Exeter Northampton London Victoria Vancouver Montreal Ottawa Winnipeg Toronto Calgary Davis Boulder Portland Minneapolis Madison San Francisco Washington Chicago New York 2.5% 4.0%5.8% 2.0% 6.0% 7.5% 21.0% 2.4% 3.7% 9.5% 2.2% 1.8% 1.7% 1.4% 9.6% 6.0% 1.2% 2.3% 2.7% 4.2% 4.3% 0.6% United Kindom Canada 15.5% USA Source: Pucher, J., Buehler, R. (eds.), City Cycling. Cambridge, MA: MIT Press, 2012 Canberra Perth Brisbane Melbourne Adelaide Sydney 1.3% 2.0% 3.0% 3.1% 1.2% 0.7% Australia 0.0% 5.0% 10.0% 15.0% 20.0% 25.0%


6 Bicycle Share of Work Commuters in the USA (2007) and Canada (2006) Source: Pucher, J., Buehler, R., Seinen, M Bicycling Renaissance in North America? An Update and Re-Assessment of Cycling Trends and Policies, Transportation Research A, Vol. 45, No. 6, pp


7 Increase in Bike Share of Trips in Cities Around the World Source: Pucher et al, Infrastructure, Programs, and Policies to Increase Bicycling, Preventive Medicine, Jan 2010, Vol. 50, S.1, pp. S106-S125.

8 Increase in Bike Share of Trips in Cities Around the World Source: Pucher et al, Infrastructure, Programs, and Policies to Increase Bicycling, Preventive Medicine, Jan 2010, Vol. 50, S.1, pp. S106-S125.


9 Source: City of Cambridge Almost a quadrupling in cycling in Cambridge in past 10 years

10 Source: Pucher, J., Buehler, R., Seinen, M Bicycling Renaissance in North America? An Update and Re-Assessment of Cycling Trends and Policies, Transportation Research A, Vol. 45, No. 6, pp Trends in Cycling to Work in 9 US and Canadian Cities
11 Source: Pucher, J., Buehler, R., Seinen, M Bicycling Renaissance in North America? An Update and Re-Assessment of Cycling Trends and Policies, Transportation Research A, Vol. 45, No. 6, pp Bike Mode Share of Workers in 9 US and Canadian Cities

12 Spatial Variation in Bicycle Share of Work Commuters in New York City Area, Pucher, J., Buehler, R., Seinen, M Bicycling Renaissance in North America? An Update and Re- Assessment of Cycling Trends and Policies, Transportation Research A, Vol. 45, No. 6, pp

13 Spatial Variation in Bicycle Share of Work Commuters in Washington, D.C. Area, Pucher, J., Buehler, R., Seinen, M Bicycling Renaissance in North America? An Update and Re- Assessment of Cycling Trends and Policies, Transportation Research A, Vol. 45, No. 6, pp
14 Cycling rate in Cambridge NINE times higher than for Boston metro area Percent of Commuters by Bicycle Variation in cycling rates among different towns in the Boston metro area Source: Calculated by authors from American Community Survey, , US Census Bureau


15 Percent of workers WALKING to work as main means of travel, Source: Map created by Metropolitan Area Planning Council from American Community Survey, U.S. Bureau of the Census

16 Percent of workers CYCLING to work as main means of travel,
17 Lots of Potential for Increased Walking and Cycling: Many daily trips in American and Canadian urban areas are short enough to walk or bike! ~27% of all trips in the U.S. were a mile or shorter in 2009 ~41% of all trips were shorter than two miles
18 Share of Short Trips by Walking Cycling Cycling and Walking USA GER DK NL Percent of trips by cycling and walking 0<2.5km 2.5km<4.5km 4.5km-6.5km 0<2.5km 2.5km<4.5km 4.5<6.5km 0<2.5km 2.5km<4.5km 4.5km-6.5km 0<2.5km 2.5km<5km 5<7.5km Trip distance category


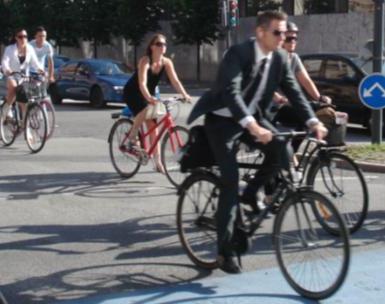
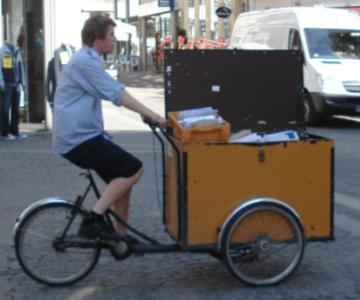
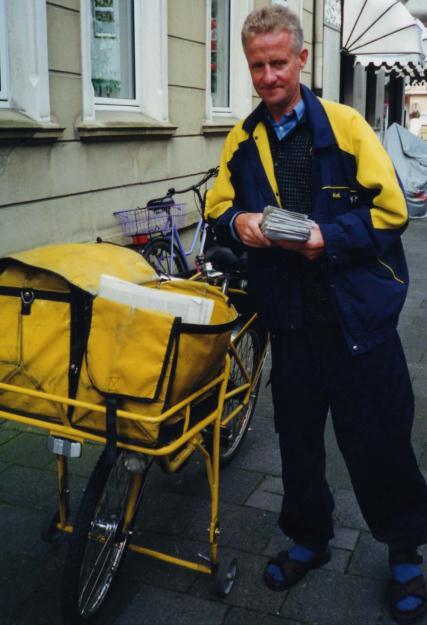
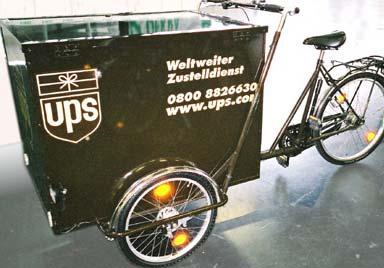
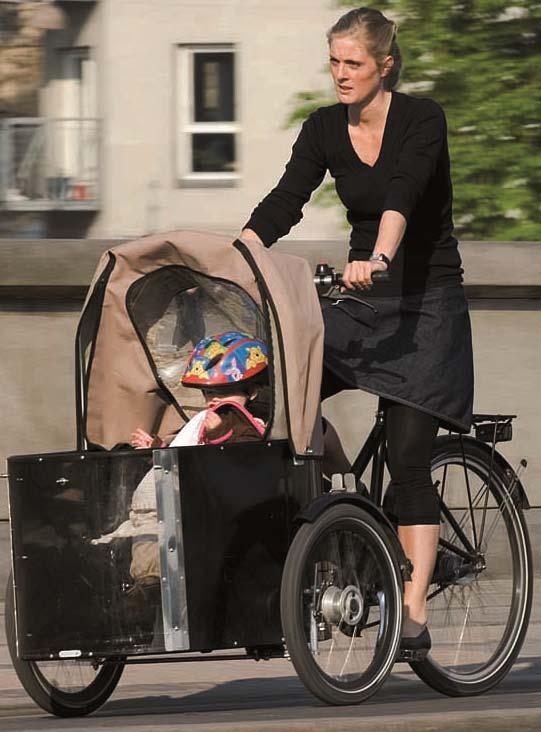
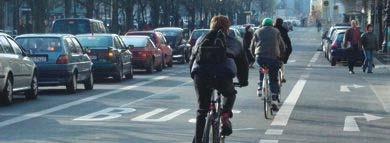
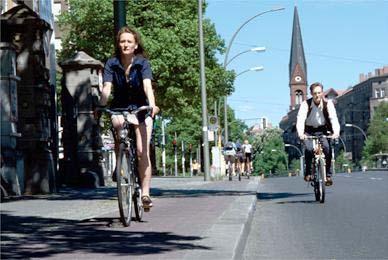
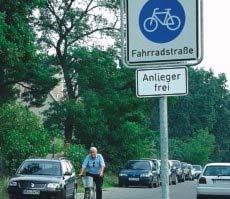
19 Europeans cycle for many trip purposes
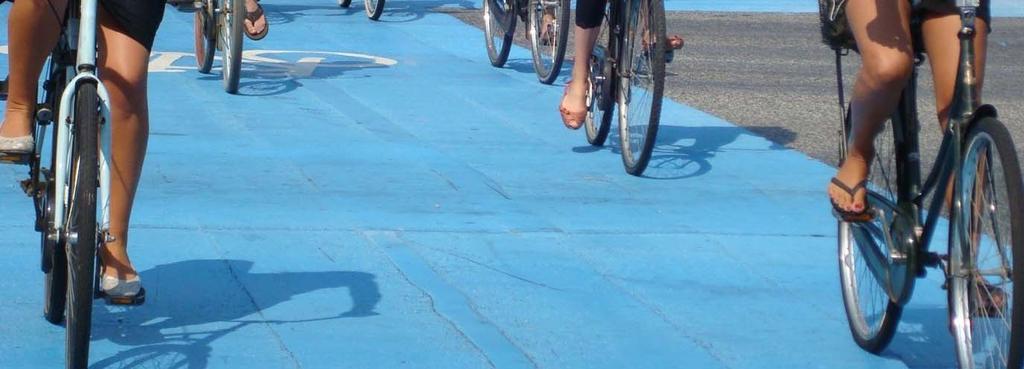
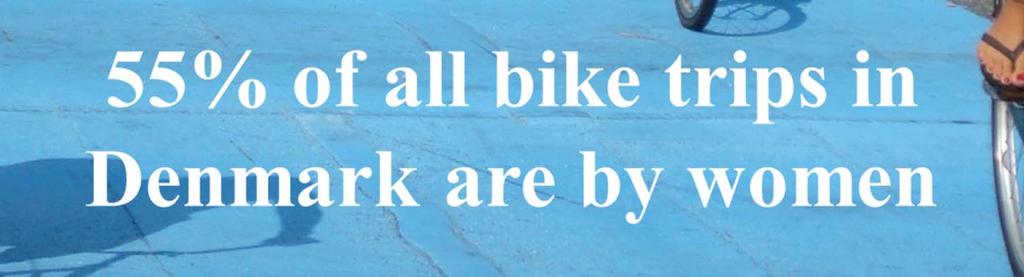
20 70% Cycling Walking Women s Share of Bike and Walk Trips in Europe and North America Percent of trips by women 60% 50% 40% 30% 25% 52% 27% 53% 30% 56% 55% 60% 49% 49% 56% 56% 20% 10% USA UK Canada Denmark Germany Netherlands
21 70 Copenhagen 60 Percent of bicyclists who are female Toronto Washington Vancouver Chicago Montreal Portland Minneapolis San Francisco Melbourne Sydney Berlin Tokyo Bicycle share of trips and percentage of female cyclists in large cities Amsterdam Percent of trips by bicycle Source: Pucher, J., Buehler, R. (eds.), City Cycling. Cambridge, MA: MIT Press, 2012
22 50% 45% 40% Percent of cyclists who are female 35% 30% 25% 20% 15% 10% Stonnington Maribyrnong Moonee valley Glen Eira Wyndham Banyule Boroondara Frankston Bayside Kingston Whitehorse Casey Knox Darebin Moreland Melbourne Port Phillip Bicycle share of commuter trips and percentage of female cyclists by local government area in the Melbourne Metro Area Yarra 5% Hume Source: Pucher, J., Buehler, R. (eds.), City Cycling. Cambridge, MA: MIT Press, % 0% 1% 2% 3% 4% 5% 6% 7% 8% Cycling to work mode share

23 Source: Susan Handy
24 Percent of trips by foot and bike ' Walking Cycling Bike and Walk Share of Trips by Age Group USA UK Germany Denmark Netherlands Age Group


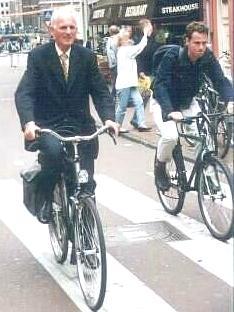
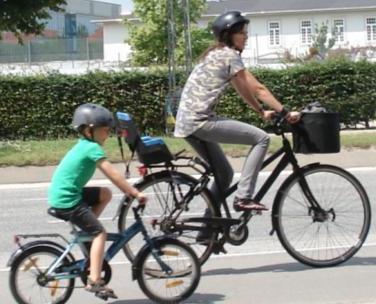
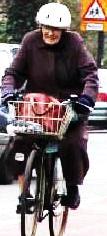
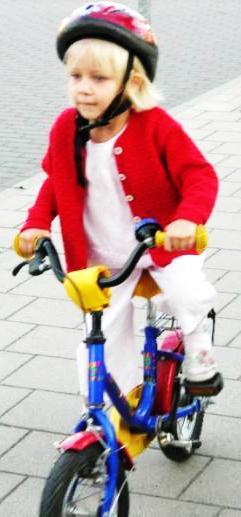
25 Cycling for all ages Foto by Marie Demers
26 Make Walking and Cycling Safe for Everyone! Especially important for the young, the old, for anyone with disabilities, for the timid or risk-averse Women more sensitive to safety than men Safety of walking and cycling in the Netherlands, Denmark, and Germany helps explain high levels of walking and cycling there

27 20.0 Cylists killed per 100 million km cycled 33.5* 18.0 Cylists injured per 10 million km cycled 16.0 Pedestrians killed per 100 million km walked Fatalitities and injuries per trip and per kilometer Pedestrians injured per 10 million km walked Cyclist and Pedestrian Fatality and Injury Rates NL DK GER UK USA
28 Trends in Cyclist Fatalities USA UK Denmark Germany Netherlands Total cyclist fatalities relative to 1970 (=100
29 Trends in Pedestrian Fatalities USA UK Denmark Germany Netherlands Total pedestrian fatalities relative to 1970 (=100
30 SAFETY IN NUMBERS As levels of cycling increase, injury and fatality rates per trip and per km traveled fall dramatically Thus, if we can increase cycling, it will almost inevitably be safer
31 New York Safety in Numbers: 7.0 Cyclist fatality rate 6.0 falls as cycling levels Annual Fatalities per 10,000 Cyclists Chicago Toronto Washington increase. Montréal San Francisco Minneapolis Portland 1.0 Vancouver Source: Pucher and Buehler, City Cycling. Cambridge, MA: MIT Press, 2012 Bike Share of Workers
32 Decreasing Crash Rate in Portland Daily Bicycle Trips 10,000 Crashes/Crash Rate ,500 5,000 2,500 0 Annual Crashes Crash Rate Bridge Bicycle Traffic Year
33 Public Policies Crucial to Walking and Cycling Pro-car policies in European cities in 1950s and 1960s caused huge decline in walking and cycling Dramatic policy turn-around since 1970s to limit car use and promote cycling, walking, and public transport in Dutch, Danish, and German cities


34 Bridge in Freiburg BEFORE and AFTER reforms 1960s Today

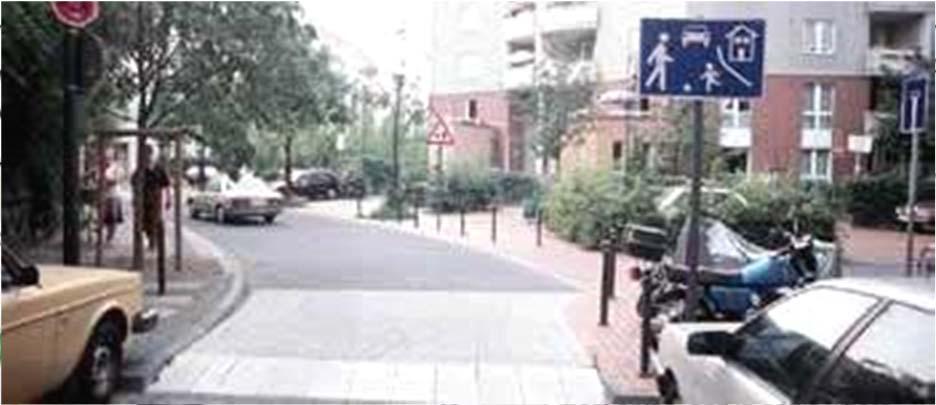
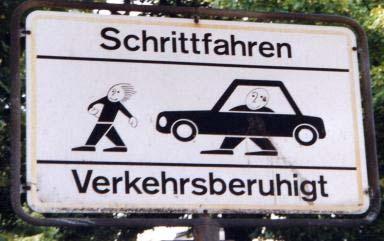
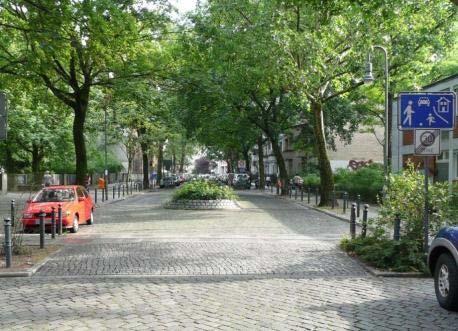
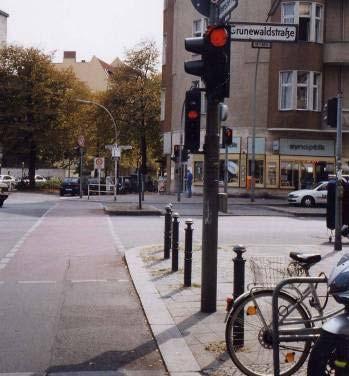
35 Typical residential street in Freiburg AFTER traffic calming reforms Typical residential street in Freiburg BEFORE traffic calming reforms


36 Cathedral Square in Freiburg AFTER transport and urban planning reforms Cathedral Square in Freiburg BEFORE transport and urban planning reforms


37 Mass Ave Road Diet in 1996: road narrowing and improvement of ped/bike facilities Before 1996 After 1996

38 Longfellow Bridge: Great view but abominable conditions for pedestrians and cyclists.

39 What this crossing should look like! Livable Streets Alliance Improved crossing for pedestrians and cyclists on Longfellow Bridge
40 How to Encourage More Cycling and Walking while Improving Safety Better cycling and walking facilities Integration of walk/bike with public transport Traffic calming of residential neighborhoods Mixed-use zoning and improved urban design Restrictions on motor vehicle use Traffic education and Safe Routes to School Traffic regulations and enforcement

41 Lively pedestrian zone in Québec City Source: Marie Demers

42 Safe and pleasant Shared Street at Harvard Square Source: City of Cambridge
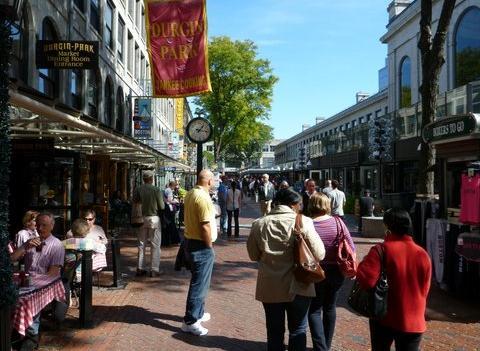
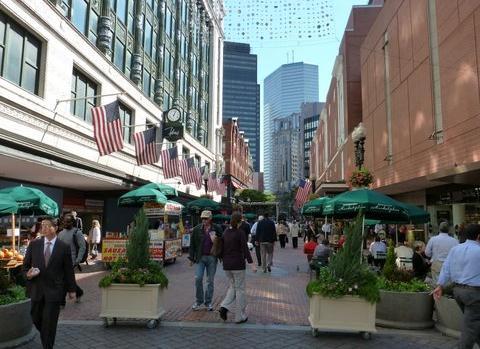
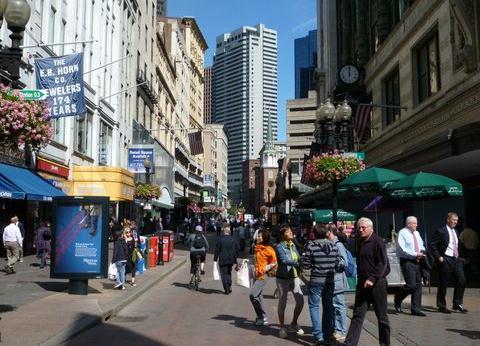
43 Pedestrian zones in downtown Boston Photos: David Loutzenheiser


44 Car-free Broadway in New York City Times Square Herald Square


45 High Line in New York City from an abandoned freight line to a popular promenade

46 Room for pedestrians, cyclists, and cars on this complete street

47 Santa Barbara coastal path: Safe and attractive both for cyclists and pedestrians Conversion of two car lanes to bike path and wider sidewalk Source: Ralph Fertig

48 Bikeway in Muenster, Germany with separate walkways on both sides Note exclusive cycle path in middle and completely separate pedestrian walkways on both sides

49 Source: City of Cambridge Minuteman Trail north of Boston Second most popular recreational trail in the country

50 Bike paths in Dutch cities make it safe and comfortable for all to bike: including women, children, and seniors

51 One-way cycle track in The Hague Source: Peter Furth

52 Raised crossing carries a two-way cycle track across a minor street at an intersection in Delft. Raised crossing, pavement markings, and good signage increase safety of cycle tracks at intersections

53 Advisory bicycle lanes on a two-way street in Delft, Netherlands
54 Dutch bicycle facility selection matrix Lane Configuration Average daily traffic (vehicles / day) Urban local street Street type and speed limit Urban through street Rural local road Fast traffic road 30 km/h (19 mph) 50 km/h (31 mph) 60 km/h (37 mph) 70+ km/h (44+ mph) < 2500 advisory bike lane 4 2-way traffic with no centerline 2000 to to 5000 mixed traffic 1 bike lane 2 or cycletrack 3 bike lane 2 or cycle track 5 cycle track or low-speed service road > lanes (1+1) any 4 lanes (2 + 2) or more any bike lane or cycle track bike lane or cycle track (does not exist) bike lane or cycle track 3 bike lane or cycle track 3 Source: Peter Furth, Cycling Infrastructure, in Pucher and Buehler, eds. City Cycling, MIT Press, cycle track or low speed service road


55 Almost 100km of 2-way cycle tracks in Montreal Separation from traffic via bollards and parked cars Separation from traffic via concrete barriers Photo: Peter Furth Photo: Velo Quebec

56 Provision of cycle track at this key underpass in Montreal: On the way down Photo: Velo Quebec

57 and here on their way back up Source: Vélo Québec

58 Bi-directional cycle track and bike sharing near metro station in Montréal Metro station BIXI bike docking station Cycle track Source: Vélo Québec

59 250 mi of new bike lanes and paths since 2005 doubling in bike trips halving of cyclist fatalities from 28 to 14 Photo: NYC DOT Traffic-protected cycle track on 9 th Avenue, NYC

60 Cycle Track on Pennsylvania Avenue in Washington Connects the White House with the Capitol


61 Protected bike lanes (cycle tracks) on Vassar St and Concord Ave in Cambridge


62 Source: City of Cambridge Planned cycle track and pedestrian improvements on Western Ave, Cambridge


63 Why not remove the parked cars and create safe, protected cycle tracks? Source: Livable Streets Alliance Source: Livable Streets Alliance Bike lanes on Beacon Street and Commonwealth Avenue, Boston
64 Trend in Bike Paths and Lanes per 100,000 Population in Nine Large North American Cities, Kilometers of Lanes and Paths per 100,000 Population New York Chicago Toronto San Francisco Vancouver Montréal Washington Minneapolis Portland


65 Crucial to provide river crossings for cyclists Bike bridge over Yarra River in Melbourne, Australia Bike bridge over Ems River in Muenster, Germany

66 About 20,000 daily bike trips over Portland bridges

67 Crucial provisions for cyclists and pedestrians on bridges even during construction as here in Montreal Source: Velo Quebec

68 1,100 km of bicycling facilities in Berlin plus 3,800 km of traffic calmed streets = 10% bike share of all trips Source: City of Berlin


69 Special traffic signals and signs give priority to cyclists


70 Four-way all-green signal for cyclists in Portland Bike sensor in pavement


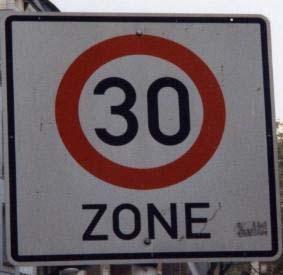
71 Superb bike crossing at busy intersection in Montreal

72 Red bike lanes for intersection crossings, connected with red brick sidepaths on both sides of every road Sources: City of Muenster Muenster, Germany


73 Bike boxes and advance stop lines


74 Raised curb protects bike path from cars Express bikeways for commuters Bike speed indicators Green wave for cyclists in Odense, Denmark Troels Andersen, Cycling in Odense, Denmark


75 Accommodation of cyclists at intersections in Cambridge

76 Protected left-turn lane for cyclists crossing Mass Ave to reach Church St. and Brattle St.

77 Source: Cara Seiderman Then the cyclist can safety cross Mass Ave to continue onto Church Street or turn right onto Mass Ave going outbound.
78 Traffic Calming of Residential Neighborhoods Speed limited by law to 30km per hour (19mph) or less Physical measures that force cars to slow down: Road narrowing, zigzag routing, chicanes Raised intersections and crosswalks Traffic circles Speed humps and bumps Mid-block closures and artificial dead-ends Bulb-outs at intersections and crosswalks, with sidewalk widening

79 Why Traffic Calming Saves Lives Speed Speed kills! kills! Source: World Health Organization (2008) and OECD Transport Research Centre (2006)


80 Source: Cara Seiderman Curb extensions, protective bollards, raised crosswalks, refuge islands Traffic calming increases pedestrian visibility and slows down cars Source: Source: Jeff Cara Rosenblum Seiderman

81 Convenient bike cut-thru for cyclists Foto by Peter Berkeley


82 Cheap, easy, and very effective traffic diverters Traffic calming in Quebec City and Montreal Traffic Calming in Québec City Source: Transports Viables

83 Traffic Calming in Freiburg, Germany Cheap, easy, fast, and effective improvement in cycling and walking safety


84 Fotos: Jonathan Maus Traffic calming turns these streets into bikeways Bike Boulevards in Portland

85 BIKE TRANSIT INTEGRATION

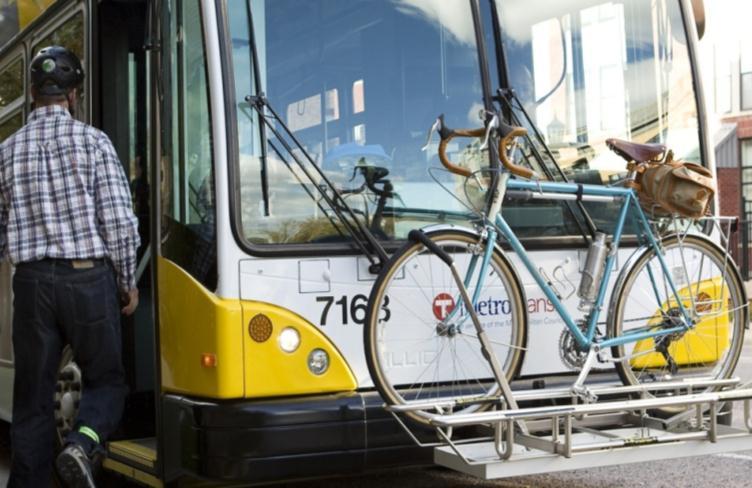
86 Over 50,000 buses in the USA now come equipped with bike racks Photo: Metro Transit


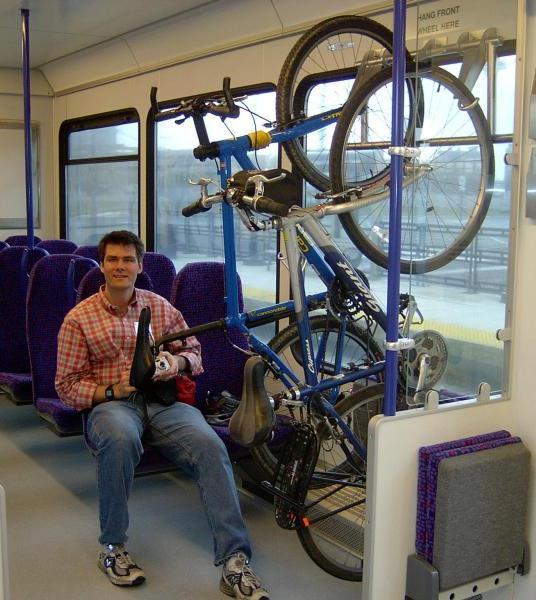
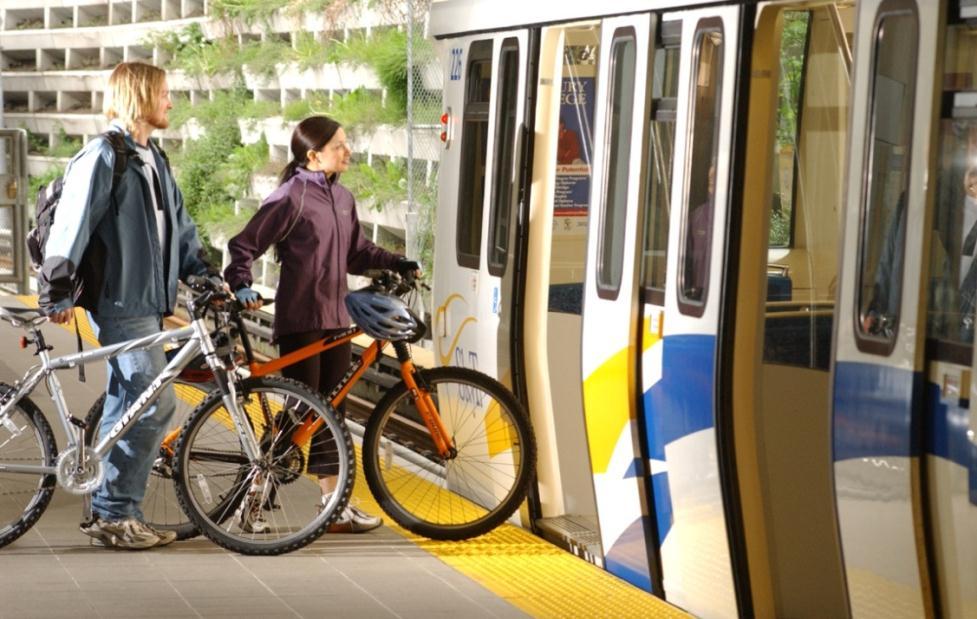
87 Bike on LRT in NJ and Minneapolis Photo: John Boyle Photo: Metro Transit


88 Bikes on Caltrain in San Francisco Photo: Ralph Buehler Photo: San Francisco Bicycling Coalition Photo: John Pucher
89 Bike Station next to main train station in Muenster, Germany Photo: Peter Berkeley

90 Bike Station next to Union Station in Washington, D.C. Photo: Ralph Buehler


91 300 bike parking spaces in two cages Bike-transit integration at Alewife Station on Red Line David Loutzenheiser

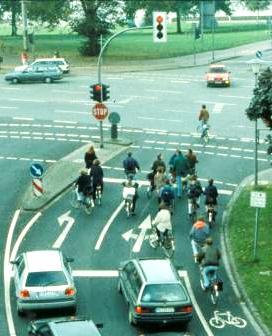
92 Main form of bike-transit integration in Europe for decades Photo: John Photo: Pucher Eva Heinen
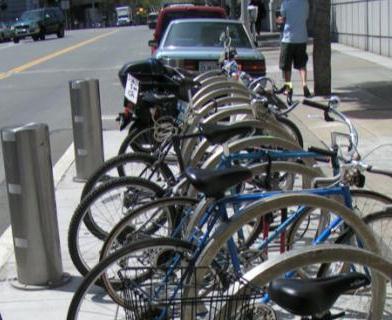
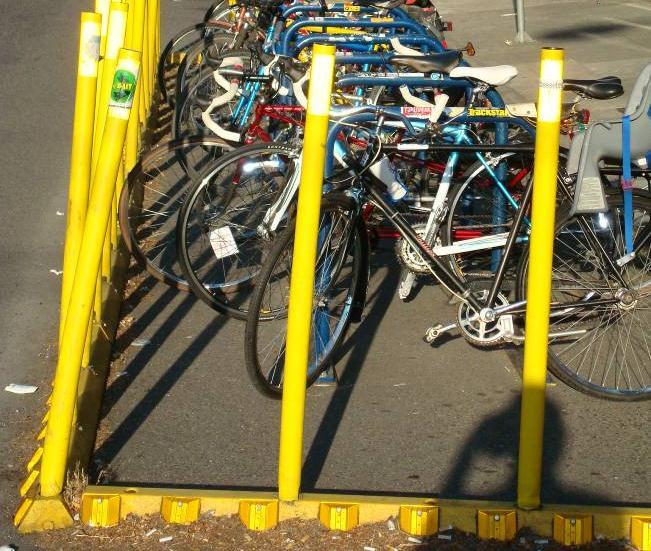
93 Conversion of Car Parking to Bike Parking


94 Photo: Peter Berkeley Bikesharing in Paris and Berlin Photo: Peter Berkeley Easy bike rentals at Dutch transit stations Photo: German Railways


95 Nice Ride in Minneapolis Hubway Bikeshare in Cambridge, Boston, Somerville, and Brookline Over 20 bike sharing systems in North America Capital Bikeshare in Washington, DC
96 Traffic Education Improved motorist training, with much more emphasis on how to avoid endangering pedestrians and cyclists Compulsory traffic safety lessons for all school children by the age of 10, with testing by traffic police on actual traffic test courses, to ensure safe and defensive walking and cycling by an early age (as in the Netherlands and Germany)


97 German traffic laws generally favor cyclists and pedestrians over motorists


98 Cycling training and testing course in Berlin Most German and Dutch children take cycling lessons by the 3 rd or 4 th grade and must pass a police-administered cycling safety test!

99 Bike path leads directly to school in NL


100 Bike Training for Children in New Jersey Buehler and Pucher Promoting Walking and Cycling


101 Cycling training course for adults in Vancouver You are never too old to learn!!!

102 Summer Streets in New York City attracts 200,000 participants on Saturdays in August

103 Somerstreets in Somerville Source: City of Somerville

104 Fun bike rides for kids and parents Source: Cara Seiderman


105 Troels Andersen, Cycling in Odense, Denmark Guided Bicycle Tours for Seniors
106 CONCLUSIONS Walking and cycling are the most sustainable means of getting around our cities Broad range of environmental, social, economic, and health benefits Many ways to increase walking and cycling while making them safer Lots of daily trips in American cities are short enough to cover by walking or cycling Many cities in Europe and some in North America show what is possible and offer superb examples to follow


107 Forthcoming book with MIT Press About the authors:
108 Measures to Increase Cycling 1. Provide a comprehensive package of integrated measures 2. Build a network of integrated bikeways with intersections that facilitate cycling 3. Provide good bike parking at key destinations and public transport stations 4. Implement bike sharing programs 5. Provide convenient information and promotional events 6. Introduce individualized marketing to target specific groups 7. Improve cyclist education and expand bike to school programs 8. Improve motorist training, licensing, and traffic enforcement 9. Restrict car use through traffic calming, car-free zones, and less parking 10. Design communities to be compact, mixed-use, and bikeable
109 Implementation Strategies 1. Publicize both individual and societal benefits 2. Ensure citizen participation at all stages of planning and implementation 3. Develop long-range bike plans and regularly update them 4. Implement controversial policies in stages 5. Combine incentives for cycling and disincentives for car use 6. Build alliances with politicians, cycling organizations, and other bike friendly groups 7. Coordinate bike advocacy and planning through local, regional, and national organizations
Promoting Walking and Cycling in Los Angeles: Lessons from Europe and North America
 Promoting Walking and Cycling in Los Angeles: Lessons from Europe and North America John Pucher, Rutgers University, and Ralph Buehler, Virginia Tech Walking and Cycling: the MOST sustainable transport
Lessons from Cities across the Globe
 Cycling to the Future: Lessons from Cities across the Globe John Pucher, Rutgers University Ralph Buehler, Virginia Tech Photo: Susan Handy Photo: Photo: SF Greg Bike Coalition Raisman San Antonio Photo:
How to Increase Cycling for Daily Travel: Lessons from Cities across the Globe
 How to Increase Cycling for Daily Travel: Lessons from Cities across the Globe Joint Webinar for the Institute of Transportation Engineers and the Active Living Research Program of the Robert Wood Johnson
Streets for Everyone: Lessons from Cities across the Globe
 Streets for Everyone: Lessons from Cities across the Globe John Pucher, Rutgers University Photo: Susan Handy Complete Streets Forum, Toronto, Canada, Oct 6, 2014 Photo: Ralph Buehler Complete Streets
Walking and Cycling for Healthy Cities
 Walking and Cycling for Healthy Cities Prof. John Pucher, Rutgers University http://policy.rutgers.edu/faculty/pucher Walking and Bicycling: the MOST sustainable transport modes MOST environmentally friendly:
SUSTAINABILITY, TRANSPORT, & HEALTH. Ralph Buehler, Virginia Tech
 SUSTAINABILITY, TRANSPORT, & HEALTH Ralph Buehler, Virginia Tech Prepared for National Academies Roundtable on Science and Technology for Sustainability 6 December 2013 Overview Trends in Motorization
BIKE TRANSIT INTEGRATION IN NORTH AMERICA. John Pucher & Ralph Buehler
 BIKE TRANSIT INTEGRATION IN NORTH AMERICA John Pucher & Ralph Buehler Synergies: Bicycling and Public Transport: Perfect Together? Cycling extends catchment areas of transit stops far beyond walking range
Walking and Cycling for ALL New Jerseyans
 Walking and Cycling for ALL New Jerseyans Prof. John Pucher, Rutgers University http://policy.rutgers.edu/faculty/pucher Walking and Bicycling: the MOST sustainable transport modes MOST environmentally
Lessons from Copenhagen. John L Bowman 2013
 Lessons from Copenhagen John L Bowman 2013 Bicycle Strategy Official municipal policy Goals for the next 15 years Updated after 5-10 years 32 page glossy brochure BAC December 2, 2013 John L Bowman 2 Bicycle
Infrastructure and Programs. What does the data say? Advancing Non-motorized Transportation in Vermont 11/15/09
 Advancing Non-motorized Transportation in Vermont A reply from the university point of view Lisa Aultman-Hall Professor and Director Figure 4 Why Canadians Cycle more than Americans: A Comparative Analysis
Forhealth health, forfun, for transportation. Prof. John Pucher, Rutgers University
 BIKING FOR ALL TEXANS Forhealth health, forfun, for transportation Prof. John Pucher, Rutgers University Walking and Bicycling: the MOST sustainable ti transport tmodes MOST environmentally friendly: >Virtually
Safety in numbers What comes first safety or numbers? Jan Garrard School of Health and Social Development Deakin University
 Safety in numbers What comes first safety or numbers? Jan Garrard School of Health and Social Development Deakin University The safety in numbers theory As the number of cyclists increases, injury rates
Canada s Capital Region Delegation to the Velo-City Global 2010 Conference
 Canada s Capital Region Delegation to the Velo-City Global 2010 Conference Report of Findings from Visits, Meetings & Presentations In Amsterdam-Den Haag, Utrecht, Berlin & Copenhagen The Itinerary Copenhagen
Travel Behavior, Transport Policy, and Sustainable Transport in Germany and the USA
 Travel Behavior, Transport Policy, and Sustainable Transport in Germany and the USA Similarities between Germany and the USA Federal system of government, tradition of local self-government Strong economy,
Cycle Tracks: Concept and Design Practices. February 17, 2010
 Cycle Tracks: Concept and Design Practices February 17, 2010 Today s webinar presenters APBP Board Member Host Brett Hondorp, Principal, Alta Planning + Design Guest Moderator Zach Vanderkooy, Bicycling
FEDERAL HIGHWAY ADMINISTRATION APPLICATION
 FEDERAL HIGHWAY ADMINISTRATION APPLICATION REQUEST FOR PERMISSION TO EXPERIMENT WITH A BICYCLE BOX INTERSECTION TREATMENT Submitted by: City of Columbus Department of Public Service Date: June 26, 2009
Canada. UK France. Walk, Bike, Transit Share of Trips
 1950s 1960s Today Relationship between Share of Urban Trips by Transit, Bicycle, and Foot and Per Capita Annual CO 2 Emissions from Road and Rail Transport in Australia, Canada, the USA and EU Countries,
Complete Streets 101: The Basics
 Complete Streets 101: The Basics Michigan Municipal League - Capital Conference March 21, 2017 Chip Smith, AICP - Senior Planner - Wade Trim Inc. and City Council member City of Ann Arbor 2017 MML Capital
Health, Transportation and Bicycling: Connecting the Dotted Lines
 Portland State University PDXScholar Urban Studies and Planning Faculty Publications and Presentations Nohad A. Toulan School of Urban Studies and Planning 11-17-2010 Health, Transportation and Bicycling:
Bicycle Facilities Planning
 Bicycle Facilities Planning Overview Types of Cyclists Purpose for Riding Types of Facilities Bike Lanes Bicycle Boulevards Cycle Tracks Intersections Signals Signing and Marking Discussion Types of Bicyclists
Facility preferences & safety
 Photo Flickr: Boegh Facility preferences & safety Evidence from two studies Kay Teschke School of Population & Public Health University of British Columbia Canadians don t cycle much % of trips by bike
Cycling for Everyone:
 Cycling for Everyone: The Key to Public and Political Support John Pucher Rutgers University (http://policy.rutgers.edu/faculty/pucher.html) Reasons for everyone to support cycling: More daily physical
About the Active Transportation Alliance
 About the Active Transportation Alliance Chicagoland s voice for better biking, walking and transit Founded 1985 7,000 members, ~33 full time staff Serve Chicago metro region 1 More Cars, More Driving
Bikeway action plan. Bicycle Friendly Community Workshop March 5, 2007 Rochester, MN
 Bikeway action plan Summary The was held on March 5, 2007 at the Rochester Mayo Civic Center. The workshop was hosted by Rochester-Olmsted County Planning Department in collaboration with the League of
PEDALING FORWARD. A Glance at the SFMTA s Bike Program for SFMTA.COM
 PEDALING FORWARD A Glance at the SFMTA s Bike Program for 2017-2021 SFMTA.COM INTRODUCTION About This Booklet More people from all walks of life see their bicycle as a more convenient way to get where
EXECUTIVE SUMMARY. Vision
 Vision Walking and bicycling in Salt Lake City will be safe, convenient, comfortable, and viable transportation options that connect people to places, foster recreational and economic development opportunities,
Chapter 2. Bellingham Bicycle Master Plan Chapter 2: Policies and Actions
 Chapter 2 Bellingham Bicycle Master Plan Chapter 2: Policies and Actions Chapter 2: Policies and Actions The Bicycle Master Plan provides a road map for making bicycling in Bellingham a viable transportation
The Transformation of Portland into a Two-Wheeled Mecca. Mia Birk, Principal, Alta Planning + Design
 The Transformation of Portland into a Two-Wheeled Mecca Mia Birk, Principal, Alta Planning + Design Development of Portland s Bikeway Network 1990 Early 1990s Infrastructure Growing Public Support Growing
CITY OF BLOOMINGTON COMPLETE STREETS POLICY
 CITY OF BLOOMINGTON COMPLETE STREETS POLICY POLICY OBJECTIVE: The City of Bloomington will enhance safety, mobility, accessibility and convenience for transportation network users of all ages and abilities,
Active Transportation Facility Glossary
 Active Transportation Facility Glossary This document defines different active transportation facilities and suggests appropriate corridor types. Click on a facility type to jump to its definition. Bike
Appendix C 3. Bicycle / Pedestrian Planning
 Appendix C 3. Bicycle / Pedestrian Planning BICYCLE/PEDESTRIAN PLANNING 2005 Master Plan GOAL: Provide for safe and convenient bicycle and pedestrian circulation throughout the City. Develop a city-wide
Recommendations from Boston City Council Transportation Policy Briefing Series
 Recommendations from Boston City Council Transportation Policy Briefing Series Report to Boston City Councilors May 2017 Prepared by: Boston City Council Committee on Parks, Recreation & Transportation
REGIONAL BICYCLE AND PEDESTRIAN DESIGN GUIDELINES
 REGIONAL BICYCLE AND PEDESTRIAN DESIGN GUIDELINES November 16, 2011 Deb Humphreys North Central Texas Council of Governments Bicycle and Pedestrian Advisory Committee Snapshot of the Guide 1. Introduction
Film Guide for Educators. Designing for Safety
 Film Guide for Educators Designing for Safety Designing For Safety Key Concepts Speeding While Driving Speeding is the number one cause of injuries and deaths from driving. The main reasons are because
Hennepin County Bicycle and Pedestrian Planning
 Hennepin County Bicycle and Pedestrian Planning 1 Value of bicycle and sidewalk systems Safety Livability Mobility Health Personal Finances Economic Sustainability Clean Air Recreation Parking and congestion
Baltimore Commission on Sustainability October 2014 Meeting Report
 Date: Tuesday, Octobe, 2014, from 4-6 pm Location: 417 E. Fayette Street, 8 th Floor Baltimore Commission on Sustainability October 2014 Meeting Report Subject: Commission on Sustainability October 2014
Bicycle Boulevards and Neighborhood Greenways
 Bicycle Boulevards and Neighborhood Greenways Traffic Safety is Improving for Everyone 90 80 70 60 50 40 30 20 10 0 PORTLAND: TOTAL TRAFFIC FATALITIES 1986-2008 1986 1987 1988 1989 1990 1991 1992 1993
Color your stress away
 Color your stress away Learn about the Bicycle Master Plan s comfortable, low-stress bicycling network in Montgomery County. Unwind as you color the bicycling scenes. Check out montgomeryplanning.org/bikeplan
ADVISORY BICYCLE LANES REALITY VERSUS DESIGN GUIDANCE
 Michael Williams 0 ADVISORY BICYCLE LANES REALITY VERSUS DESIGN GUIDANCE Michael Williams (Corresponding author) Alta Planning + Design SE Grand Avenue Portland, OR Email: michaelwilliams@altaplanning.com
Building a Toronto that Moves
 Building a Toronto that Moves Image courtesy of the City of Toronto Setting Election Priorities for Walking, Cycling & Public Transit Toronto is a fast-paced, dynamic city. It s a city that moves except
What route types best motivate cycling? Evidence about route preferences & safety
 What route types best motivate cycling? Evidence about route preferences & safety Photo: Ken Ohrn Kay Teschke School of Population & Public Health The University of British Columbia Canadians don t cycle
What future for mid-sized cities? Prof. Emer. Antony Stathopoulos National Technical University of Athens
 What future for mid-sized cities? Prof. Emer. Antony Stathopoulos National Technical University of Athens These cities can range in size from 50,000 to 250,000 in population. Street in Larnaca in 1878
NM-POLICY 1: Improve service levels, participation, and options for non-motorized transportation modes throughout the County.
 Transportation PRINCE WILLIAM COUNTY 2008 COMPREHENSIVE PLAN NON-MOTORIZED PLAN CONTENTS Goals, Policies, and Action Strategies Table 4 (Bike Facility Classifications and Descriptions) Table 5 (Bike Facility
The Wiggle Route in Context
 The Wiggle Route in Context In a city of hills, the Wiggle is an important route because it winds its way along the flattest streets from Market to the Panhandle, bringing residents to local parks and
Agenda. Overview PRINCE GEORGE S PLAZA METRO AREA PEDESTRIAN PLAN
 PRINCE GEORGE S PLAZA METRO AREA PEDESTRIAN PLAN May 28, 2008 Agenda Welcome and introductions Project overview and issue identification Planning context and strengths Design challenges and initial recommendations
Land Use & Transportation
 21 st Century Transportation in Convenient Communities Prof. Paul Okamoto s Sustainable Design University of San Francisco 24 September 2014 Land Use & Transportation ASHRAE Golden Gate Seminar Sustainable
Watertown Complete Streets Prioritization Plan. Public Meeting #1 December 14, 2017
 Watertown Complete Streets Prioritization Plan Public Meeting #1 December 14, 2017 Goals for Public Meeting Overview of MassDOT Complete Streets Funding Program Educate the community on Complete Streets
CONNECTING PEOPLE TO PLACES
 CONNECTING PEOPLE TO PLACES 82 EAST BENCH MASTER PLAN 07 Introduction The East Bench transportation system is a collection of slow moving, treelined residential streets and major arteries that are the
CHAPTER 3: Vision Statement and Goals
 Davidson Walks & Rolls: Active Transportation Master Plan CHAPTER 3 Contents: Overview Vision Statement Measurable Goals Public Outreach CHAPTER 3: Vision Statement and Goals Overview The vision statement
Brunswick, New Jersey, USA. First Published: July 2008 PLEASE SCROLL DOWN FOR ARTICLE
 This article was downloaded by:[rutgers University] On: 23 June 2008 Access Details: [subscription number 788777707] Publisher: Taylor & Francis Informa Ltd Registered in England and Wales Registered Number:
Prince George s County plans, policies, and projects
 Prince George s County plans, policies, and projects Over 250 projects for trails, bikeways, designated bike lanes and sidewalk construction Trail projects that improve access to Metro Sidewalk and trail
Arlington County, Virginia ~ National Capital Region Transportation Planning Board (TPB) Transportation and Land-Use Connections (TLC) Program
 Transportation and Land-Use Connections (TLC) Program") Arlington County, Virginia ~ National Capital Region Transportation Planning Board (TPB) Transportation and Land-Use Connections (TLC) Program May 4, 2011 Nature of the Problem European and US Best Practices
Arlington County, Virginia ~ National Capital Region Transportation Planning Board (TPB) Transportation and Land-Use Connections (TLC) Program May 4, 2011 Nature of the Problem European and US Best Practices
TRAFFIC CALMING GUIDE FOR TORONTO CITY OF TORONTO TRANSPORTATION SERVICES DIVISION
 TRAFFIC CALMING GUIDE FOR TORONTO CITY OF TORONTO TRANSPORTATION SERVICES DIVISION CITY OF TORONTO TRANSPORTATION SERVICES DIVISION 2016 TRAFFIC CALMING GUIDE FOR TORONTO TABLE OF CONTENTS Introduction
TOWN OF PORTLAND, CONNECTICUT COMPLETE STREETS POLICY
 TOWN OF PORTLAND, CONNECTICUT COMPLETE STREETS POLICY I. VISION, GOALS & PRINCIPLES VISION To improve the streets of Portland making them safer and more accessible for all users including pedestrians,
Double Dutch: Bicycling Jumps in Philadelphia
 Double Dutch: Bicycling Jumps in Philadelphia Introduction The path to urban sustainability is paved by streets that accommodate all users, not just cars and trucks. 20 th Century transportation policy
Making Cycling Irresistible: Lessons from the Netherlands, Denmark, and Germany
 Making Cycling Irresistible: Lessons from the Netherlands, Denmark, and Germany John Pucher and Ralph Buehler Bloustein School of Planning and Public Policy Rutgers University 33 Livingston Avenue, Room
ACTIVE TRANSPORTATION
 ACTIVE TRANSPORTATION Mobility 2040 Supported Goals Improve the availability of transportation options for people and goods. Support travel efficiency measures and system enhancements targeted at congestion
Simulation Analysis of Intersection Treatments for Cycle Tracks
 Abstract Simulation Analysis of Intersection Treatments for Cycle Tracks The increased use of cycle tracks also known as protected bike lanes has led to investigations of how to accommodate them at intersections.
Promoting Sustainable Urban Transport: Lessons from Germany Ralph Buehler and John Pucher
 Promoting Sustainable Urban Transport: Lessons from Germany Ralph Buehler and John Pucher Presented at: "Lessons from Europe Jean Monnet Research Workshop Rutgers Center for European Studies, September
ACCESSIBLE LOADING ZONES AND PROTECTED BIKE LANES: A UNIVERSAL DESIGN APPROACH. Accessibility Coalition Dec. 2016
 ACCESSIBLE LOADING ZONES AND PROTECTED BIKE LANES: A UNIVERSAL DESIGN APPROACH Accessibility Coalition Dec. 2016 A myth exists that only able-bodied individuals can ride bicycles. In reality, people with
Arlington s Master Transportation Plan
 Arlington s Master Transportation Plan The Master Transportation Plan (MTP) Adopted in eight parts Goals & Policies element and MTP Map adopted in 2007 Bicycle, Pedestrian and Demand and Systems Management
Planning for Cycling in Peterborough
 JUST, Vol. V, No. 1, 2017 Trent University Planning for Cycling in Peterborough Eric Andreas Post Abstract With a changing climate driven by an unsustainable lifestyle, cycling is becoming increasingly
Why Zone In on Speed Reduction?
 Learn it. Do it. Live it! SPEED REDUCTION IN THE ZONE Why Zone In on Speed Reduction? Speeding is a serious issue that plays a major role in the risk of serious injury and pedestrian fatality in a crash.
Bicycle Corrals Portland Designing Streets NYC October 25, 2012 Roger Geller, Bicycle Coordinator Portland, OR
 Bicycle Corrals Portland 8-80 Designing Streets NYC October 25, 2012 Roger Geller, Bicycle Coordinator Portland, OR Build it and they will come 1990 2012 Build it better 2012 background With bike boxes
Copenhagen Cycling Map. Red Lines Cycling facilities
 Copenhagen Cycling Map Red Lines Cycling facilities Copenhagen Cycling Facilities Design Approaches Transportation without Pollution Copenhagen s Strategy Where Cycling is one of the top key activities
Tonight is for you. Learn everything you can. Share all your ideas.
 Strathcona Neighbourhood Renewal Draft Concept Design Tonight is for you. Learn everything you can. Share all your ideas. What is Neighbourhood Renewal? Creating a design with you for your neighbourhood.
Broad Street Bicycle Boulevard Design Guidelines
 Broad Street Bicycle Boulevard Design Guidelines Building from the strategies introduced in the 2013 Bicycle Transportation Plan and community input received thus far, City Transportation Staff have identified
DOWNTOWN MIAMI PEDESTRIAN PRIORITY ZONE
 DOWNTOWN MIAMI PEDESTRIAN PRIORITY ZONE AUGUST 6, 2013 DOWNTOWN MIAMI BY THE NUMBERS more than 200,000 people live, work, and play here every day is home to more than 1,000 events each year hosts more
September The State of Bicycling in Montgomery County
 September 2015 The State of Bicycling in Montgomery County The State of Bicycling in Montgomery County Abstract: This report documents the state of bicycling in Montgomery County as of September 2015.
Non-Motorized Transportation 7-1
 Non-Motorized Transportation 7-1 Transportation facilities no longer mean just accommodating a vehicle powered by a combustion engine. Pedestrian and non-motorized facilities are important modes of travel
Toronto Complete Streets Guidelines
 88 90 5.1 Cycling Design Principles 92 5.2 Context-sensitive Cycling Facilities 96 5.3 Key Cycling Elements Cycling infrastructure provides choice in how people are able to move around the city. Cyclists
Corpus Christi Metropolitan Transportation Plan Fiscal Year Introduction:
 Introduction: The Safe, Accountable, Flexible, Efficient Transportation Equity Act: A Legacy for Users (SAFETEA-LU) has continued the efforts started through the Intermodal Surface Transportation Efficiency
RESOLUTION NO ?? A RESOLUTION OF THE CITY OF NEPTUNE BEACH ADOPTING A COMPLETE STREETS POLICY
 RESOLUTION NO. 2018-?? A RESOLUTION OF THE CITY OF NEPTUNE BEACH ADOPTING A COMPLETE STREETS POLICY WHEREAS, safe, convenient, and accessible transportation for all users is a priority of the City of Neptune
1
 swadle@wichita.gov 1 I expect not only to take all of their [Seattle and Portland s] bikers but I also want all the jobs that come with this, all the economic growth that comes with this, all the opportunities
A Holistic Approach to Community Connectivity. 50 th International Making Cities Livable Conference Portland, OR June 2013
 A Holistic Approach to Community Connectivity 50 th International Making Cities Livable Conference Portland, OR June 2013 Founded 2008 About GP RED Research Education Advocacy Focus on Health, Recreation
Appendix 3 Roadway and Bike/Ped Design Standards
 Appendix 3 Roadway and Bike/Ped Design Standards OTO Transportation Plan 2040 4/20/2017 Page A3-1 Adopted Standards The adopted OTO Design Standards and Major Thoroughfare Plan are contained herein.
Telegraph Avenue Complete Streets DRAFT Recommendations. Oakland Public Works Department September 11 and 13, 2014 Open Houses
 Telegraph Avenue Complete Streets DRAFT Recommendations Oakland Public Works Department September 11 and 13, 2014 Open Houses Presentation Overview What are complete streets? What problem are we trying
Safer Cycling: How the City of Vancouver is Proactively Improving Cycling Safety
 Safer Cycling: How the City of Vancouver is Proactively Improving Cycling Safety Brian Patterson, MCIP, RPP Urban Systems 2015 Canadian Association of Road Safety Professionals (CARSP) Conference Session
Off-road Trails. Guidance
 Off-road Trails Off-road trails are shared use paths located on an independent alignment that provide two-way travel for people walking, bicycling, and other non-motorized users. Trails specifically along
Physical Implications of Complete Streets Policies
 Presentation Overview Physical Implications of Complete Norm Cox, ASLA, LLA Landscape Architect Ann Arbor, Michigan, 10:45 to Noon What Are Complete Streets? What Matters to Bicyclists and Pedestrians
LANCASTER CITY BICYCLE NETWORK
 LANCASTER CITY BICYCLE NETWORK Downtown Merchants Meeting Wednesday, July 19, 2017 http://www.lancasteratp. DOWNTOWN WALKABILITY ANALYSIS What changes can be made, in the least amount of time, and for
Bicycle Master Plan Goals, Strategies, and Policies
 Bicycle Master Plan Goals, Strategies, and Policies Mobilizing 5 This chapter outlines the overarching goals, action statements, and action items Long Beach will take in order to achieve its vision of
We believe the following comments and suggestions can help the department meet those goals.
 The Honorable Secretary Anthony Foxx The Secretary of Transportation United States Department of Transportation 1200 New Jersey Avenue, SE Washington, DC 20590 August 30, 2013 Dear Secretary Foxx, Thank
Cycle Track Design Best Practices Cycle Track Sections
 Design Best Practices Sections It is along street segments where the separation and protection methods of cycle tracks offer more comfort than conventional bicycle lanes, and are more attractive to a wide
Perryville TOD and Greenway Plan
 Perryville TOD and Greenway Plan Greenway Glossary Pathway: A bicycle and pedestrian path separated from motorized vehicular traffic by an open space, barrier or curb. Multi-use paths may be within the
Child- and Youth-friendly Land-use and Transport Planning Guidelines
 Child- and Youth-friendly Land-use and Transport Planning Guidelines Richard Gilbert Centre for Sustainable Transportation (In April 2006, the Centre moved from Toronto, Canada, to the University of Winnipeg)
By: Bill Baranowski, PE TRAFFIC CALMING EXAMPLES IN SUGARHOUSE, DAYBREAK, AND WEST JORDAN CITY
 By: Bill Baranowski, PE TRAFFIC CALMING EXAMPLES IN SUGARHOUSE, DAYBREAK, AND WEST JORDAN CITY 1977 HIGHLAND RUGBY TOUR 1945 WHERE??? What is more contentious than traffic calming? 1951 LOOKING SOUTHEAST
Chapter 7. Transportation. Transportation Road Network Plan Transit Cyclists Pedestrians Multi-Use and Equestrian Trails
 Chapter 7 Transportation Transportation Road Network Plan Transit Cyclists Pedestrians Multi-Use and Equestrian Trails 7.1 TRANSPORTATION BACKGROUND The District of Maple Ridge faces a number of unique
EXECUTIVE SUMMARY: TRANSIT-ORIENTED DEVELOPMENT IN SMITHS FALLS, ONTARIO; A COMPARISON BETWEEN TWO SITES
 EECUTIVE SUMMARY: TRANSIT-ORIENTED DEVELOPMENT IN SMITHS FALLS, ONTARIO; A COMPARISON BETWEEN TWO SITES Topic and Purpose In 2007, the Mayor of Ottawa s Task Force on Transportation suggested adding a
Minneapolis Bicycle Master Plan Chapter 4 - Goals, Objectives, and Benchmarks
 Chapter Overview Purpose This chapter presents new bicycle policies in addition to goals, objectives, and benchmarks that represent the 6 E s. Definitions The Minneapolis Bicycle Master Plan creates goals,
Mobilising Business Communities to Support Safe Cycling Infrastructure. Daniel Arancibia, Mikey Bennington, Beth Savan
 Mobilising Business Communities to Support Safe Cycling Infrastructure Daniel Arancibia, Mikey Bennington, Beth Savan Introduction Cycling advocates lobby for bike lanes by praising the social/environmental
Chestnut Street Bikeway Pilot. A Cycle Track From College Ave. to Mulberry St.
 Chestnut Street Bikeway Pilot A Cycle Track From College Ave. to Mulberry St. Prepared by the Department of Public Works - November 2015 Overview In cities across the nation, and internationally, there
Chapter 5. Complete Streets and Walkable Communities.
 Chapter 5. Complete Streets and Walkable Communities. 5.1 Description of Complete Streets. Cities throughout the world, and specifically the United States, are coming to embrace a new transportation and
Madison Urban Area and Dane County. Bicycle Transportation Plan Summary. September Introduction. Bicycle Plan Scope and Planning Process
 Bicycle Transportation Plan Summary Madison Urban Area and Dane County Introduction September 2000 Bicycling is an important mode of transportation in the Madison urban area and countywide that is available
Coquitlam Cross-town Bike Route Improving Bicycle Facilities in a Mature Suburban Environment
 Coquitlam Cross-town Bike Route Improving Bicycle Facilities in a Mature Suburban Environment Sarah Rocchi, Vice-President, Projects, Opus International Consultants (Main Presenter) Catherine Mohoruk,
WELCOME. Purpose of the Open House. Update you on the project. Present a draft recommended plan. Receive your input
 WELCOME Purpose of the Open House The Town of Smiths Falls has initiated the Beckwith Street Redevelopment Plan that includes the preparation of a streetscape functional design for the renewal of Beckwith
Solana Beach Comprehensive Active Transportation Strategy (CATS)
") Solana Beach Comprehensive Active Transportation Strategy (CATS) 3.0 Goals & Policies The Solana Beach CATS goals and objectives outlined below were largely drawn from the Solana Beach Circulation Element
Solana Beach Comprehensive Active Transportation Strategy (CATS) 3.0 Goals & Policies The Solana Beach CATS goals and objectives outlined below were largely drawn from the Solana Beach Circulation Element
Bicycle + Pedestrian Connectivity Gap Analysis
 Accelerated Bridge Program Bicycle + Pedestrian Connectivity Gap Analysis Tuesday, October 11 Shriners Hospital, Boston 6:30-8:00 PM Thursday, October 13 Community Rowing, Brighton 6:30-8:00 PM Tuesday,
Is St. Louis Ready for a Bike Share System? May 14, 2014 Public Open House
 Is St. Louis Ready for a Bike Share System? May 14, 2014 Public Open House PRESENTATION AGENDA 2 BIKE SHARE How does it work? What are the benefits? Who would use it? Will it be safe? Would it work in
TRAFFIC CALMING PLANNER S PORTFOLIO
 TRAFFIC CALMING PLANNER S PORTFOLIO ISSUE 8 January 2017 PLANNER S PORTFOLIO TRAFFIC CALMING 1 OVERVIEW 2 3 4 ENGINEERED TRAFFIC CALMING MEASURES SIGNS AND PAVEMENT MARKINGS EMERGENCY RESPONSE DELAYS 5