Streets for Everyone: Lessons from Cities across the Globe
|
|
|
- Joella Hamilton
- 5 years ago
- Views:
Transcription


1 Streets for Everyone: Lessons from Cities across the Globe John Pucher, Rutgers University Photo: Susan Handy Complete Streets Forum, Toronto, Canada, Oct 6, 2014 Photo: Ralph Buehler
2 Complete Streets Facilitate Walking and Cycling for All Ages and Abilities Expanded and improved plazas, sidewalks, crosswalks, and intersection crossings for pedestrians, designed for convenient wheelchair accessibility Addition or improvement of cycling facilities, such as wider bike lanes, colored bike lanes, buffered bike lanes, bus+bike lanes, physically protected cycle tracks Signal priority for pedestrians and cyclists Shared streets/home zones (5mph) and traffic-calmed streets (20mph)
3 Walking and Cycling: the most sustainable transport modes Most environmentally friendly: >Virtually no pollution at all >Almost no nonrenewable resources used Most equitable: >Financially affordable by virtually everyone >Physically possible by all but the severely disabled Most economical: >Minimal private and public costs >Although they take more time, they provide exercise that reduces medical costs and greatly extends our healthy life expectancy
4 50 Walking Cycling Share of Trips by Percent of trips by cycling and walking Cycling and Walking Source: Pucher and Buehler, City Cycling, MIT Press, 2012


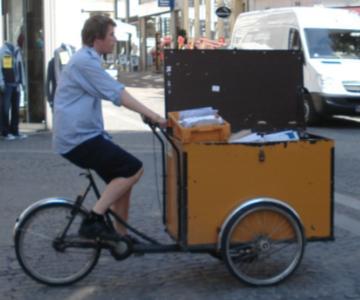
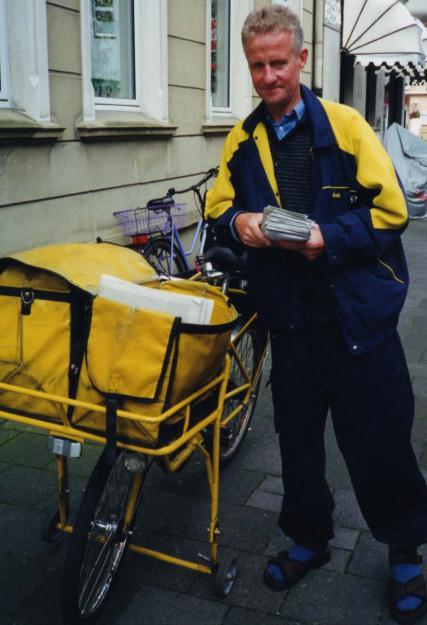

5 Europeans cycle for many trip purposes
6 70% Cycling Walking Women s Share of Bike and Walk Trips in Europe and North America Percent of trips by women 60% 50% 40% 30% 25% 52% 27% 53% 30% 56% 55% 60% 49% 49% 56% 56% 20% 10% USA UK Canada Denmark Germany Netherlands


7 Photo Susan Handy
8 70 Percent of bicyclists who are female Toronto Washington Vancouver Chicago More women on bikes = More cycling More cycling = More women on bikes Montreal Portland Minneapolis San Francisco Melbourne Sydney Berlin Tokyo Bicycle share of trips and percentage of female cyclists in 14 large cities Copenhagen Amsterdam 10 0 Source: Garard, Handy, and Dill, Women and Cycling, in Pucher and Buehler (eds.), City Cycling. Cambridge, MA: MIT Press, Percent of trips by bicycle
9 Age Group 70 Walking Cycling Bike and Walk Share 60 of Trips by Age Group ' Percent of trips by foot and bike USA UK Germany Denmark Netherlands


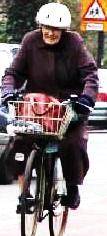

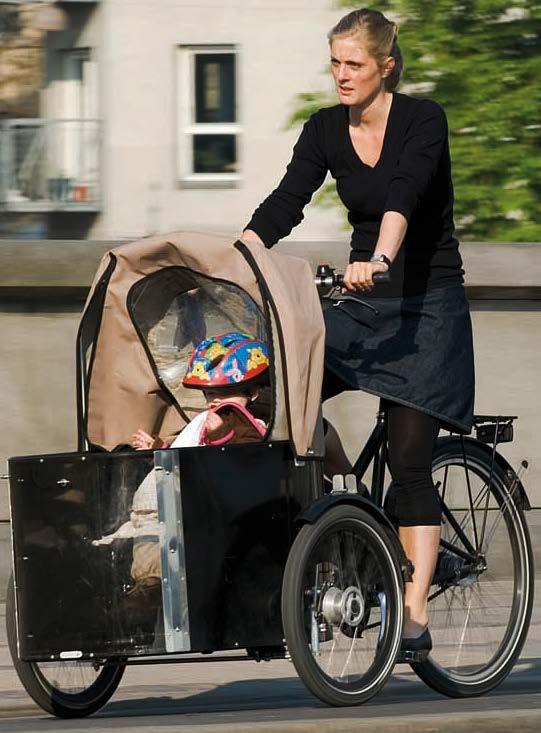
10 Cycling for all ages Foto by Marie Demers

11 Photo: NJ Bike Walk Coalition Ann and Mike s Triple Take Tandem Cycling facilities should also be safe for persons with disabilities, and bikes CAN be adapted to their needs Pucher: Walking and Cycling for
12 Make Walking and Cycling Safe for Everyone! Especially important for the young, the old, for anyone with disabilities, for the timid or risk-averse Women more sensitive to safety than men Safety of walking and cycling in the Netherlands, Denmark, and Germany helps explain high levels of walking and cycling there
13 Cycling Safety Crucial Especially important for the young, the old, for anyone with disabilities, for the timid or risk-averse Women more sensitive to safety than men Safety of cycling in the Netherlands, Denmark, and Germany helps explain high levels of cycling there

14 20.0 Cylists killed per 100 million km cycled 33.5* 18.0 Cylists injured per 10 million km cycled 16.0 Pedestrians killed per 100 million km walked Fatalitities and injuries per trip and per kilometer Pedestrians injured per 10 million km walked Cyclist and Pedestrian Fatality and Injury Rates NL DK GER UK USA
15 Trends in Cyclist Fatalities, (relative to 1970=100) USA Sources: Graph created by Ralph Buehler based on data provided by Statistics Canada, US Department of Transport, and the European Union. Canada
16 Trends in Pedestrian Fatalities, (relative to 1970=100) USA Canada Sources: Graph created by Ralph Buehler based on data provided by Statistics Canada, US Department of Transport, and the European Union.
17 SAFETY IN NUMBERS As levels of cycling and walking increase, injury and fatality rates per trip and per km traveled fall dramatically Thus, if we can increase cycling and walking, they will almost inevitably become safer ways to get around
18 9.0 Annual Fatalities per 10,000 Cyclists 8.0 New York Safety in Numbers: 7.0 Cyclist fatality rate 6.0 falls as cycling levels 5.0 increase. Chicago Washington Montréal Minneapolis Portland Toronto San Francisco 1.0 Vancouver Vancouver has safest cycling Source: Pucher and Buehler, City Cycling. Cambridge, MA: MIT Press, 2012 Bike Share of Workers
19 Reversal in Public Policies in Germany, Denmark, and the Netherlands in 1970s Pro-car policies in European cities in 1950s and 1960s caused huge decline in cycling and walking Dramatic policy turn-around since 1970s to limit car use and promote cycling, walking, and public transport in Dutch, Danish, and German cities


20 Bridge in Freiburg BEFORE and AFTER reforms 1960s Today

21 Typical residential street in Freiburg AFTER traffic calming reforms Typical residential street in Freiburg BEFORE traffic calming reforms
22 Rebound of Bike Share of Trips in German, Dutch, and Danish Cities Percent of all trips Nuremburg ('76-'12) Berlin ('92-'08) Cologne ('76-'09) Munich ('91-'11) Freiburg ('82-'12) Muenster ('82-'10) Amsterdam ('70-'10) Source: Pucher, Dill, and Handy, Infrastructure, Programs, and Policies to Increase Bicycling, Preventive Medicine, Jan 2010, Vol. 50, S.1, pp. S106-S125. Copenhagen ('98-'10)
23 Recent Boom in Pro-Bike Policies in Many Cities Especially since 2000, European and North American cities without a tradition of cycling for daily travel have dramatically raised cycling levels Improved cycling infrastructure and many other measures to encourage cycling
24 Percent of Trips More and better cycling facilities and complementary programs have increased bike share of trips in cities without a tradition of cycling for daily travel London ('03-'10) Barcelona ('05-'12) Paris ('01-'10) Bogota ('95-'10) Sevilla ('06-'12) Source: Pucher, Dill, and Handy, Infrastructure, Programs, and Policies to Increase Bicycling, Preventive Medicine, Jan 2010, Vol. 50, S.1, pp. S106-S125.
25 Boom in Cycling to Work in 14 Large US and Canadian Cities Source: Pucher, J. and Buehler, R. City Cycling, MIT Press, Cambridge, Mass, Bike Share of Regular Commutes (USA) / 1996 (Canada) 2011 (USA and Canada) * 2011 figures for Canadian cities are preliminary estimates *
26 How to Encourage More Cycling and Walking while Improving Safety Better cycling and walking facilities Integration of walk/bike with public transport Traffic calming of residential neighborhoods Mixed-use zoning and improved urban design Restrictions on motor vehicle use Traffic education and Safe Routes to School Traffic regulations and enforcement

27 Most European cities have extensive carfree districts ideal for walking and cycling

28 Source: Warren Salomon Bike paths in Dutch cities make it safe and comfortable for all to bike: including women, children, and seniors

29 One-way cycle track in The Hague Raised curb between cycle track and traffic lane Source: Peter Furth

30 Provision of cycle track at this key underpass in Montreal Separation from traffic via concrete barriers AND bollards Photo: Velo Quebec For 6 Montreal cycle tracks studied, injury rate averaged 28% lower and usage rate 2.5 times higher than on comparable reference streets without facilities (Lusk et al, 2011, Injury Prev)
 Photo: NYC DOT Traffic-protected cycle track on 9 th")
31 380 mi of new bike lanes and paths since 2000 Quadrupling in bike trips since % decrease in serious cyclist injuries and fatalities per million bike trips Biggest increases in cycling on protected bike lanes (cycle tracks) Photo: NYC DOT Traffic-protected cycle track on 9 th Avenue, NYC

32 Economic benefits of this cycle track exceed costs by over three-to-one! Photo: Fiona Campbell Cycling has doubled in Sydney, Australia since installation of its cycle track network

33 Source: Alta Planning This cycle track in St. Petersburg, Florida has increased cycling by senior citizens and women

34 Photo: Robin Stallings Cycling in Sevilla, Spain increased more than 10-fold after these safe cycle tracks were installed
 to")

35 Protected cycle tracks on Sherbourne tripled cycling from 1,169 daily bike trips in 2012 (unprotected bike lanes) to 3,455 in 2014 Source: Dan Egan, City of Toronto Street-level cycle track Gerrard to Bloor Raised cycle track King to Gerrard


36 Before Simcoe Street Transformation of Simcoe Street into a Complete Street by installing a protected on-street cycle track and widening the sidewalk for pedestrians After Source: Dan Egan, City of Toronto


37 Before After Photo: Paul Krueger Transformation of Hornby Street in Vancouver with installation of first-class cycle track


38 Protected bike lanes on Adelaide, Simcoe and Richmond Streets Source: Dan Egan, City of Toronto Source: Nancy Lea Smith, TCAT Source: Dan Egan, City of Toronto Source: Dan Egan, City of Toronto

39 Source: Christina Bouchard, City of Toronto Contraflow bike lane on Shaw Street enables bi-directional travel for cyclists and provides a more direct and quicker route. By 2015, 22 contra-flow bike lanes will be installed in Greater Toronto
40 Before-and-After Impacts of Protected Bike Lanes (cycle tracks or buffered bike lanes): Buffered bike lanes on Spruce and Pine Streets in Philadelphia: +95% bike trips Buffered median bike lanes, DC, Pennsylvania Ave: +200% bike trips Cycle track, Kinzie St., Chicago: +55% bike trips Cycle track, NYC, Prospect Park West: +190% bike trips Cycle track, NYC, Columbus Avenue: +56% bike trips Cycle track, SF, Market St: +115% bike trips Cycle track, Vancouver, Canada, Dunsmuir St: +54% bike trips 6 cycle tracks in Montreal: 2.5 times more cyclists on cycle tracks than on comparable reference streets without facilities New system of 120km of cycle tracks in Sevilla, Spain led to over a 5-fold increase in number of daily bike trips and halving in cyclist fatality rate per 100,000 trips from 2006 to 2010
41 Cycling facilities are much cheaper to build than new or widened roadways Germany $12-$150 million per km for new or widened roadway $ million per km for physically separated cycle track $40k-90k per km for on-street bike lane $100k-250k per km of bike boulevard (also known as neighborhood greenways or local street bikeways) Roads about TEN times more expensive than even the most elaborate urban cycle tracks!


42 But bike lanes are definitely better than no separate bike facilities, but they do not provide nearly as much protection of cyclists from motor vehicles as cycle tracks Bike lanes used for car parking Bike lanes used for truck deliveries Dooring of cyclists

43 All streets should come complete with safe facilities for pedestrians and cyclists

44 Planned complete street along Highway 7 in Markham with widened sidewalk, protected cycle track, and HOV lane; spring 2015 construction Need to turn Highway 7 into a REAL Main Street for Markham, a complete Main Street! Current very incomplete road in Markham lacks sidewalks, bike facilities, and bus lanes


45 Charlotte, North Carolina: Transformation of East Boulevard

46 Crucial provisions for cyclists and pedestrians on bridges even during construction as here in Montreal Source: Velo Quebec

47 COMPLETE BRIDGES: Bike paths on the four East River bridges in NYC provide crucial connections from Brooklyn and Queens to Manhattan Source: Transportation Alternatives NYC
48 Traffic Calming of Residential Neighborhoods Speed limited by law to 30km per hour (19mph) or less Physical measures that force cars to slow down: Road narrowing, zigzag routing, chicanes Raised intersections and crosswalks Traffic circles Speed humps and bumps Mid-block closures and artificial dead-ends Bulb-outs at intersections and crosswalks, with sidewalk widening

49 Why Traffic Calming Saves Lives Speed Speed kills! kills! Source: World Health Organization (2008) and OECD Transport Research Centre (2006)


50 Source: Cara Seiderman Curb extensions, protective bollards, raised crosswalks, refuge islands Traffic calming increases pedestrian visibility and slows down cars Source: Source: Jeff Cara Rosenblum Seiderman


51 Photo: Transports Viables Cheap, easy, and very effective traffic diverters Traffic calming in Quebec City and Montreal Traffic Calming in Québec City Photo: Velo Quebec Source: Transports Viables


52 Photo: Paul Krueger Photo: Paul Krueger 152km of bike boulevards in Vancouver Photo: Paul Krueger

53 7 km/hr speed limit Shared streets: Typical traffic calming in new German and Dutch suburbs
54 Dutch bicycle facility selection matrix Lane Configuration Average daily traffic (vehicles / day) Urban local street Street type and speed limit Urban through street Rural local road Fast traffic road 30 km/h (19 mph) 50 km/h (31 mph) 60 km/h (37 mph) 70+ km/h (44+ mph) < 2500 advisory bike lane 4 2-way traffic with no centerline 2000 to to 5000 mixed traffic 1 bike lane 2 or cycletrack 3 bike lane 2 or cycle track 5 cycle track or low-speed service road > lanes (1+1) any 4 lanes (2 + 2) or more any bike lane or cycle track bike lane or cycle track (does not exist) bike lane or cycle track 3 bike lane or cycle track 3 Source: Peter Furth, Cycling Infrastructure, in Pucher and Buehler, eds. City Cycling, MIT Press, cycle track or low speed service road

55 Photo: Fiona Campbell After installation of this cycle track in Sydney, Australia, over a third of children now bike to school!
56 Children who bike or walk to school learn better: Students arrive at school awake and ready to learn More attentive and able to concentrate Advanced mental alertness by half a school year More benefit for mental development than having breakfast and lunch! Source: Egelund et al. (2012). Study of over 20,000 school children

57 Over 100,000 participants at LA s fourth annual CicLAvia in October 2012 Source: Ryan Snyder Open Streets events emphasize that streets belong to everyone
58 Implementation Strategies 1. Publicize both individual and societal benefits 2. Ensure citizen participation at all stages of planning and implementation 3. Develop long-range bike plans; regularly update them 4. Implement controversial policies in stages, easiest first 5. Combine incentives for cycling and walking with disincentives for car use 6. Build alliances among ped/bike groups and with transit, environmentalists, public health, business leaders, politicians, and media 7. Coordinate ped/bike advocacy and planning through local, regional, and national organizations 8. Local political leadership is essential


59 Laissez le bon temps rouler! EN VELO!!! Photo: Susan Handy Photo: SF Bike Coalition Photo: Greg Raisman San Antonio Photo: Ralph Buehler Photo: Bike Texas Photo: Marie Demers
How to Increase Cycling for Daily Travel: Lessons from Cities across the Globe
 How to Increase Cycling for Daily Travel: Lessons from Cities across the Globe Joint Webinar for the Institute of Transportation Engineers and the Active Living Research Program of the Robert Wood Johnson
Lessons from Cities across the Globe
 Cycling to the Future: Lessons from Cities across the Globe John Pucher, Rutgers University Ralph Buehler, Virginia Tech Photo: Susan Handy Photo: Photo: SF Greg Bike Coalition Raisman San Antonio Photo:
Promoting Safe Walking and Cycling: Lessons from Europe and North America. John Pucher, Rutgers University, and Ralph Buehler, Virginia Tech
 Promoting Safe Walking and Cycling: Lessons from Europe and North America John Pucher, Rutgers University, and Ralph Buehler, Virginia Tech Walking and Cycling: the MOST sustainable transport modes MOST
Promoting Walking and Cycling in Los Angeles: Lessons from Europe and North America
 Promoting Walking and Cycling in Los Angeles: Lessons from Europe and North America John Pucher, Rutgers University, and Ralph Buehler, Virginia Tech Walking and Cycling: the MOST sustainable transport
Walking and Cycling for Healthy Cities
 Walking and Cycling for Healthy Cities Prof. John Pucher, Rutgers University http://policy.rutgers.edu/faculty/pucher Walking and Bicycling: the MOST sustainable transport modes MOST environmentally friendly:
SUSTAINABILITY, TRANSPORT, & HEALTH. Ralph Buehler, Virginia Tech
 SUSTAINABILITY, TRANSPORT, & HEALTH Ralph Buehler, Virginia Tech Prepared for National Academies Roundtable on Science and Technology for Sustainability 6 December 2013 Overview Trends in Motorization
Walking and Cycling for ALL New Jerseyans
 Walking and Cycling for ALL New Jerseyans Prof. John Pucher, Rutgers University http://policy.rutgers.edu/faculty/pucher Walking and Bicycling: the MOST sustainable transport modes MOST environmentally
Infrastructure and Programs. What does the data say? Advancing Non-motorized Transportation in Vermont 11/15/09
 Advancing Non-motorized Transportation in Vermont A reply from the university point of view Lisa Aultman-Hall Professor and Director Figure 4 Why Canadians Cycle more than Americans: A Comparative Analysis
Lessons from Copenhagen. John L Bowman 2013
 Lessons from Copenhagen John L Bowman 2013 Bicycle Strategy Official municipal policy Goals for the next 15 years Updated after 5-10 years 32 page glossy brochure BAC December 2, 2013 John L Bowman 2 Bicycle
Safety in numbers What comes first safety or numbers? Jan Garrard School of Health and Social Development Deakin University
 Safety in numbers What comes first safety or numbers? Jan Garrard School of Health and Social Development Deakin University The safety in numbers theory As the number of cyclists increases, injury rates
Facility preferences & safety
 Photo Flickr: Boegh Facility preferences & safety Evidence from two studies Kay Teschke School of Population & Public Health University of British Columbia Canadians don t cycle much % of trips by bike
BIKE TRANSIT INTEGRATION IN NORTH AMERICA. John Pucher & Ralph Buehler
 BIKE TRANSIT INTEGRATION IN NORTH AMERICA John Pucher & Ralph Buehler Synergies: Bicycling and Public Transport: Perfect Together? Cycling extends catchment areas of transit stops far beyond walking range
Cycle Tracks: Concept and Design Practices. February 17, 2010
 Cycle Tracks: Concept and Design Practices February 17, 2010 Today s webinar presenters APBP Board Member Host Brett Hondorp, Principal, Alta Planning + Design Guest Moderator Zach Vanderkooy, Bicycling
Canada. UK France. Walk, Bike, Transit Share of Trips
 1950s 1960s Today Relationship between Share of Urban Trips by Transit, Bicycle, and Foot and Per Capita Annual CO 2 Emissions from Road and Rail Transport in Australia, Canada, the USA and EU Countries,
Complete Streets 101: The Basics
 Complete Streets 101: The Basics Michigan Municipal League - Capital Conference March 21, 2017 Chip Smith, AICP - Senior Planner - Wade Trim Inc. and City Council member City of Ann Arbor 2017 MML Capital
Travel Behavior, Transport Policy, and Sustainable Transport in Germany and the USA
 Travel Behavior, Transport Policy, and Sustainable Transport in Germany and the USA Similarities between Germany and the USA Federal system of government, tradition of local self-government Strong economy,
Canada s Capital Region Delegation to the Velo-City Global 2010 Conference
 Canada s Capital Region Delegation to the Velo-City Global 2010 Conference Report of Findings from Visits, Meetings & Presentations In Amsterdam-Den Haag, Utrecht, Berlin & Copenhagen The Itinerary Copenhagen
Forhealth health, forfun, for transportation. Prof. John Pucher, Rutgers University
 BIKING FOR ALL TEXANS Forhealth health, forfun, for transportation Prof. John Pucher, Rutgers University Walking and Bicycling: the MOST sustainable ti transport tmodes MOST environmentally friendly: >Virtually
Active Transportation Facility Glossary
 Active Transportation Facility Glossary This document defines different active transportation facilities and suggests appropriate corridor types. Click on a facility type to jump to its definition. Bike
Bicycle Facilities Planning
 Bicycle Facilities Planning Overview Types of Cyclists Purpose for Riding Types of Facilities Bike Lanes Bicycle Boulevards Cycle Tracks Intersections Signals Signing and Marking Discussion Types of Bicyclists
ACCESSIBLE LOADING ZONES AND PROTECTED BIKE LANES: A UNIVERSAL DESIGN APPROACH. Accessibility Coalition Dec. 2016
 ACCESSIBLE LOADING ZONES AND PROTECTED BIKE LANES: A UNIVERSAL DESIGN APPROACH Accessibility Coalition Dec. 2016 A myth exists that only able-bodied individuals can ride bicycles. In reality, people with
Building a Toronto that Moves
 Building a Toronto that Moves Image courtesy of the City of Toronto Setting Election Priorities for Walking, Cycling & Public Transit Toronto is a fast-paced, dynamic city. It s a city that moves except
Bicycle Boulevards and Neighborhood Greenways
 Bicycle Boulevards and Neighborhood Greenways Traffic Safety is Improving for Everyone 90 80 70 60 50 40 30 20 10 0 PORTLAND: TOTAL TRAFFIC FATALITIES 1986-2008 1986 1987 1988 1989 1990 1991 1992 1993
PEDALING FORWARD. A Glance at the SFMTA s Bike Program for SFMTA.COM
 PEDALING FORWARD A Glance at the SFMTA s Bike Program for 2017-2021 SFMTA.COM INTRODUCTION About This Booklet More people from all walks of life see their bicycle as a more convenient way to get where
Cycling Economies. Economic Impacts of Bike Lanes. Daniel Arancibia
 Cycling Economies Economic Impacts of Bike Lanes Daniel Arancibia Introduction Research is showing that cyclists are good customers, that their numbers and economic impact increase with bike lanes, and
About the Active Transportation Alliance
 About the Active Transportation Alliance Chicagoland s voice for better biking, walking and transit Founded 1985 7,000 members, ~33 full time staff Serve Chicago metro region 1 More Cars, More Driving
Health, Transportation and Bicycling: Connecting the Dotted Lines
 Portland State University PDXScholar Urban Studies and Planning Faculty Publications and Presentations Nohad A. Toulan School of Urban Studies and Planning 11-17-2010 Health, Transportation and Bicycling:
The Transformation of Portland into a Two-Wheeled Mecca. Mia Birk, Principal, Alta Planning + Design
 The Transformation of Portland into a Two-Wheeled Mecca Mia Birk, Principal, Alta Planning + Design Development of Portland s Bikeway Network 1990 Early 1990s Infrastructure Growing Public Support Growing
Film Guide for Educators. Designing for Safety
 Film Guide for Educators Designing for Safety Designing For Safety Key Concepts Speeding While Driving Speeding is the number one cause of injuries and deaths from driving. The main reasons are because
What route types best motivate cycling? Evidence about route preferences & safety
 What route types best motivate cycling? Evidence about route preferences & safety Photo: Ken Ohrn Kay Teschke School of Population & Public Health The University of British Columbia Canadians don t cycle
TRAFFIC CALMING GUIDE FOR TORONTO CITY OF TORONTO TRANSPORTATION SERVICES DIVISION
 TRAFFIC CALMING GUIDE FOR TORONTO CITY OF TORONTO TRANSPORTATION SERVICES DIVISION CITY OF TORONTO TRANSPORTATION SERVICES DIVISION 2016 TRAFFIC CALMING GUIDE FOR TORONTO TABLE OF CONTENTS Introduction
LANCASTER CITY BICYCLE NETWORK
 LANCASTER CITY BICYCLE NETWORK Downtown Merchants Meeting Wednesday, July 19, 2017 http://www.lancasteratp. DOWNTOWN WALKABILITY ANALYSIS What changes can be made, in the least amount of time, and for
Watertown Complete Streets Prioritization Plan. Public Meeting #1 December 14, 2017
 Watertown Complete Streets Prioritization Plan Public Meeting #1 December 14, 2017 Goals for Public Meeting Overview of MassDOT Complete Streets Funding Program Educate the community on Complete Streets
Land Use & Transportation
 21 st Century Transportation in Convenient Communities Prof. Paul Okamoto s Sustainable Design University of San Francisco 24 September 2014 Land Use & Transportation ASHRAE Golden Gate Seminar Sustainable
2.0 LANE WIDTHS GUIDELINE
 2.0 LANE WIDTHS GUIDELINE Road Engineering Design Guidelines Version 2.0.1 May 2018 City of Toronto, Transportation Services City of Toronto Page 0 Background In early 2014, Transportation Services initiated
Double Dutch: Bicycling Jumps in Philadelphia
 Double Dutch: Bicycling Jumps in Philadelphia Introduction The path to urban sustainability is paved by streets that accommodate all users, not just cars and trucks. 20 th Century transportation policy
OLDER PEOPLE INDEPENDENT MOBILITY FOR LIVEABLE COMMUNITIES. Christopher G B (Kit) Mitchell
 Mitchell") OLDER PEOPLE INDEPENDENT MOBILITY FOR LIVEABLE COMMUNITIES by Christopher G B (Kit) Mitchell Independent mobility is necessary for a high quality of adult life In developed countries, the automobile has
OLDER PEOPLE INDEPENDENT MOBILITY FOR LIVEABLE COMMUNITIES by Christopher G B (Kit) Mitchell Independent mobility is necessary for a high quality of adult life In developed countries, the automobile has
Protected Bike Lanes in San Francisco Mike Sallaberry SFMTA NACTO Workshop - Chicago IL
 Protected Bike Lanes in San Francisco Mike Sallaberry SFMTA 10 14 2011 NACTO Workshop - Chicago IL San Francisco 2 nd Highest Density in the U.S. 47 square miles Mild Climate Market Population ~810,000
South Bay Bicycle Master Plan American Planning Association National Conference Los Angeles, CA
 South Bay Bicycle Master Plan 2012 American Planning Association National Conference Los Angeles, CA April 17, 2012 Overview I. Background II. The Importance of Partnerships III. Approach and Success Stories
DOWNTOWN MIAMI PEDESTRIAN PRIORITY ZONE
 DOWNTOWN MIAMI PEDESTRIAN PRIORITY ZONE AUGUST 6, 2013 DOWNTOWN MIAMI BY THE NUMBERS more than 200,000 people live, work, and play here every day is home to more than 1,000 events each year hosts more
FEDERAL HIGHWAY ADMINISTRATION APPLICATION
 FEDERAL HIGHWAY ADMINISTRATION APPLICATION REQUEST FOR PERMISSION TO EXPERIMENT WITH A BICYCLE BOX INTERSECTION TREATMENT Submitted by: City of Columbus Department of Public Service Date: June 26, 2009
Toronto Complete Streets Guidelines
 88 90 5.1 Cycling Design Principles 92 5.2 Context-sensitive Cycling Facilities 96 5.3 Key Cycling Elements Cycling infrastructure provides choice in how people are able to move around the city. Cyclists
What future for mid-sized cities? Prof. Emer. Antony Stathopoulos National Technical University of Athens
 What future for mid-sized cities? Prof. Emer. Antony Stathopoulos National Technical University of Athens These cities can range in size from 50,000 to 250,000 in population. Street in Larnaca in 1878
Sustainable Transportation Planning in the Portland Region
 Sustainable Transportation Planning in the Portland Region Jennifer Dill, Ph.D. Associate Professor School of Urban Studies & Planning jdill@pdx.edu http://web.pdx.edu/~jdill/ Outline Elements of a sustainable
Cycling for Everyone:
 Cycling for Everyone: The Key to Public and Political Support John Pucher Rutgers University (http://policy.rutgers.edu/faculty/pucher.html) Reasons for everyone to support cycling: More daily physical
Agenda. Overview PRINCE GEORGE S PLAZA METRO AREA PEDESTRIAN PLAN
 PRINCE GEORGE S PLAZA METRO AREA PEDESTRIAN PLAN May 28, 2008 Agenda Welcome and introductions Project overview and issue identification Planning context and strengths Design challenges and initial recommendations
Appendix 3 Roadway and Bike/Ped Design Standards
 Appendix 3 Roadway and Bike/Ped Design Standards OTO Transportation Plan 2040 4/20/2017 Page A3-1 Adopted Standards The adopted OTO Design Standards and Major Thoroughfare Plan are contained herein.
Bike lanes for. Everyone
 Bike lanes for Everyone Goal: To increase the people riding bicycles as a normal part of every day life People riding bicycles as a normal part of every day life Regardless of age, gender, and social /
Child- and Youth-friendly Land-use and Transport Planning Guidelines
 Child- and Youth-friendly Land-use and Transport Planning Guidelines Richard Gilbert Centre for Sustainable Transportation (In April 2006, the Centre moved from Toronto, Canada, to the University of Winnipeg)
By: Bill Baranowski, PE TRAFFIC CALMING EXAMPLES IN SUGARHOUSE, DAYBREAK, AND WEST JORDAN CITY
 By: Bill Baranowski, PE TRAFFIC CALMING EXAMPLES IN SUGARHOUSE, DAYBREAK, AND WEST JORDAN CITY 1977 HIGHLAND RUGBY TOUR 1945 WHERE??? What is more contentious than traffic calming? 1951 LOOKING SOUTHEAST
TOWN OF PORTLAND, CONNECTICUT COMPLETE STREETS POLICY
 TOWN OF PORTLAND, CONNECTICUT COMPLETE STREETS POLICY I. VISION, GOALS & PRINCIPLES VISION To improve the streets of Portland making them safer and more accessible for all users including pedestrians,
PRINCE GEORGE S PLAZA METRO AREA PEDESTRIAN PLAN
 PRINCE GEORGE S PLAZA METRO AREA PEDESTRIAN PLAN May 28, 2008 Agenda Welcome and introductions Project overview and issue identification Planning context and strengths Design challenges and initial recommendations
Richmond-Adelaide Cycle Tracks
 Public Drop-In Event Richmond-Adelaide Cycle Tracks June 25, 2018 12:00 p.m. 3:00 p.m. 4:30 p.m. 7:30 p.m. Metro Hall, Rotunda 55 John Street 1 Purpose of Event In Scope Communicate an update about the
Aaron s European Transportation Vacation Slide Show
 New York Metropolitan Transportation Council Brown Bag Lunch Speakers Series Aaron s European Transportation Vacation Slide Show Presentation by Aaron Naparstek Wednesday, November 16, 2005. Permission
National Safe Routes to School Program: Initial Results
 National Safe Routes to School Program: Initial Results Lauren Marchetti National Center for Safe Routes to School 9 th Annual New Partners for Smart Growth Thursday, February 4, 2010 Seattle, WA August
Complete Streets Policy and Practice
 Complete Streets Policy and Practice presented by Leslie Phemister, Nancy Wagner and Kasey Holloway Active Transportation Alliance 1 Learning Objectives Understand the connection between public health
Biking Culture In US Cities Compared to That of Amsterdam and Copenhagen
 Biking Culture In US Cities Compared to That of Amsterdam and Copenhagen Benefits of Biking Environmental Less Expensive Healthier Safer -No emissions (that contribute to air pollution and climate change)
Appendix C 3. Bicycle / Pedestrian Planning
 Appendix C 3. Bicycle / Pedestrian Planning BICYCLE/PEDESTRIAN PLANNING 2005 Master Plan GOAL: Provide for safe and convenient bicycle and pedestrian circulation throughout the City. Develop a city-wide
REGIONAL BICYCLE AND PEDESTRIAN DESIGN GUIDELINES
 REGIONAL BICYCLE AND PEDESTRIAN DESIGN GUIDELINES November 16, 2011 Deb Humphreys North Central Texas Council of Governments Bicycle and Pedestrian Advisory Committee Snapshot of the Guide 1. Introduction
PBIC Webinar. How to Create a Bicycle Safety Action Plan: Planning for Safety [IMAGE] Oct. 2, 2014, 2 pm
![PBIC Webinar. How to Create a Bicycle Safety Action Plan: Planning for Safety [IMAGE] Oct. 2, 2014, 2 pm](/thumbs/86/93953441.jpg "PBIC Webinar. How to Create a Bicycle Safety Action Plan: Planning for Safety [IMAGE] Oct. 2, 2014, 2 pm") PBIC Webinar How to Create a Bicycle Safety Action Plan: Planning for Safety [IMAGE] Bill Schultheiss, Vice President, Toole Design Peter Lagerwey, Regional Director, Toole Design Oct. 2, 2014, 2 pm Today
PBIC Webinar How to Create a Bicycle Safety Action Plan: Planning for Safety [IMAGE] Bill Schultheiss, Vice President, Toole Design Peter Lagerwey, Regional Director, Toole Design Oct. 2, 2014, 2 pm Today
Promoting Sustainable Urban Transport: Lessons from Germany Ralph Buehler and John Pucher
 Promoting Sustainable Urban Transport: Lessons from Germany Ralph Buehler and John Pucher Presented at: "Lessons from Europe Jean Monnet Research Workshop Rutgers Center for European Studies, September
What Is a Complete Street?
 Session 5 Charleen Zimmer, AICP, Zan Associates May 5-7, 2010 What Is a Complete Street? May 2010 5-1 Not a Complete Street More of a Complete Street May 2010 5-2 Benefits of Complete Streets Safety for
Corydon-Osborne Neighbourhood Plan Recommendations
 Corydon-Osborne Neighbourhood Plan Recommendations November 12, 2013 Plan Boundaries The current boundaries of Stafford Street to the west and Donald Street to the east ignore two key cycling routes; Harrow
Public Health in the Public Realm: Influencing Street Design with Health in Mind Dr. David McKeown Medical Officer of Health
 Public Health in the Public Realm: Influencing Street Design with Health in Mind Dr. David McKeown Medical Officer of Health Complete Streets Forum April 23, 2010 Common Goals of Public Health and Complete
Copenhagen Cycling Map. Red Lines Cycling facilities
 Copenhagen Cycling Map Red Lines Cycling facilities Copenhagen Cycling Facilities Design Approaches Transportation without Pollution Copenhagen s Strategy Where Cycling is one of the top key activities
Safety and Active Transport. Dr. Maureen Carew, Medical Officer of Health Renfrew County and District Health Unit May 30, 2014
 Safety and Active Transport Dr. Maureen Carew, Medical Officer of Health Renfrew County and District Health Unit May 30, 2014 Active Transport Vision Increase levels of walking and cycling Reduce vehicle
Space for Cycling. Delivering healthy streets. Roger Geffen Policy Director, Cycling UK
 Space for Cycling Delivering healthy streets Roger Geffen Policy Director, Cycling UK About Cycling UK 65,000 members, founded 1878 Cycling activities, membership services (legal, insurance, magazine)
Arlington County, Virginia ~ National Capital Region Transportation Planning Board (TPB) Transportation and Land-Use Connections (TLC) Program
 Transportation and Land-Use Connections (TLC) Program") Arlington County, Virginia ~ National Capital Region Transportation Planning Board (TPB) Transportation and Land-Use Connections (TLC) Program May 4, 2011 Nature of the Problem European and US Best Practices
Arlington County, Virginia ~ National Capital Region Transportation Planning Board (TPB) Transportation and Land-Use Connections (TLC) Program May 4, 2011 Nature of the Problem European and US Best Practices
Matt Dykstra PSU MGIS Program
 Matt Dykstra PSU MGIS Program Outline Background Objective Existing Research Methodology Conclusions Significance and Limitations Two-way cycle track: Streetsblog.org Background What is bicycle infrastructure?
Color your stress away
 Color your stress away Learn about the Bicycle Master Plan s comfortable, low-stress bicycling network in Montgomery County. Unwind as you color the bicycling scenes. Check out montgomeryplanning.org/bikeplan
Bicycle + Pedestrian Connectivity Gap Analysis
 Accelerated Bridge Program Bicycle + Pedestrian Connectivity Gap Analysis Tuesday, October 11 Shriners Hospital, Boston 6:30-8:00 PM Thursday, October 13 Community Rowing, Brighton 6:30-8:00 PM Tuesday,
Cycle Track Design Best Practices Cycle Track Sections
 Design Best Practices Sections It is along street segments where the separation and protection methods of cycle tracks offer more comfort than conventional bicycle lanes, and are more attractive to a wide
Seattle Bicycle Advisory Board August 3, 2011
 First Hill Streetcar Project Seattle Bicycle Advisory Board August 3, 2011 S teve Durrant Alta Planning + Des ign Mark Dorn UR S J im Peters DK S Context First Hill Cycle Track Key Strategies Segment 1
Better Market Street Project Update. Urban Forestry Council September 17, 2014
 Better Market Street Project Update Urban Forestry Council September 17, 2014 Project Area Limits Better Market Street Schedule Market Street City s busiest transit corridor Over 85 buses per hour 14 surface
Win-Win Transportation Solutions
 Win-Win Transportation Solutions Todd Litman Victoria Transport Policy Institute Presented Lipinski Symposium on Transportation Policy Chicago, Illinois 15 October 2007 What is The Transportation Problem?
Glebe Neighbourhood Cycling Plan
 Glebe Neighbourhood Cycling Plan Summary of Public Comments received after June 5 th Public Information Session Comment STUDY NETWORK CS9, CS8, E, E0 CS4, E CS4 CS8 E Suggestions for alternate cycling
Pedestrians safety. ROAD SAFETY SEMINAR PIARC/AGEPAR/GRSP Lome, Togo October 2006 Lise Fournier, Canada-Qu
 Pedestrians safety ROAD SAFETY SEMINAR Lome, Togo October 2006 Lise Fournier, Canada-Qu Québec Contents WHO s data Risk factors Pedestrian needs Pedestrian facilities Conclusion Source: WHO WHO reports
Board-Approved Funding Awards for Cycle 4 Active Transportation Grant Program Projects (in Order of Project Rankings) Approved on
 Approved on") CAPITAL Large Category Projects Board-Approved Funding Awards for Cycle 4 Active Transportation Grant Program Projects (in Order of Project Rankings) Approved on 07-27-18 1 La Mesa University Ave Pedestrian
CAPITAL Large Category Projects Board-Approved Funding Awards for Cycle 4 Active Transportation Grant Program Projects (in Order of Project Rankings) Approved on 07-27-18 1 La Mesa University Ave Pedestrian
outline 1. why cycle? 2. (safety health) 3. safe system 4. what next
 3. safe system 4. what next") outline 1. why cycle? 2. (safety health) 3. safe system 4. what next In a city of many cyclists, why do they ride? Copenhageners reasons for cycling to and from work (multiple answers) 56% it s faster
outline 1. why cycle? 2. (safety health) 3. safe system 4. what next In a city of many cyclists, why do they ride? Copenhageners reasons for cycling to and from work (multiple answers) 56% it s faster
Richmond-Adelaide Cycle Track Study Including Peter Street & Simcoe Street
 Richmond-Adelaide Cycle Track Study Including Peter Street & Simcoe Street Information Booklet #2 DRAFT November 5, 2013 Richmond St. west of University Ave. Table of Contents BACKGROUND... 3 WHAT S NEW
EAST VILLAGE SHOPPERS STUDY A SNAPSHOT OF TRAVEL AND SPENDING PATTERNS OF RESIDENTS AND VISITORS IN THE EAST VILLAGE
 EAST VILLAGE SHOPPERS STUDY A SNAPSHOT OF TRAVEL AND SPENDING PATTERNS OF RESIDENTS AND VISITORS IN THE EAST VILLAGE CONTENTS 2 4 5 6 7 16 17 19 SUMMARY INTRODUCTION BACKGROUND METHODOLOGY RESULTS CONCLUSION
TRAFFIC CALMING TOOLBOX. For the residents of the City of Decatur, Georgia
 TRAFFIC CALMING TOOLBOX For the residents of the City of Decatur, Georgia 2 City of Decatur Traffic Calming Toolbox Public Works Department 2635 Talley Street Decatur, GA 30030 404.377.5571 3 Welcome to
UPTOWN REGIONAL BIKE CORRIDORS PROJECT SAN DIEGO ASSOCIATION OF GOVERNMENTS
 UPTOWN REGIONAL BIKE CORRIDORS PROJECT SAN DIEGO ASSOCIATION OF GOVERNMENTS SUMMARY REPORT: COMMUNITY UPDATE MEETING February 6, 2014 6 8:30 p.m. Roosevelt Middle School Library 3366 Park Blvd, San Diego
INTERSECTION DESIGN. Bicycle Facility Workshop Intersections 4-1
 INTERSECTION DESIGN 4-1 Intersections Avoid unusual conflicts Provide direct path for cyclists, close to that of motor vehicles Bicyclists should be visible; their movements should be predictable Simple
How to Develop a Pedestrian Safety Action Plan
 How to Develop a Pedestrian Safety Action Plan Course Introduction Presented by: Peter Eun FHWA RC Safety Engineer Ryan Snyder President, Ryan Snyder Associates, LLC Paul Zykofsky Director, Land Use and
ADVISORY BICYCLE LANES REALITY VERSUS DESIGN GUIDANCE
 Michael Williams 0 ADVISORY BICYCLE LANES REALITY VERSUS DESIGN GUIDANCE Michael Williams (Corresponding author) Alta Planning + Design SE Grand Avenue Portland, OR Email: michaelwilliams@altaplanning.com
Hennepin County Bicycle and Pedestrian Planning
 Hennepin County Bicycle and Pedestrian Planning 1 Value of bicycle and sidewalk systems Safety Livability Mobility Health Personal Finances Economic Sustainability Clean Air Recreation Parking and congestion
Prince George s County plans, policies, and projects
 Prince George s County plans, policies, and projects Over 250 projects for trails, bikeways, designated bike lanes and sidewalk construction Trail projects that improve access to Metro Sidewalk and trail
Safe Streets. City of Lake Forest Park. March 21, 2017
 Safe Streets City of Lake Forest Park March 21, 2017 1 01 WELCOME 2 Agenda WELCOME WHAT IS THIS PROJECT? CONTEXT DRAFT CITYWIDE PROJECTS EXERCISE INTRODUCTION 3 02 WHAT IS THIS PROJECT? 4 WHAT IS THIS
Making Cycling Irresistible: Lessons from the Netherlands, Denmark, and Germany
 Making Cycling Irresistible: Lessons from the Netherlands, Denmark, and Germany John Pucher and Ralph Buehler Bloustein School of Planning and Public Policy Rutgers University 33 Livingston Avenue, Room
FACTS AND FIGURES: MAKING THE CASE FOR COMPLETE STREETS IN LEE COUNTY
 FACTS AND FIGURES: MAKING THE CASE FOR COMPLETE STREETS IN LEE COUNTY Safety: Close to 5,000 pedestrians and bicyclists die each year on U.S. roads, and more than 70,000 are injured. [Mean Streets, Surface
A Survey of Planning, Design, and Education for Bikeways and Bus Routes on Urban Streets
 A Survey of Planning, Design, and Education for Bikeways and Bus Routes on Urban Streets, Community & Economic Development Agency, Transportation Services Division (510) 238-3983 bikeped@oaklandnet.com
A Holistic Approach to Community Connectivity. 50 th International Making Cities Livable Conference Portland, OR June 2013
 A Holistic Approach to Community Connectivity 50 th International Making Cities Livable Conference Portland, OR June 2013 Founded 2008 About GP RED Research Education Advocacy Focus on Health, Recreation
Bicycle Friendly Streets
 Bicycle Friendly Streets 4.1 Guiding Principle and Objectives Bicycles are recognized as vehicles under the Highway Traffic Act, and as such, should be afforded the same consideration as motor vehicles
Using Public Policies to Promote Walking, Cycling, and Public Transport
 Using Public Policies to Promote Walking, Cycling, and Public Transport John Pucher, Rutgers University http://policy.rutgers.edu/faculty/pucher/ Worldwide Travel Trends Increasing daily travel distances
Planning for Cycling in Peterborough
 JUST, Vol. V, No. 1, 2017 Trent University Planning for Cycling in Peterborough Eric Andreas Post Abstract With a changing climate driven by an unsustainable lifestyle, cycling is becoming increasingly
Brunswick, New Jersey, USA. First Published: July 2008 PLEASE SCROLL DOWN FOR ARTICLE
 This article was downloaded by:[rutgers University] On: 23 June 2008 Access Details: [subscription number 788777707] Publisher: Taylor & Francis Informa Ltd Registered in England and Wales Registered Number:
ACTIVE TRANSPORTATION
 ACTIVE TRANSPORTATION Mobility 2040 Supported Goals Improve the availability of transportation options for people and goods. Support travel efficiency measures and system enhancements targeted at congestion
The Right to Come Home: Shared Space, Woonerfs, and Safe Streets for All Road Users. Johan Diepens, CEO Mobycon
 The Right to Come Home: Shared Space, Woonerfs, and Safe Streets for All Road Users Johan Diepens, CEO Mobycon info sports 2015-10-07 4 From a Dutch perspective 5 MOBILITY Mobility; a condition for functioning
CONNECTING PEOPLE TO PLACES
 CONNECTING PEOPLE TO PLACES 82 EAST BENCH MASTER PLAN 07 Introduction The East Bench transportation system is a collection of slow moving, treelined residential streets and major arteries that are the