Using Public Policies to Promote Walking, Cycling, and Public Transport
|
|
|
- Oscar Pitts
- 5 years ago
- Views:
Transcription


1 Using Public Policies to Promote Walking, Cycling, and Public Transport John Pucher, Rutgers University
2 Worldwide Travel Trends Increasing daily travel distances Increasing car ownership and use Increased public transport use, but falling mode share Less walking almost everywhere Low or falling cycling levels except in northern Europe
3 Growth in Passenger Car Ownership in Europe, (cars per 1,000 population) 600 Passenger cars per 1,000 population Austria Belgium Denmark Germany France Italy Netherlands Finland Sweden United Kingdom EU Source: European Commission, Energy and Transport in Figures, 2004
4 Cars and light trucks per 1000 population Cars and Light Trucks per 1,000 population in USA and Western Europe USA GER UK NL DK
5 Passenger Kilometers of Car and Light Truck Use per Inhabitant in Western Europe and North America, 2006 USA Canada Finland France Italy Norway UK Sweden Germany Belgium Denmark Netherla Austria Spain Ireland 11,891 11,833 11,715 11,444 11,359 10,721 10,541 10,456 9,950 9,061 8,698 7,791 6,652 14,697 24,636-4,000 1,000 6,000 11,000 16,000 21,000 26,000 Passenger Kilometers of Car and Light Truck Travel per Inhabitant
6 Percentage of Trips by Public Transport, Bicycle, and Walking in Selected OECD Countries Transit Bike Walk Australia (2006)* Canada (2001)* Ireland (2006)* Belgium (1999) France (1994) UK (2006) Norway (2001) Denmark (2003) Finland (2005) Germany (2002) Austria (2005) Sweden (2006) Finland (1999) Spain (2000)** Netherlands (2006) USA (2001) Percetage of Trips
7 Walking and Bicycling Shares of Urban Travel by Age Group in the USA, Germany and The Netherlands 60% 50% Bicycle Walking 11% 7% The Netherlands 40% Germany 25% 24% 30% 20% 10% 9% 39% 48% 30% 19% 22% 10% 0% USA 1.0% 0.5% 0.2% 0.3% 7% 5% 6% 4% 17% 23% 12% 13% 14% 19% 24% Age Source: Pucher and Dijkstra, Promoting Safe Walking and Cycling to Improve Public Health: Lessons from the Netherlands and Germany, American Journal of Public Health, September 2003, Vol. 93, No. 9, pp
8 Percentage of Short Trips Made by Walking and Cycling in Germany (2002) and the USA (2001) Germany Walk Bike USA 0-1 km 1-2 km 2-5 km 0-1 km 1-2 km 2-5 km Source: Ralph Buehler, "Travel Behavior in Germany and the USA"
9 Consequences of Car Dependence Increasing energy use and Greenhouse Gases Noise, air and water pollution Worsening traffic congestion Scarce urban land used for roads and parking Traffic fatalities and injuries Mobility problems for the poor, the elderly, children, and women Insufficient physical activity and rising obesity
10 Does auto-dependency make us fat? Obesity falls sharply with increased walking, cycling, and transit use! Percent of Obesity Percent Walk, Bike,Transit USA New Zealand Australia Canada Ireland France Finland Italy Spain Germany Sweden Austria Netherlands Switzerland Denmark Obesity Walk, Bike, Transit
11 If car-dependence is the problem, then we should improve alternatives to the car: PUBLIC TRANSPORT WALKING CYCLING
12 Walking and Cycling: the MOST sustainable transport modes MOST environmentally friendly: >Virtually no pollution at all >Almost no nonrenewable resources used MOST equitable: >Financially affordable by virtually everyone >Physically possible by all but the severely disabled MOST economical: >Minimal private and public costs >Although they take more time, they provide exercise that reduces medical costs and greatly extends our healthy life expectancy


13 Getting around Copenhagen on the perfect Zero Emissions Vehicle: the BIKE! Photo: Susan Handy
14 Public Policies Crucial to Transit, Walking, and Cycling Pro-car policies in European cities in 1950s and 1960s caused huge decline in walking and cycling Dramatic policy turn-around since 1970s to limit car use and promote cycling, walking, and public transport in Dutch, Danish, and German cities

15 Bridge in Freiburg BEFORE and AFTER reforms

16 Typical residential street in Freiburg BEFORE and AFTER traffic calming reforms

17 Cathedral Square in Freiburg BEFORE transport and urban planning reforms

18 Cathedral Square in Freiburg AFTER transport and urban planning reforms
19 German Cycling Boom Engineered by Explicit Shifts in Transport Policy in 1970s City Time Period Change in Bicycle Modal Split Share Percentage Increase in Bicycle Share Munich 1976 to % to 13% +117% Nuremberg 1976 to % to 9% +125% Cologne 1976 to % to 12% +100% Freiburg 1976 to % to 19% +58% Stuttgart 1976 to % to 6% +200% Bremen 1976 to % to 21% +31% Muenster 1976 to % to 35% +21% Average for all urban areas in Western Germany 1972 to % to 10% +25% Sources: Broeg and Erl, Mobilitaet und Verkehrsmittelwahl. Muenchen: Socialdata, 2003; Deutsches Institut fuer Wirtschaftswissenschaften, Mobilitaet in Deutschland, Berlin: Bundesministerium fuer Verkehr, 2004.
20 Overview of Coordinated Policies that Encourage Transit Use, Walking, and Cycling in Europe Expansion and modernization of public transport systems Continual improvement of pedestrian and cyclist facilities Full integration of walk, bike, transit modes Sharp restrictions on car use in central cities High cost of car ownership and use Land-use policies that discourage suburban sprawl
21 Expansion and Upgrading of Public Transport Systems More metro and light rail service Upgrading of bus services, including some BRT Modernization of transit vehicles and stations Reserved bus/tram lanes and signal priority Coordination of all transit services through a unified regional transit agency (Verkehrsverbund) Attractive monthly and annual passes Expanded bike-and-ride and park-and-ride facilities
 Fully integrate all transit services, all modes, all fares, schedules, routes in entire")
22 Complete Coordination and Integration of Public Transport in Germany Verkehrsverbünde (regional transit authorities) Allocate operating assistance over operators (public and private) Fully integrate all transit services, all modes, all fares, schedules, routes in entire region

23 Quick and easy transfer between suburban rail, longdistance rail, and light rail transit modes in Germany
 immediately adjacent to main train station and bus")
24 Bike and Ride Radstation: Bike parking facility in Muenster, Germany (3,500 bikes) immediately adjacent to main train station and bus terminal
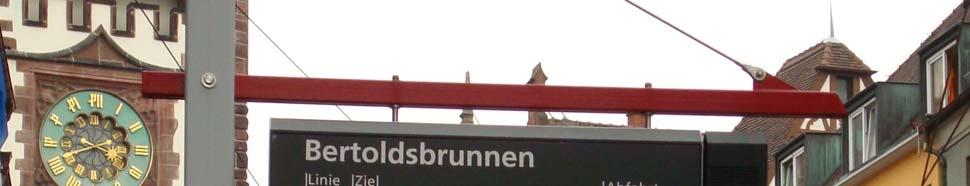
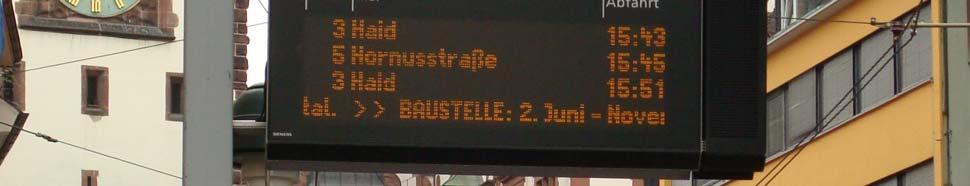
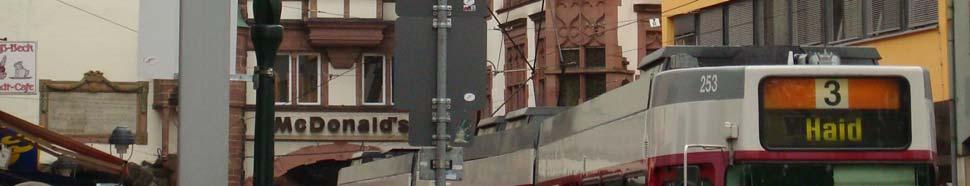
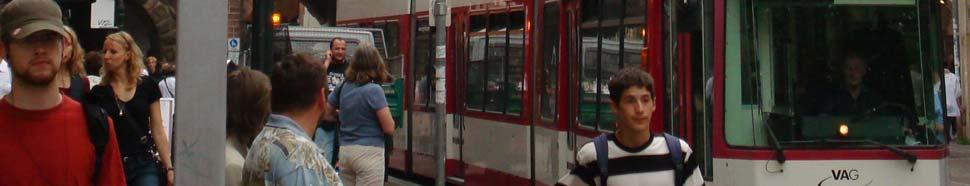
25 Real Time Information at Light Rail Stops in Freiburg
26 Continual Improvement of Pedestrian and Bicyclist Facilities Traffic-calmed residential neighborhoods Massive increase in bikeways, bike lanes, intersection modifications for cyclists, priority signals Extensive car-free zones, speed reductions, and other restrictions on thru motor vehicle traffic Improvements in crosswalks, lighting, sidewalks, signals Vast increase in bike parking, including parking garages, especially at transit stations Extensive cycling education and training in all primary schools Full integration of walk/bike facilities with bus and rail transit stops and bike transport on transit vehicles


27 Most European cities have extensive carfree districts ideal for walking and cycling

28 Lively, safe, pleasant car-free zone in central Copenhagen

29 Typical intersection in Copenhagen, with separate crossings for pedestrians and cyclists

30 Bike-walk Promenade in Muenster, Germany Note exclusive cycle path in middle and completely Note separate exclusive pedestrian cycle path walkways in middle on both and sides completely separate pedestrian walkways on both sides This 6 km beltway encircles central city and connects 16 major bike paths radiating outward toward the suburbs and 26 bike paths and lanes leading to Cathedral Square.

31 GIVE EMPLOYEES FREE BIKES INSTEAD OF FREE PARKING! The perfect zero emissions vehicles! Troels Andersen, Cycling in Odense, Denmark
32 Sharp Restrictions and High Taxes on Auto Use, Ownership, Licensing High taxes on petrol and new car purchases Expensive and limited car parking High cost and difficulty of obtaining driver s license Slowdowns in roadway expansion and exclusion of limitedaccess motorways from city centers Tempo 30km/hr (or 7km/hr) in residential neighborhoods Turn restrictions, artificial dead-ends, thru traffic restrictions for cars and trucks Strict enforcement of traffic regulations favoring pedestrians and cyclists, with motorists usually assumed guilty of any crash, especially with elderly or children

33 Why Traffic Calming Saves Lives Speed Speed kills! kills! Source: World Health Organization (2008) and OECD Transport Research Centre (2006)


34 Many residential neighborhoods in German, Dutch, and Danish cities are traffic calmed Reduced car speeds increase traffic safety and encourage walking and cycling
35 Taxes on New Car Purchases in Europe and the USA (percent tax on purchase price in 2005, average car) Denmark Finland Portugal Greece Ireland Netherlands Sweden Austria Spain Belgium France Italy United Kingdom Germany Luxembourg USA Source: European Commission, Energy and Transport in Figures, 2006 Percent tax on purchase price
36 Premium Unleaded Gasoline Prices and Share of Taxes in Selected OECD Countries in 2007 (U.S. $ per Liter) Norway Netherlands United Kingdom Belgium Germany Finland Italy Denmark France Sweden Austria Switzerland Canada United States Gasoline Price w/o tax Tax $0.00 $0.50 $1.00 $1.50 $2.00 Source: OECD: Energy Prices and Taxes 4th Quarter 2007.
37 Trends in Gasoline Prices in 7 OECD Countries (in US dollars), US dollars per gallon Year Belgium France Germany Italy Netherlands UK US
38 Land-Use Policies that Discourage Suburban Sprawl Strict land use zoning to preserve open space, agricultural areas, forests in immediate proximity to cities Explicit federal, state, regional, and local land use plans that ensure mixed-use, compact development and coordination of land use with transportation Tax preferences for land used for agriculture, open space, nature preserves, in addition to strict prohibitions on commercial and residential use of such land Higher price of legally developable land forces higher development densities in metropolitan areas

39 Land Use Planning in Germany Top-down, bottom-up coordination of land use planning among all four levels of government in Germany Coordination of land use, transportation, and environment at each level Federal State Regional Local top >>> down bottom >>> up Source: German Federal Office of Construction and Land Use Planning, 2000
40 Keys to Success in Europe: 1) Improving all forms of public transport, fully integrating and coordinating them with each other, and offering attractive fares 2) Improving cycling and walking conditions and integrating them with public transport services, so that these three modes together can provide a feasible alternative to the car 3) Making car use as resistible as possible by imposing high taxes, fees, and other user charges, restricting car use, limiting parking, and making it both difficult and expensive to get a license 4) Strict land-use policies to keep metropolitan areas compact and trip distances short so that public transport, walking, and cycling remain feasible ways to get around

41 For any questions or further information, please contact: Prof. John Pucher Bloustein School of Planning and Public Policy Rutgers University 33 Livingston Avenue, Room 363 New Brunswick, New Jersey Webpage:
42 Suggested readings and additional slides on travel trends and problems in Asia, Europe, and North America For details, please consult these overview articles: Pucher et al, Urban Transport Trends and Policies in China and India, Transport Reviews, July Pucher and Buehler, Making Cycling Irresistible: Lessons from the Netherlands, Denmark, and Germany, Transport Reviews, July Pucher, Urban Transport in Germany: How to Provide Feasible Alternatives to Auto Use, Transport Reviews, July Additional slides follow
43 Passenger Cars per 1,000 People in China and India, ( ) Cars per 1,000 people China India Source: National Bureau of Statistics of China, Year Book of China 2008; Indian Ministry of Road Transport and Highways (2008)
44 Per Capita Income Trends in China and 6000 India ( ) 5000 China India Source: Organization for Economic Cooperation and Development (OECD) Note: Per Capita Incomes for both China and India are expressed here in constant, inflation-adjusted 1996 US dollars, using purchasing power parity for currency conversion
45 Motorcycles per 1,000 People in China & India ( ) Motorcycles per 1000 people China India Y Source: National Bureau of Statistics of China, Year Book of China 2008; Indian Ministry of Road Transport and Highways (2008)
46 Car Ownership and Economic Growth: Is China just following the trend? Source: Lee Schipper and Embarq, World Resources Institute (2008)
47 Motor Vehicle Ownership by Selected Region Million Vehicles United States OECD Europe Japan Canada South Korea Russia China India Brazil Source: EIA, IEO2008

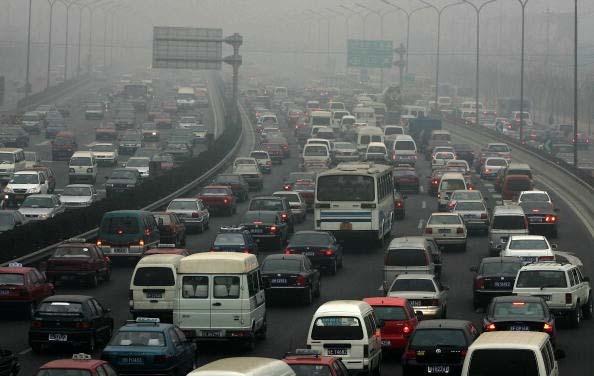
48 Roadway congestion and air pollution are increasingly serious problems in large Chinese cities (Beijing shown here)

49 Peak hour traffic congestion in Delhi
50 Percent Distribution of Urban Trips by Means of Travel for Selected Chinese Cities, % 80% Walk 60% 40% 20% Non-motorized Vehicles Private motorized Public Transport 0% Beijing (14.81M) Shanghai (18.41M) Tianjin (10.11M) Shi Jiazhuang (9.17M) Hangzhou (6.43M) Nanjing (5.72M)
51 100% 80% 60% 40% 20% 0% Percent Distribution of Urban Trips by Means of Travel for Selected Indian Cities, 2002 Walk Non-motorized Vehicles Private motorized Public Transport Mumbai (16.3M) Kolkata (13.2M) Delhi (12.79M) Chennai (6.4M) Bangalore (5.68M) Hyderabad (5.53M) Ahmedabad (4.51M) Pune (3.755M) Kanpur (2.69M) Lucknow (2.26M)
52 Growth of India's Motor Vehicle Fleet by Type of Vehicle ( ) No. of Vehicles (in millions) Tw o-w heelers Cars, Jeeps and Taxis Other Motorized Goods Vehicles Buses
53 Growth of China's Motor Vehicle Fleet by Type of Vehicle ( ) No. of Vehicles (in m illions) Tw o w heelers Cars, Jeeps and Taxis Other Motorized Goods Vehicles Buses
54 Traffic Fatalities in India and China ( ) India China Traffic Fatalities (in thousands)
55 Air Pollution in Chinese and Indian Cities Particulate M atter (PM 10) Sulphur Oxides (SOx) Nitrogen Oxides (NOx) Beijing (14.81M) Shanghai (13.41M) Chengdu (10.44M) Tianjin (10.11M) Shi Jiazhuang (9.17M) Wuhan (7.68M) Xian (7.41M) Guangzhou (7.25M) Shenyang (7.2M) Hangzhou (6.43M) Nanjing (5.72M) Chongqing (3.1M) Mumbai (16.3M) Kolkata (13.21M) Delhi (12.79M) Chennai (6.42M) Bangalore (5.68M) Chinese Cities (2003) Indian Cities (2000) Pollution concentration in micrograms per cubic meter
56
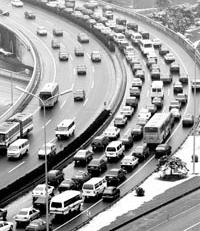
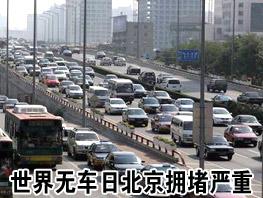
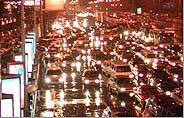
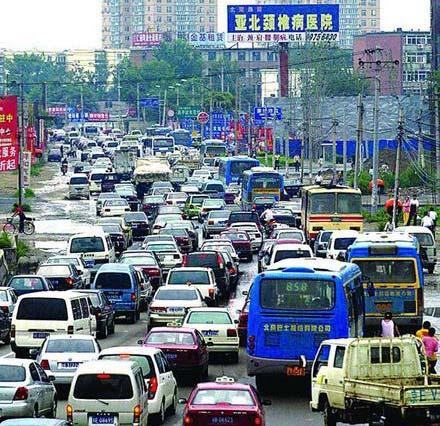
57 Traffic Congestion in Beijing

58 Severe roadway congestion in large Indian cities Traffic levels exceed road capacity Rapid growth in motorized vehicles Very mixed traffic on roads Improvements in infrastructure have not kept up with sharply rising demand


59 Rickshaw operation: uncontrolled & poor Road space: minimum for bus Reduce bus speed and increase cost Congestion in Dhaka, Bangladesh


60 Congestion worsened by mixing of motorized and nonmotorized modes
Using Public Policies to Promote Walking, Cycling, and Public Transport
 Using Public Policies to Promote Walking, Cycling, and Public Transport John Pucher, Rutgers University http://policy.rutgers.edu/faculty/pucher/ Worldwide Travel Trends Increasing daily travel distances
Travel Behavior, Transport Policy, and Sustainable Transport in Germany and the USA
 Travel Behavior, Transport Policy, and Sustainable Transport in Germany and the USA Similarities between Germany and the USA Federal system of government, tradition of local self-government Strong economy,
Walking and Cycling for Healthy Cities
 Walking and Cycling for Healthy Cities Prof. John Pucher, Rutgers University http://policy.rutgers.edu/faculty/pucher Walking and Bicycling: the MOST sustainable transport modes MOST environmentally friendly:
SUSTAINABILITY, TRANSPORT, & HEALTH. Ralph Buehler, Virginia Tech
 SUSTAINABILITY, TRANSPORT, & HEALTH Ralph Buehler, Virginia Tech Prepared for National Academies Roundtable on Science and Technology for Sustainability 6 December 2013 Overview Trends in Motorization
Walking and Cycling for ALL New Jerseyans
 Walking and Cycling for ALL New Jerseyans Prof. John Pucher, Rutgers University http://policy.rutgers.edu/faculty/pucher Walking and Bicycling: the MOST sustainable transport modes MOST environmentally
Canada. UK France. Walk, Bike, Transit Share of Trips
 1950s 1960s Today Relationship between Share of Urban Trips by Transit, Bicycle, and Foot and Per Capita Annual CO 2 Emissions from Road and Rail Transport in Australia, Canada, the USA and EU Countries,
Cycling for Everyone:
 Cycling for Everyone: The Key to Public and Political Support John Pucher Rutgers University (http://policy.rutgers.edu/faculty/pucher.html) Reasons for everyone to support cycling: More daily physical
Win-Win Transportation Solutions
 Win-Win Transportation Solutions Todd Litman Victoria Transport Policy Institute Presented Lipinski Symposium on Transportation Policy Chicago, Illinois 15 October 2007 What is The Transportation Problem?
International Journal of Research (IJR) Vol-1, Issue-8, September *
 Vol-1, Issue-8, September *") Development towards Sustainable Transportation Planning in India through Management of Non-motorized Transport Akshay Patil 1 * & 2 * 1 3 rd year B. Tech Planning student at College of Engineering Pune,
Development towards Sustainable Transportation Planning in India through Management of Non-motorized Transport Akshay Patil 1 * & 2 * 1 3 rd year B. Tech Planning student at College of Engineering Pune,
Safety in numbers What comes first safety or numbers? Jan Garrard School of Health and Social Development Deakin University
 Safety in numbers What comes first safety or numbers? Jan Garrard School of Health and Social Development Deakin University The safety in numbers theory As the number of cyclists increases, injury rates
Complete Streets 101: The Basics
 Complete Streets 101: The Basics Michigan Municipal League - Capital Conference March 21, 2017 Chip Smith, AICP - Senior Planner - Wade Trim Inc. and City Council member City of Ann Arbor 2017 MML Capital
How To Encourage More Efficient Transportation in Brazilian Cities
 How To Encourage More Efficient Transportation in Brazilian Cities Todd Litman Victoria Transport Policy Institute Presented Seminar on Discouraging The Use Of Cars São Paulo, Brazil 3 September 2013 Creating
AREA TOTALS OECD Composite Leading Indicators. OECD Total. OECD + Major 6 Non Member Countries. Major Five Asia. Major Seven.
 Reference series Composite leading indicators OECD Composite Leading Indicators AREA TOTALS 7-03- 19 OECD Total 19 OECD + Major 6 Non Member Countries 19 Major Seven 19 Major Five Asia 19 Euro area 19
Lessons from Copenhagen. John L Bowman 2013
 Lessons from Copenhagen John L Bowman 2013 Bicycle Strategy Official municipal policy Goals for the next 15 years Updated after 5-10 years 32 page glossy brochure BAC December 2, 2013 John L Bowman 2 Bicycle
PLANNING FOR SUSTAINABLE PEDESTRIAN INFRASTRUCTURE NALIN SINHA INITIATIVE FOR TRANSPORTATION & DEVELOPMENT PROG. (ITD), DELHI
, DELHI") PLANNING FOR SUSTAINABLE PEDESTRIAN INFRASTRUCTURE NALIN SINHA INITIATIVE FOR TRANSPORTATION & DEVELOPMENT PROG. (ITD), DELHI India s Road Network 5 million kms: Total road length 2.6 mn kms: Surfaced
PLANNING FOR SUSTAINABLE PEDESTRIAN INFRASTRUCTURE NALIN SINHA INITIATIVE FOR TRANSPORTATION & DEVELOPMENT PROG. (ITD), DELHI India s Road Network 5 million kms: Total road length 2.6 mn kms: Surfaced
Capacity of transport infrastructure networks
 Most infrastructure extension work is concentrated on roads. The total length of the motorway network has increased dramatically during the past two decades (about 3 % per year). Construction of the high-speed
Streets for Everyone: Lessons from Cities across the Globe
 Streets for Everyone: Lessons from Cities across the Globe John Pucher, Rutgers University Photo: Susan Handy Complete Streets Forum, Toronto, Canada, Oct 6, 2014 Photo: Ralph Buehler Complete Streets
Promoting Walking and Cycling in Los Angeles: Lessons from Europe and North America
 Promoting Walking and Cycling in Los Angeles: Lessons from Europe and North America John Pucher, Rutgers University, and Ralph Buehler, Virginia Tech Walking and Cycling: the MOST sustainable transport
Canada s Capital Region Delegation to the Velo-City Global 2010 Conference
 Canada s Capital Region Delegation to the Velo-City Global 2010 Conference Report of Findings from Visits, Meetings & Presentations In Amsterdam-Den Haag, Utrecht, Berlin & Copenhagen The Itinerary Copenhagen
Concept of Sustainable Transport and integrated Land Use Planning- An Overview. Manfred Breithaupt GIZ Water, Energy, Transport
 Concept of Sustainable Transport and integrated Land Use Planning- An Overview Manfred Breithaupt GIZ Water, Energy, Transport The adverse impacts of growth in motorization - in economic, environmental
Promoting Safe Walking and Cycling: Lessons from Europe and North America. John Pucher, Rutgers University, and Ralph Buehler, Virginia Tech
 Promoting Safe Walking and Cycling: Lessons from Europe and North America John Pucher, Rutgers University, and Ralph Buehler, Virginia Tech Walking and Cycling: the MOST sustainable transport modes MOST
Forhealth health, forfun, for transportation. Prof. John Pucher, Rutgers University
 BIKING FOR ALL TEXANS Forhealth health, forfun, for transportation Prof. John Pucher, Rutgers University Walking and Bicycling: the MOST sustainable ti transport tmodes MOST environmentally friendly: >Virtually
Country fact sheet South Korea
 ESRA results Country fact sheet South Korea The ESRA project is a joint initiative of research institutes in 25 countries aiming at collecting comparable national data on road users opinions, attitudes
Konstantin Glukhenkiy Economic Affairs Officer
 Konstantin Glukhenkiy Economic Affairs Officer Rapid growth of urban areas Very rapid increase in motorisation Substantial increases in traffic congestion Relative decline of public transport usage and
Brunswick, New Jersey, USA. First Published: July 2008 PLEASE SCROLL DOWN FOR ARTICLE
 This article was downloaded by:[rutgers University] On: 23 June 2008 Access Details: [subscription number 788777707] Publisher: Taylor & Francis Informa Ltd Registered in England and Wales Registered Number:
ThinkBike Workshop. Los Angeles September 22-23, 2011
 September 22-23, 2011 The Experts Cor van der Klaauw Groningen Province Richard ter Avest Goudappel Coffeng Consultancy The Experts Tonny Bosch Goudappel Coffeng Consultancy Hillie Talens CROW Cycling
Public Transport as a Necessity for Active Transport
 03.05.2017 Seite 1 Public Transport as a Necessity for Active Transport Manfred Breithaupt Urban Transport Consultant to GIZ Active Transport requires an attractive Public Transport System and its Integration
BIKE TRANSIT INTEGRATION IN NORTH AMERICA. John Pucher & Ralph Buehler
 BIKE TRANSIT INTEGRATION IN NORTH AMERICA John Pucher & Ralph Buehler Synergies: Bicycling and Public Transport: Perfect Together? Cycling extends catchment areas of transit stops far beyond walking range
Child- and Youth-friendly Land-use and Transport Planning Guidelines
 Child- and Youth-friendly Land-use and Transport Planning Guidelines Richard Gilbert Centre for Sustainable Transportation (In April 2006, the Centre moved from Toronto, Canada, to the University of Winnipeg)
Promoting Sustainable Urban Transport: Lessons from Germany Ralph Buehler and John Pucher
 Promoting Sustainable Urban Transport: Lessons from Germany Ralph Buehler and John Pucher Presented at: "Lessons from Europe Jean Monnet Research Workshop Rutgers Center for European Studies, September
About the Active Transportation Alliance
 About the Active Transportation Alliance Chicagoland s voice for better biking, walking and transit Founded 1985 7,000 members, ~33 full time staff Serve Chicago metro region 1 More Cars, More Driving
Making Cycling Irresistible: Lessons from the Netherlands, Denmark, and Germany
 Making Cycling Irresistible: Lessons from the Netherlands, Denmark, and Germany John Pucher and Ralph Buehler Bloustein School of Planning and Public Policy Rutgers University 33 Livingston Avenue, Room
The modes of government guidance for public bicycle operation and state-owned company operation: a case study of Hangzhou city in China
 Urban Transport XX 247 The modes of government guidance for public bicycle operation and state-owned company operation: a case study of Hangzhou city in China Q. Li Institute of Traffic Management, Department
VILNIUS SUMP. Gintarė Krušinskaitė International project manager place your logo here
 VILNIUS SUMP Gintarė Krušinskaitė International project manager Gintare.krusinskaite@vilniustransport.lt place your logo here 19 April, 2017 WHERE DID WE CAME FROM? Mobility management and mobility planning
How to Increase Cycling for Daily Travel: Lessons from Cities across the Globe
 How to Increase Cycling for Daily Travel: Lessons from Cities across the Globe Joint Webinar for the Institute of Transportation Engineers and the Active Living Research Program of the Robert Wood Johnson
OECD employment rate increases to 68.4% in the third quarter of 2018
 Paris, 17th January 2019 News Release: 3rd Quarter 2018 OECD employment rate increases to 68.4% in the third quarter of 2018 The OECD area employment rate the share of the working-age population with jobs
Infrastructure and Programs. What does the data say? Advancing Non-motorized Transportation in Vermont 11/15/09
 Advancing Non-motorized Transportation in Vermont A reply from the university point of view Lisa Aultman-Hall Professor and Director Figure 4 Why Canadians Cycle more than Americans: A Comparative Analysis
Cycling in the Netherlands The City and the region Utrecht
 Cycling in the Netherlands The City and the region Utrecht 8-5-2006 1 The ultimate European lesson? I think we need to make people aware that our traffic concepts of today are not sustainable and will
What future for mid-sized cities? Prof. Emer. Antony Stathopoulos National Technical University of Athens
 What future for mid-sized cities? Prof. Emer. Antony Stathopoulos National Technical University of Athens These cities can range in size from 50,000 to 250,000 in population. Street in Larnaca in 1878
The City. Population of BH. Population of RMBH. 2.4 million inhabitants. 5.7 million inhabitants. 6.3 million trips a day
 Implementing sustainable mobility solutions Rogério Carvalho Silva Architect President Adviser BHTRANS Belo Horizonte, Brazil The City Population of BH 2.4 million inhabitants Population of RMBH 5.7 million
SOCIALLY AND ENVIRONMENTALLY SUSTAINABLE URBAN TRANSPORT
 SOCIALLY AND ENVIRONMENTALLY SUSTAINABLE URBAN 1 Not only for clean air, but for basic human rights, those without cars must also be able to move without fear of being killed. 2 Bogotá is far from being
The Herzliya Indices. National Security Balance The Civilian Quantitative Dimension. Herzliya Conference Prof. Rafi Melnick, IDC Herzliya
 The Herzliya Indices National Security Balance The Civilian Quantitative Dimension Herzliya Conference 2015 Prof. Rafi Melnick, IDC Herzliya 1990 1991 1992 1993 1994 1995 1996 1997 1998 1999 2000 2001
A Holistic Approach to Community Connectivity. 50 th International Making Cities Livable Conference Portland, OR June 2013
 A Holistic Approach to Community Connectivity 50 th International Making Cities Livable Conference Portland, OR June 2013 Founded 2008 About GP RED Research Education Advocacy Focus on Health, Recreation
Parallel Workshop: Avoid
 Parallel Workshop: Avoid Vitoria-Gasteiz The commitment of a city towards active and sustainable mobility. Juan Carlos Escudero Environmental Studies Centre Vitoria-Gasteiz City Council A compact, diverse
outline 1. why cycle? 2. (safety health) 3. safe system 4. what next
 3. safe system 4. what next") outline 1. why cycle? 2. (safety health) 3. safe system 4. what next In a city of many cyclists, why do they ride? Copenhageners reasons for cycling to and from work (multiple answers) 56% it s faster
outline 1. why cycle? 2. (safety health) 3. safe system 4. what next In a city of many cyclists, why do they ride? Copenhageners reasons for cycling to and from work (multiple answers) 56% it s faster
Cities Connect. Cities Connect! How Urbanity Supports Social Inclusion
 Cities Connect! How Urbanity Supports Social Inclusion Todd Litman Victoria Transport Policy Institute Metropolis Toronto, Canada - 14 June 2006 Cities Connect People with people. People with jobs. People
2. Context. Existing framework. The context. The challenge. Transport Strategy
 Transport Strategy Providing quality connections Contents 1. Introduction 2. Context 3. Long-term direction 4. Three-year priorities 5. Strategy tree Wellington City Council July 2006 1. Introduction Wellington
Road Safety Vademecum
 Road Safety Vademecum Road safety trends, statistics and challenges in the EU 2010-2013 March, 2014 European Commission DG for Mobility and Transport Unit C.4 Road Safety Contents Summary of findings...
Green Mobility. Emani Kumar. Coordinator, ICLEI Asia & Executive Director, ICLEI South Asia.
 Green Mobility Emani Kumar Coordinator, ICLEI Asia & Executive Director, ICLEI South Asia What is our idea of Green Mobility? Green Mobility Promotes walking and cycling in cities Encourages modes not
2015 Victorian Road Trauma. Analysis of Fatalities and Serious Injuries. Updated 5 May Page 1 of 28. Commercial in Confidence
 2015 Victorian Road Trauma Analysis of Fatalities and Serious Injuries Updated 5 May 2016 Page 1 of 28 Commercial in Confidence VICROADS_n3445896_2015_Victorian_Trauma_Report_- _updated_may_2016.docx 2015
DEVELOPMENT AID AT A GLANCE
 DEVELOPMENT AID AT A GLANCE STATISTICS BY REGION 5. EUROPE 2018 edition All the data in this report are available at: http://www.oecd.org/dac/financing-sustainable-development/ 5.1. ODA TO EUROPE - SUMMARY
World Bank Urban Transport Strategy Review
 World Bank Urban Transport Strategy Review Yokohama 11-13 December 2000 V. Setty Pendakur President Pacific Policy and Planning Associates Vancouver, B.C., Canada V6Z 2Z3 Asian Context Dismal state of
Road Transport Problem Diagnosis
 Road Transport Problem Diagnosis + Atmospheric Pollution + Noise + Vibration Road Traffic Congestion + Road Traffic Injuries Life span Obesity Sleep BP School IIT Delhi 2007 FRIENDS & URBAN TRANSPORT Light
Urban Street Design and Development
 Urban Street Design and Development Ashok Bhattacharjee, Advisor, Clean Air and Sustainable Mobility, Centre for Science and Environment CSE Workshop on Safe Access and Parking - Lytton Hotel, Kolkata
Highway School, Ithaca NY
 Highway School, Ithaca NY June 1, 2009 Michael Ronkin Designing Streets for Pedestrians and Bicyclists 1 We know how to build right 6 Yet many roads are built like this 7 What is a Complete Street?
Space for Cycling. Delivering healthy streets. Roger Geffen Policy Director, Cycling UK
 Space for Cycling Delivering healthy streets Roger Geffen Policy Director, Cycling UK About Cycling UK 65,000 members, founded 1878 Cycling activities, membership services (legal, insurance, magazine)
Measuring Transportation: Traffic, Mobility and Accessibility
 Measuring Transportation: Traffic, Mobility and Accessibility THIS FEATURE COMPARES THREE APPROACHES TO MEASURING TRANSPORTATION SYSTEM PERFORMANCE. TRAFFIC-BASED MEASUREMENTS EVALUATE MOTOR VEHICLE MOVEMENT;
Global Construction Outlook: Laura Hanlon Product Manager, Global Construction Outlook May 21, 2009
 Global Construction Outlook: Short-term term Pain, Long-term Gain Laura Hanlon Product Manager, Global Construction Outlook May 21, 2009 What This Means for You The world is set to be hit this year with
Active and Green: Healthy Communities Are Sustainable Communities
 Active and Green: Healthy Communities Are Sustainable Communities James Sallis, PhD San Diego State University www.drjamessallis.sdsu.edu For LISC Webinar May 4, 2011 Goals of talk Physical inactivity
Appendix T 1: Additional Supporting Data
 Appendix T 1: Additional Supporting Data Project Delivery Delays with the implementation of the 2000 TIP became apparent early in the decade. In response to direction among policy officials, ARC began
 Children (Aged
 TPO Chattanooga-Hamilton County/North Georgia. The Road Less Traveled. Non-traditional Health Impact Analyses in Transportation Planning
 TPO Chattanooga-Hamilton County/North Georgia The Road Less Traveled Non-traditional Health Impact Analyses in Transportation Planning Chattanooga TPO 443,000 people 2,110 lane miles 19 Jurisdictions $7.3M/year
We believe the following comments and suggestions can help the department meet those goals.
 The Honorable Secretary Anthony Foxx The Secretary of Transportation United States Department of Transportation 1200 New Jersey Avenue, SE Washington, DC 20590 August 30, 2013 Dear Secretary Foxx, Thank
Economics of Highway Spending and Traffic Congestion. Todd Litman Victoria Transport Policy Institute Presented Strong Towns Webinar 3 February 2016
 Economics of Highway Spending and Traffic Congestion Todd Litman Victoria Transport Policy Institute Presented Strong Towns Webinar 3 February 2016 Motor Vehicle Travel is Peaking Annual Vehicle Mileage
Facility preferences & safety
 Photo Flickr: Boegh Facility preferences & safety Evidence from two studies Kay Teschke School of Population & Public Health University of British Columbia Canadians don t cycle much % of trips by bike
Safety and Active Transport. Dr. Maureen Carew, Medical Officer of Health Renfrew County and District Health Unit May 30, 2014
 Safety and Active Transport Dr. Maureen Carew, Medical Officer of Health Renfrew County and District Health Unit May 30, 2014 Active Transport Vision Increase levels of walking and cycling Reduce vehicle
URBAN TRANSPORT FOR DEVELOPMENT Slobodan Mitric World Bank. CODATU XIII, November 2008 Ho Chi Minh City, Vietnam
 URBAN TRANSPORT FOR DEVELOPMENT Slobodan Mitric World Bank CODATU XIII, November 2008 Ho Chi Minh City, Vietnam Sources of the presentation A Framework for Urban Transport Projects Operational Guidance
Integrated Corridor Approach to Urban Transport. O.P. Agarwal World Bank Presentation at CODATU XV Addis Ababa, 25 th October 2012
 Integrated Corridor Approach to Urban Transport O.P. Agarwal World Bank Presentation at CODATU XV Addis Ababa, 25 th October 2012 What is the Integrated Corridor Approach for Urban Transport Public? Why
Helsinki. Explaining Active Transportation Success in a City with Winter. Karl Saidla, Ph.D. Candidate, University of Ottawa, Human Kinetics
 Helsinki Explaining Active Transportation Success in a City with Winter Karl Saidla, Ph.D. Candidate, University of Ottawa, Human Kinetics Thanks! University of Ottawa Finland Futures Research Centre-University
Towards a Sustainable Transport Network in the West Region. Padraic O Donoghue
 Towards a Sustainable Transport Network in the West Region Padraic O Donoghue Professor of Civil Engineer NUI Galway Engineers Ireland West Region March 3, 2015 Outline One Planet Living Engineering the
What s Health Got to Do With It? Health and Land Use Planning
 What s Health Got to Do With It? Health and Land Use Planning CANDACE RUTT, PH.D. EXECUTIVE DIRECTOR APRIL 13 TH, 2016 Planning and Public Health Planning + Public Health Healthy Communities Healthier
El Paso County 2040 Major Transportation Corridors Plan
 El Paso County 2040 Major Transportation Corridors Plan Connect-our-County Online Transportation User Survey Preliminary Results June 24, 2010 Years of Residence 2. How many years have you LIVED HERE?
NEW COMMERCIAL VEHICLE REGISTRATIONS EUROPEAN UNION 1. July and August 2017
 PRESS EMBARGO: NEW COMMERCIAL VEHICLE REGISTRATIONS EUROPEAN UNION 1 July and August 2017 Next press release: Tuesday 24 October 2017 1 Data for Malta unavailable Page 1 of 12 Commercial vehicle registrations:
Rutgers. October Designing Streets for People LLC
 Rutgers Voorhees Transportation Center October 22 2010 Michael Ronkin Designing Streets for People LLC 1 2 3 4 5 We know how to build right 6 Yet many roads are built like this Recently completed IL 64
Oil Crises and Climate Challenges 30 Years of Energy Use in IEA Countries
 Crises and 30 Years of Energy Use in IEA Countries Fridtjof Unander, International Energy Agency ISED Meeting, UN, 13 September 2004 Aim of the Study Review of trends in energy use and CO 2 emissions since
INTEGRATED MULTI-MODAL TRANSPORTATION IN INDIA
 INTEGRATED MULTI-MODAL TRANSPORTATION IN INDIA Tejas Rawal (Corresponding Author) Ph.D. Research Scholar, Dept. of Architecture & Planning, Indian Institute of Technology-Roorkee, Roorkee-247 667 Email:
Development, transport and traffic management in Copenhagen
 Development, transport and traffic management in Copenhagen / Mikkel Balskilde Hansen, Head of Traffic Unit The Technical and Environmental Administration 2. October 2017 Copenhagen facts INHABITANTS Municipality
CPC Parking Lot Riverside Drive. Transportation Rationale
 CPC Parking Lot Transportation Rationale Prepared By: NOVATECH Suite 200, 240 Michael Cowpland Drive Ottawa, Ontario K2M 1P6 September 2015 Novatech File: 114093 Ref: R-2015-153 Table of Contents 1.0 INTRODUCTION...
DEVELOPMENT AID AT A GLANCE
 DEVELOPMENT AID AT A GLANCE STATISTICS BY REGION 6. OCEANIA 2018 edition All the data in this report are available at: http://www.oecd.org/dac/financing-sustainable-development/ 6.1. ODA TO OCEANIA - SUMMARY
Solana Beach Comprehensive Active Transportation Strategy (CATS)
") Solana Beach Comprehensive Active Transportation Strategy (CATS) 3.0 Goals & Policies The Solana Beach CATS goals and objectives outlined below were largely drawn from the Solana Beach Circulation Element
Solana Beach Comprehensive Active Transportation Strategy (CATS) 3.0 Goals & Policies The Solana Beach CATS goals and objectives outlined below were largely drawn from the Solana Beach Circulation Element
FACTS AND FIGURES: MAKING THE CASE FOR COMPLETE STREETS IN LEE COUNTY
 FACTS AND FIGURES: MAKING THE CASE FOR COMPLETE STREETS IN LEE COUNTY Safety: Close to 5,000 pedestrians and bicyclists die each year on U.S. roads, and more than 70,000 are injured. [Mean Streets, Surface
TRANSPORTATION ENGINEERING AND PLANNING Vol. I - Safety of Transportation - Benekohal R.F.
 SAFETY OF TRANSPORTATION Benekohal R.F. University of Illinois at Urbana-Champaign,USA Keywords: transportation safety, traffic safety, highway accidents, road fatality and injury, roadway crashes, driver
The Nine Challenges for the Development of Transport in the Fast Growing Capital of Vietnam: Hanoi.
 The Nine Challenges for the Development of Transport in the Fast Growing Capital of Vietnam: Hanoi. Challenge 1:Economic growth Higher Incomes. More people can afford cars and motorbikes. In good old times
Traffic Safety Basic Facts 2008
 In 2006 1, more than 4.700 seniors died in road traffic accidents in 14 European countries. Fatalities of elderly people in road traffic accidents reduced by over 3 between 1997 and 2006. Traffic Safety
NM-POLICY 1: Improve service levels, participation, and options for non-motorized transportation modes throughout the County.
 Transportation PRINCE WILLIAM COUNTY 2008 COMPREHENSIVE PLAN NON-MOTORIZED PLAN CONTENTS Goals, Policies, and Action Strategies Table 4 (Bike Facility Classifications and Descriptions) Table 5 (Bike Facility
FACTSHEET on Bike sharing and public bicycle system
 FACTSHEET on Bike sharing and public bicycle system This paper was prepared by: SOLUTIONS project This project was funded by the Seventh Framework Programme (FP7) of the European Commission www.uemi.net
Public Transport and Development: Making It Work
 Public Transport and Development: Making It Work Robert T. Dunphy Urban Land Institute World Bank Transport Forum 2006 March 28, 2006 Transportation Development Disconnect Now Few Then places w/o car Many
Traffic Safety Basic Facts 2010
 Overall frequencies On ROU areas frequencies Roads During the last decade, more than 174000 people died in accidents on roads (54% of all road traffic fatalities). More than 174.000 people were killed
RISI EUROPEAN CONFERENCE. (Barcelona, 6 March 2018) The European Economy Things look good just now. Can this last?
 The European Economy Things look good just now. Can this last?") RISI EUROPEAN CONFERENCE (Barcelona, 6 March 2018) The European Economy Things look good just now. Can this last? Andrea Boltho Magdalen College University of Oxford and Oxford Economics CONCLUSIONS OF
RISI EUROPEAN CONFERENCE (Barcelona, 6 March 2018) The European Economy Things look good just now. Can this last? Andrea Boltho Magdalen College University of Oxford and Oxford Economics CONCLUSIONS OF
TABLE 1: NET OFFICIAL DEVELOPMENT ASSISTANCE FROM DAC AND OTHER DONORS IN 2012 Preliminary data for 2012
 TABLE 1: NET OFFICIAL DEVELOPMENT ASSISTANCE FROM DAC AND OTHER DONORS IN 2012 DAC countries: 2012 2011 2012 ODA ODA/GNI ODA ODA/GNI ODA Percent change USD million % USD million % USD million (1) 2011
Physical Implications of Complete Streets Policies
 Presentation Overview Physical Implications of Complete Norm Cox, ASLA, LLA Landscape Architect Ann Arbor, Michigan, 10:45 to Noon What Are Complete Streets? What Matters to Bicyclists and Pedestrians
REGIONAL BICYCLE AND PEDESTRIAN DESIGN GUIDELINES
 REGIONAL BICYCLE AND PEDESTRIAN DESIGN GUIDELINES November 16, 2011 Deb Humphreys North Central Texas Council of Governments Bicycle and Pedestrian Advisory Committee Snapshot of the Guide 1. Introduction
OVERVIEW OF CIRCULATION
 OVERVIEW OF 1.Beijing Circulation 2. Development of Haidian District 3. Future Development 4. Project Site Overview 5. Road Types 6. Rail Corridor 7. Findings 8. Recommendations 1 of 22 BEIJING 2 of 22
Planning Cities for People. A Guide to Prosperous, Low-Carbon Urbanization
 Planning Cities for People A Guide to Prosperous, Low-Carbon Urbanization The world s next generation of cities will need to overcome extreme challenges posed by population growth, congestion, and energy
Urban Mobility. IRF New Delhi October 3, Patrick Lepercq GRSP, Chairman Michelin, Corporate VP Public Affairs
 Urban Mobility The Road Safety Challenges IRF New Delhi October 3, 2008 Patrick Lepercq GRSP, Chairman Michelin, Corporate VP Public Affairs FACTS!! 1.2 M deaths 20-50 M injuries 85% in LMICs Most are
Relation between traffic safety and environmental protection
 Session II EEF.DEL/32/11 8 April 2011 ENGLISH only 19TH OSCE ECONOMIC AND ENVIRONMENTAL FORUM Promotion of common actions and co-operation in the OSCE area in the fields of development of sustainable energy
Policy and Strategy for Sustainable Urban Transport in Vietnam
 International Seminar on Sustainable Urban Transport & Land Use Planning Policy and Strategy for Sustainable Urban Transport in Vietnam 23-26 September 2005 Mr. Tran Minh Phuong, MOT, Vietnam Dr. IWATA
Chapter 7. Transportation. Transportation Road Network Plan Transit Cyclists Pedestrians Multi-Use and Equestrian Trails
 Chapter 7 Transportation Transportation Road Network Plan Transit Cyclists Pedestrians Multi-Use and Equestrian Trails 7.1 TRANSPORTATION BACKGROUND The District of Maple Ridge faces a number of unique
Urban Pathways. FACTSHEET on Bike sharing and public bicycle system 2017
 Urban Pathways FACTSHEET on Bike sharing and public bicycle system 2017 This paper was prepared by: SOLUTIONS project This project was funded by the Seventh Framework Programme (FP7) of the European Commission
Traffic Congestion and Possible Solutions in Urban Transportation System
 Traffic Congestion and Possible Solutions in Urban Transportation System Ankush Kumar 1, Dr. R.R Singh 2 1 M. E Scholar, 2 Professor, Department of Civil Engineering, PEC University of Technology, Chandigarh,