Walking and Cycling for ALL New Jerseyans
|
|
|
- Briana Bridges
- 6 years ago
- Views:
Transcription


1 Walking and Cycling for ALL New Jerseyans Prof. John Pucher, Rutgers University
2 Walking and Bicycling: the MOST sustainable transport modes MOST environmentally friendly: >Virtually no pollution at all >Almost no nonrenewable resources used MOST equitable: >Financially affordable by virtually everyone >Physically possible by all but the severely disabled MOST economical: >Minimal private and public costs >Although they take more time, they provide exercise that reduces medical costs and greatly extends our healthy life expectancy
3 WALKING AND CYCLING ARE HEALTHY! GREAT source of physical activity: Both for daily travel and for recreation Cheaper, easier, and more dependable than formal exercise routines Can be integrated into daily lifestyle to achieve practical travel needs
4 Crucial importance of regular physical exercise: Obviously, the daily physical exercise of walking and cycling for practical travel helps burn up calories and helps avoid the problems of overweight and obesity Moreover: Whether normal-weight, overweight, or obese, physically inactive persons are 2 to 3 times more likely to die prematurely." Journal of Am. Med. Assoc. (1999)
5 Huge Health Benefits of Even Small Increases in Physical Activity Bouchard C. Physical activity and health: introduction to the dose-response symposium. Medicine and Science in Sports and Exercise 2001; 33: S

6
")
7 Worsening Obesity Epidemic among American Children and Adolescents, (% with body mass index of 30+)
8 Korea Japan Sw itzerland Italy France Austria Sw eden Netherlands Denmark Finland Germany Ireland Canada New Zealand Australia UK USA Obesity Rate by Country (Body Obesity Rate by Country (Body Mass Index 30) Mass Index 30) (percentage of adults)
9 Does car dependence make us fat? Obesity falls sharply with increased walking, cycling, and transit use! Percent of Obesity Percent Walk, Bike,Transit USA New Zealand Australia Canada Ireland France Finland Italy Spain Germany Sweden Austria Netherlands Switzerland Denmark Obesity Walk, Bike, Transit
10 % 3% 9% 10% 9% 3% 4% 2% 4% 8% 1% 2% 22% 22% 21% 22% 22% 23% 23% 1% 16% 1% 11% 11% 9% 5% 18% 16% 26% 25% Netherlands ('08) Walking Cycling Share of Trips by Cycling and Walking Australia* ('06) USA ('08) Canada* ('06) Ireland* ('06) UK ('08) Belgium ('99) France ('08) Austria ('05) Norway ('01) Finland ('05) Sweden ('06) Germany ('08) Denmark ('08) *data for commute only USA* ('08) Percent of trips by bicycle and foo
11 USA Denmark Netherlands Walking Cycling Daily Distance Walked and Cycled Per Person UK Portugal Spain Greece France Ireland Italy Austria EU-15 Average Sweden Finnland Belgium Germany Kilometers of walking and cycling per da
12 Lots of Potential for Increased Walking and Cycling in the USA: Many daily trips in American urban areas are short enough to make by bike! 25% of all trips 1 mile 40% of all trips are 2 miles
13 Lots of Potential for Increased Walking and Cycling in the USA: Possible at any age, except for very young and very old Women as well as men Possible for wide range of skills and physical abilities Affordable by everyone
14 70% Cycling Walking Women s Share of Bike and Walk Trips in Europe and North America Percent of trips by women 60% 50% 40% 30% 25% 52% 27% 53% 30% 56% 55% 60% 49% 49% 56% 56% 20% 10% USA UK Canada Denmark Germany Netherlands
15 Walking Cycling Bike and Walk Share of Trips by Age Group ' USA UK Germany Denmark Netherlands Age Group Percent of trips by foot and bike


16 Cycling can start at a very young age Foto by Marie Demers


17 And we can keep cycling all life long!!!

18 Mother and kids cycling together in Amsterdam Pucher: Biking for all Texans

19 Parents and kids cycling together in Portland

20 Ann and Mike s Triple Take Tandem Bikes can be adapted for different abilities and needs Pucher: Walking Cycling for Health
21 Make Walking and Cycling Safe for Everyone! Especially important for the young, the old, for anyone with disabilities, for the timid or risk-averse Women more sensitive to safety than men Safety of walking and cycling in the Netherlands, Denmark, and Germany helps explain high levels of walking and cycling there
22 Cyclist and Pedestrian Fatality and Injury Rate Cylists killed per 100 million km cycled 2008 Cylists injured per 10 million cycled 2008 Pedestrians killed per 100 million km walked Pedestrians injured per 10 million km walked Cyclist and Pedestrian Fatality and Injury Rates NL DK GER UK USA
23 Trends in Cyclist Fatalities USA UK Denmark Germany Netherlands Total cyclist fatalities relative to 1970 (=100
24 Trends in Pedestrian Fatalities USA UK Denmark Germany Netherlands Total pedestrian fatalities relative to 1970 (=100
25 SAFETY IN NUMBERS As levels of cycling increase, injury and fatality rates per trip and per km traveled fall dramatically Thus, if we can increase cycling, it will almost inevitably be safer
26 Public Policies Crucial to Increase Cycling Pro-car policies in European cities in 1950s and 1960s caused huge decline in cycling Dramatic policy turn-around since 1970s to limit car use and promote cycling, walking, and public transport in Dutch, Danish, and German cities

27 Bridge in Freiburg BEFORE and AFTER reforms

28 Typical residential street in Freiburg AFTER traffic calming reforms Typical residential street in Freiburg BEFORE traffic calming reforms


29 Cathedral Square in Freiburg AFTER transport and urban planning reforms Cathedral Square in Freiburg BEFORE transport and urban planning reforms

30 Transformation of German Urban Planning and Transport Policies since 1950s In 1953, prior to massive car use Lots of cycling and few cars in city center Lörrach, Turmstrasse 1953 Source: Archives, City of Lörrach

31 In 1972, just before urban planning and transport reforms Lörrach, Turmstrasse 1972 Source: Archives, City of Lörrach

32 In 2006, after carrestrictive reforms Return to civility, keeping out cars completely and reserving city center for pedestrians and cyclists Lörrach, Turmstrasse 2006
33 German Cycling Boom Engineered by Explicit Shifts in Transport Policy in 1970s City Time Period Change in Bicycle Modal Split Share Percentage Increase in Bicycle Share Munich 1976 to % to 13% +117% Nuremberg 1976 to % to 9% +125% Cologne 1976 to % to 12% +100% Freiburg 1976 to % to 19% +58% Stuttgart 1976 to % to 6% +200% Bremen 1976 to % to 21% +31% Muenster 1976 to % to 35% +21% Average for all urban areas in Western Germany 1972 to % to 10% +25% Sources: Broeg and Erl, Mobilitaet und Verkehrsmittelwahl. Muenchen: Socialdata, 2003; Deutsches Institut fuer Wirtschaftswissenschaften, Mobilitaet in Deutschland, Berlin: Bundesministerium fuer Verkehr, 2004.


34 Increase in Bike Share of Trips in Cities Around the World Source: Pucher, Dill, and Handy, Infrastructure, Programs, and Policies to Increase Bicycling, Preventive Medicine, Jan 2010, Vol. 50, S.1, pp. S106-S125.


35 Increase in Bike Share of Trips in Cities Around the World Source: Pucher, Dill, and Handy, Infrastructure, Programs, and Policies to Increase Bicycling, Preventive Medicine, Jan 2010, Vol. 50, S.1, pp. S106-S125.
36 Cyclists Per Day 15,000 12,500 10,000 Increasing Bicycle Use in Portland Bridge Bicycle Traffic Bikeway Miles Bikeway Miles ,500 5, : 83 miles of bikeways 2,850 daily trips 2007: 271 miles of bikeways 14,563 daily trips , Year: Bridge Bicycle Traffic Bikeway Miles 2,850 3,555 3,885 3,830 3,207 4,520 5,225 5,690 5,910 6,015 7,686 8,250 8,562 8,875 10,192 12,046 14,
37 Decreasing Crash Rate in Portland Daily Bicycle Trips 10,000 Crashes/Crash Rate ,500 5,000 2,500 0 Annual Crashes Crash Rate Bridge Bicycle Traffic Year
38 Portland vs. Dallas Bike share of trips in Dallas FELL: 0.15% in % in 2008 Bike share of trips in Portland ROSE 5-fold: 1.15% in % in 2008 Differences in cycling policies: Almost no bikeway facilities in Dallas Quadrupling in bikeway facilities in Portland
39 How to Encourage More Walking and Cycling while Improving Safety Better cycling and walking facilities Integration of walk/bike with public transport Traffic calming of residential neighborhoods Mixed-use zoning and improved urban design Restrictions on motor vehicle use Traffic education and Safe Routes to School Traffic regulations and enforcement

40 Most European cities have extensive carfree districts ideal for walking and cycling

41 Lively, safe, pleasant car-free zone in central Copenhagen


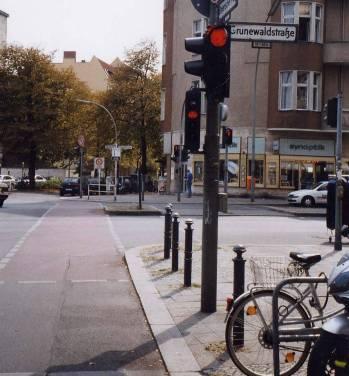
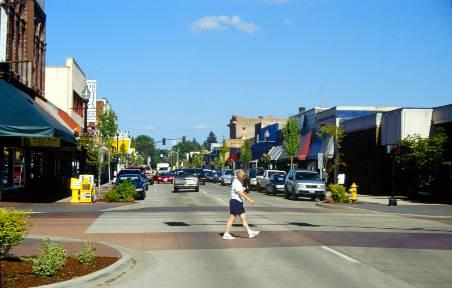
42 Which crosswalk do YOU think is safer?

43 Best pedestrian crossing in New Brunswick Roughly 80% of motorists stop for pedestrians in this crosswalk Pucher: Walking and Cycling for Health

44 Lousy pedestrian crossing at core of Rutgers University Only about 20% of motor vehicles yield for pedestrians at this crosswalk on Hamilton Street

45 LETHAL pedestrian crossing in New Brunswick: Rt. 18 improvement Insanely configured crosswalk is extremely dangerous for cyclists as well Motor vehicles SPEED UP on this off-ramp and NEVER yield to pedestrians Pucher: Biking for all Texans

46 What idiot designed this crosswalk? Accelerating motor vehicles coming from the left who NEVER yield to pedestrians Good luck making this sharp turn: Non-existent sidewalk at other end Extremely sharp angles at both ends of crosswalks that force most cyclists to dismount

47 No provisions of any kind AT ALL for cyclists on this crucial arterial connection between Highland Park and New Brunswick Why 99% of cyclists ride on the walkway and not on the roadway

48 Outrageous conditions for pedestrians on most important crossing in Middlesex County! Every time it rains, water ponds up on Rt. 27, and pedestrians get DRENCHED with bucketsful of water! Photo: Ralph Buehler

49 Running the gauntlet across the bridge, dodging masses of filthy water splashed by cars and trucks onto the walkway! Big decision: Which way to hold the umbrella?? Photo: Ralph Buehler


50 Unsafe sidewalks in New Brunswick Photos: Andy Besold

51 My favorite pedestrian walkway in New Brunswick Plenty of room for cyclists as well! Perfect mixed-use path!

52 Bike paths such as these make it safe and comfortable for all to bike: including women, children, and seniors

53 55% of all bike trips in Denmark are by women


54 Denmark: Ubiquitous short-cuts for right-hand turns and full-speed ahead for cyclists at red lights at T-intersections

55 Bicycle expressway-beltway in Muenster, Germany Note exclusive cycle path in middle and completely separate pedestrian walkways on both sides 38% of all trips in Muenster are by bike 58% of bike trips are by women One injury per 608,000 bike trips

56 My favorite recreational bike path along the Raritan-Delaware Canal But this path is recreational and has almost no daily, utilitarian use

57 Santa Barbara coastal path: Safe and attractive both for cyclists and pedestrians Conversion of two car lanes to bike path and wider sidewalk

58 250 mi of new bike lanes and paths since 2005 doubling in bike trips halving of cyclist fatalities from 28 to 14 Traffic-protected cycle track on 9 th Avenue, NYC

59 From 1996 to 2006, bike share of trips rose from 25% to 38%; fatalities fell 60% Typical intersection in Copenhagen, with separate crossings for pedestrians and cyclists

60 Bike access lane approaching intersection in Dutch city Netherlands has a cyclist fatality rate only a fifth as high as in the USA

61 Using special markings to raise visibility and safety of crossing

62 Improving safety of cycle tracks at road crossings

63 Contraflow lane in Strassbourg, France


64 Bike bridge along Yarra River in Melbourne Bike bridge along Ems River in Muenster

65 Delaware & Raritan Canal Path: Ped-bike bridge over Rt. 1 near Trenton Photo: Andy Besold

66 Extensive, fully-integrated bikeway network in Freiburg, Germany CRUCIAL to have full connectivity of cycling facilities! Usually lacking in North America


67 Special traffic signals and signs give priority to cyclists


68 Four-way all-green signal for cyclists in Portland Bike sensor in pavement

69 Bike sensors in pavement to trigger green light for cyclists in Richmond, Metro Vancouver, BC


70 Raised curb protects bike path from cars Express bikeways for commuters Bike speed indicators Green wave for cyclists in Odense, Denmark Troels Andersen, Cycling in Odense, Denmark

71 Good bike route signage is crucial

72 Convenient air pumps for bikes throughout Odense
73 Traffic Calming of Residential Neighborhoods Speed limited by law to 30km per hour (19mph) or less Physical measures that force cars to slow down: Road narrowing, zigzag routing, chicanes Raised intersections and crosswalks Traffic circles Speed humps and bumps Mid-block closures and artificial dead-ends Bulb-outs at intersections and crosswalks, with sidewalk widening

74 Why Traffic Calming Saves Lives Speed Speed kills! kills! Source: World Health Organization (2008) and OECD Transport Research Centre (2006)


75 Speed Humps Chokers Traffic Circles Traffic Circle Raised Crosswalk


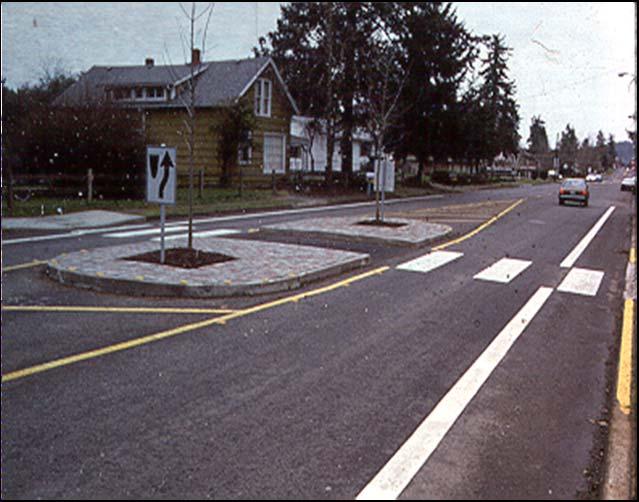
76 Curb Extension Neckdown/Bulbout Median Island Chicanes

77 Traffic calming in Vancouver that promotes cycling while discouraging car use Foto: Rich Drdul One-way for cars, two-way for bikes

78 Foto by Peter Berkeley Convenient bike cut-thru for cyclists in Melbourne

79 3,800 km of traffic-calmed streets in Berlin: ideal for cycling

80 Traffic Calming in Freiburg, Germany Improves safety and encourages more walking and cycling


81 Fotos: Jonathan Maus Traffic calming turns these streets into bikeways Bike Boulevards in Portland

82 Many neighborhood streets in NJ are perfectly good for cycling even without any special facilities I cycle on this street in Highland Park every day and never have any problems.


83 Fahrradstrassen in Germany, bicycle streets where cyclists have absolute priority over cars for entire width of roadway Car-free John in Nuernberg Muenster

84 Over half of NJ Transit buses now have bike racks, 95% by 2015


85 Bike on LRT in NJ and Minneapolis Photo: John Boyle Photo: Metro Transit

86 Bike on Suburban Rail in NJ Photo: Leigh Ann Von Hagen


87 Bikes on Caltrain in San Francisco Photo: Ralph Buehler Photo: San Francisco Bicycling Coalition Photo: John Pucher


88

89 Bike and Ride Convenient and secure parking for 3,500 bikes at main train station in Muenster

90 Bike Wash at Muenster Bike Station

91 Bike Parking Corrals in Portland 86 corrals with 1,428 bike parking spaces in 2011
92 Traffic Education Improved motorist training, with much more emphasis on how to avoid endangering pedestrians and cyclists Compulsory traffic safety lessons for all school children by the age of 10, with testing by traffic police on actual traffic test courses, to ensure safe and defensive walking and cycling by an early age (as in the Netherlands and Germany)


93 German traffic laws generally favor cyclists and pedestrians over motorists


94 Cycling training and testing course in Berlin Most German and Dutch children take cycling lessons by the 3 rd or 4 th grade and must pass a police-administered cycling safety test!


95 Bike Training for Children in NJ
96 MARKETING CYCLING TO ALL SOCIAL GROUPS Very diverse needs of different groups Need to tailor cycling facilities, policies, and programs to serve this broad range Be as inclusive as possible Need good facilities as well as active marketing of cycling, with different approaches to each potential group of cyclists


97 Troels Andersen, Cycling in Odense, Denmark Cycling Duckie for very young kids in Odense, Denmark


98 Cycling competitions for somewhat older kids in Odense, Denmark Troels Andersen, Cycling in Odense, Denmark

99 Bike Training for Adults
100 GIVE EMPLOYEES FREE BIKES INSTEAD OF FREE PARKING! The perfect zero emissions vehicles! Troels Andersen, Cycling in Odense, Denmark


101 Get on a bike and lose weight! Troels Andersen, Cycling in Odense, Denmark Get rid of the sack Campaign aimed at overweight middle-aged men with pot bellies
102 Troels Andersen, Cycling in Odense, Denmark Guided Bicycle Tours for Seniors
103 Safe Routes to School: Enable Children to Walk or Bike to Schools! Two thirds of American children who live within a mile of their school travel there by car Only 13 percent of children in the USA walked or biked to school in 2001, compared to 60 percent in 1974 Most European children walk or bike to school, some ride transit, virtually none get chauffered by their parents or drive themselves Need improved walking and cycling facilities to prevent dangerous conflicts with motor vehicles, especially at crossings and intersections


104 Good crosswalks crucial near schools!
105

106 Walking School Bus in Newark, NJ These kids are actually having fun and getting good exercise, too!

107 Walking School Bus in Wharton, NJ These kids are actually having fun and getting good exercise, too!

108 In the Netherlands, children can ride safely to school on trafficprotected bike paths

109 Bike path leads directly to school in NL

110 Bike to School Day in California
111 Mixed-Use Zoning and Better Urban Design Inclusion of sidewalks and bikeways or bike lanes in all new suburban developments and retrofitting of existing developments, where possible Mixed land use zoning so that residential units are within easy walking or cycling distance of cultural facilities, shopping, and service establishments Encouragement of compact, mixed-use development around transit stops to facilitate walking/bicycling communities (transit-oriented development) through subsidies, mortgage bonuses, and zoning. Restrict parking lots to locations behind buildings rather than between buildings and the street (as with most strip mall development in USA).
112 Traffic Regulations and Enforcement Revise traffic laws to place burden of proof on motorists, with the assumption that motorist is guilty unless it can be shown otherwise, especially when children or elderly are involved in crashes (forcing motorists to be extra careful to avoid crashes with pedestrians and cyclists) Enforce existing legal rights of pedestrians and cyclists, with strict penalties and fines for motorist violations of ped/bike rights of way in crosswalks, bike lanes, intersection crossings. Traffic cameras at intersections to photograph motorists failing to stop or yield when required to do so, with automatic ticketing for violations
113 CONCLUSIONS: Broad range of public health benefits of walking and cycling have potential to provide widespread political support for more sustainable transport policies Almost everyone could walk and cycle more on a daily basis, and thus reap these health benefits Many local trips in American cities are short enough to cover by walking or cycling Crucial to design ped-bike facilities and programs for everyone! Be as inclusive as possible! Public information campaign needed to emphasize both direct and indirect public health benefits of walking and cycling

114 For any questions or further information, please contact: Prof. John Pucher Bloustein School of Planning and Public Policy Rutgers University 33 Livingston Avenue, Room Webpage:
Walking and Cycling for Healthy Cities
 Walking and Cycling for Healthy Cities Prof. John Pucher, Rutgers University http://policy.rutgers.edu/faculty/pucher Walking and Bicycling: the MOST sustainable transport modes MOST environmentally friendly:
Forhealth health, forfun, for transportation. Prof. John Pucher, Rutgers University
 BIKING FOR ALL TEXANS Forhealth health, forfun, for transportation Prof. John Pucher, Rutgers University Walking and Bicycling: the MOST sustainable ti transport tmodes MOST environmentally friendly: >Virtually
Cycling for Everyone:
 Cycling for Everyone: The Key to Public and Political Support John Pucher Rutgers University (http://policy.rutgers.edu/faculty/pucher.html) Reasons for everyone to support cycling: More daily physical
Using Public Policies to Promote Walking, Cycling, and Public Transport
 Using Public Policies to Promote Walking, Cycling, and Public Transport John Pucher, Rutgers University http://policy.rutgers.edu/faculty/pucher/ Worldwide Travel Trends Increasing daily travel distances
Using Public Policies to Promote Walking, Cycling, and Public Transport
 Using Public Policies to Promote Walking, Cycling, and Public Transport John Pucher, Rutgers University http://policy.rutgers.edu/faculty/pucher/ Worldwide Travel Trends Increasing daily travel distances
Streets for Everyone: Lessons from Cities across the Globe
 Streets for Everyone: Lessons from Cities across the Globe John Pucher, Rutgers University Photo: Susan Handy Complete Streets Forum, Toronto, Canada, Oct 6, 2014 Photo: Ralph Buehler Complete Streets
Travel Behavior, Transport Policy, and Sustainable Transport in Germany and the USA
 Travel Behavior, Transport Policy, and Sustainable Transport in Germany and the USA Similarities between Germany and the USA Federal system of government, tradition of local self-government Strong economy,
Promoting Walking and Cycling in Los Angeles: Lessons from Europe and North America
 Promoting Walking and Cycling in Los Angeles: Lessons from Europe and North America John Pucher, Rutgers University, and Ralph Buehler, Virginia Tech Walking and Cycling: the MOST sustainable transport
Promoting Safe Walking and Cycling: Lessons from Europe and North America. John Pucher, Rutgers University, and Ralph Buehler, Virginia Tech
 Promoting Safe Walking and Cycling: Lessons from Europe and North America John Pucher, Rutgers University, and Ralph Buehler, Virginia Tech Walking and Cycling: the MOST sustainable transport modes MOST
How to Increase Cycling for Daily Travel: Lessons from Cities across the Globe
 How to Increase Cycling for Daily Travel: Lessons from Cities across the Globe Joint Webinar for the Institute of Transportation Engineers and the Active Living Research Program of the Robert Wood Johnson
SUSTAINABILITY, TRANSPORT, & HEALTH. Ralph Buehler, Virginia Tech
 SUSTAINABILITY, TRANSPORT, & HEALTH Ralph Buehler, Virginia Tech Prepared for National Academies Roundtable on Science and Technology for Sustainability 6 December 2013 Overview Trends in Motorization
BIKE TRANSIT INTEGRATION IN NORTH AMERICA. John Pucher & Ralph Buehler
 BIKE TRANSIT INTEGRATION IN NORTH AMERICA John Pucher & Ralph Buehler Synergies: Bicycling and Public Transport: Perfect Together? Cycling extends catchment areas of transit stops far beyond walking range
Lessons from Cities across the Globe
 Cycling to the Future: Lessons from Cities across the Globe John Pucher, Rutgers University Ralph Buehler, Virginia Tech Photo: Susan Handy Photo: Photo: SF Greg Bike Coalition Raisman San Antonio Photo:
Complete Streets 101: The Basics
 Complete Streets 101: The Basics Michigan Municipal League - Capital Conference March 21, 2017 Chip Smith, AICP - Senior Planner - Wade Trim Inc. and City Council member City of Ann Arbor 2017 MML Capital
Canada. UK France. Walk, Bike, Transit Share of Trips
 1950s 1960s Today Relationship between Share of Urban Trips by Transit, Bicycle, and Foot and Per Capita Annual CO 2 Emissions from Road and Rail Transport in Australia, Canada, the USA and EU Countries,
Lessons from Copenhagen. John L Bowman 2013
 Lessons from Copenhagen John L Bowman 2013 Bicycle Strategy Official municipal policy Goals for the next 15 years Updated after 5-10 years 32 page glossy brochure BAC December 2, 2013 John L Bowman 2 Bicycle
Safety in numbers What comes first safety or numbers? Jan Garrard School of Health and Social Development Deakin University
 Safety in numbers What comes first safety or numbers? Jan Garrard School of Health and Social Development Deakin University The safety in numbers theory As the number of cyclists increases, injury rates
Health, Transportation and Bicycling: Connecting the Dotted Lines
 Portland State University PDXScholar Urban Studies and Planning Faculty Publications and Presentations Nohad A. Toulan School of Urban Studies and Planning 11-17-2010 Health, Transportation and Bicycling:
Infrastructure and Programs. What does the data say? Advancing Non-motorized Transportation in Vermont 11/15/09
 Advancing Non-motorized Transportation in Vermont A reply from the university point of view Lisa Aultman-Hall Professor and Director Figure 4 Why Canadians Cycle more than Americans: A Comparative Analysis
REGIONAL BICYCLE AND PEDESTRIAN DESIGN GUIDELINES
 REGIONAL BICYCLE AND PEDESTRIAN DESIGN GUIDELINES November 16, 2011 Deb Humphreys North Central Texas Council of Governments Bicycle and Pedestrian Advisory Committee Snapshot of the Guide 1. Introduction
Active and Green: Healthy Communities Are Sustainable Communities
 Active and Green: Healthy Communities Are Sustainable Communities James Sallis, PhD San Diego State University www.drjamessallis.sdsu.edu For LISC Webinar May 4, 2011 Goals of talk Physical inactivity
A Holistic Approach to Community Connectivity. 50 th International Making Cities Livable Conference Portland, OR June 2013
 A Holistic Approach to Community Connectivity 50 th International Making Cities Livable Conference Portland, OR June 2013 Founded 2008 About GP RED Research Education Advocacy Focus on Health, Recreation
What future for mid-sized cities? Prof. Emer. Antony Stathopoulos National Technical University of Athens
 What future for mid-sized cities? Prof. Emer. Antony Stathopoulos National Technical University of Athens These cities can range in size from 50,000 to 250,000 in population. Street in Larnaca in 1878
Active Transportation Facility Glossary
 Active Transportation Facility Glossary This document defines different active transportation facilities and suggests appropriate corridor types. Click on a facility type to jump to its definition. Bike
The Transformation of Portland into a Two-Wheeled Mecca. Mia Birk, Principal, Alta Planning + Design
 The Transformation of Portland into a Two-Wheeled Mecca Mia Birk, Principal, Alta Planning + Design Development of Portland s Bikeway Network 1990 Early 1990s Infrastructure Growing Public Support Growing
Canada s Capital Region Delegation to the Velo-City Global 2010 Conference
 Canada s Capital Region Delegation to the Velo-City Global 2010 Conference Report of Findings from Visits, Meetings & Presentations In Amsterdam-Den Haag, Utrecht, Berlin & Copenhagen The Itinerary Copenhagen
Rutgers. October Designing Streets for People LLC
 Rutgers Voorhees Transportation Center October 22 2010 Michael Ronkin Designing Streets for People LLC 1 2 3 4 5 We know how to build right 6 Yet many roads are built like this Recently completed IL 64
Win-Win Transportation Solutions
 Win-Win Transportation Solutions Todd Litman Victoria Transport Policy Institute Presented Lipinski Symposium on Transportation Policy Chicago, Illinois 15 October 2007 What is The Transportation Problem?
Making Cycling Irresistible: Lessons from the Netherlands, Denmark, and Germany
 Making Cycling Irresistible: Lessons from the Netherlands, Denmark, and Germany John Pucher and Ralph Buehler Bloustein School of Planning and Public Policy Rutgers University 33 Livingston Avenue, Room
Bicycle Boulevards and Neighborhood Greenways
 Bicycle Boulevards and Neighborhood Greenways Traffic Safety is Improving for Everyone 90 80 70 60 50 40 30 20 10 0 PORTLAND: TOTAL TRAFFIC FATALITIES 1986-2008 1986 1987 1988 1989 1990 1991 1992 1993
Brunswick, New Jersey, USA. First Published: July 2008 PLEASE SCROLL DOWN FOR ARTICLE
 This article was downloaded by:[rutgers University] On: 23 June 2008 Access Details: [subscription number 788777707] Publisher: Taylor & Francis Informa Ltd Registered in England and Wales Registered Number:
Bicycle Facilities Planning
 Bicycle Facilities Planning Overview Types of Cyclists Purpose for Riding Types of Facilities Bike Lanes Bicycle Boulevards Cycle Tracks Intersections Signals Signing and Marking Discussion Types of Bicyclists
ThinkBike Workshop. Los Angeles September 22-23, 2011
 September 22-23, 2011 The Experts Cor van der Klaauw Groningen Province Richard ter Avest Goudappel Coffeng Consultancy The Experts Tonny Bosch Goudappel Coffeng Consultancy Hillie Talens CROW Cycling
Appendix C. TRAFFIC CALMING PROGRAM TOOLBOX
 Appendix C. TRAFFIC CALMING PROGRAM TOOLBOX PHASE I...2 Do Not Enter Sign...3 One-Way Sign...4 Turn Prohibition...5 Pavement Markings...6 Speed Monitoring Trailer...7 Neighborhood Speed Watch...8 Police
OLDER PEOPLE INDEPENDENT MOBILITY FOR LIVEABLE COMMUNITIES. Christopher G B (Kit) Mitchell
 Mitchell") OLDER PEOPLE INDEPENDENT MOBILITY FOR LIVEABLE COMMUNITIES by Christopher G B (Kit) Mitchell Independent mobility is necessary for a high quality of adult life In developed countries, the automobile has
OLDER PEOPLE INDEPENDENT MOBILITY FOR LIVEABLE COMMUNITIES by Christopher G B (Kit) Mitchell Independent mobility is necessary for a high quality of adult life In developed countries, the automobile has
PEDALING FORWARD. A Glance at the SFMTA s Bike Program for SFMTA.COM
 PEDALING FORWARD A Glance at the SFMTA s Bike Program for 2017-2021 SFMTA.COM INTRODUCTION About This Booklet More people from all walks of life see their bicycle as a more convenient way to get where
outline 1. why cycle? 2. (safety health) 3. safe system 4. what next
 3. safe system 4. what next") outline 1. why cycle? 2. (safety health) 3. safe system 4. what next In a city of many cyclists, why do they ride? Copenhageners reasons for cycling to and from work (multiple answers) 56% it s faster
outline 1. why cycle? 2. (safety health) 3. safe system 4. what next In a city of many cyclists, why do they ride? Copenhageners reasons for cycling to and from work (multiple answers) 56% it s faster
FEDERAL HIGHWAY ADMINISTRATION APPLICATION
 FEDERAL HIGHWAY ADMINISTRATION APPLICATION REQUEST FOR PERMISSION TO EXPERIMENT WITH A BICYCLE BOX INTERSECTION TREATMENT Submitted by: City of Columbus Department of Public Service Date: June 26, 2009
Space for Cycling. Delivering healthy streets. Roger Geffen Policy Director, Cycling UK
 Space for Cycling Delivering healthy streets Roger Geffen Policy Director, Cycling UK About Cycling UK 65,000 members, founded 1878 Cycling activities, membership services (legal, insurance, magazine)
Highway School, Ithaca NY
 Highway School, Ithaca NY June 1, 2009 Michael Ronkin Designing Streets for Pedestrians and Bicyclists 1 We know how to build right 6 Yet many roads are built like this 7 What is a Complete Street?
Physical Implications of Complete Streets Policies
 Presentation Overview Physical Implications of Complete Norm Cox, ASLA, LLA Landscape Architect Ann Arbor, Michigan, 10:45 to Noon What Are Complete Streets? What Matters to Bicyclists and Pedestrians
Child- and Youth-friendly Land-use and Transport Planning Guidelines
 Child- and Youth-friendly Land-use and Transport Planning Guidelines Richard Gilbert Centre for Sustainable Transportation (In April 2006, the Centre moved from Toronto, Canada, to the University of Winnipeg)
Facility preferences & safety
 Photo Flickr: Boegh Facility preferences & safety Evidence from two studies Kay Teschke School of Population & Public Health University of British Columbia Canadians don t cycle much % of trips by bike
Film Guide for Educators. Designing for Safety
 Film Guide for Educators Designing for Safety Designing For Safety Key Concepts Speeding While Driving Speeding is the number one cause of injuries and deaths from driving. The main reasons are because
PROPOSED HIGH STREET TRAFFIC CALMING PLAN
 PROPOSED HIGH STREET TRAFFIC CALMING PLAN Pottstown Borough has conducted two studies in recent years to revitalize its downtown area and make its main street, High Street, safer and more attractive for
Broad Street Bicycle Boulevard Design Guidelines
 Broad Street Bicycle Boulevard Design Guidelines Building from the strategies introduced in the 2013 Bicycle Transportation Plan and community input received thus far, City Transportation Staff have identified
Streets. Safe for Pedestrians 20% 2nd 5,000. Are We People-Friendly?
 Streets Safe for Pedestrians 20% Pedestrian deaths account for more than of all traffic-related fatalities in California each year. 600 More than people are killed and another 13,000 are injured every
G AT E WAY PLAN. Community BRIEFING KIT GATEWAY BIKE
 G AT E WAY PLAN GATEWAY BIKE Community BRIEFING KIT PLAN August 2016 TABLE OF CONTENTS INTRODUCTION... 1 THE BENEFITS OF A BIKEABLE COMMUNITY... 2 ECONOMY...2 SAFETY...3 HEALTH...3 HOUSEHOLD SPENDING...3
Land Use & Transportation
 21 st Century Transportation in Convenient Communities Prof. Paul Okamoto s Sustainable Design University of San Francisco 24 September 2014 Land Use & Transportation ASHRAE Golden Gate Seminar Sustainable
ACTIVE TRANSPORTATION
 ACTIVE TRANSPORTATION Mobility 2040 Supported Goals Improve the availability of transportation options for people and goods. Support travel efficiency measures and system enhancements targeted at congestion
About the Active Transportation Alliance
 About the Active Transportation Alliance Chicagoland s voice for better biking, walking and transit Founded 1985 7,000 members, ~33 full time staff Serve Chicago metro region 1 More Cars, More Driving
RESOLUTION NO ?? A RESOLUTION OF THE CITY OF NEPTUNE BEACH ADOPTING A COMPLETE STREETS POLICY
 RESOLUTION NO. 2018-?? A RESOLUTION OF THE CITY OF NEPTUNE BEACH ADOPTING A COMPLETE STREETS POLICY WHEREAS, safe, convenient, and accessible transportation for all users is a priority of the City of Neptune
Discussion: Bicycle Benefits
 Discussion: Bicycle Benefits 3 Bicycling has increased in popularity over the last decade as Americans realize its health, transportation, and financial benefits. Cities across the United States and within
Montclair s Complete Streets Experience
 Presented by: Hon. Jerry Fried, Mayor Montclair Township About Montclair Six square miles Six commuter rail stations Four local bus routes (NJ Transit) Two private commuter bus routes Five business districts
Health and Community Design: The Local Government Role in Promoting Active Living
 Health and Community Design: The Local Government Role in Promoting Active Living Rich Killingsworth, Director Active Living by Design National Program Office University of North Carolina School of Public
TOWN OF PORTLAND, CONNECTICUT COMPLETE STREETS POLICY
 TOWN OF PORTLAND, CONNECTICUT COMPLETE STREETS POLICY I. VISION, GOALS & PRINCIPLES VISION To improve the streets of Portland making them safer and more accessible for all users including pedestrians,
The Wiggle Route in Context
 The Wiggle Route in Context In a city of hills, the Wiggle is an important route because it winds its way along the flattest streets from Market to the Panhandle, bringing residents to local parks and
National Safe Routes to School Program: Initial Results
 National Safe Routes to School Program: Initial Results Lauren Marchetti National Center for Safe Routes to School 9 th Annual New Partners for Smart Growth Thursday, February 4, 2010 Seattle, WA August
TPO Chattanooga-Hamilton County/North Georgia. The Road Less Traveled. Non-traditional Health Impact Analyses in Transportation Planning
 TPO Chattanooga-Hamilton County/North Georgia The Road Less Traveled Non-traditional Health Impact Analyses in Transportation Planning Chattanooga TPO 443,000 people 2,110 lane miles 19 Jurisdictions $7.3M/year
Appendix 3 Roadway and Bike/Ped Design Standards
 Appendix 3 Roadway and Bike/Ped Design Standards OTO Transportation Plan 2040 4/20/2017 Page A3-1 Adopted Standards The adopted OTO Design Standards and Major Thoroughfare Plan are contained herein.
Toronto Complete Streets Guidelines
 88 90 5.1 Cycling Design Principles 92 5.2 Context-sensitive Cycling Facilities 96 5.3 Key Cycling Elements Cycling infrastructure provides choice in how people are able to move around the city. Cyclists
FAQ sheet Dutch Cycling Embassy
 FAQ sheet Dutch Cycling Embassy Table of Contents Benefits of cycling... 2 The development of cycling in the Netherlands... 3 Accident liability... 4 Bicycle parking in the Netherlands... 4 E-bike & Speed
What Is a Complete Street?
 Session 5 Charleen Zimmer, AICP, Zan Associates May 5-7, 2010 What Is a Complete Street? May 2010 5-1 Not a Complete Street More of a Complete Street May 2010 5-2 Benefits of Complete Streets Safety for
9/21/2016 VIA . RE: The Knot (DR16-270)
") 9/21/2016 VIA EMAIL Garrett Norman, Assistant Planner City of Sacramento Community Development Department 300 Richards Boulevard, 3 rd Floor Sacramento, CA 95811 RE: The Knot (DR16-270) Dear Mr. Norman:
9/21/2016 VIA EMAIL Garrett Norman, Assistant Planner City of Sacramento Community Development Department 300 Richards Boulevard, 3 rd Floor Sacramento, CA 95811 RE: The Knot (DR16-270) Dear Mr. Norman:
C/CAG. Sunnybrae Elementary School Walking and Bicycling Audit. San Mateo-Foster City School District JUNE 2013
 Sunnybrae Elementary School Walking and Bicycling Audit JUNE 2013 San Mateo-Foster City School District C/CAG City/County Association of Governments of San Mateo County SUNNYBRAE ELEMENTARY SCHOOL WALKING
Appendix C 3. Bicycle / Pedestrian Planning
 Appendix C 3. Bicycle / Pedestrian Planning BICYCLE/PEDESTRIAN PLANNING 2005 Master Plan GOAL: Provide for safe and convenient bicycle and pedestrian circulation throughout the City. Develop a city-wide
Arlington s Master Transportation Plan
 Arlington s Master Transportation Plan The Master Transportation Plan (MTP) Adopted in eight parts Goals & Policies element and MTP Map adopted in 2007 Bicycle, Pedestrian and Demand and Systems Management
Cycle Tracks: Concept and Design Practices. February 17, 2010
 Cycle Tracks: Concept and Design Practices February 17, 2010 Today s webinar presenters APBP Board Member Host Brett Hondorp, Principal, Alta Planning + Design Guest Moderator Zach Vanderkooy, Bicycling
CONNECTING PEOPLE TO PLACES
 CONNECTING PEOPLE TO PLACES 82 EAST BENCH MASTER PLAN 07 Introduction The East Bench transportation system is a collection of slow moving, treelined residential streets and major arteries that are the
Promoting Sustainable Urban Transport: Lessons from Germany Ralph Buehler and John Pucher
 Promoting Sustainable Urban Transport: Lessons from Germany Ralph Buehler and John Pucher Presented at: "Lessons from Europe Jean Monnet Research Workshop Rutgers Center for European Studies, September
Double Dutch: Bicycling Jumps in Philadelphia
 Double Dutch: Bicycling Jumps in Philadelphia Introduction The path to urban sustainability is paved by streets that accommodate all users, not just cars and trucks. 20 th Century transportation policy
Bicycle Network. Vision Zero San Francisco The City and County of San
 PROJECT BACKGROUND Project Needs 1. 17th between Church and Sanchez is identified as a location where there is a disproportionate number of crashes involving people riding bikes. 2. There is currently
8/31/2016 VIA . RE: Freeport Arco Fuel Station (P16-039)
") 8/31/2016 VIA EMAIL Garrett Norman, Assistant Planner City of Sacramento Community Development Department 300 Richards Boulevard, 3 rd Floor Sacramento, CA 95811 RE: Freeport Arco Fuel Station (P16-039)
8/31/2016 VIA EMAIL Garrett Norman, Assistant Planner City of Sacramento Community Development Department 300 Richards Boulevard, 3 rd Floor Sacramento, CA 95811 RE: Freeport Arco Fuel Station (P16-039)
EXECUTIVE SUMMARY. Vision
 Vision Walking and bicycling in Salt Lake City will be safe, convenient, comfortable, and viable transportation options that connect people to places, foster recreational and economic development opportunities,
By: Bill Baranowski, PE TRAFFIC CALMING EXAMPLES IN SUGARHOUSE, DAYBREAK, AND WEST JORDAN CITY
 By: Bill Baranowski, PE TRAFFIC CALMING EXAMPLES IN SUGARHOUSE, DAYBREAK, AND WEST JORDAN CITY 1977 HIGHLAND RUGBY TOUR 1945 WHERE??? What is more contentious than traffic calming? 1951 LOOKING SOUTHEAST
Copenhagen Cycling Map. Red Lines Cycling facilities
 Copenhagen Cycling Map Red Lines Cycling facilities Copenhagen Cycling Facilities Design Approaches Transportation without Pollution Copenhagen s Strategy Where Cycling is one of the top key activities
Bicycle Friendly Streets
 Bicycle Friendly Streets 4.1 Guiding Principle and Objectives Bicycles are recognized as vehicles under the Highway Traffic Act, and as such, should be afforded the same consideration as motor vehicles
Bicycle + Pedestrian Connectivity Gap Analysis
 Accelerated Bridge Program Bicycle + Pedestrian Connectivity Gap Analysis Tuesday, October 11 Shriners Hospital, Boston 6:30-8:00 PM Thursday, October 13 Community Rowing, Brighton 6:30-8:00 PM Tuesday,
Bicycle Corrals Portland Designing Streets NYC October 25, 2012 Roger Geller, Bicycle Coordinator Portland, OR
 Bicycle Corrals Portland 8-80 Designing Streets NYC October 25, 2012 Roger Geller, Bicycle Coordinator Portland, OR Build it and they will come 1990 2012 Build it better 2012 background With bike boxes
Corpus Christi Metropolitan Transportation Plan Fiscal Year Introduction:
 Introduction: The Safe, Accountable, Flexible, Efficient Transportation Equity Act: A Legacy for Users (SAFETEA-LU) has continued the efforts started through the Intermodal Surface Transportation Efficiency
NZ Transport Agency Cycling Rules
 NZ Transport Agency Cycling Rules https://www.nzta.govt.nz/walking-cycling-and-public-transport/cycling/for-peopl e-involved-in-cycling-programmes-and-projects/cycling-resources-and-research/ General regulatory
Cycling and risk. Cycle facilities and risk management
 Cycling and risk Cycle facilities and risk management Failure to recognize possibilities is the most dangerous and common mistake one can make. Mae Jemison, astronaut 6/11/2010 York Regional Council Cycling
Board-Approved Funding Awards for Cycle 4 Active Transportation Grant Program Projects (in Order of Project Rankings) Approved on
 Approved on") CAPITAL Large Category Projects Board-Approved Funding Awards for Cycle 4 Active Transportation Grant Program Projects (in Order of Project Rankings) Approved on 07-27-18 1 La Mesa University Ave Pedestrian
CAPITAL Large Category Projects Board-Approved Funding Awards for Cycle 4 Active Transportation Grant Program Projects (in Order of Project Rankings) Approved on 07-27-18 1 La Mesa University Ave Pedestrian
THE OFFICIAL GUIDE TO CYCLING SAFELY IN PHILADELPHIA
 B IKE NICE THE OFFICIAL GUIDE TO CYCLING SAFELY IN PHILADELPHIA A partnership of the City of Philadelphia and the Bicycle Coalition of Greater Philadelphia ABOUT VISION ZERO & BIKE NICE It s a great day
Concept of Sustainable Transport and integrated Land Use Planning- An Overview. Manfred Breithaupt GIZ Water, Energy, Transport
 Concept of Sustainable Transport and integrated Land Use Planning- An Overview Manfred Breithaupt GIZ Water, Energy, Transport The adverse impacts of growth in motorization - in economic, environmental
Simulation Analysis of Intersection Treatments for Cycle Tracks
 Abstract Simulation Analysis of Intersection Treatments for Cycle Tracks The increased use of cycle tracks also known as protected bike lanes has led to investigations of how to accommodate them at intersections.
Table #6 VISION CHARACTERISTICS
 Table #6 VISION White Flint is a place to live, work, play, shop, and walk with sufficient density to encourage quality redevelopment. Vibrant streets and consistent streetscapes are important. CHARACTERISTICS
FACTS AND FIGURES: MAKING THE CASE FOR COMPLETE STREETS IN LEE COUNTY
 FACTS AND FIGURES: MAKING THE CASE FOR COMPLETE STREETS IN LEE COUNTY Safety: Close to 5,000 pedestrians and bicyclists die each year on U.S. roads, and more than 70,000 are injured. [Mean Streets, Surface
London Cycle Network Annual Report 2000
 London Cycle Network Annual Report 2000 A cycle network for London by 2005 A cycle network for London by 2005 The London Cycle Network will: provide local links between residential neighbourhoods, railway
DOWNTOWN MIAMI PEDESTRIAN PRIORITY ZONE
 DOWNTOWN MIAMI PEDESTRIAN PRIORITY ZONE AUGUST 6, 2013 DOWNTOWN MIAMI BY THE NUMBERS more than 200,000 people live, work, and play here every day is home to more than 1,000 events each year hosts more
Biking Culture In US Cities Compared to That of Amsterdam and Copenhagen
 Biking Culture In US Cities Compared to That of Amsterdam and Copenhagen Benefits of Biking Environmental Less Expensive Healthier Safer -No emissions (that contribute to air pollution and climate change)
Better Market Street Project Update. Urban Forestry Council September 17, 2014
 Better Market Street Project Update Urban Forestry Council September 17, 2014 Project Area Limits Better Market Street Schedule Market Street City s busiest transit corridor Over 85 buses per hour 14 surface
Bicycle Master Plan Goals, Strategies, and Policies
 Bicycle Master Plan Goals, Strategies, and Policies Mobilizing 5 This chapter outlines the overarching goals, action statements, and action items Long Beach will take in order to achieve its vision of
Built Environment Childhood Obesity Forum September 15, 2010
 Built Environment Childhood Obesity Forum September 15, 2010 TITLE Why do we have cities? Boston MA To minimize travel & maximize exchange (bring people closer together) How have we built our urban roadway
TRANSPORTATION TRAINING TOPICS. April 6, 2010
 TRANSPORTATION TRAINING TOPICS April 6, 2010 Roles of Transportation Providers Context and Policy Makers Division of Transportation and Traffic Other City Operations Other Transportation Operators CMA
10/30/2012 VIA
 10/30/2012 VIA EMAIL David Hung, Associate Planner Community Development Department, Current Planning Division City of Sacramento 300 Richards Blvd., 3 rd Floor Sacramento, CA 95811 RE: The Cannery On-Site
Real-Life Cost of Incomplete Streets
 Real-Life Cost of Incomplete Streets Presented by: Sheree Davis New Jersey Department of Transportation State Bicycle & Pedestrian Coordinator 609.530.6551 sheree.davis@dot.state.nj.us 2011 New Jersey
CURBSIDE ACTIVITY DESIGN
 5 CURBSIDE ACTIVITY DESIGN This chapter provides design guidance for separated bike lanes adjacent to curbside activities including parking, loading and bus stops. Typical configurations are presented
City of Perth Cycle Plan 2029
 Bicycling Western Australia s response City of Perth Cycle Plan 2029 2012-2021 More People Cycling More Often ABOUT BICYCLING WESTERN AUSTRALIA Bicycling Western Australia is a community based, not-for-profit
Designing for Pedestrian Safety
 Designing for Pedestrian Safety Introduction to Pedestrian Safety Design and Planning Principles Presented by: Craig Allred FHWA Resource Center Technical Specialist and Michael Ronkin Owner, Designing