A Report from the University of Vermont Transporta on Research Center. Regional Models of Bicycle and Pedestrian Travel in Chi enden County, Vermont
|
|
|
- Megan Curtis
- 6 years ago
- Views:
Transcription
1 A Report from the University of Vermont Transportaon Research Center Regional Models of Bicycle and Pedestrian Travel in Chienden County, Vermont TRC Report Sullivan, Dowds, Aultman Hall February 2015
2
3 Regional Models of Bicycle and Pedestrian Travel in Chittenden County, Vermont February 5, 2015 Prepared by: Jim Sullivan Jonathan Dowds Lisa Aultman-Hall Transportation Research Center Farrell Hall 210 Colchester Avenue Burlington, VT Phone: (802) Website:
4 Acknowledgements The authors acknowledge the USDOT for funding this work through the University Transportation Center (UTC) at the University of Vermont. Data and technical input was provided by the teams at the Chittenden County Regional Planning Commission, Local Motion and the Vermont Agency of Transportation. Contributions to this body of work by Ben Rouleau, Lance Jennings, Chen Zhang, Brian H. Y. Lee and Austin Troy were appreciated. Disclaimer The contents of this report reflect the views of the authors, who are responsible for the facts and the accuracy of the data presented herein. The contents do not necessarily reflect the official view or policies of the UVM Transportation Research Center. This report does not constitute a standard, specification, or regulation.
5 Table of Contents Acknowledgements... 2 List of Tables... 4 List of Figures Introduction and Objectives Background Study Area Data Link-Based Non-Motorized Traffic Counts Land-Use Data The Non-Motorized Travel Network of Streets, Shared-Use Paths, and Sidewalks Weather Data Data Preparation Link-Based Non-Motorized Traffic Counts Link and Count Site Classification Methodology and Results Land-Use as a Factor Impacting Traffic Volume along Shared-Use Paths Corridors Regional Calculation of Bicycle and Pedestrian Miles of Travel Conclusions References... 50
6 List of Tables Table 1 Shared-Use-Path Count Stations Table 2 Land-Based Weather Stations in Chittenden County, Vermont Table 3 Cluster-Seasons Found for Burlington, Vermont Table 4 BP Network Classification by Roadway Functional Class Table 5 BP Network Classification by Residential Density Table 6 BP Network Classification by Clustered Land-Use Table 7 BP Network Classification by Land-Use Activity Code Table 8 BP Network Classification by Total Destinations Table 9 BP Network Classification by Census-Based Residential Density Table 10 BP Network Classification by Link-Attractiveness Index Table 11 County-Wide Representation of Land-Use for Each Count Station Used in Shared-use Path Analysis Table 13 Summary of the Distribution of Land-Use Clusters Table 14 Shared-Use-Path Count Station, Land-Use and Network Mileage Representation Table 15 Link-Based Count Locations Spatial-Gap Assessment Table 16 Proposed New Link-Based Count Locations Table 17 Aggregation of Land-Uses from Origins and Destinations for Existing Multi-Day Counts 40 Table 18 Aggregations of Land-Uses from Origins and Destinations for Existing and Proposed Multi-Day Counts Table 18 Tuesday Adjustment Factors for BURL02B Table 19 Annual BPMT Calculated for All Link-Classification and Temporal-Aggregation Systems47 List of Figures Figure 1 Project Study Area Figure 2 Link-Based Bicycle and Pedestrian Counts Used in this Study, Figure 3 Count Locations Used in Burlington Figure 4 Shared-Use Paths in Chittenden County Figure 5 Patterns in Weekly Counts at Full-Year Count Sites Figure 6 Normalized Daily BP Volumes for Full-Year Count Locations Figure 7a Daily Distribution of Non-Motorized Travel for a Saturday, a Sunday, and an Average Weekday at Station No Figure 8 Grid-Cell Cluster Analysis Results near Shared-Use Paths Figure 9 Proposed New Non-Motorized Travel Count Locations Figure 10 Closed-Circuit Digital Video Camera Used for Video Counts Figure 11 Pyroelectric Sensor Functional Diagrams... 42
7 1 Introduction and Objectives Encouraging travelers to walk and bicycle in lieu of motorized modes of travel benefits both the traveler and the community at large. The traveler benefits from health improvements that have been shown to accompany increases in physical activity that can in turn reduce health-care costs on a larger scale. The community benefits from the reduced congestion and emissions associated with automobile travel. Even so-called recreational walking and bicycling can provide the same benefits for the individual and if they replaced recreation that involved driving provide transportation system benefits as well. Bicycling and walking have also been associated with economic development, including but not limited to tourism. Maximizing these system benefits is critically important for the state and municipalities, especially when funding for transportation is scarce. In order to make better funding decisions for non-motorized transportation infrastructure, it is first necessary to understand comprehensively the walking and bicycling behavior of a region s inhabitants. With this understanding, current walking and bicycling behavior can be estimated throughout the region, programs to increase levels of non-motorized travel can be pursued and the return on investment in non-motorized infrastructure can be assessed. A comprehensive understanding of non-motorized travel behavior requires an understanding of its relationship to the built environment. Many researchers have focused their attention on improving our understanding of the relationship between the built environment and non-motorized travel. However, few of these studies support this connection in a region with a spectrum of urban to rural communities, where the effects of spatial dependency and land-use impacts are poorly understood. Bicycling and walking are typically assumed to be urban modes of travel and moreover, existing research has focused on these modes in urban settings. Estimates of vehicle-miles of travel (VMT) are used extensively in transportation planning, policy and research. These estimates are used for infrastructure planning, for funding-allocation decisions, as measures of crash and incident exposure, access and economic activity, and to calculate vehicle emissions and energy use. The lack of comparable estimates of bicycle and pedestrian miles of travel (BPMT) creates a lack of information for policymakers to use for funding, planning and managing non-motorized travel. The Bureau of Transportation Statistics (BTS) has identified the systematic, methodologically consistent collection of non-motorized travel data, including estimation of annual average daily bicycle and pedestrian volume (AADBPV) and total bicycle and pedestrian miles of travel (BPMT), as a priority for improving infrastructure and safety analysis (BTS, 2000). The overall objective of this project is to advance these non-motorized travel data methods and procedures focusing on a study area in Chittenden County (Burlington) VT. The first results of this study examined the hourly distributions of non-motorized traffic data along shared-use paths in Chittenden County, Vermont and investigated the probable linkage between daily totals, hourly distribution signatures, and surrounding land-use. The goal was to pursue more robust data collection and methods to generate county-wide shared-use path BPMT. 5
8 Subsequent analysis focused on estimating county-wide BPMT with the existing shared-use path counts as well as new count data on roads. We proceeded to fill data gaps using video data collection which is described in detail and to test a variety of link-classification methods and temporal-aggregation methods for calculating total BPMTs based on sources of data collected from throughout the study area. The outcome of the project are 16 separate annualized BPMT estimates for Chittenden County, Vermont calculated using the Traffic Monitoring Guide standard AADT calculation methodology (FHWA, 2001). These BPMT estimates were calculated using eight different methods for categorizing network links, two different methods of categorizing days of the week, and two different methods of representing the seasons of the year. There is considerable uncertainty regarding the best methods for grouping network links so using eight different classification systems helps illuminate the impact that these groupings have on regional BPMT estimates. Finally, these count-based BPMT estimates are compared to a surveybased BPMT estimate calculated from the 2009 National Household Travel Survey (NHTS) (FHWA, 2009). The total BPMT in Chittenden County from the NHTS was calculated to be 31.3 million miles per year. 6
9 2 Background A critical goal of studies related to New Urbanism and Smart Growth is to increase levels of non-motorized travel (walking and bicycling) in neighborhoods and communities (Katz, 2004). Encouragement of non-motorized travel is critical not only for its own sake, but to reinforce the use of transit systems, since most transit trips include a walking or bicycling trip at both ends. In addition to serving as an alternative to motorized traffic and its environmental, energy and social costs, nonmotorized travel has also been at the center stage for promoting healthy living. In a recent cycling and walking study (Zahran et. al., 2008) utilizing nationwide countybased data, the authors pointed out the spatial distribution of cycling and walking commute trips is positively associated with population density, natural amenities, education, wealth and estimates of local civic concerns. Other studies have focused on the association between land-use, including zoning and physical characteristics, and non-motorized travel. Rodriguez and Joo (2004) examined the connection between non-motorized mode choices and builtenvironment-based variables, while considering typical modal characteristics. Local topography and sidewalk availability have been demonstrated as important to the attractiveness of non-motorized modes. Guo et. al. (2007) assessed the effects of the built environment on motorized and non-motorized trip-making. They concluded that very few built-environment factors would successfully lead to substitution of motorized travel by non-motorized modes. However, they argued that increases in bikeway density and the connectivity of the street network would have the best potential for doing so. Cervero and Kockelman (1997) found that density, land-use diversity, and pedestrian-oriented design significantly encourage non-motorized travel, although the impacts appeared fairly marginal. Frank and Engelke (2001) showed that grid street networks can promote bicycling and walking activities by reducing trip distances, offering alternative pathways, and slowing motorized travel. Cervero and Duncan (2003) found that, although personal and household factors were most significant, land-use and street connectivity in San Francisco also had a moderate effect on promoting short non-motorized trips. More studies use the connection between non-motorized travel and improved physical health to support their research. Frank et al. (2005) found that measures of land-use, residential density, and intersection density in Atlanta were positively associated with daily minutes of moderate physical activity. Aytur et al. (2007) found that North Carolina communities designed for active transportation had the strongest influence on non-motorized travel levels among lower-income individuals. Cervero et al. (2009) found that street density, connectivity, and proximity to cycling lanes are essential to physical activity while land-use mixtures not. Other studies attempted to address the relationship between pedestrian travel and environmental variables. Liu and Griswold (2007) demonstrated that pedestrian volumes can be reasonably estimated by environmental factors given appropriate measurement and geographical scale. Aultman-Hall et al. (2009) investigated pedestrian counts in Vermont to identify the influential factors for volume variability, and their models indicate weather and season diminish aggregate walking levels by a moderate amount. 7
10 Fewer researchers have been able to use location-specific counts to yield progress in non-motorized travel estimation at a microscopic scale. Pulugurtha and Pepaka (2008) studied the pedestrian counts collected at 176 intersections in the City of Charlotte, North Carolina and developed models predicting pedestrian activity using factors ranging from demographic characteristics to land-use characteristics. Their study results showed that urban residential density has the most significant impact on pedestrian activity at intersections. Using pedestrian crossing volumes at intersections, Schneider et al. (2009) created a pilot model that shows that number of jobs, number of retail properties, total population, and presence of a regional transit station close to an intersection are significant factors. Pucher et al. (2011) reviewed trends in bicycling levels, safety, and policies in North America, using national aggregate and city-specific data. They found a high degree of spatial variation and socioeconomic inequality in bicycling rates. While it is generally accepted that non-motorized travel varies with location, land-use, time-of-day, and season, robust patterns have not been characterized. Moreover, the range of landuse and spatial characteristics is often overlooked or over-simplified when selecting locations for the non-motorized traffic counts. Instead, researchers and planners often default to collecting data in the most traveled locations. The relationships between temporal patterns and spatial patterns have not fully been studied and the full range of data to consider these relationships has not been collected. In spite of the growing recognition of the importance of non-motorized travel, estimates of BPMT are rarely calculated. One of the primary obstacles to calculating BPMT values is the expense of collecting bicycle and pedestrian (BP) counts (Hocherman et. al., 1988; Greene-Roesel et. al., 2007). Because pedestrian movement is less restricted than vehicle movement and because pedestrians may move in closely overlapping groups, the counting process is more difficult to automate then it is for vehicles (Hocherman et. al., 1988). Newer pneumatic and infrared equipment works well in some settings but is not well suited to all outdoor environments (Greene-Roesel et. al., 2008). Consequently, BP counts remain more dependent on expensive manual data collection and continuous count data is scarce. Continuous counts that are available tend to focus on more highly traveled paths in more bicycle- and pedestrian-friendly towns, biasing volumes high and leaving significant spatial gaps, as found in this study. These temporal and spatial shortcomings present two distinct challenges for BPMT calculations. First, in the absence of continuous count data, it is difficult to develop adjustment-factors that accurately account for season and weather-related variations in non-motorized traffic. While researchers have developed extrapolation techniques based on short-duration counts, these extrapolation measures generally focus on converting hourly counts to daily (Schneider et. al., 2009; Soot, 1991; Davis et. al., 1988) or weekly BP volumes (Schneider et. al., 2009) and most do not provide annual BPMT estimates. Second, the lack of diversity in count locations makes it difficult to create link classifications that accurately reflect BP patterns over a whole region, especially in more rural regions. As a result, researchers often assume negligible or even no non-motorized traffic in outlying areas and the defensibility of region-wide estimates is compromised (Hammond and Elliott, 2011). 8
11 3 Study Area The study area for this project is Chittenden County, Vermont, the planning region for the Chittenden County Regional Planning Commission (CCRPC) (see Figure 1). The CCRPC area includes a 62-square-mile urban area that contains Burlington, the largest city in Vermont. It is bounded to the west by Lake Champlain and to the east by public lands in the Green Mountains. Chittenden County has the largest population and employment in the state, with approximately 150,000 residents (of approximately 620,000 in Vermont) and more than 100,000 jobs. Like most regions in the country, the urban core has spread into neighboring municipalities and now includes a suburban development pattern around the outskirts of Burlington. Vermont ranks high for its prevalence of walking and bicycling as a mode of transportation for commuting ( with a 12% overall mode share (Conger at. al., 2013) and Chittenden County s rate of walking bicycling is amongst the highest in the state, at nearly 17% of its daily person-trips per household (FHWA, 2009). 9


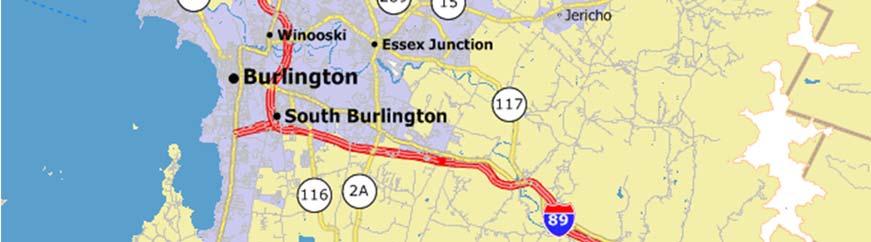
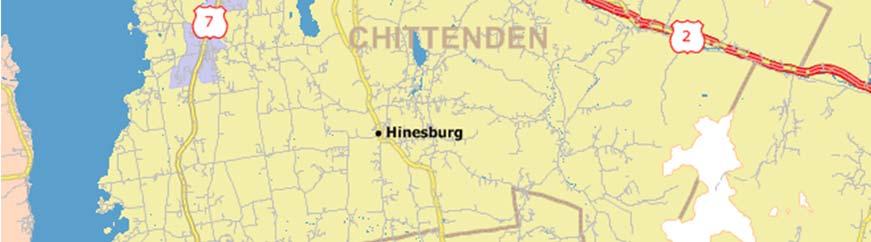
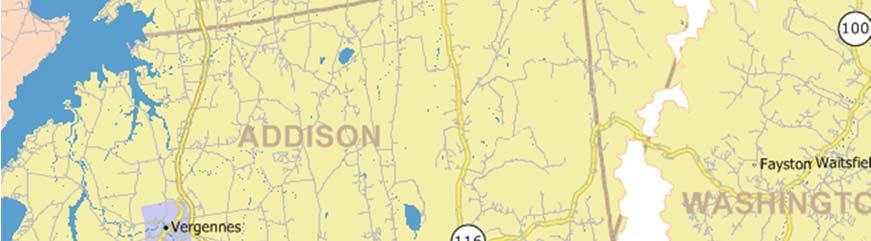
12 Figure 1 Project Study Area 10


(see Figure 2).")
13 4 Data 4.1 Link-Based Non-Motorized Traffic Counts This project utilized bicycle and pedestrian counts collected between 2007 and 2013 from shared-use paths and road shoulders at a total of 62 locations throughout the County using pyroelectric infrared sensors (collected by CCRPC) and closed-circuit digital video camera (collected by the research team)(see Figure 2). Details of the video data collection procedures are described in Appendix A through C. 11 Figure 2 Link-Based Bicycle and Pedestrian Counts Used in this Study,
14 The pyroelectric sensors detect the infrared emitted by the human body allowing multiple people to be counted individually even if they are close together. An infrared sensor by EcoCounter was employed at all stations to collect combined pedestrian and bicycle count data. The device was capable of collecting bidirectional bicycle and pedestrian traffic, although only total counts (bicycle + pedestrian volume) were used in this study. The device's sensor detects the infrared radiation emitted by each person who passes by it, and the sensor's narrow profile further enables it to count two or more people following closely to one another (Bell, 2006). A previous study (Aultman-Hall et. al., 2009) utilizing counts collected by this type of counter indicated an accuracy level of 98% when compared to manual counts. At the start of the project for the link-based hourly distribution analysis, infrared counts from 9 locations along paths in the Burlington area were used, because those were the only long-term counts available at the time. This existing count data (before 2009) was more plentiful (Figure 3) and was counted over multiple days and months (Table 1). Count stations were located on the shared-use paths with biases toward (1) locations with anecdotally higher non-motorized travel, and (2) locations with higher maintenance costs such as bridges. However, the relatively large dataset allowed travel on weekdays, Saturdays, and Sundays to be considered separately for shared-use paths. Table 1 lists the nine shared-use path countstations used in the first part of this study, with the number of weekday, Saturday, and Sunday counts that were available at the time. In total, 265 days of nonmotorized traffic volumes were used in analysis of hourly distributions on shareduse paths in section 6.1. All of these counts included at least 7 consecutive days. The later digital video data was collected over periods of 1 to 3 days and manually reviewed at a desktop computer to count cyclists and pedestrians. The use of motion sensitivity and high-speed playback limited the amount of time needed to review the video data. 12


15 Figure 3 Count Locations Used in Burlington 13
16 Table 1 Shared-Use-Path Count Stations Path Name Island Line UVM Kennedy Drive Downtown MPO ID COLC 03 BURL 07 BURL 04 BURL 01 BURL 11 SOBR 04 SOBR 06 SOBR 08 BURL 02 Count Duration June 11 August 18, 2008 July 3 - July 31, 2007 August 20 - September 23, 2008 May 3 - May 20, 2007 August 5 - September 1, 2008 July 26 August 3, 2008 Sep 2 Sep 30, 2008; May 1 - May 26, 2009 July 12 - July 24, 2008 April 26 - May 27, 2007 Weekdays Saturday Sunday Holiday For the ultimate calculation of BPMT, count locations shown in Figure 2 were used. This included the original 9 shared-use path stations as well as additional infrared locations counted by the CCRPC during the first stage of the project. However, the team collected digital video data at 23 road shoulder locations selected based on the spatial distribution and representativeness of the infrared count locations. The supplemental set of count locations filled critical missing data gaps needed to calculate reliable BPMTs in the study region. Locations with full-year counts (N=14) were required to create seasonal adjustment factors using the methodology recommended by the FHWA (2001) for calculating BPMTs. 14
17 4.2 Land-Use Data In order to assess the relationship between surrounding land use and non-motorized traffic volumes, several types of land use data were used. Parcel-level data is available from the CCRPC, and each parcel is associated with a Land-Based Classification Standard (LBCS) Activity Dimension provided by the American Planning Association: 1000 Residential activities 2000 Shopping, business, or trade activities 3000 Industrial, manufacturing, and waste-related activities 4000 Social, institutional, or infrastructure-related activities 5000 Travel or movement activities 6000 Mass assembly of people 7000 Leisure activities 8000 Natural resources-related activities 9000 No human activity or unclassifiable activity The parcel activities were clustered into a smaller group of seven categories: Residential (includes residence and accommodation) Agricultural (includes agriculture, forestry, fishing and hunting) Recreational (includes arts, entertainment, and recreation) Commercial (includes general sales and services) Public institutional (includes public administration and education) Transportation (includes transportation, communication, information, and utilities) Others (includes all other land-uses) The residential and agricultural clusters occupy the highest proportion of area in Chittenden County, both exceeding 30 percent. The next highest categories are public institutional and recreational, together comprising 20 percent of the total. Commercial land use types were concentrated in the Burlington urban area. Household density and the presence of other destinations were deemed relevant measures of bicycle and pedestrian origins and destinations near count sites. Housing/dwelling unit information from the CCRPC was developed in 2005 from the residential parcel records for Chittenden County. Each housing point in this dataset represents a housing structure in Chittenden County. For each housing structure, 15
18 attributes indicating the type of structure are included, along with the number of dwelling units (DUs) represented at the point. The dataset is intended to identify the location and type of dwelling unit for land-use and transportation forecasting efforts. Residential density is used at the Census-block level from the 2010 US Census by dividing the number of households in each block by the area of the block. Other destinations in the study area were taken from the Vermont E911 database and geographical information system (GIS), which consists of the location and functional classification of each habitable structure in the state. The Vermont E911 data includes residential locations (single-family, multi-family, seasonal, and mobile homes) and non-residential locations (commercial, industrial, educational, governmental, health-care and public gathering). Vermont is unique in that this E911 database is publicly available to support emergency-response personnel statewide via the Vermont Center for Geographic Information (VCGI). 4.3 The Non-Motorized Travel Network of Streets, Shared-Use Paths, and Sidewalks One of the most complete sources of street mapping for the entire United States is the US Census Topologically Integrated Geographic Encoding and Referencing system (TIGER) line layer. The 2012 TIGER layer for Chittenden County was used in this research. The TIGER data includes the following Census Feature Class Codes: Above A49: Vehicular trails and minor streets A41, A43, A45, A49: Local, neighborhood, and rural roads A31, A33, A35, A39: Secondary and connecting roads A21, A23, A25, A29: Primary roads without limited access A11, A15, A17, A19: Primary highways with limited access GIS layers showing the line locations of shared-use paths and sidewalks throughout Chittenden County were received from the CCRPC. Original locations of paths and sidewalks were provided to the CCRPC by the individual municipalities in Chittenden County. Speed limits were used to develop the link attractiveness index for the BPMT procedure (section 6.3). Speed limits were taken from the CCRPC Regional Travel Model or estimated based on Census feature class for roadways not in the Model. Total roadway widths were taken from the Highway Performance Monitoring System (HPMS) for Vermont. The HPMS is a national-level highway information system that includes data on the extent, condition, performance, use and operating characteristics of the nation s highways. The HPMS contains administrative and extent-of-system information on all public roads in each state. 16


19 Figure 4 Shared-Use Paths in Chittenden County The shared-use path network in the vicinity of the original 9 count locations is shown in Figure 4. The Island Line Trail runs through Burlington and to the north and south along the Lake Champlain shoreline. It traverses primarily residential and recreational land-use areas, including count locations BURL11, BURL01, BURL04, BURL07, and COLC03. The UVM Trail goes from Route 7, a major multilane arterial which serves as a critical link for north-south motorized traffic, along the eastern edge off the UVM campus parallel to I-89. This trail includes count location SOBR04 and is surrounded by tree-cover and farm areas on the UVM campus. The Kennedy Drive Trail runs parallel and adjacent to the entire length of the 4-lane arterial Kennedy Drive. It includes count location SOBR 06 and SOBR08 and is separated from the road by a 5-foot-wide green-strip. The fourth path is a short pedestrian and bicycle path that connects large downtown residential and hotel buildings to the Burlington s commercial center where BURL02 is located. 17
20 Critical to considering land use and its relationship to count volumes is the imposed lack of entry/exit points in some of the path corridors. The entry/exits to/from the paths were identified with the assistance of aerial photos and on-site visits. The majority of the access points along the paths are at their intersections with local roads. These access points along the shared use paths were critical to the accurate assessment of the land-uses associated with non-motorized travel, since access to land-use is controlled by these points. Note that path corridors like the Island Line Trail and the UVM Trail have fewer access points than paths in road corridors that parallel adjacent roadways such as the Kennedy Drive Trail. The network of shared-use paths was merged with the network of all streets and roadways in Chittenden County in order to provide network for non-motorized travel. Highways and ramps where non-motorized travel is prohibited were removed from the merged network, as were streets that are accompanied by a shared-use path. Other line segments in the 2012 TIGER layer with feature class A50 and higher were also removed from the network. These segments consisted of access ramps, vehicular trails and minor streets where non-motorized travel is either prohibited or the streets are privately owned. In addition, streets with a sidewalk on at least one side of the road were flagged to indicate their increased attractiveness for non-motorized travelers. Shared-use paths in the County were re-categorized for this study as road corridors paths and path corridors. Path corridors are those that are not adjoining and parallel to a roadway. Road corridor paths are those that run alongside a roadway, thereby providing an alternative to the traditional sidewalk. This new categorization recognizes potential differences in travel behavior on shared-use paths that run alongside a roadway and those that do not. Presumably, shared-use paths that run alongside a roadway are meant to replace the traditional sidewalk for pedestrians, but to also provide an alternative place for cyclists. However, cyclists may still have the option of travelling on the roadway. On a recreational shared-use path, both cyclists and pedestrians are travelling only on the path itself, and they are likely to encounter fewer motor vehicles. Therefore, making this distinction is critical to the calculation of BPMTs. 4.4 Weather Data Weather information was used to categorize days of the week and to represent seasons of the year in the study area. For estimation of BPMT, the research team intended to test use of a day-of-week categorization that distinguished between days when it was raining or snowing and days when it was not. In order to make this distinction, precipitation data for every count-day to be used in the BPMT calculation was needed. To obtain daily precipitation data, the team queried the Global Historical Climatology Network Daily (GHCN-D) database. GHCN Daily is a composite of climate records from numerous sources that were merged and then subjected to quality assurance reviews. The archive includes over 40 meteorological elements including temperature daily maximum/minimum temperature, temperature at 18
21 observation time, precipitation, snowfall, snow depth, evaporation, wind movement, wind maximums, soil temperature, and cloudiness. Containing observations of one or more of the above elements at more than 40,000 stations that are distributed across all continents, the dataset is the world's largest collection of daily climatological data. The GHCN-D was accessed through the National Climatic Data Center s query tool for each of the land-based weather stations in Chittenden County, which are shown in Table 2. Table 2 Land-Based Weather Stations in Chittenden County, Vermont ID Town Start End Coverage US1VTCH0020 Burlington % US1VTCH0005 Burlington % USW Burlington % US1VTCH0003 Charlotte % USC Essex Junction % USR0000VESS Essex Junction % US1VTCH0015 Huntington % US1VTCH0007 Huntington % US1VTCH0012 Huntington % US1VTCH0019 Jericho % US1VTCH0013 Richmond % US1VTCH0006 South Burlington % US1VTCH0004 Underhill % US1VTCH0011 Underhill % US1VTCH0009 Underhill Center % The precipitation data (in inches of rain or snow per day) was extracted for every link-based count-day in this study, at every monitoring station for which the countday was available. In order to represent the seasons of the year, daily average values were used for the Burlington International Airport monitoring station for temperature (degrees F), rainfall (inches of rainfall per day), snowfall (inches of snowfall per day), and wind speed (mph). The precipitation data (in inches of rainfall or snowfall per day) extracted for the third objective of this study was initially reduced to a binary variable identifying whether significant precipitation had occurred or not. A significant precipitation day was determined to be any day when more than 0.1 inches of precipitation (in rainfall equivalent) was measured. Next, each count-day was assigned a binary value (a rainy/snowy day or not), by first checking to see if the nearest weather station to the count location included data for the count-day. Note in Table 2 that only the weather station at Burlington International Airport covers the entire range of count-days in this study. If the nearest weather station included data for the count-day, the binary assignment for that weather station was assigned to the count-day at its location. If the nearest weather station to the count location did not have data for the count-day, then the binary assignment for the weather station at the Burlington International Airport (which includes every count-day in the data set) was assigned to the count-day at that location. This method ensured that the best possible rainfall information was used to assign each count-day a binary designation as a rainy day or not. 19
, snowfall (inches of snowfall per day), and wind speed (mph). The daily data was aggregated to the week for all 52 weeks of the average year in Burlington.")

22 In order to represent the seasons of the year, daily average values were used for the Burlington International Airport monitoring station for temperature (degrees F), rainfall (inches of rainfall per day), snowfall (inches of snowfall per day), and wind speed (mph). The daily data was aggregated to the week for all 52 weeks of the average year in Burlington. A k-means cluster analysis was used with the weekly averages to identify clustered-season aggregation periods as characterized by clustered weather patterns. Before performing the cluster analysis, the annual distributions of these weekly total counts were plotted and reviewed to identify any obvious patterns. This plot is in Figure 5. The solid lines on the chart were added to qualitatively identify temporal sequences that appeared to trend with the data. As expected, these divisions seem to coincide with significant climate changes throughout the year in Chittenden County. Figure 5 Patterns in Weekly Counts at Full-Year Count Sites The four-cluster analysis resulted in a total of six breaks in the year, where significant shifts took place, and the cluster assignment shifted accordingly. Therefore, the analysis was repeated using six clusters, once again resulting in six seasonal shifts four of which corresponded with the breaks identified in the fourcluster analysis. These results suggest that there are actually six significant changes in climate throughout an average year in Burlington, Vermont. These cluster-seasons are summarized in Table 3. 20
23 Table 3 Cluster-Seasons Found for Burlington, Vermont Week of the Year Cluster Start End Months Included Part of November, December January, February, and most of March Part of March and April Most of May Part of May, June, July, August, and September Most of October Part of October and most of November Each of the qualitative separations shown in Figure 5 coincided with a cluster transition found. Two additional separations created by the six clusters summarized in Table 3 are shown in Figure 5 as dashed lines. These clustered-seasons represent an alternative temporal period for calculating adjustment-factors to the traditional monthly period prescribed in the TMG (FHWA, 2001). 21
24 5 Data Preparation 5.1 Link-Based Non-Motorized Traffic Counts Of primary interest in the first part of this study was not only the total daily volumes of non-motorized users on shared-use paths, but also the hourly distribution throughout the day. In a study assessing impact of weather and season on pedestrian volume conducted by Aultman-Hall et. al. (2009) utilizing year-round continuous hourly pedestrian counts at a sidewalk in downtown Montpelier, Vermont, the authors found consistency in some types of daily distributions. Aultman-Hall et. al. (2009) also found that during winter time the overall pedestrian volume reduced by 16%. To avoid any discrepancy caused by these seasonal impacts, this study includes only travel in milder-weather months of May through September. Holidays were removed from the data unless they occurred on weekends, in which case they were included as a weekend day. Ultimately, all linkbased counts that exceeded 24 continuous hours were considered part of the data set. The CCRPC also collects partial-day link-based counts at other locations throughout the County. However, to avoid the need to make time-of-day adjustments, these partial-day counts were not used in this study. Figure 6 shows daily BP volumes for each day of the year for each of the full-year count sites before the removal of outliers. In the figure, the counts have been normalized so that the AADBPV at each site is equal to one. Counts at the same sites on the same day of the year, e.g. January1, 2009 and January 1, 2010 at SOBR06, were averaged prior to normalization. 22
25 Figure 6 Normalized Daily BP Volumes for Full-Year Count Locations Full-year counts are required to create seasonal adjustment factors using the methodology recommended in the TMG (FHWA, 2001). While the TMG recommends using count data only from the year for which total miles of travel are being calculated, that requirement is infeasible for BP counts. Others suggest that temporal adjustment factors in areas with relatively little development can be applied over multiple-year periods (Greene-Roesel et. al., 2007). Ideally these full-year continuous counts would be available for each link type in the study area and for the entire year when the miles of travel are being calculated, these levels of spatial and temporal coverage are infeasible. So a single set of adjustment factors was created from the three sites available and applied to all count sites regardless of link type for all of the years used in the study. This aggregation is supported by the yearly patterns for all full-year sites shown in Figure 9. On this basis, we assumed that count data from all years (2007 to 2013) at the full-year sites could be used to calculate adjustment factors for the entire study area. 5.2 Link and Count Site Classification Given a representative set of BP count locations with an equal number of counts at each location, the average of the AADBPVs from each count location would provide an unbiased estimate of the true AADBPV across the study area. Multiplying this 23
26 average AADBPV value by the total miles in the BP network and by 365 days of the year would yield an unbiased estimate of the annual BPMT. However, if the number of counts is unequal across the count locations or if these locations are not representative, this process will produce a biased (and inaccurate) BPMT estimate. Bias can be reduced if count locations are classified such that sites with similar BP volumes are grouped together and separate BPMT estimates are calculated for each portion of the BP network that falls into each category in the classification system (FHWA, 2001). Because roadway type, residential density (Greene-Roesel et. al., 2007) and land-use (Schneider et. al., 2009; Greene-Roesel et. al., 2007) have been identified by other researchers as drivers of variation in BP volumes, this study used classification systems based on these characteristics. BPMT values were also calculated without any classification of the count sites to show the effect of the biases described above ROADWAY TYPE FUNCTIONAL CLASS The first classification system categorized count locations based on the Census Feature Class Code of the road link adjacent to the count location or as path corridor for those count locations that are not adjoining a roadway. This system included four categories: Path corridor Local, neighborhood, and rural roads Secondary and connecting roads Primary roads without limited access The path corridor category consisted of all shared-use paths that do not run alongside any portion of the roadway network. Path corridors make up less than two percent of the BP network but have the highest AADBPV of any category in the system and therefore contribute disproportionately to the BPMT total. The number of counts taken in each of these four categories and the total BP network miles in each category are shown in Table 4. Table 4 BP Network Classification by Roadway Functional Class Category No. of Count Locations No. of Count- Days BP Network Miles Path Corridors Local, neighborhood, and rural roads Secondary and connecting roads Primary roads without limited access Totals 28 2,
27 5.2.2 RESIDENTIAL DENSITY DWELLING UNITS IN THE GRID CELL The next classification system categorized links and count locations based on the residential density within the grid cell where it was situated. Residential and commercial densities are two of the factor grouping methods recommended in (Greene-Roesel et. al., 2007). Residential densities were determined by the number of DUs in each of the 0.3-mile grid cells used to cluster land-uses described below. Low residential density links were defined as those links in grid cells with fewer than 100 dwelling units per square mile. Links in grid cells with between 100 and 500 dwelling units per square mile were defined as medium density while those with more than 500 dwelling units per square mile were defined as high density links. The number of counts taken in each of these categories and the total the BP network miles in each category are shown in Table 5. Table 5 BP Network Classification by Residential Density Category No. of Count Locations No. of Count- Days BP Network Miles Low Residential Density Medium Residential Density High Residential Density 11 1, Totals 28 2, LAND USE LAND USE OF THE GRID CELL AND SHARED USE PATH AVAILABILITY For the first land-use-based classification system, count locations were categorized based on a combination of the clustered land-use category of the grid cell and whether BP infrastructure available at the location. Because of the high number of counts on shared-use paths and the relatively high BP volumes on these paths, count locations were subdivided into those with a shared-use path available and those without. The number of counts taken and the total BP network miles that are in each category in this classification system are shown in Table 6. Table 6 BP Network Classification by Clustered Land-Use Category No. of Count Locations No. of Count- Days BP Network Miles Agricultural with shared-use path Agricultural without shared-use path Mixed-use with shared-use path 7 1, Mixed-use without shared-use path Public-institutional with shareduse path Public-institutional without shared-use path Shared-use path corridor
28 Category No. of Count Locations No. of Count- Days BP Network Miles Recreational without shared-use path Residential with shared-use path Residential without shared-use path Totals 28 2, LAND USE MODE OF PROXIMATE LAND USE ACTIVITY CODE Following the initial calculation of BPMTs (Dowds and Sullivan, 2011), a revised classification system based on land-use Activity code from the LBCS for parcels instead of grid cells was developed. For this system, the distribution of Activity codes of parcels within 2,500-feet of the count location were collected and the code that was most common (the mode) was assigned to the count location. This initial data set included only three Activity codes 1000, 2000, and Therefore, the Activity codes that could be selected for each of the links in the BP network were limited to these three. The most common of these three codes within 2,500 feet was assigned to each network link. The number of counts and the total BP network-link miles for each category in this classification system are shown in Table 7. Table 7 BP Network Classification by Land-Use Activity Code Category No. of Count Locations No. of Count- Days BP Network Miles 1000 Residential activities 37 2, Shopping, business, or trade activities Natural resources-related activities Totals 41 3, Note that the number of count locations and count-days available in the data set had increased significantly by the time this second phase of BPMT counts was being developed. In addition, a more refined and updated version of the roadway network was used, and the BP network was measured at only 1,592 miles (as opposed to 1,595 miles previously). This discrepancy is not expected to affect the comparison classification systems in the results of the BPMT calculations LAND USE TOTAL DESTINATIONS A land use classification method that took advantage of available destinations was developed. For each count location or link, the sum of the number of educational buildings within 1000 feet (from the E911 habitable structures layer), the number of all buildings within 2,500 feet (from the E911 habitable structures layer), and the number of intersections within 2,500 feet (from the topologically-corrected E911 roads layer) was taken as representative destinations. The distribution of these sums for the count locations was binned according to the Fisher-Jenks Algorithm 26
29 version of the optimal method of irregular class creation. This method is sometimes called Natural Breaks. Bins for classification are determined so that each category is a cluster of values that minimizes within-group variance. Three bins, corresponding to locations with a low, medium, or high number of destinations available, were created. Bin intervals and the number of counts and network-link miles for each category in this classifications system are shown in Table 8. Table 8 BP Network Classification by Total Destinations No. of Count Locations No. of Count- Days BP Network Miles Bin Interval (No. Category of Destinations) Low no. of destinations ,253.4 Medium no. of destinations 501 1, , High no. of destinations 1,701 6, Totals 41 3, RESIDENTIAL DENSITY HOUSEHOLDS IN THE CENSUS BLOCK The determination of residential density used in the first phase of the classification for the Dowds and Sullivan (2011) paper was improved in the second phase by taking advantage of the 2010 Census data that had become available. Household densities at the Census block level were assigned to count locations for the block where the count was located. For network-links, the density was calculated as an average of all the Census block densities adjoining the link. Three bins encompassing the range of household densities among the count locations were determined using the Natural Breaks method and both count locations and networklinks were assigned to these bins. Bin intervals and the number of counts and network-link miles for each category in this classifications system are shown in Table 9. Table 9 BP Network Classification by Census-Based Residential Density No. of Count Locations No. of Count- Days BP Network Miles Bin Interval Category (HHs per sq. mi.) Low density ,769 1,287.9 Medium density 901 2, High density 2,001 49, Totals 41 3,
30 5.2.7 ROADWAY TYPE NON MOTORIZED TRAVEL LINK ATTRACTIVENESS INDEX A new index, the link-attractiveness index (LAI) was developed to estimate the relative perceived safety and appeal of a roadway for walking and bicycling. The research team collecting video counts in more rural locations hypothesized that the experience of walking and bicycling was greatly affected by two factors, the total width of the roadway (shoulders plus lane widths) and the speeds of motorized vehicles on the roadway. Wider roads with wider shoulders were more appealing where no walking and bicycling infrastructure was available, and roadways where automobiles travelled faster were less appealing. In addition, team members felt that roadways where little or no shoulders or sidewalks were present were very unsafe. Based on these experiences, we proposed the LAI. For count locations, the LAI was measured using the total roadway width (all lanes plus shoulders) and the speed limit. Speed limits were taken from the CCRPC Regional Travel Model or estimated based on road class. Total roadway widths were taken from the HPMS for Vermont. Total roadway width (in feet) was divided by the speed limit (in mph), then normalized so that the resulting values fell between 0 and 1. Shared-use paths in path corridor were given LAI of 1. For line segments, total roadway width was not available for every road. Therefore, the LAI was calculated as described previously for all roadways that had a total roadway width in the HPMS. For roadways adjoined by a shared-use path or a sidewalk, the roadway width was doubled before the LAI was calculated, to reflect the increased attractiveness of roadways with dedicated walking and bicycling infrastructure. LAIs for roadways without HPMS widths were calculated as an average of connected roadways that already had an LAI. This process was conducted iteratively until more than 80% of the line segments had an LAI. The remaining set of links without an LAI and not adjoining any links with an LAI were spot checked on aerial photographs, and all of the spot-checked links were found to have an LAI between 0.05 and 0.25, based on whether a sidewalk was present. Based on this information, the remaining links were given a LAI of 0.05 if they did not have a sidewalk and a LAI of 0.25 if they did. Three bins encompassing the range of LAIs among the count locations were determined using the Natural Breaks method and both count locations and networklinks were assigned to these bins. Bin intervals and the number of counts and network-link miles for each category in this classification system are shown in Table 10. Table 10 BP Network Classification by Link-Attractiveness Index No. of Count Locations No. of Count- Days BP Network Miles Bin Interval Category (HHs per sq. mi.) Low LAI ,478.2 Medium LAI High LAI , Totals 41 3,
31 6 Methodology and Results 6.1 Land-Use as a Factor Impacting Traffic Volume along Shared-Use Paths Corridors In this part of the study, the research team was interested in the land-use types around the nine shared-use path count-stations being considered, how the land-use types affected the daily pattern in hourly non-motorized traffic volumes, and whether the land-use type was distinct from the range of land-use combinations found in the whole County. Many shared-use paths in Chittenden County do not have open access continuously along the trail. Therefore, users might be unaffected by the immediate surrounding land-use, but would instead be interested in the land-use at the access points. This assumption was made at all count stations except those in the Burlington downtown area, where access is more open. For example, a path used mainly for exercise or commuting which passes large agricultural lands is less related to that land-use type than shopping traffic in a downtown retail area. To account for these factors, at each non-motorized count location, the team identified the land-use at the nearest access points within a 1.5-km distance along the path from the count location. The probable connection between the hourly distribution at the count station and this land-use characteristic at the proximate access point was investigated. For each proximate access point, a 0.5-km square buffer was generated. The area for each land-use category in the buffer was assigned to the access point. Table 11 shows, for each count station, the total number of proximate access points, and the percentages of each land-use category represented in the buffer area. 29 Table 11 County-Wide Representation of Land-Use for Each Count Station Used in Shared-use Path Analysis Island Line UVM Kennedy Drive Down town Station no No. of access points Land-Use Residential 40% 40% 41% 9% 15% 19% 37% 38% 11% Commercial 0% 0% 0% 12% 8% 19% 7% 9% 34% Recreational 12% 12% 20% 17% 23% 5% 6% 1% 7% Public institutional 0% 0% 19% 2% 2% 5% 12% 5% 15% Agricultural 13% 13% 4% 2% 3% 20% 19% 30% 1% Transp. 8% 8% 10% 28% 16% 20% 5% 6% 25% Other 27% 27% 6% 30% 33% 12% 18% 11% 7%
32 As suggested previously, stations 7 and 8 on the Kennedy Drive Trail, have more access points than the rest of stations. Five (1, 2, 3, 7 and 8) of the stations have relatively high surrounding residential land-use. Others include a more balanced mix of land uses. Using the counts at each station, we developed average daily distributions of nonmotorized traffic for Saturdays, Sundays, and an average weekday. For any of the distribution types (Saturday, Sunday, or weekday) at a particular count station, the hourly percentages were computed based on average hourly volumes for that daytype normalized over the duration of counts: p ik ( N h ikn n1 ) / N ( N ni D ) / N in (1) Where pik stands for the average hourly percentage at hour k for day-of-week type i, hikn stands for hourly volume of hour k on day n for day-of-week type i, Din stands for daily volume on day n for day-of-week type i, and N is the count duration. The results of these calculations are illustrated in Figures 7a through 7i. To illustrate the strength of the distribution, the total daily counts are also provided. Figure 7a Daily Distribution of Non-Motorized Travel for a Saturday, a Sunday, and an Average Weekday at Station No. 1 30
33 Figure 7b Daily Distribution of Non-Motorized Travel for a Saturday, a Sunday, and an Average Weekday at Station No. 2 Figure 7c Daily Distribution of Non-Motorized Travel for a Saturday, a Sunday, and an Average Weekday at Station No. 3 Figure 7d Daily Distribution of Non-Motorized Travel for a Saturday, a Sunday, and an Average Weekday at Station No. 4 31
34 Figure 7e Daily Distribution of Non-Motorized Travel for a Saturday, a Sunday, and an Average Weekday at Station No. 5 Figure 7f Daily Distribution of Non-Motorized Travel for a Saturday, a Sunday, and an Average Weekday at Station No. 6 Figure 7g Daily Distribution of Non-Motorized Travel for a Saturday, a Sunday, and an Average Weekday at Station No. 7 32
35 Figure 7h Daily Distribution of Non-Motorized Travel for a Saturday, a Sunday, and an Average Weekday at Station No. 8 Figure 7i Daily Distribution of Non-Motorized Travel for a Saturday, a Sunday, and an Average Weekday at Station No. 9 While the nine sets of graphs show some differences in hourly non-motorized traffic patterns between weekdays and weekends, the differences are less than expected. In addition, a significant impact of accessible land-uses on non-motorized travel is not evident. Some evidence of distributional differences are evident when the number of access points is considered. The paths with fewer access points (stations 1 through 5) exhibit univariate distributions which are flattened on weekdays and more peaked on weekends. The paths with more access points (stations 6 though 8) have much more variable volume distributions throughout the day. However, the lack of a relationship between daily distributions and proximate land-uses may be an indication that a stronger and more robust measure of accessible land-use is needed. A new framework was developed which allowed us to consider the overall land-use patterns in the entire County in relation to the land-uses around the shared-use path count locations. A grid system was created dividing the entire County into 0.5- km square polygons. The total length of links in the non-motorized travel streetpath network was then computed for every each grid cell. Only the cells with nonzero length of links in the street-path network were carried forward. These grid cells covered 60% of the area of the county. A K-means clustering method was then adopted to categorize those non-zero cells into homogenous groups based on the land use categories within each. 33
36 K-means clustering method has been a popular data-mining tool in various fields after it was first introduced in 1967 (MacQueen, 1967). The non-zero cells each include a percentage of their cell area occupied by the different land-use categories in Table 2. The K-means cluster analysis was conducted to group cells by the relationship between their land-use category distributions. In the cluster analysis, the non-zero cells were partitioned into five clusters such that elements in the same cluster tends to be more similar than elements in different clusters. The aim of the K-means cluster algorithm is to classify a set of data points into K categories through the clusters defined a priori (MacQueen, 1967). The main idea is to define K initial cluster-centroids and then to relate the rest of the cells to these centroids depending on their Euclidean separation. First, the method assigns each data point to the nearest cluster center according to the Euclidean distance: C { c, c,..., c }, i1 i1 i1 i1 j 1 2 k c { x d( x, ) d( x, ),1 j, j k and j j} i1 i i ' ' j j ' j Once all points have been assigned to a cluster, the cluster-centroids are recalculated based on their assigned data points: i 1 j i x c i j xc j (2) Where C is the set of clusters c, d (x, i j) is the Euclidean distance between x and i j, c i j is the number of points in cluster j after the ith iteration, and i j is the centroid of cluster j after the ith iteration. The iterations continue until the cluster-centroids do not move. Following this procedure, the set of non-zero cells were grouped into five clusters based on the distributions of their six land-use percentages. The five clusters were named according to the mix of land-use categories they contained mixed-use, public institutional, residential, recreational, and agricultural. Table 12 contains a summary of the distribution of cluster-cells in the County, and the land-use mix that characterizes each cluster. 34 Table 12 Summary of the Distribution of Land-Use Clusters Cluster Name and Mix of Land-Uses by % Pub. Land-Use Category Mixed Inst. Res. Rec. Agr. Residential Commercial Recreation Public institution Transportation Agriculture


37 Cluster Name and Mix of Land-Uses by % Pub. Land-Use Category Mixed Inst. Res. Rec. Agr. Others No. of Grid Cells in Cluster No. of Stations in Cluster The bottom row of Table 12 shows the clusters for the 9 shared-use path count stations analyzed in this part. The iniquity in the cluster-representation indicated by this row may explain the similarity in the daily distribution patterns. Figure 8 illustrates the distribution of these cluster types in the vicinity of the shared-use paths. Figure 8 Grid-Cell Cluster Analysis Results near Shared-Use Paths Mixed-use clusters possess a relatively high concentration in the urbanized area which is more developed and economically active than the rest of the County. The 35
38 mixed-use cluster has the highest levels of commercial and transportation land-uses but also includes significant residential land-use. The public institutional cluster is represented by a high-level of public institution land-use, including school and government campuses. Similarly, residential, recreational and agricultural clusters, respectively, have their highest representative land-use categories as residential, recreational, and agricultural. Recalling that grids without any roads or trails have been excluded, one might expect there are additional agricultural and residential grids in the county with fewer institutional and recreational cluster. There are also a reasonable number of mixed-use areas. For ease of classification, the network-mileage within each grid-cell was grouped as either low (< 0.30 mile), medium (> 0.30, < 0.50 mile) or high (> 0.50 mile). A description of the new land-use cluster classification and the level of networkmileage for each count station is provided in Table 13. Table 13 Shared-Use-Path Count Station, Land-Use and Network Mileage Representation Path Name MPO ID Stn # Number of Access Points Network Mileage Land-Use Cluster COLC High Recreational BURL Medium Agricultural Island Line BURL High Recreational BURL High Mixed-Use BURL Low Mixed-Use UVM SOBR High Mixed-Use Kennedy SOBR High Public Inst. Drive SOBR High Mixed-Use Downtown BURL High Mixed-Use Still, the land-use cluster does not appear to have a relationship with the distribution of hourly non-motorized traffic shown in Figures 4a to 4i. The networkmileage represented by each count station is somewhat related to the hourly distributions, but not as much as the number of access points are. These results indicate that either (1) proximate land-use is not significantly relevant to the hourly distribution of non-motorized travel, or (2) the land-use cluster analysis is not an effective method of classifying proximate land-use. In fact, the hourly distribution may be most closely related to the total daily volume at each count station, indicating that an analysis which focuses on hourly distribution may need a minimum count volume for comparative statistical analyses. 6.2 Regional Calculation of Bicycle and Pedestrian Miles of Travel 36
39 The ultimate goal of the project was to create a robust data set of link-based nonmotorized traffic counts that would yield a robust calculation of total annual bicycle and pedestrian miles of travel in the study area RECOMMENDATION OF SAMPLE LOCATIONS FOR NON MOTORIZED TRAFFIC In order to calculate reliable estimates of BPMT, the research team was no longer only concerned with the hourly distributions of the data. Instead, this section of the analysis began with an assessment of temporal and spatial gaps in the entire existing set of multi-day counts of non-motorized travel in the County. The grid-cell clusters developed during the analysis of shared-use path count locations (section 6.1) were used to initiate the calculation of BPMT. However, due to the limited effectiveness of the land-use clusters a quality check of the grid-cell method considering specific origins and destinations of bicycle and pedestrian travel (instead of land uses) was necessary to ensure robust results for this analysis. To assess spatial gaps in the data, a cross-classification table was developed to group all of the non-zero grid-cells in the County by cluster-type and miles of walkbicycle network in the cell, as shown in the first three columns in Table 14. The representation of the 14 samples already collected is shown in the next three columns, and the number of samples remaining to be collected in order to improve spatial representation is shown in the last three columns. Table 14 Link-Based Count Locations Spatial-Gap Assessment Existing Classification Miles of Walk- Bicycle Classification of Existing Samples Miles of Walk- Bicycle Remaining Samples Needed to Match Existing Classification Miles of Walk- Bicycle Cluster Type low med high low med high Low med high Residential 13% 14% 15% Mixed-Use 4% 3% 8% 1 7** 1 Agricultural 15% 14% 6% Public- Institutional 1% 1% 2% 2* Recreational 2% 1% 1% 2 1 *Includes a full-year sample. In all, 18 new samples were proposed to improve spatial representation in the County. Grid-cells corresponding to each cluster-type / miles of network classification were selected at random from all of the grid-cells where samples do not already exist. The specific sample location within each selected grid-cell was positioned adjacent to the most central or primary street in the grid. A summary of the proposed new count locations is provided in Table
40 Table 15 Proposed New Link-Based Count Locations ID Street Name Town Classification Longitude Latitude Colchester Point Mixed-Use / TRC01 Colchester Road Medium TRC02 Crosswind Drive Charlotte Agricultural / Low TRC03 Bean Road Colchester Residential / High TRC04 Lion Heart Drive Milton Agricultural / Low TRC05 Schillhammer Road Jericho Residential / Low TRC06 Mount Pritchard Lane St. George Residential / Low TRC07 McClellan Farm Road Underhill Residential / Low TRC08 Poker Hill Road Underhill Residential / Medium TRC09 Sawmill Road Essex Residential / Medium TRC10 Middle Road Colchester Residential / Medium TRC11 Lake Road Milton Residential / High TRC12 Greenbriar Drive Essex Residential / High TRC13 South Brownell Road Williston Agricultural / Low TRC14 West Main Street Richmond Agricultural / Low TRC15 Main Road Huntington Agricultural / Medium TRC16 Bolton Valley Agricultural / Bolton Access Road Medium TRC17 Mountain View South Agricultural / Blvd Burlington High TRC18 McGee Road Essex Recreational / Low These randomly-selected new count locations are shown in Figure 9. 38


.")
41 Figure 9 Proposed New Non-Motorized Travel Count Locations To ensure adequate temporal representation, the full-year count set was also to be supplemented with new samples. Therefore, three of the 18 new locations were chosen for full-year counts. The remaining 15 locations were to be multi-day counts which include at least a full week, preferably two (to ensure that both weekend-days are represented). The three full-year counts were to be chosen from locations with the following classifications: Residential / Medium: TRC08, TRC09, or TRC10 39
42 Residential / High: TRC03, TRC11, or TRC12 Agricultural / Low: TRC02, TRC04, TRC13, or TRC14 These supplemental full-year counts would ensure that the four most common gridcell classifications (Residential / Medium, Residential / High, Agricultural / Low, and Mixed-Use / High) in the County are represented by full-year counts, and that a defensible seasonal assessment of non-motorized travel is possible. Currently, only one of these four classifications (Mixed-Use / High) is represented seasonally. The grid-cell method was validated by considering origins and destinations of bicycle and pedestrian travel. Appropriately-sized travel buffers were drawn around the existing multi-day count locations, and the expanded set of existing and proposed locations. Based on the findings of Jinyong et. al. (2009), walk and bicycle buffers of 0.62 miles and 2.50 miles, respectively, were used. Origins and destinations were collected from the E911 database. Using the E911 database, it is possible to aggregate the buildings within Chittenden County into a collection of eight land-use classes, as shown in the first column of Table 16. Table 16 Aggregation of Land-Uses from Origins and Destinations for Existing Multi-Day Counts Existing Multi-Day Counts Represent: Existing Total in the County Within Walking Buffer Within Bicycling Buffer % of % of % of Land-Use Class No. total No. total No. total Residential 50, % 8, % 24, % Commercial 3, % % 2, % Farm % % % Lodging % % % Industrial % % % Educational % % % Health Care % % % Recreation/Culture % % % An assessment of the potential origins and destination represented by the existing multi-day counts was made by counting the number of buildings within the buffers that fall into each land-use class. These totals are shown in the last four columns of Table 16. This assessment was repeated with buffers around the expanded set of existing and new count locations. The results of this assessment are shown in Table
43 Table 17 Aggregations of Land-Uses from Origins and Destinations for Existing and Proposed Multi-Day Counts Existing and Proposed Multi-Day Counts Represent: Existing Total in the County Within Walking Buffer Within Bicycling Buffer % of % of % of Land-Use Class No. total No. total No. total Residential 50, % 10, % 42, % Commercial 3, % 1, % 3, % Farm % % % Lodging % % % Industrial % % % Educational % % % Health Care % % % Recreation/Culture % % % Comparing the percentages represented by each land-use class from Table 16 to Table 17, it is clear that a substantial improvement in the coverage of origin- and destination-classes will be achieved with the addition of the new proposed count locations. In particular, representation of walking and bicycling activity around residential buildings improved more than 1%. Commercial origins and destinations, which are over-represented in the existing counts, are brought down to a level of representation that is much closer to that of the rest of the County. Representation of buildings in other land-use classes is improved as well. A final measure of the representation-error was calculated for this validation. By finding the average difference between the % of total columns for the Existing Total in the County, and each of the representations assessed, we can determine more precisely how the addition of the new count locations will fill spatial gaps in the data set. Overall, the average difference improved from 1.07% to 0.83% for walking, and from 0.61% to 0.19% for bicycling. These are substantial improvements, and will allow more defensible conclusions to be drawn about nonmotorized travel trend in the County. Once these new samples are collected, the result will be a more robust, heterogeneous data set for non-motorized travel modeling and exposure estimation RECOMMENDED COUNT DATA COLLECTION PROCEDURE FOR RURAL SAMPLE LOCATIONS The need for count data at rural sample locations was challenged by the lack of infrastructure at many of the locations selected - no sidewalks, narrow or absent shoulders, heavy, tall vegetation, and high vehicle speeds. Methods considered for collection of counts at these locations included the pyroelectric sensor, a pavementloop counter, a video camera in a parked vehicle, and a video camera mounted on a power pole. Given the limited shoulder width at several of the proposed location, the 41


44 video camera mounted on the power pole was determined to be most feasible method to provide consistency at all of the proposed locations. A closed-circuit digital video camera was purchased for obtaining rural BP counts. The camera featured motion sensitive activation, color infrared LEDs for night vision, a weatherproof metal housing, and amounting bracket (see Figure 10). The following guidelines were used to optimize the positioning of the camera relative to the roadway being counted: Figure 10 Closed-Circuit Digital Video Camera Used for Video Counts Orient the camera orthogonally to the roadway travel direction. Avoid obstructions in the foreground of the image Attach the camera to a power pole or tree that is far enough from the road so that objects on both sides of the road appear to move at a similar speed. Avoid intersections in the image Avoid locations where sunlight or reflective surfaces are directed into the camera Use of a video camera for data collection imposed a number of constraints on the data. In particular, due to the limited storage capacity and battery power of the camera system, full-week counts were not feasible. In lieu of full-week counts, 48- hour count periods were used but each location was counted for a 48-hour period including weekdays, and for a second 48-hour period including the weekend. The video camera, however, was also not feasible for the collection of counts at sites selected for full-year counts, due to the limitations on battery life and equipment security. The use of the pyroelectric sensor seemed impossible without also picking up the motorized vehicles on the roadway, since a separated path for motorized and non- Figure 11 Pyroelectric Sensor Functional Diagrams 42
Dowds and Sullivan 1 APPLYING A VEHICLE-MILES OF TRAVEL CALCULATION METHODOLOGY TO A COUNTY-WIDE CALCULATION OF BICYCLE AND PEDESTRIAN MILES OF TRAVEL
 Dowds and Sullivan 1 1 2 3 4 5 6 7 8 9 10 11 12 13 14 15 16 17 18 19 20 21 22 23 24 APPLYING A VEHICLE-MILES OF TRAVEL CALCULATION METHODOLOGY TO A COUNTY-WIDE CALCULATION OF BICYCLE AND PEDESTRIAN MILES
ADOT Statewide Bicycle and Pedestrian Program Summary of Phase IV Activities APPENDIX B PEDESTRIAN DEMAND INDEX
 ADOT Statewide Bicycle and Pedestrian Program Summary of Activities APPENDIX B PEDESTRIAN DEMAND INDEX May 24, 2009 Pedestrian Demand Index for State Highway Facilities Revised: May 29, 2007 Introduction
City of Elizabeth City Neighborhood Traffic Calming Policy and Guidelines
 City of Elizabeth City Neighborhood Traffic Calming Policy and Guidelines I. Purpose: The City of Elizabeth City is committed to ensure the overall safety and livability of residential neighborhoods. One
MONROE COUNTY NEW YORK
 MONROE COUNTY NEW YORK Intersection Accident Database Enhancement Project (UPWP 4380) FINAL January 2008 Prepared By: Prepared For: Bergmann Associates 200 First Federal Plaza 28 East Main Street Rochester,
o n - m o t o r i z e d transportation is an overlooked element that can greatly enhance the overall quality of life for the community s residents.
 N o n - m o t o r i z e d transportation is an overlooked element that can greatly enhance the overall quality of life for the community s residents. 84 Transportation CHAPTER 11 INTRODUCTION Transportation
INNER LOOP EAST. AIA Rochester Annual Meeting November 13, 2013 TRANSFORMATION PROJECT. Bret Garwood, NBD Erik Frisch, DES
 INNER LOOP EAST TRANSFORMATION PROJECT AIA Rochester Annual Meeting November 13, 2013 Bret Garwood, NBD Erik Frisch, DES Why? We are building a city that encourages walking, biking and enjoying the outdoor
Temporal and Spatial Variation in Non-motorized Traffic in Minneapolis: Some Preliminary Analyses
 Temporal and Spatial Variation in Non-motorized Traffic in Minneapolis: Some Preliminary Analyses Spencer Agnew, Jason Borah, Steve Hankey, Kristopher Hoff, Brad Utecht, Zhiyi Xu, Greg Lindsey Thanks to:
2010 Pedestrian and Bicyclist Special Districts Study Update
 2010 Pedestrian and Bicyclist Special Districts Study Update Pedestrian and Bicyclist Special Districts Program Overview H-GAC s Special Districts Program aims to provide strategic investments in pedestrian
Chapter 5 FUNCTIONAL CLASSIFICATION
 Chapter 5 FUNCTIONAL CLASSIFICATION Functional classification is a system by which streets and roadways may be distinguished by types according to their function within the entire transportation network.
APPENDIX D LEVEL OF TRAFFIC STRESS METHODOLOGY
 APPENDIX D LEVEL OF TRAFFIC STRESS METHODOLOGY 01 WHAT IS LEVEL OF TRAFFIC STRESS? When people bicycle on roadways, they encounter varying levels of stress from traffic. A quiet residential street with
Perryville TOD and Greenway Plan
 Perryville TOD and Greenway Plan Greenway Glossary Pathway: A bicycle and pedestrian path separated from motorized vehicular traffic by an open space, barrier or curb. Multi-use paths may be within the
6.0 PEDESTRIAN AND BICYCLE FACILITIES 6.1 INTRODUCTION 6.2 BICYCLE DEMAND AND SUITABILITY Bicycle Demand
 6.0 PEDESTRIAN AND BICYCLE FACILITIES 6.1 INTRODUCTION Bicycle and pedestrian travel along and in the vicinity of the corridor is part of the vision of Somerset and Hunterdon counties and the integrated
PEDESTRIAN ACTION PLAN
 ATTACHMENT 2 CITY OF SANTA MONICA PEDESTRIAN ACTION PLAN CITY OF SANTA MONICA PEDESTRIAN ACTION PLAN This page intentionally left blank EXECUTIVE SUMMARY CHAPTER 1 EXECUTIVE SUMMARY Setting the Stage
City of Novi Non-Motorized Master Plan 2011 Executive Summary
 City of Novi Non-Motorized Master Plan 2011 Executive Summary Prepared by: February 28, 2011 Why Plan? Encouraging healthy, active lifestyles through pathway and sidewalk connectivity has been a focus
Bikeway action plan. Bicycle Friendly Community Workshop March 5, 2007 Rochester, MN
 Bikeway action plan Summary The was held on March 5, 2007 at the Rochester Mayo Civic Center. The workshop was hosted by Rochester-Olmsted County Planning Department in collaboration with the League of
MAG Town of Cave Creek Bike Study Task 6 Executive Summary and Regional Significance Report
 Page 1 MAG Town of Cave Creek Bike Study Task 6 Executive Summary and Regional Significance Report August 1, 2012 MAG Project #481 Page 2 Task 6 Executive Summary and Regional Significance Report Introduction
NASHUA REGIONAL PLANNING COMMISSION REGIONAL BICYCLE AND PEDESTRIAN PLAN
 NASHUA REGIONAL PLANNING COMMISSION REGIONAL BICYCLE AND PEDESTRIAN PLAN June, 2005 Prepared by the Nashua Regional Planning Commission 2005 NRPC Regional Bicycle and Pedestrian Plan- JUNE 2005 ACKNOWLEDGEMENTS
GIS Based Data Collection / Network Planning On a City Scale. Healthy Communities Active Transportation Workshop, Cleveland, Ohio May 10, 2011
 The Purpose of GIS Based Network Planning GIS Based Data Collection / Network Planning Healthy Communities Active Transportation Conference Tuesday, May 10, 2011 10:00 AM Norman Cox, LLA, ASLA. Ann Arbor,
APPENDIX E BIKEWAY PRIORITIZATION METHODOLOGY
 APPENDIX E BIKEWAY PRIORITIZATION METHODOLOGY INTRODUCTION The network of bikeways recommended in the Bicycle Master Plan is extensive and is likely to be only partially completed during the 25-year life
Multimodal Through Corridors and Placemaking Corridors
 68 Multimodal Through Corridors and Placemaking Corridors Corridors have different functions in a region. Some corridors are used to get smoothly and rapidly through a region or to get quickly to major
2017 Northwest Arkansas Trail Usage Monitoring Report
 2017 Northwest Arkansas Trail Usage Monitoring Report Summary Findings: The study showed that average daily weekday bicycle volumes per study site increased by about 32% between 2015 and 2017, from 142
Memorandum. Drive alone
 Memorandum To: Cc: From: Kimberly Kerr, Assistant Chief Administrative Officer Natalie Porter, PE, TE Shawna Purvines Claudia Wade, PE Michael Schmitt, AICP CTP, PTP Re: Technical Memorandum #2: Model
Sixth Line Development - Transit Facilities Plan
 Memorandum Date: November 13, 2012 To: From: c.c. Subject: Rob Freeman (Freeman Planning) Kevin Phillips Sixth Line Development - Transit Facilities Plan 33016631 This memo was prepared to review the transit
Madison Urban Area and Dane County. Bicycle Transportation Plan Summary. September Introduction. Bicycle Plan Scope and Planning Process
 Bicycle Transportation Plan Summary Madison Urban Area and Dane County Introduction September 2000 Bicycling is an important mode of transportation in the Madison urban area and countywide that is available
CONNECTING PEOPLE TO PLACES
 CONNECTING PEOPLE TO PLACES 82 EAST BENCH MASTER PLAN 07 Introduction The East Bench transportation system is a collection of slow moving, treelined residential streets and major arteries that are the
Chapter 2. Bellingham Bicycle Master Plan Chapter 2: Policies and Actions
 Chapter 2 Bellingham Bicycle Master Plan Chapter 2: Policies and Actions Chapter 2: Policies and Actions The Bicycle Master Plan provides a road map for making bicycling in Bellingham a viable transportation
Rochester Area Bike Sharing Program Study
 roc bike share Rochester Area Bike Sharing Program Study Executive Summary ~ January 2015 JANUARY 2015 8484 Georgia Avenue, Suite 800 Silver Spring, MD 20910 3495 Winton Pl., Bldg E, Suite 110 Rochester,
GIS Based Non-Motorized Transportation Planning APA Ohio Statewide Planning Conference. GIS Assisted Non-Motorized Transportation Planning
 The Purpose of GIS Assisted Network GIS Assisted Non-Motorized Transportation 2011 APA Ohio Statewide Conference Friday, 10:45 AM to Noon Focus on near-term projects wwwgreenwaycollabcom The purpose of
RURAL HIGHWAY SHOULDERS THAT ACCOMMODATE BICYCLE AND PEDESTRIAN USE (TxDOT Project ) June 7, Presented by: Karen Dixon, Ph.D., P.E.
 June 7, Presented by: Karen Dixon, Ph.D., P.E.") RURAL HIGHWAY SHOULDERS THAT ACCOMMODATE BICYCLE AND PEDESTRIAN USE (TxDOT Project 0-6840) June 7, 2016 Presented by: Karen Dixon, Ph.D., P.E., TTI Team: Kay Fitzpatrick, Raul Avelar, & Subasish Das Project
RURAL HIGHWAY SHOULDERS THAT ACCOMMODATE BICYCLE AND PEDESTRIAN USE (TxDOT Project 0-6840) June 7, 2016 Presented by: Karen Dixon, Ph.D., P.E., TTI Team: Kay Fitzpatrick, Raul Avelar, & Subasish Das Project
Proposed. City of Grand Junction Complete Streets Policy. Exhibit 10
 Proposed City of Grand Junction Complete Streets Policy Exhibit 10 1 City of Grand Junction Complete Streets Policy Vision: The Complete Streets Vision is to develop a safe, efficient, and reliable travel
Vision Zero High Injury Network Methodology
 Vision Zero High Injury Network Methodology DATA SETS USED: 1. Reportable crashes in Philadelphia from 2012-2016, available as open data through PennDOT 2. Street Centerline geographic layer, maintained
Vision: Traditional hamlet with an attractive business/pedestrian friendly main street connected to adjacent walkable neighborhoods
 N D. Focus Area II Vision: Traditional hamlet with an attractive business/pedestrian friendly main street connected to adjacent walkable neighborhoods Transit Road Focus Area II is located in the Hamlet
National Bicycle and Pedestrian Documentation Project INSTRUCTIONS
 National Bicycle and Pedestrian Documentation Project INSTRUCTIONS The National Documentation Project (NBPD) is an annual bicycle and pedestrian count and survey effort sponsored by the Institute of Transportation
Traffic Safety Barriers to Walking and Bicycling Analysis of CA Add-On Responses to the 2009 NHTS
 Traffic Safety Barriers to Walking and Bicycling Analysis of CA Add-On Responses to the 2009 NHTS NHTS Users Conference June 2011 Robert Schneider, Swati Pande, & John Bigham, University of California
3 ROADWAYS 3.1 CMS ROADWAY NETWORK 3.2 TRAVEL-TIME-BASED PERFORMANCE MEASURES Roadway Travel Time Measures
 ROADWAYS Approximately 6 million trips are made in the Boston metropolitan region every day. The vast majority of these trips (80 to percent, depending on trip type) involve the use of the roadway network
SNCC Demographic Trends
 Employment Population SNCC Demographic Trends In 1970 the SNCC population was 10,040, accounting for roughly 3% of the County population In 2015, SNCC grew to 60,567 people, roughly 11% of the County population
SECTION 1 - TRAFFIC PLANNING
 SECTION 1 - TRAFFIC PLANNING 1.1 TRAFFIC OPERATIONS 1.1.1 Roadway Functional Classification The Multnomah County Comprehensive Framework Plan s Policy 34: Trafficways and the Functional Classification
Regional Transportation Needs Within Southeastern Wisconsin
 Regional Transportation Needs Within Southeastern Wisconsin #118274 May 24, 2006 1 Introduction The Southeastern Wisconsin Regional Planning Commission (SEWRPC) is the official areawide planning agency
Summary of NWA Trail Usage Report November 2, 2015
 Summary of NWA Trail Usage Report November 2, 2015 Summary Findings: The study showed that Northwest Arkansas (NWA) had relatively high cyclist user counts per capita aggregated across the top three usage
CONTEXT SENSITIVE STREETS STANDARDS COMMITTEE
 CONTEXT SENSITIVE STREETS STANDARDS COMMITTEE February 23, 2015 Prepared by: Denise Chaplick, AICP City Jacksonville Bicycle and Pedestrian Coordinator Source: NCDOT Complete Streets Planning and Design
ACTIVE TRANSPORTATION
 ACTIVE TRANSPORTATION Mobility 2040 Supported Goals Improve the availability of transportation options for people and goods. Support travel efficiency measures and system enhancements targeted at congestion
US287 Asset Inventory Loveland. Figure 6-1 Loveland Bridges and Traffic Signals
 Chapter 6: City of Loveland US287 extends for approximately 13.1 miles through the City of Loveland. Between the northern City boundary and 29 th Street, the road is labeled Garfield Avenue, before transitioning
Plant City Walk-Bike Plan
 Plant City Walk-Bike Plan Plant City Commute Mode Share 2.2% 1.4% 2.9% Drove alone 10.2% Carpooled Public transportation (0.1%) Walked Used a Bike (0.4%) 82.9% Taxicab, motorcycle, or other means Worked
Goodlettsville Bicycle and Pedestrian Plan Executive Summary
 Goodlettsville Bicycle and Pedestrian Plan July 2010 In Cooperation with the Nashville Area Metropolitan Planning Executive Organization Summary Introduction Progressive and forward thinking communities
Active Travel and Exposure to Air Pollution: Implications for Transportation and Land Use Planning
 Active Travel and Exposure to Air Pollution: Implications for Transportation and Land Use Planning Steve Hankey School of Public and International Affairs, Virginia Tech, 140 Otey Street, Blacksburg, VA
Pedestrian Demand Modeling: Evaluating Pedestrian Risk Exposures
 Pedestrian Demand Modeling: Evaluating Pedestrian Risk Exposures Kelly J. Clifton National Center for Smart Growth University of Maryland May 19, 2008 Study Team University of Maryland National Center
INTRODUCTION THOROUGHFARE SYSTEM CLASSIFICATIONS
 INTRODUCTION The thoroughfare plan will assist public officials in the development of a specialized system for efficient and safe movement of vehicular traffic while minimizing potential conflicts with
General Design Factors
 Chapter 3: 3-1.0 Introduction General Design Factors Mn/DOT s goals include encouraging and accommodating safe bicycling. From a design perspective, these goals are achieved by first having an understanding
Planning Guidance in the 2012 AASHTO Bike Guide
 Planning Guidance in the 2012 AASHTO Bike Guide Presentation by: RJ Eldridge Peter Lagerwey August 22, 2012 WEBINAR 2: PLANNING GUIDANCE IN THE 2012 AASHTO BIKE GUIDE Today s Webinar Significant Updates
Chapter 5 Future Transportation
 Chapter 5 Future Transportation The Future Land Use Plan identifies the desired land use designations. The land uses desired for Crozet depend, in large part, on the success of the transportation system,
EUCLID AVENUE PARKING STUDY CITY OF SYRACUSE, ONONDAGA COUNTY, NEW YORK
 EUCLID AVENUE PARKING STUDY CITY OF SYRACUSE, ONONDAGA COUNTY, NEW YORK CITY OF SYRACUSE DEPARTMENT OF PUBLIC WORKS 1200 CANAL STREET EXTENSION SYRACUSE, NEW YORK 13210 DRAFT REPORT DATE: November 13,
Classification Criteria
 SCHEDULE D TO RECOMMENDED OFFICIAL PLAN AMENDMENT NO. 40 SCHEDULE C-4 Road Criteria Criteria Traffic Service Objective Land Service/Access Typical Daily Traffic Volume Flow characteristics Travel Speed
Chapter 7. Transportation. Transportation Road Network Plan Transit Cyclists Pedestrians Multi-Use and Equestrian Trails
 Chapter 7 Transportation Transportation Road Network Plan Transit Cyclists Pedestrians Multi-Use and Equestrian Trails 7.1 TRANSPORTATION BACKGROUND The District of Maple Ridge faces a number of unique
Defining Purpose and Need
 Advanced Design Flexibility Pilot Workshop Session 4 Jack Broz, PE, HR Green May 5-6, 2010 Defining Purpose and Need In your agency s project development process, when do design engineers typically get
Chapter 5 DATA COLLECTION FOR TRANSPORTATION SAFETY STUDIES
 Chapter 5 DATA COLLECTION FOR TRANSPORTATION SAFETY STUDIES 5.1 PURPOSE (1) The purpose of the Traffic Safety Studies chapter is to provide guidance on the data collection requirements for conducting a
Summary Report: Built Environment, Health and Obesity
 Research and education Built Environment Edmonton Project Summary Report: Built Environment, Health and Obesity Introduction In 2007 the Canadian Institutes of Health Research and the Heart and Stroke
The North Shore Transportation Improvement Strategy and Western Richmond Terrace 1 : The Forgotten Corridor
 Elm Park Civic Association Island Voice Do Me A Faber The North Shore Transportation Improvement Strategy and Western Richmond Terrace 1 : The Forgotten Corridor Introduction Richmond Terrace is the northernmost
Chapter 4 Traffic Analysis
 Chapter 4 Traffic Analysis PURPOSE The traffic analysis component of the K-68 Corridor Management Plan incorporates information on the existing transportation network, such as traffic volumes and intersection
TRANSPORTATION & MOBILITY
 TRANSPORTATION & MOBILITY ROADWAY SYSTEM There are approximately 40 miles of roadways in Manitou Springs. For planning purposes, roadways are typically assigned a functional classification which defines
Contents. Champaign-Urbana Mass Transit District Stop Placement Guidelines
 Contents Champaign-Urbana Mass Transit District Introduction... 1 Stop Spacing... 2 Rural... 2 Low Density Suburban... 2 General Urban... 2 Urban Core... 2 Operational Safety... 3 Stop Placement... 4 Nearside
NM-POLICY 1: Improve service levels, participation, and options for non-motorized transportation modes throughout the County.
 Transportation PRINCE WILLIAM COUNTY 2008 COMPREHENSIVE PLAN NON-MOTORIZED PLAN CONTENTS Goals, Policies, and Action Strategies Table 4 (Bike Facility Classifications and Descriptions) Table 5 (Bike Facility
Non-motorized Transportation Planning Resource Book Mayor s Task Force on Walking and Bicycling City of Lansing, Michigan Spring 2007 pg.
 Non-motorized Transportation Planning Resource Book pg. 105 of 158 Non-motorized Transportation Planning Resource Book pg. 106 of 158 Non-motorized Transportation Planning Resource Book pg. 107 of 158
The Route 29 Corridor Study was initiated at the request of Virginia s Commonwealth
 CHAPTER 2: Study Background and approach The Route 29 Corridor Study was initiated at the request of Virginia s Commonwealth Transportation Board in response to requests from members of the General Assembly
Creating Complete Streets to Accommodate All Users
 Creating Complete Streets to Accommodate All Users Peter Lagerwey, Toole Design Group plagerwey@tooledesign.com Brian Dougherty, Seattle DOT brian.dougherty@seattle.gov International Conference on Urban
Speed Limits Study and Proposal. Public Input Session: 8/14/13
 Speed Limits Study and Proposal Public Input Session: 8/14/13 Why is Decatur a unique place for this project? First Community Transportation Plan in the nation with a Health Impact Assessment. Strong sense
CITY OF ALPHARETTA DOWNTOWN MASTER PLAN TRAFFIC EVALUATION
 CITY OF ALPHARETTA DOWNTOWN MASTER PLAN TRAFFIC EVALUATION June 2015 CITY OF ALPHARETTA DOWNTOWN MASTER PLAN TRAFFIC EVALUATION Introduction The Alpharetta Downtown Master Plan was developed in the fall
This page intentionally left blank.
 This page intentionally left blank. COMMUNITY Coweta Community Overview Coweta Coweta, a residential community located in Wagoner County, is a suburb of Tulsa situated southeast of the metropolitan area
Physical Implications of Complete Streets Policies
 Presentation Overview Physical Implications of Complete Norm Cox, ASLA, LLA Landscape Architect Ann Arbor, Michigan, 10:45 to Noon What Are Complete Streets? What Matters to Bicyclists and Pedestrians
Exhibit 1 PLANNING COMMISSION AGENDA ITEM
 Exhibit 1 PLANNING COMMISSION AGENDA ITEM Project Name: Grand Junction Circulation Plan Grand Junction Complete Streets Policy Applicant: City of Grand Junction Representative: David Thornton Address:
The Role of MPOs in Advancing Safe Routes to School through the Transportation Alternatives Program
 The Role of MPOs in Advancing Safe Routes to School through the Transportation Alternatives Program In 2012, Congress made changes to Federal funding for Safe Routes to School that gave some metropolitan
METRO Light Rail: Changing Transit Markets in the Phoenix Metropolitan Area
 METRO Light Rail: Changing Transit Markets in the Phoenix Metropolitan Area Abhishek Dayal, AICP Planner III, METRO Light Rail Phoenix, AZ BACKGROUND Transit in the Phoenix Region Transit services in the
City of Homewood Transportation Plan
 City of Homewood Transportation Plan Prepared for: City of Homewood, Alabama Prepared by: Skipper Consulting, Inc. May 2007 TABLE OF CONTENTS INTRODUCTION... 1 BACKGROUND INFORMATION... 1 EXISTING TRANSPORTATION
Measuring Transportation: Traffic, Mobility and Accessibility
 Measuring Transportation: Traffic, Mobility and Accessibility THIS FEATURE COMPARES THREE APPROACHES TO MEASURING TRANSPORTATION SYSTEM PERFORMANCE. TRAFFIC-BASED MEASUREMENTS EVALUATE MOTOR VEHICLE MOVEMENT;
West Dimond Blvd Upgrade Jodhpur Street to Sand Lake Road
 West Dimond Blvd Jodhpur St to Sand Lake CSS Transportation Project Summary Municipality of Anchorage Project # 05 005 Project Manager: John Smith, P.E. (MOA PM&E) Project Administrator: Julie Makela,
US287 Asset Inventory Fort Collins. Figure 5-1 Fort Collins Bridges and Traffic Signals
 Chapter 5: City of Fort Collins US287 through Fort Collins is known as College Avenue, runs for approximately 9.25 miles, and bisects the City north to south. Within the City, US287 is a principal arterial.
Cycling Volume Estimation Methods for Safety Analysis
 Cycling Volume Estimation Methods for Safety Analysis XI ICTCT extra Workshop in Vancouver, Canada Session: Methods and Simulation Date: March, 01 The Highway Safety Manual (HSM) documents many safety
METHODOLOGY. Signalized Intersection Average Control Delay (sec/veh)
") Chapter 5 Traffic Analysis 5.1 SUMMARY US /West 6 th Street assumes a unique role in the Lawrence Douglas County transportation system. This principal arterial street currently conveys commuter traffic
Chapter 5 Traffic Analysis 5.1 SUMMARY US /West 6 th Street assumes a unique role in the Lawrence Douglas County transportation system. This principal arterial street currently conveys commuter traffic
Overview. Existing Conditions. Corridor Description. Assessment
 Overview A study of the 23 rd Street corridor was undertaken to document the existing conditions, analyze traffic operations, and recommend remedies for deficient situations Although 23 rd Street is frequently
Chapter 6 Transportation Plan
 Chapter 6 Transportation Plan Transportation Plan Introduction Chapter 6 Transportation Plan Transportation Plan Introduction This chapter describes the components of Arvada s transportation system, comprised
The Walkability Indicator. The Walkability Indicator: A Case Study of the City of Boulder, CO. College of Architecture and Planning
 1 : A Case Study of the City of Boulder, CO College of Architecture and Planning University of Colorado Author Note: Daryoosh Ardalan, Urban Regional Planning, College of Architecture and Planning, University
APPENDIX E Needs Assessment
 APPENDIX E Needs Assessment Active Transportation Needs Assessment Technical Background This appendix provides the technical background supporting the findings presented in Section 3 of the report. Developed
Pedestrian Project List and Prioritization
 To: Kyle Wagenschutz, City of Memphis CC: From: Anne Conlon and John Cock, Alta Planning + Design Date: December, 2014 Re: Project List Development (Task 3.1-3.2) and Project List Prioritization (Task
Appendix C. Corridor Spacing Research
 Appendix C. Corridor Spacing Research Task 3 of the Twin Cities Bicycle Study called for the development of bicycle corridor spacing guidelines. This section summarizes research of the spacing of planned
CITY OF COCOA BEACH 2025 COMPREHENSIVE PLAN. Section VIII Mobility Element Goals, Objectives, and Policies
 CITY OF COCOA BEACH 2025 COMPREHENSIVE PLAN Section VIII Mobility Element Goals, Objectives, and Policies Adopted August 6, 2015 by Ordinance No. 1591 VIII MOBILITY ELEMENT Table of Contents Page Number
NEWMARKET CENTRE Mobility Hub Profile
 Mobility Hub Profile Dundas Newmarket West-Bloor Centre Anchor Hub Gateway Hub N MOBILITY HUBS: Places of connectivity between regional and rapid transit services, where different modes of transportation
This page intentionally left blank.
 This page intentionally left blank. COMMUNITY Glenpool Community Overview Glenpool Glenpool is a city of nearly 12,000 residents located in Tulsa County southwest of Tulsa and Jenks. The city is growing
WELCOME. Purpose of the Open House. Update you on the project. Present a draft recommended plan. Receive your input
 WELCOME Purpose of the Open House The Town of Smiths Falls has initiated the Beckwith Street Redevelopment Plan that includes the preparation of a streetscape functional design for the renewal of Beckwith
Circulation in Elk Grove includes: Motor vehicles, including cars and trucks
 Circulation, as it is used in this General Plan, refers to the many ways people and goods move from place to place in Elk Grove and the region. Circulation in Elk Grove includes: Motor vehicles, including
2014 Fishers Trail Count
 2014 Fishers Trail Count July 2014 Table of Contents Introduction...1 Trail Count Locations...3 Ellipse Parkway at Holland Drive...4 Lantern Road at Sunblest Boulevard...5 126th Street at Cumberland Road...6
5 CIRCULATION AND STREET DESIGN
 5 CIRCULATION AND STREET DESIGN This chapter describes circulation and streetscape improvements proposed for the Northwest Chico Specific Plan Area. It includes detailed design specifications for existing
Bike/Multipurpose Trail Study for Glynn County, Georgia MAY 16, 2016
 Bike/Multipurpose Trail Study for Glynn County, Georgia MAY 16, 2016 Agenda» Project Status Update» Draft Recommendations Overview» Next Steps» Questions/Discussion Project Overview» Comprehensive Bikeway
Traffic Impact Study. Westlake Elementary School Westlake, Ohio. TMS Engineers, Inc. June 5, 2017
 TMS Engineers, Inc. Traffic Impact Study Westlake Elementary School Westlake, Ohio June 5, 2017 Prepared for: Westlake City Schools - Board of Education 27200 Hilliard Boulevard Westlake, OH 44145 TRAFFIC
DON MILLS-EGLINTON Mobility Hub Profile
 Mobility Hub Profile Dundas Don Mills-Eglinton West-Bloor Anchor Hub Gateway Hub N MOBILITY HUBS: Places of connectivity between regional and rapid transit services, where different modes of transportation
MCTC 2018 RTP SCS and Madera County RIFP Multi-Modal Project Eval Criteria GV13.xlsx
 MCTC 8 RTP SCS and Madera County RIFP Multi-Modal Project Eval Criteria GV.xlsx Madera County Transportation Commission Regional Transportation Plan / Sustainable Communities Strategy Multi-Modal Project
Characteristics from these programs were used to compare to and evaluate existing conditions in Howard County.
 EXECUTIVE SUMMARY Bike share is a mobility option that allows users to access a fleet of public bicycles throughout a community. Bike share systems have successfully been implemented in communities throughout
Bicycle and Pedestrian Planning in a Historically Car-Centric Culture: A Focus on Connectivity, Safety, & Accessibility
 Bicycle and Pedestrian Planning in a Historically Car-Centric Culture: A Focus on Connectivity, Safety, & Accessibility Kate Horton and Zylavian Watley Transportation Planners Memphis MPO Date: October
San Jose Transportation Policy
 San Jose Transportation Policy Protected Intersections in LOS Policies to Support Smart Growth Presented by: Manuel Pineda City of San Jose Department of Transportation Bay Area Map San Francisco Oakland
An Assessment of Potential Greenhouse Gas Emissions Reductions from Proposed On Street Bikeways
 An Assessment of Potential Greenhouse Gas Emissions Reductions from Proposed On Street Bikeways Through the Sustainable Bethlehem Initiative, the Town of Bethlehem has identified both the improvement of
WALKNBIKE DRAFT PLAN NASHVILLE, TENNESSEE EXECUTIVE SUMMARY NASHVILLE, TENNESSEE
 NASHVILLE, TENNESSEE EXECUTIVE SUMMARY Executive Summary A world-class multi-modal transportation system is essential to a vibrant city and better quality of life. -Mayor Barry The WalknBike plan aims
FINAL DESIGN TRAFFIC TECHNICAL MEMORANDUM
 FINAL DESIGN TRAFFIC TECHNICAL MEMORANDUM July 2014 FINAL (SR 43) Project Development and Environment Study From State Road 60 (Adamo Drive) to I-4 (SR 400) Hillsborough County, Florida Work Program Item