SAVeRS. Guideline for the selection of the most appropriate Roadside Vehicle Restraint System
|
|
|
- Lee Bond
- 5 years ago
- Views:
Transcription
1 DISLAIMER: This is the SAVeRS project deliverable and not an official CEDR Publication. If and when a CEDR publication will be issued this will be posted on the CEDR website ( and it could be amended as compared to this project Deliverable. CEDR Transnational Road Research Programme Call 2012: Safety: Use of Vehicle Restraint Systems Funded by Belgium/Flanders, Germany, Ireland, Norway, Sweden, United Kingdom SAVeRS Guideline for the selection of the most appropriate Roadside Vehicle Restraint System Deliverable D3.1 June 2015 Partners: University of Florence, Italy TRL Ltd, United Kingdom Swedish National Road and Transport Research Institute, Sweden Trinity College Dublin, Ireland Slovenian National Building and Civil Engineering Institute, Slovenia AIT Austrian Institute of Technology GmbH, Austria Parsons Brinckerhoff, United Kingdom Belgian Road Research Centre, Belgium
2 CEDR Call2012: Safety: Use of Vehicle Restraint Systems SAVeRS Selection of Appropriate Vehicle Restraint Systems Guideline for the selection of the most appropriate Roadside Vehicle Restraint System Due date of deliverable: Actual submission date: Start date of project: End date of project: Authors of this deliverable: Francesca La Torre, University of Florence, Italy Ceki Erginbas, TRL Ltd, United Kingdom Gavin Williams, TRL Ltd, United Kingdom Robert Thomson, Chalmers University of Technology (representing the Swedish National Road and Transport Research Institute), Sweden Graham Hemmings, Parsons Brinckerhoff Ltd, United Kingdom Christian Stefan, AIT Austrian Institute of Technology GmbH, Austria PEB Project Managers: Alastair De Beer, National Road Authority, Ireland Mats Pettersson, Swedish Transport Administration, Sweden Version: June, 2015
3 Table of contents EXECUTIVE SUMMARY... i 1 INTRODUCTION IDENTIFICATION OF THE NEED FOR A VRS (BARRIER PLACEMENT GUIDANCE) Methodology Forgiving Roadsides Decision on where a roadside barrier is needed Embankments (Falling Slopes) Cuts (Rising Slopes) Non-deformable Continuous Hazards Non-deformable Individual Hazards Permanent Bodies or Streams of Water Chemical Works, Petroleum Storage Tanks, Locations of Hazardous Material Heavily Used Walkways, Locations of Public Gathering Heavily Used Bicycle Paths Adjacent Rail Lines Adjacent Roads Structures at Risk of Collapse Objects which can Cause Severe Traffic Disruptions if Damaged Environmental Concern Such as Source of Drinking Water Risk assessment methods for identifying the need for a VRS Decision on Where a Median Barrier is needed Decision on Where a Bridge Parapet / Barrier is needed: Definition of the Length of Need The Length of Need concept Length of Need Background LON Specification Application to the SAVeRS Guideline SAFETY BARRIERS (INCLUDING BRIDGE PARAPETS) The multi-level approach Decision process Run Off Road model Structure of the Run Off Road Model Motorways Two-lane, two-ways rural roads Impact energy distribution models Severity distribution functions Whole life cost model RECOMMENDATION FOR THE IMPLEMENTATION OF THE GUIDELINE BY NATIONAL ROADS AUTHORITIES... 49
4 4.1 Selection Procedure Application to selected EU Countries Italy UK Application at the design stage Use of the tool at the design stage Worked examples Conclusions from the Pilot Sites Analysis CRASH CUSHIONS AND TERMINALS Crash cushions Terminals MOTORCYCLE PROTECTION SYSTEMS CONCLUSIONS ACKNOWLEDGEMENTS REFERENCES ANNEX 1 - GLOSSARY... 1 ANNEX 2 - DEVELOPMENT OF A BASE SAFETY PERFORMANCE FUNCTION ANNEX 3 - CALIBRATION OF THE MOTORWAY RUN-OFF-ROAD MODEL ANNEX 4 - CALIBRATION OF THE RURAL TWO-LANE TWO-WAYS RUN-OFF-ROAD MODEL ANNEX 5 - DEVELOPMENT OF AN HGV IMPACT ENERGY DISTRIBUTION ANNEX 6 - SEVERITY DISTRIBUTION FUNCTIONS... 24
5 List of figures Figure 1: Risk Model... 5 Figure 2: Risk classification processes used in Belgium (Flanders) Figure 3: Risk classification processes used in Germany Figure 4: Tabulated assessment of risk, as used in Spain Figure 5: Determination of barrier containment level, based on accident risk in Spain Figure 6: Length of Need Figure 7: Upstream LON Requirements Based on Actual Trajectories and Compared to AASHTO 2011 Recommendations (dashed lines) for 96 km/h (60 mph) Roads [source: NCHRP project] Figure 8: Influence of the Hazard Position on the LON [source: NCHRP project] Figure 9: Roadside Design Case Figure 10: Example of Short Assessment Length Figure 11: The risk model used to categorize the parameters Figure 12: SAVeRS procedure for selecting the most appropriate VRS (for safety barriers and bridge parapets) Figure 13: comparison between passenger cars Impact Kinetic Energy in the SAVeRS tool 41 Figure 14: distribution of impact angle for a given travelling lane, HGV type and road configuration (number of lanes) Figure 15: distribution of HGV Impact Kinetic Energy for roadsides (outer edge) Figure 16: distribution of HGV Impact Kinetic Energy for medians Figure 17: distribution of HGV Impact Kinetic Energy for two-lane two-way rural roads (based on RSAP3 distributions) Figure 18: risk thresholds in RRRAP (UK) for 2 lane motorways Figure 19: risk thresholds in RRRAP (UK) for 3 lane motorways Figure 20: procedure implementation of the SAVeRS tool at the NRA level Figure 21: distribution of impact angles based on GIDAS and RSAP databases Figure 22: schematisation of the trajectory of the running off vehicle on the carriageway Figure 23: impact point and angle () in bends... 21
6 List of Tables Table 1: Runout Lengths recommended by Coon, et. al., Table 2: SAVeRS Multilevel approach Table 3: IKE values for EN test conditions Table 4: parameters of the base models included in the SAVeRS tool and network characteristics for motorways Table 5: CMF for increasing the number of lanes Table 6: CMF for increasing the outside shoulder width Table 7: CMF for increasing the inside shoulder width Table 8: CMF for gradient classes Table 9: CMFs for shoulder rumble strips Table 10: CMF for lane width Table 11: parameters of the full models included in the SAVeRS tool and network characteristics for motorways Table 12: parameters of the base models included in the SAVeRS tool and network characteristics for two-lanes two-ways rural roads Table 13: CMF for the outside shoulder width Table 14: CMF for longitudinal gradient Table 15: CMF for Lane Width Table 17: Default hazard correction factor for barriers penetrations in the SAVeRS tool Table 18: slope risk based on the definitions used RRRAP (UK) Table 19: Default VRSCL correction factor for barriers containments in the SAVeRS tool. 46 Table 20: evaluation different roadside configurations in Italian motorways typical scenarios Table 21: evaluation of a 200 m high risk bridge in Italian motorways typical scenarios Table 22: evaluation different roadside configurations on UK motorways typical scenarios.. 57 Table 23: Pilot Sites Table 24: Predicted Accident Summary for Sites Table 25: Sites Analysed using the Selection Tool Table 26: Increase crash factor for crash cushions placed in diverge areas in motorways Table 27: ENV test conditions for crash cushions Table 28: probability of an impact speed above the crash cushion max test speed Table 29: ENV test conditions for terminals Table 30: probability of an impact speed above the terminal max test speed Table 31: characterisation of the different vehicle classes... 17
7 List of acronyms AADT AASHTO CEDR CMF f+i HGV IKE LON MPS NRA ROR SDF SPF SV SVROR VRS VRSCL WLC WP Average Annual Daily Traffic American Association of State Highway Officials (USA) Conference of European Directors of Roads Crash Modification Factor Fatal + injury crashes (crashes resulting in injuries) Heavy Good Vehicle (includes buses, single unit trucks, multiple unit trucks and tractor-trailers) Impact Kinetic Energy (kinetic energy of the vehicle at the moment of the impact against the barrier calculated considering only the speed component transversal to the barrier) Length of need of a barrier Motorcycle protection system National Road Authority Run Off Road Crash Severity Distribution Function Safety Performance Function Single Vehicle Crash Single Vehicle Run Off Road Crash Vehicle restraint system (barriers, including bridge parapets, crash cushions, terminals) Vehicle restraint system (barrier) class as defined by EN1317:2 standard Whole Life Costing Work Package
8 EXECUTIVE SUMMARY SAVeRS (Selection of Appropriate Vehicle Restraint Systems) is a Research Project funded within the 2012 Call Safety of the Transnational Road Research Programme of CEDR (Conference of European Directors of Roads) by Belgium/Flanders, Germany, Ireland, Norway, Sweden, United Kingdom. The aim of the SAVeRS project was to produce a practical and readily understandable Vehicle Restraint System (VRS) guidance document and a user-friendly tool that would allow the selection of the most appropriate solution in different road and traffic configurations for different types of VRS. The partners of the SAVeRS Consortium, lead by the University of Florence (Italy), are: TRL (UK), VTI (Sweden), Trinity College Dublin (Ireland), ZAG (Slovenia), AIT (Austria), Parsons Brinckerhoff Ltd (UK), BRRC (Belgium, subcontractor of TRL). This Guideline is the output of Work Package 3 of the project where the results of the activities of WP1 and WP2 have been combined and complemented. Further details on the background studies conducted in the SAVeRS project can be found in the deliverables D1.1 Defining the Different Parameters which can influence the need and selection of VRS and D2.1 Analysing the Different Parameters which influence the need and selection of VRS both available in the SAVeRS website ( The final product of the SAVeRS project is the following set of documents that can be downloaded for the SAVeRS website ( Guideline for the selection of the most appropriate Roadside Vehicle Restraint System (this document); SAVeRS tool: an Excel spreadsheet with built-in macros where the models and selection criteria developed in the SAVeRS project and described in this Guide are implemented; SAVeRS tool user manual: a companion document that provides guidance for the use of the SAVeRS tool; Excel spreadsheet for the calibration of the crash prediction model for motorways (for users interested in calibrating the SAVeRS prediction model for a different motorway network); Excel spreadsheet for the calibration of the crash prediction model for two-lane twoways rural roads (for users interested in calibrating the SAVeRS prediction model for a different two-lane two-ways rural roads network). The document is structured in the following 5 chapters and 6 annexes where all the models implemented in the tool are described and additional guidance is provided to the user to select the most appropriate VRS: introduction identification of the need for a VRS (barrier placement guidance) (i)
9 safety barriers (including bridge parapets) recommendation for the implementation of the guideline by national road administrations crash cushions and terminals motorcycle protection systems annex 1 - glossary annex 2 - development of a base safety performance function annex 3 - calibration of the motorway run-off-road model annex 4 - calibration of the rural two-lane two-ways run-off-road model annex 5 - development of an HGV impact energy distribution annex 6 - severity distribution functions The SAVeRS tool allows the user to compare different barriers classes (according to EN1317-2) and types in terms of potential penetrations, potential fatal crashes and whole life costing. In selecting the most appropriate device it should be noted that often a safety barrier is not necessary and therefore, prior to applying the SAVeRS tool for defining the most appropriate barrier class or type, the designer should evaluate if there is actually the need for a barrier. Most of the national standards provide indications for the definition of the situations where a safety barrier is needed. A summary of these criteria is given in chapter 2 of this Guideline and implemented as separate function in the SAVeRS tool. For crash cushions and terminals the SAVeRS tool allows the user to estimate the number of crashes that will potentially impact on the device in the analysis period and the potential number of crashes that will impact at a speed above the VRS class, as defined by EN and ENV (future EN1317-7). Any inquiry related to the use of the SAVeRS tool should be addressed to francesca.latorre@unifi.it. (ii)
10 1 INTRODUCTION Run Off Road (ROR) crashes are road accidents that can often result in severe injuries or fatalities. The accident analysis conducted within the RISER Project, funded by the EU and concluded in 2005, highlighted that even though only 10% of the total number of accidents are single vehicle accidents (SV, typically associated to the ROR crashes) the rate of SV events increases to 45% when only fatal accidents are considered. To reduce the severity of ROR crashes, forgiving roadsides need to be designed and this includes identifying situations where there is a need for a Vehicle Restraint System (VRS) and defining what appropriate VRS should be selected for a specific location and traffic condition. At this time, whilst there are standards covering testing, evaluation and classification of VRS within Europe (EN1317 part 1 to part 8, EN12767 etc.), their selection, location and installation requirements are typically based upon national guidelines and standards, often produced by National Road Authorities (NRA) and/or overseeing organisations. Due to local conditions, these national guidelines vary across Europe. As a result, the main objective of the SAVeRS project was to produce both a practical and readily understandable VRS guidance document and a user-friendly tool that would allow to select the most appropriate solution in different road and traffic configurations. The guideline is structured in the following 4 main sections: Identification of the need for a VRS (barrier placement guidance): this section is based on the result of previous projects, existing manuals and national standards to help the user to identify if there is a need for a VRS. This section of the Guideline also provides indications for the definition of the proper Length of Need (LON) to be used when a VRS is needed; Safety barriers (including parapets): this section represents the core of the Guideline and provides guidance for selecting the most appropriate safety barrier class and type, assuming the device is tested and classified according to EN Different types of road section configurations are considered and each specific project can be characterized by the designer in terms of a number of physical and traffic parameters. For dual carriageway roads both median barriers and lateral barriers have been assessed. This section of the Guideline has been implemented in a user friendly tool that provides not only an assessment of the risk factors associated with different performance classes (according to EN1317-2) but also an evaluation of the most cost effective type of barrier (steel, concrete, wood, cable etc). 3
11 Recommendations for the implementation of the guideline by National Road Administrations: the selection of the appropriate VRS in different geometric and traffic conditions is strongly affected by national regulations and therefore an implementation procedure has been included in the Guide showing the issues that can be directly implemented by the NRAs in the form of an internal guidance document (e.g. setting the thresholds for the different risk indicators allowing also to identify the need for upgrading a VRS on an existing road section) and the issues that need to be tackled by revisiting national standards and regulations. As different European countries have different regulations it is not be possible to have a unique implementation plan. The required implementations to national regulations, considering the results of the SAVeRS project, have then been identified in Italy and in the UK to be used as a practical example for the usability of the research outputs and the implementation in different countries. In this section examples of application of the Guideline at the design stage are also given. Crash cushions and terminals: this section of the guide allows to assess the crash cushions classified according to EN The guidelines for the selection of barrier terminals (according to the new EN to be published) are also included. The SAVeRS tool allows to estimate the number of expected crashes in the design lifetime for both. The crash cushions and terminals sections of the tool can be used on existing roads to define priorities for the replacement of non crashworthy terminals with new crashworthy ones or for upgrading existing crash cushions. Sections that are exposed to a higher risk of impact against the VRS should be considered with a higher priority. Motorcycle restraint systems (MRS): this section of the guideline provides guidance to identify where an MRS tested according to EN Technical Specification CEN/TS ( Road restraint systems Motorcycle road restraint systems which reduce the impact severity of motorcyclist collisions with safety barriers ) is recommended and in which conditions a specific assessment should be made. 4
12 2 IDENTIFICATION OF THE NEED FOR A VRS (BARRIER PLACEMENT GUIDANCE) 2.1 Methodology Within Work Package 1 of this project, an extensive international search of the current stateof-the-art was undertaken to identify a list of the most influential parameters in the installation and selection of vehicle restraint systems. This was achieved through the examination and detailed analysis of National standards and guidelines, and also from a thorough review of existing literature (D1.1 Deliverable Defining the Different Parameters which can influence the need and selection of VRS ). From the completion of this Work Package, a number of specific parameters were highlighted which were used predominately within National requirements for determining whether a vehicle restraint system should be installed at a particular location, or in front of a specific hazard. However the most noticeably common underlying decision mechanism in most of the examined standards was a risk based model, as shown in Figure 1. Most of these standards based the decision of a VRS installation on the likelihood of a vehicle reaching a hazard and the consequences of the hazard being reached. Figure 1: Risk Model For assessing situations where a VRS is not in place the likelihood part of the equation can still be determined using the SAVeRS tool, which uses the likelihood related parameters identified within the WP1, such as AADT, %HGV, Road Geometry, etc. as described later. However likelihood alone is not enough for the decision concerning a VRS installation, as a VRS would not be necessary if there are no hazards on the roadside that would pose any danger to errant motorists. For this reason, this section is dedicated to a non-exhaustive list of hazards that would necessitate the installation of VRS. 2.2 Forgiving Roadsides The forgiving roadside approach is an inherent part of all the standards reviewed within WP1 and should always be followed as the main guideline in deciding if a VRS is required or not. The first priority of any designer should be to make the roadside as forgiving as reasonably possible. In order to achieve this, the following design options should be applied with an order of decreasing preference: 5
13 1. remove the hazard: if possible, a hazard should be removed to completely eliminate any risk of an errant vehicle reaching it; 2. redesign the hazard to be safely traversable: if the hazard cannot be removed, it should be made to be safely traversable by an errant vehicle; 3. relocate the hazard further away from the road: if the hazard cannot be made traversable, it should be located further away from the road, where it is less likely to be reached by errant vehicles; 4. make the hazard passively safe: if the hazard cannot be relocated, it should be made passively safe, in accordance with EN12767, to reduce the severity of a possible impact; 5. install a VRS: a VRS should only be installed if the options above are not possible or unreasonable from a cost-effectiveness perspective; 6. delineate the hazard: if none of the options above are applicable, the hazard should be delineated to warn road users of its existence. It should always be remembered that, although designed and tested to decrease impact severity, collision with a VRS can also have undesired consequences. This is why it is presented as the 5 th option on a list of decreasing priority. For this reason a VRS should only be used if reaching the hazard is likely to have more severe consequences than a collision with the VRS. The hazards presented in the following section should be evaluated with the risk mitigation approach explained above. 2.3 Decision on where a roadside barrier is needed Embankments (Falling Slopes) Embankments (or Falling Slopes) may pose a rollover risk to the errant vehicles. The decision of a VRS need before an embankment should be made depending on the height and gradient of the embankment. These are some examples from various standards: in Austria, a VRS is necessary on embankment slopes with a gradient steeper than 1:2 and height more than 4 m; in Ireland, the first stage is to provide embankment slopes that are 1:5 or flatter. If this is not feasible or cost effective the installation of a barrier may be appropriate. In all cases, the tops and toes of earthworks slopes should be rounded to a minimum radius of 4m; 6
14 in Germany, a VRS is considered (depending on the speed and AADT) for embankments with a height over 3 m and a gradient steeper than 1:3; in UK, a VRS is considered for embankments/slopes with a height over 1 m and a gradient equal to or steeper than 1:1; in USA, a VRS may be considered (depending on the roughness of the surface) for embankments with a gradient steeper than 1:3; in Italy, a VRS is necessary on embankment slopes with a gradient steeper than 2:3 and height more than 1 m Cuts (Rising Slopes) Cuts (or Rising Slopes) may pose a danger to the occupants of errant vehicles and may require shielding. The decision to install a VRS should be made depending on the gradient of the cut and the roughness of the surface. A VRS should be considered for cuts with steep slopes and rough surfaces. The base of the slope should also be curved smoothly. These are some examples from various standards: in Germany, a VRS is considered (depending on the speed and AADT) for rising slopes with a gradient over 1:3; in Ireland, a cut slope is considered to be less of a hazard than a safety barrier provided the toe is rounded to a minimum radius of 4m. The exceptions are a slope steeper than 1:2 or a rock cut with a rough face that could cause vehicle snagging; in UK, installation of VRS is considered for soil cutting slopes and earth bunds greater than 1 m high and a gradient of 1:1 or steeper. A barrier is also considered for exposed rock faced cutting slopes regardless of the gradient; in Switzerland, installation of a VRS is considered for rising slopes with a gradient steeper than 1:3 when the slope foot is not rounded with a radius more than 5 m; in Italy no VRS are required in cuts Non-deformable Continuous Hazards Retaining Walls Retaining walls may pose a significant risk to occupants of errant vehicles, depending on the smoothness of the surface and possible impact angles. A VRS should be considered for retaining walls with a non-smooth surface. These are some examples from various standards: in USA, a VRS is considered for retaining walls with a non-smooth surface and where the anticipated maximum level of impact is considerably high. 7
15 in UK, a VRS is considered for a retaining wall which does not have a smooth face adjacent to traffic extending for at least 1.5 m above the adjacent carriageway; in Italy no VRS are required in front of retaining walls Noise Barriers Noise barriers, if not designed in accordance to EN1317, may pose a significant threat to the occupants of errant vehicles. A VRS should generally be considered before noise barriers which are not designed and tested in accordance with EN Other Continuous Hazards Other continuous roadside hazards, such as fencing or walls along the edge of land located near the road, may require shielding. Installation of a VRS may be considered Non-deformable Individual Hazards The clear zone concept Non-deformable individual hazards need to be protected if the structure is potentially harmful and if they are placed at a distance from the travelled way not larger that a given distance called clear zone. There are several possible methods to define the Clear Zone width as described in the Deliverable D1 of the IRDES Project (Nitsche et al, 2010) and in deliverable D1.1 of SAVeRS. In the SAVeRS tool the AASHTO Roadside Design Guide procedure (AASHTO, 2011) is implemented (based on traffic, design speed, geometric layout and roadside configuration) and the compatibility of the available distance between the travelled road and obstacle with the requirements of the different national standards and guidelines analysed in deliverable D1.1 is also analysed. More details on the different methods applied in different countries can be found in D1.1 deliverable. The tool procedure is not intended to replace national standards but to provide design indications for those countries that do not have a national standard (e.g. Italy) as well as practical indications for identifying outliers (situations where one country would have a very different requirement as compared to most of the others) when a country is revising already existing guidelines. 8
16 Trees Collision with a tree is known to be one of the most common causes of injury in ROR crashes. Installation of a VRS should be considered for trees, especially for the ones expected to have a trunk girth of 100 mm or more at maturity. These are some examples from various standards: in UK, a VRS is considered for trees having, or expected to have trunk girths of 250 mm or more (measured at a height of 300 mm above ground) at maturity; in France, a VRS is considered for trees having a trunk diameter of 100 mm or more and stumps protruding by more than 200 mm; in Denmark, a VRS is considered for trees with a diameter of 100 mm or more, measured 400 mm above ground; in Ireland, a VRS is required if it has a girth of 175mm or more measured at 1m above the ground; in Switzerland no protective device is needed for trees with diameter less than 80 mm Lighting Columns Installation of a VRS is generally needed for High Mast or regular Lighting Columns, unless they are designed to be passively safe and tested in accordance with EN More details on the use of passively safe structures can be found in the CEDR Forgiving Roadside Design Guide ( Sign / Signal and Gantry Supports Installation of a VRS is generally needed for Sign / signal and gantry supports, unless they are designed to be passively safe and tested in accordance with EN More details on the use of passively safe structures can be found in the CEDR Forgiving Roadside Design Guide ( Specific consideration should be given for non-passively safe support posts with larger diameters. These are some examples from various standards: in France, a VRS is needed for sign supports with a restraint moment exceeding 5.70 knm. This same value has been adopted also in the new revised Italian Standard; in UK and Ireland a VRS is considered for sign posts not meeting requirements of EN12767 which exceed the equivalent section properties of a tubular steel post having an external diameter of 89 mm and a nominal wall thickness of 3.2 mm. This limitation is slightly more conservative than the one adopted in France and in Italy; in Denmark, installation of a VRS is needed for steel posts with a diameter greater than or equal to 76 mm. 9
17 Intersecting / Transverse Ditches Intersecting / Transverse ditches, if not covered properly, may cause high severity outcomes due to high angle impacts. Installation of a VRS should generally be considered, if the ditch cannot be made traversable, and if a head-on impact is likely. These are some examples from various standards: in USA, a VRS is generally needed if likelihood of head-on impact is high; in Denmark, a VRS is generally needed for transverse ditches; Culverts, Pipes, Headwalls Installation of a VRS is generally considered for drainage pipes, culverts and headwalls. The decision should include engineering judgment based on the size and shape of the obstacle. These are some examples from various standards: in USA, a VRS is considered based on size, shape and location of culverts, pipes and headwalls; in UK, a VRS is general considered for drainage culvert headwalls; in France, a VRS is necessary for culvert heads, except those implemented along the road or fitted with crash worth terminals or crash cushions Bridge Piers, Abutments, Railing Ends A VRS is generally needed for bridge piers, abutments and railing ends Other Non-Deformable Single Hazards Installation of a VRS should also be considered for the following non-deformable select individual objects: boulders; above ground equipment: o emergency telephones; o CCTV masts; o communication control cabinets; o stores for signs; o etc.; ends of concrete barriers, retaining walls, etc; wooden poles or posts with cross sectional area greater than 25,000mm 2 that do not have breakaway features; timber post and rail fences if not being used as a road boundary; substantial fixed obstacles extending above the ground by more than 150mm; concrete posts with cross sectional area greater than 15,000mm 2. 10
18 2.3.5 Permanent Bodies or Streams of Water Getting submerged in a permanent body of water can have high severity consequences for the occupants of an errant vehicle. In case of sensitive bodies of water, such as reservoirs and sources of drinking water, contamination caused by an errant vehicle can also have dire consequences for other people using the source. Installation of a VRS should generally be considered for current or potential bodies of water, depending on the depth of water and significance. These are some examples from various standards: in UK and Ireland a VRS is considered for permanent or expected water hazards with a depth of water 0.6 m or more; such as rivers, reservoirs, stilling ponds or lakes; in Austria, a VRS is necessary in areas adjacent to bodies of water, where the depth of water, channel cross section, etc. pose a particular risk; in Finland, a VRS is warranted for bodies of water deeper than 1 m, for at least one month per year; in Slovenia, a VRS is needed for road running parallel to a stream with a mean water level deeper than 2 m; near protected streams (regardless of the depth) and through water protection area (Zone2), where permitted speed is more than 90 km/h Chemical Works, Petroleum Storage Tanks, Locations of Hazardous Material Chemical Plants, Petroleum Storage Tanks and facilities manufacturing or storing other hazardous materials in bulk may have catastrophic effects after an impact by an errant vehicle. This is mentioned in almost all of the standards examined in WP1. A roadside barrier should be installed along such locations Heavily Used Walkways, Locations of Public Gathering An errant vehicle going into a busy public location with frequent pedestrian activity (including playgrounds) can cause a high number of casualties. The risk is higher for locations with a higher volume of pedestrian traffic and if the average time each person exposed to risk is longer. A VRS is generally considered for heavily used walkways and locations of public gathering Heavily Used Bicycle Paths Similar to heavily used public locations, heavily used bicycle paths are under risk to errant vehicles. A VRS should generally be considered depending on the AADT of bicycles on the paths. 11
19 2.3.9 Adjacent Rail Lines The collision of an errant vehicle with a train can have severe consequences; as it was the case in the Selby rail crash in England (2001) where 10 people died and 82 people suffered serious injuries. Unlike other stationary 3 rd party hazards, the likelihood of an impact with a train is also dependent on the average number of trains on the tracks. Busier rail tracks pose a higher risk. A VRS should generally be considered along adjacent rail lines, depending on the frequency and speed of trains on the tracks. These are some examples from various standards: in Germany, a VRS is needed for adjacent rail lines with more than 30 trains every 24 hours; in Spain, a VRS is needed for high-speed rail lines with an annual average of more than 6 trains per hour. A VRS is also needed for high-speed rail lined with an annual average of more than 6 trains per week, which contains at least one wagon loaded with flammable materials or toxic gasses; in Italy (in the new revised standard), a VRS is required if the rail line is closer than 12 m measured from the base of the road embankment Adjacent Roads An errant vehicle going into another stream of traffic can cause serious traffic crashes with catastrophic consequences. The risk is higher for adjacent roads with a higher AADT and faster traffic flow speed. A VRS should generally be considered for adjacent roads, depending on the speed and AADT. These are some examples from various standards: in Germany, a VRS is considered for adjacent roads with an AADT over 500 vehicles per day; in Italy (in the new revised standard), a VRS is required on the edge of the main road if the adjacent line is closer than 12 m measured from the base of the road embankment only for adjacent roads with an AADT over 1000 vehicles per day or a carriageway width above 5 m; in Finland, a VRS is warranted along adjacent roads with an AADT between 350 to 3000 vehicles per day Structures at Risk of Collapse Some structures, such as bridge support elements or gantry supports have a risk of collapsing on other road users after an impact by an errant vehicle, particularly a heavy goods vehicle. These structures should generally be shielded by a VRS. 12
20 Objects which can Cause Severe Traffic Disruptions if Damaged Some roadside objects or structures can be vital for the free flow of traffic. If damaged, these may take a long time to repair or replace, which could cause severe traffic disruptions. In such cases, the cost of a VRS may be less than the potential cost of traffic disruption. A VRS should generally be considered along such objects/structures Environmental Concern Such as Source of Drinking Water An errant vehicle going into an environmentally sensitive area such as a source of drinking water can have serious environmental impacts. A VRS is generally considered along areas of environmental concern. 2.4 Risk assessment methods for identifying the need for a VRS Within all of the countries examined in D1.1. Deliverable, risk assessment processes are undertaken, to varying degrees, to ascertain when and where a barrier is required. In all cases, this starts with an examination of the features of the local site and the subsequent application of the clear zone concept (i.e. remove, relocate, make passively safe, and/or delineate). Hazards remaining within the clear zone are then assessed using a risk based approach to determine how the risk associated to these hazards should be dealt with. If it is financially viable, there is the option of protecting road users from the hazard with a vehicle restraint system. The assessment of the remaining hazard varies from country to country, and further details of the methods used are given within deliverable D1.1. However, by way of a summary the approaches can range from the use of simple statements regarding requirements at specific hazards to complex computer systems: Simple statements such as Use barriers in front of dangerous point or lateral hazards are used in Croatia and in Italy. Similarly in Cyprus, the requirements is to use a VRS Where any of the following highway design features occur at or within 4.5 m from the edge of the paved carriageway: Retaining walls with a non-smooth traffic face up to 1.5 m above the carriageway level; Exposed rock faced cuttings slopes, rock filled gabions, crib walling or similar structures and which are less than 1.5 m above the carriageway level; Reinforced soil cutting slopes or earth banks greater than 1 m high and with a side slope gradient of 1:1 or steeper; Environmental noise barriers or screens; Structural supports such as overbridge piers, columns and abutments, etc. Furthermore statements and bulleted lists such as these are also used within countries including Denmark, France, Israel, Slovenia and Switzerland. 13


21 Risk Classification models, such as those used in Belgium (Flanders), and Germany provide guidance for a pictorial view of risk assessment which then give further guidance on the containment and/or use of barrier systems with a particular level of performance as shown in Figure 2 and in Figure 3. Figure 2: Risk classification processes used in Belgium (Flanders) 14


22 Figure 3: Risk classification processes used in Germany In Spain, a tabulated view is used for determining the accident risk at any particular site, taking into account the local features and characteristics of the site, as shown in Figure 4. Figure 4: Tabulated assessment of risk, as used in Spain The hazards at the site are then assessed for their level of hazardousness, and an overall risk ranking for the site is determined. The containment level of the barriers to be provided is then subsequently specified, as shown in Figure 5. Figure 5: Determination of barrier containment level, based on accident risk in Spain In a similar way, the new risk assessment procedure contained within the Irish TD19/13, requires the designer to establish if there is a hazard within the clear zone and if so, whether it can be mitigated. The hazard is then ranked as having a high, medium or low severity level. Next the sinuosity of that section of road is calculated and the collision rate threshold for that section of road is established. The risk of a vehicle leaving the road based on sinuosity ranking and collision rate ranking is then established. The hazard ranking and the risk of a vehicle leaving the road are then used to determine an overall risk ranking for the hazard. If the overall risk ranking is high, a barrier must be installed; if medium risk than a 15
23 barrier must be used if the hazard is within 2 m of the edge of the carriageway, and the hazard must be further assessed if the hazard is 2 m or more away from the edge of the carriageway. If the overall risk is low, no safety barrier is required. As part of the overall process, it is greatly emphasised by the Irish requirements that an on-site review of the hazards is required. The RRRAP system developed within the UK, and the RSAP programme used within the US and Australia are both examples of complex black box systems which automatically undertake the risk assessment process, providing advice and information relating to the effectiveness of certain vehicle restraint systems. In the case of the RRRAP, the full details of a site, such as road type and classification, traffic flow, percentage of HGVs, the presence, location, size and type of hazards are inputted into the system. Options for treatment of the hazards in the form of VRS provision can then be entered, and the resulting level of risk is then received as an output. The aim of the process is to reduce the level of risk to As Low As Reasonably Practicable (ALARP principals). Whilst providing a complete and traceable methodology for auditing purposes, such systems often require a great deal of complex and detailed information to be entered into the systems. 2.5 Decision on Where a Median Barrier is needed Crossover crashes often have catastrophic consequences. The risk of an errant vehicle colliding with other vehicle on the opposite stream goes higher as the AADT on the adjacent road goes up, and as the distance between two carriageways goes down. More severe consequences are also likely for higher traffic speeds on each direction of the road. A VRS should be considered for medians depending on the, median width, the AADT on each side of the road, the speed limit and the topography of the terrain in between. These are some examples from various standards: in USA, a median barrier is recommended on high-speed, fully controlled access roadways for locations where the median is 9.1 m in width or less, and the AADT is greater than 2000 vehicles per day. For locations with median widths less than 15.2 m and where the AADT is less than vehicles per day, a median barrier is optional; in UK, a safety barrier must be provided on dual carriageways where the width of the central reserve measured between opposing edges of carriageway road markings (or kerb faces where no markings) is 10 m or less; in Austria, a VRS is necessary on medians of dual carriageways with a speed limit above 70 km/h; in Italy, a median barrier is required for median widths (excluding the shoulders) below 12 m; in Sweden, a barrier is always required in the median. 16
24 2.6 Decision on Where a Bridge Parapet / Barrier is needed: A VRS should be installed along all bridges. It should be noted that protection needs to be extended beyond the bridge parapet in both approach and departure. Different criteria can be found to define these extensions: as an example in Ireland the protection needs to be extended for a minimum of 30 m in advance of the approach end and 15 m after the departure end of a vehicle parapet or vehicle/pedestrian parapet while in Italy a length of 1/3 of the minimum device length is required on both edges, in the revised standard. 2.7 Definition of the Length of Need The Length of Need concept The length of roadside that must be protected by a VRS depends on the size of the hazard and its placement relative to the road edge. This is usually called Length of Need (LON). The geometrical characteristics of the hazard do not influence the containment class of a VRS but they do influence the length of the installation and thereby the costs. The SAVeRS project investigates the type of VRS to be installed and provides information to support estimated the lifecycle costs but calculating the exact length of need for a VRS is beyond the project s scope. The information in this section is provided for the SAVeRS user to understand the implication of segment lengths used as an input in the tool Length of Need Background Many national guidelines contain guidance on the length needed for a VRS depending on the roadside hazards. Most guidance documents use the approach and data developed in the US which are based on an assumed vehicle trajectory depicted in Figure 6. If the vehicle leaves the road and continues along a straight, the length b upstream from the hazard can be determined. The length a represents the projection of the hazard s length onto the road. If there is two way traffic, then a vehicle could cross over the centreline and strike the hazard from the other direction. This would generate a distance c downstream from the obstacle. As there is a lateral offset (or shy distance) of the barrier from the travel lane (Y s ), the length of need starts downstream a distance (d) from the point where the vehicle leaves the edge the travelled way. The length b+d is also known as the runout length of the vehicle. 17
 and barrier terminals. Unless the end terminal is specifically designed for redirecting an impacting vehicle, its length should not be included in the LON calculation.")
25 Figure 6: Length of Need The length of a VRS to protect the hazard in the example in Figure 6 would be: The additional sections of VRS seen in the figure refer to the barrier anchoring sections (if required 1 ) and barrier terminals. Unless the end terminal is specifically designed for redirecting an impacting vehicle, its length should not be included in the LON calculation. The length defined in this analysis is a geometric requirement that has not been linked to the VRS selection. Type approved VRS have a minimum installation length specified in their type approval testing. The installed length of a VRS must always be greater than or equal to minimum installation length LON Specification The following section provides information regarding LON calculation utilising information available in research literature. The purpose of the following summary is to provide information so the user understands the importance of an appropriate segment length for analysis. In all applications of the SAVeRS tool, the user s local guidelines and policies should be applied. AASHTO has a well developed reference, the Roadside Design Guide (AASHTO, 2011), with updated LON information from the different sources, most significantly Coon et al, The approach used in this document is to determine the LON from the runout length for a roadside area. The lengths are based on observations of vehicle tracks from earlier studies in the 1960 and 1970s and more recently re-evaluated in Coon et al, 1984 and Sicking et al., The data is tabulated for different speed limits and road types and presented in Table 1 As an example the new Italian draft standard requires 1/3 of the minimum barrier length to be placed prior to the section b to allow the barrier to have the full required containment at the beginning of section b. This anchoring section could include the terminal or not depending on the terminal configuration. 18
26 1. The information in the Roadside Design Guide has been developed without reference to the hazard s lateral offset from the road edge. This can result in longer LON calculations if a single hazard is close to road. In this case the trajectory of the vehicle leaving the road is not explicitly used. Table 1: Runout Lengths recommended by Coon, et. al., 1984 Design Speed km/h Over 10,000 5,000 to 10,000 AADT 1,000 to 5,000 Under 1, In an ongoing project, NCHRP (NCHRP, ongoing), estimates of LON are being investigated using the trajectory of the vehicles and the lateral position of the hazards. The trajectories of the vehicles have been documented from US crashes and collected into a database which includes the actual vehicle paths. Using the vehicle trajectories, corridors of the vehicle excursions can be created which then identify the runout length and resulting LON on the roadside. Figure 7 shows the trajectory envelopes (coloured areas) encompassing different percentiles of excursions that would strike a hazard placed 10 m from the road. The new analysis suggests that the AASHTO recommendations reflect the 85th-90th percentile of the trajectories. The two AASHTO curves shown in Figure 7 represent the lowest and highest values recommended for a road based on traffic volumes. The influence of explicitly using the vehicle trajectories is demonstrated in Figure 8 where a 3 m obstacle distance is used for a reference. The actual trajectories suggest a much smaller LON is needed to shield a hazard, about 20 m (for the 85th percentile coverage level) compared to over 60 m for the lowest protection level suggested by AASHTO. The AASHTO lengths are seen to be unaffected by the hazard position when comparing this figure to Figure 7 for a 10 m hazard distance. 19

 Roads [source: NCHRP 17-43")
![project] Figure 8: Influence of the Hazard](/docs-images/83/88060144/images/27-2.jpg "Position on the LON [source: NCHRP 17-43")
27 Figure 7: Upstream LON Requirements Based on Actual Trajectories and Compared to AASHTO 2011 Recommendations (dashed lines) for 96 km/h (60 mph) Roads [source: NCHRP project] Figure 8: Influence of the Hazard Position on the LON [source: NCHRP project] 20
 is shown in Figure 9. Two point hazards with their associated LON (in blue) are shown.")
28 2.7.4 Application to the SAVeRS Guideline The SAVeRS analysis tool considers user defined segment lengths to identify the crash risks of a specific site. An example of a roadside with 2 point hazards (in red) is shown in Figure 9. Two point hazards with their associated LON (in blue) are shown. The SAVeRS tool does not use the position or number of the point hazards in the calculation, thus the user must know how the LON influences the assessment. If the reference length shown in the figure is used, the entire length of roadside will be used to calculate the accident rate and costs. As shown in the figure, not all the roadside necessarily needs protection and this may lead to longer installations than needed. The user can select to reduce the analysis length to just include both hazards or even divide the segment into two separate analyses. Figure 9: Roadside Design Case Another case is shown in Figure 10 where the long obstacle is longer than the assessment length. The SAVeRS tool can analyse the crash rate and relative risk of the distributed hazard in terms of injury risk, but the tool will not detect if the assessment length is too short. This will result in an underestimation of the number of crashes on the segment and an underestimation of the costs for the VRS. The user should know in advance what type of obstacles and where they are placed (laterally and longitudinally) along the roadside. As shown in Figure 9 and Figure 10, the user should identify the area to be addressed by the VRS before setting the analysis length in the tool. As a conservative estimate, the AASHTO approach can be used to estimate the LON, ignoring the lateral offset of the hazards. Information on the AASHTO approach is documented in full in the Roadside Design Guide (AASHTO, 2011). 21

29 Figure 10: Example of Short Assessment Length In the SAVeRS tool the b and c values of the LON are given. To obtain the total LON the designer needs to consider if it is a single isolated hazard or e series of hazards with overlapping LONs. If the VRS installation length should be as small as possible, the approach being developed in NCHRP Project can be applied but the full range of LON for different road categories is not available at the time of writing. Given that the 85th-90th percentile values for the 10 m hazard distance estimated in the NCHRP project show a very good agreement with the AASHTO Roadside Design Guide while for shorter offsets the LON is proportionally reduced (given the same design speed), the AASHTO values (evaluated for the specific design speed and AADT) could be scaled with the offset distance, for example a 5 m hazard offset would require half the LON length as a 10 m hazard. Note that this should not be extended to case where a hazard on the road edge has a zero LON. In the tool both the AASHTO value and the reduced value are given and the evaluation is limited to a distance from the front of the barrier (considered at the edge of the shoulder) equal to the barrier working width. If the distance is smaller the interaction between the barrier and the obstacle needs to be assessed as shown in La Torre et al., 2015 with reference to the presence of a Variable Message Sign in the working width of the barrier. This study has shown that if the distance between the barrier and the obstacle is reduced below a certain value (to be determined for the specific barrier/obstacle configuration) the system will not offer the full performance for which it is designed. 22
30 3 SAFETY BARRIERS (INCLUDING BRIDGE PARAPETS) 3.1 The multi-level approach As different countries, as well as different designers within a country, have different level of expertise and different data availability, the SAVeRS procedure has been structured with different possible application levels, as shown in Table 2. Table 2: SAVeRS Multilevel approach LEVEL DATA AVAILABILITY SAVeRS APPROACH 1 Very detailed data available Full SAVeRS selection procedure 2 Limited data available Reduced SAVeRS Selection procedure 3 No data available Default selection criteria Each model in the SAVeRS tool is designed allowing the user to change the calculation parameters as compared to the default ones. Where possible different default parameters sets are given for different conditions in order to allow the user to select the one that fits better the specific case analysed. One of the core parts of the SAVeRS procedure is the estimation of the Single Vehicle Run Off Road crashes (SVROR) where, as an example, the user can: develop a specific base function and calibrate the overall model based on local data (Level 1); adopt one of the default base models and calibrate the full model based on local data (Level 2); select one of the default distributions (Level 3). The different components of the SAVeRS tool are described in this guide together with the default values included in the tool. 3.2 Decision process As indicated earlier the widely used definition of Risk is a product of Likelihood and Consequences, as shown in Figure
31 Figure 11: The risk model used to categorize the parameters In the SAVeRS approach the likelihood is estimated by means of a SVROR model that has been developed in WP2 based on the data from: UK, Ireland, Italy, Sweden and Austria (for motorways); Ireland and Sweden (for two-lane two-way rural roads). The SVROR model, as implemented in the tool, is described in section 3.3 of this Guideline. A more detailed description of the model development can be found in WP 2 Deliverable (D2.1 Analysing the Different Parameters which influence the need and selection of VRS ). To evaluate the possible consequences of a SVROR crash two different conditions has been identified: crashes where the vehicle is contained and the VRS is not penetrated; crashes where the vehicle is not contained and the VRS is penetrated. To identify the conditions where the VRS can be penetrated a set of impact kinetic energy (IKE) distribution functions have been defined as described in section 3.2. The impact kinetic energy is defined as: where: M = the vehicle mass [tonnes] V = speed of the vehicle at the time of impact [m/s] = the angle of impact Conceptually this is the kinetic energy that the VRS is exposed to in the crash if only the lateral component of the impact velocity is considered. This is a simplified expression that captures the basic physics of the crash but does not consider the complex contact phenomena that are also part of the crash between different structures. [kj] Considering the VRS containment levels defined by EN the following IKE values can be associated to each containment level (Table 3). If a vehicle is tested in H4 class with TB81 testing conditions (with a tractor-trailer instead than with a rigid truck) the H4a IKE 24
32 value need to be considered as the tractor-trailer IKE is not directly comparable with the rigid truck IKE values. Low angle devices are not considered in the SAVeRS procedure as these are applied to work zones and temporary protections. Table 3: IKE values for EN test conditions Application Test Level Mass [kg] Low Angle Speed [km/h] Angle [deg] IKE [kj] T T T Normal High N N H H H Very High H4a H4b In the SAVeRS procedure different sets of impact energy distributions are given for Passenger Cars (PC) and for Heavy Goods Vehicles (HGV) as described in section 3.4 but the user can define different IKE distribution functions. The Severity Distribution Functions (SDF) are implemented in the SAVeRS tool to estimate the consequences of each crash. The consequences of injury crashes are classified according to the KABC scale with the following definitions: K A B C Fatal crash Incapacitating injury crash Non incapacitating injury crash Possible injury crash Property damage only crashes are not considered in the SAVeRS model as these are generally underreported and do not represent a critical crash for road restraint system. 25
33 For the definition of the SDFs the following conditions are considered in the SAVeRS tool (see section 3.5): crashes with impact energy below or to equal the VRS containment level (VRSCL). Even though there is no immediate relation between the IKE and the VRSCL as the actual containment depends on the combination of mass, angle and speed, this type of crash is conventionally considered to be contained by the VRS and the consequences are set to different values for different VRSCL as defined by EN It should be noted, anyhow, that crashes with the same IKE can have completely different dynamics and therefore there is no guarantee that a crash with IKE below the VRSCL is actually contained or vice versa; crashes with an impact energy above the VRS containment level (VRSCL). This type of crash is conventionally considered to potentially lead to a barrier penetration. For high risk bridge decks and median barriers the consequences have been considered always fatal with a conservative assumption. For other installations a SDF function has been implemented in the SAVeRS tool considering also the hazard that the VRS is shielding. All the default SDFs implemented in the SAVeRS tool can be modified by the user. Based on the outcome of the accident evaluation a Whole Life Cost (WLC) evaluation is then performed considering: societal costs due to crash consequences; hardware related costs (construction, maintenance and repair); as described in section 3.6. The current version of the SAVeRS Tool doesn t account explicitly for the traffic management cost due to the repair work zone (the cost is given per unit length). This could be added in future releases as a fixed figure per each crash provided that these figures can be made available as a fixed value independently of the traffic during the event. The WLC analysis allows to compare directly in one single run different alternatives for the same VRS class. For comparing the user risk associated with different VRS classes for the same project different runs of the Tool need to be performed and the results compared offline. The overall SAVeRS procedure for selecting the most appropriate VRS with respect to safety barriers and bridge parapets is described in Figure
34 ROR prediction model inputs ROR PREDICTION MODEL % HGV Car ROR crashes HGV ROR Crashes Select PC impact energy distribution Select HGV impact energy distribution VRSCL minimum based national requirements VRS containment level (VRSCL) % Impact energy VRSCL % Impact energy > VRSCL % of Impact energy VRSCL % of Impact energy > VRSCL Number of crashes with Impact energy VRSCL Number of crashes with Impact energy > VRSCL Return time of penetrations per structure or per km below XXX severity distribution Median/ high risk Bridge Other bridges Verges severity distribution severity distribution Roadside Hazard Return time of fatalities per structure or per km below XXX VRS type WLC Increase the VRSCL if needed based on the risk chart Figure 12: SAVeRS procedure for selecting the most appropriate VRS (for safety barriers and bridge parapets) To account for third party risk a separate analysis has been performed comparing the requirement of different national in order to develop a risk matrix. 27
35 Consequences Normal Relevant High Likelihood (relevant risk to third parties) (high risk to third parties) Low L M H Moderate L H H High L H VH When the roadside configuration can be rated as normal (without special hazards for third parties) the selection is based solely on the results of the WLC calculations. When additional risk factors for third parties are present: When a Medium (M) risk condition is estimated increasing the optimal WLC VRS class by one level should be considered with a minimum performance class of H2; When an High (H) risk condition is estimated increasing the optimal WLC VRS class by one level should be considered with a minimum performance class of H3; When a Very High (VH) risk condition is estimated increasing the optimal WLC VRS class by one level should be considered with a minimum performance class of H4. The criteria to define the high and very high third party risk situations are based on the worldwide review of the different national standards conducted in WP1 (see Deliverable D2.1 for more details). The likelihood classes (low/medium/high) have been defined in the SAVeRS tool based on following assumption: For long span conditions (e.g. railways running parallel to the road under evaluation) - Low Likelihood = 1 barrier penetration/km every 100 years 2 ; - Moderate Likelihood = 1 barrier penetration/km every years; - High Likelihood = 1 barrier penetration/km every 0-50 years. For local conditions limited to an extension below 1000 m (e.g. a high risk structure adjacent to the road under evaluation) 2 This return time is based on the 100 year fatalities return time threshold defined in section 4.1. Even assuming a 100% fatality rate, if the penetrations return time is above 100 years the fatality return time would still be above 100 years. If a different threshold is considered these risk levels should be adapted accordingly. 28
36 - Low Likelihood = 1 barrier penetration every 100 years or more; - Moderate Likelihood = 1 barrier penetration every years; - High Likelihood = 1 barrier penetration every 0-50 years; These frequency values can be defined by the different NRAs for application in each country. Based on the indications gathered in WP2 the following definitions of Relevant Risk and High Risk to third parties has been given in the SAVeRS procedure but this can be adapted in national regulations. High risk to third parties: chemical plants within the clear zone or a fixed distance (e.g. 12 m in Italy); intensively used locations; high speed rails or rapid transit lines (overpassed or within the clear zone or a fixed distance, e.g. 12 m in Italy); structures not designed to bear the impact of an errant vehicle the collapse of which could have severe consequences on third parties (within the clear zone or a fixed distance). Relevant risk to third parties: motorways, primary highways or roads with and AADT above a nationally defined value (e.g. Italy 1000, Germany 500) (overpassed or within the clear zone or a fixed distance, e.g. 12 m in Italy); public areas with frequent pedestrian activities (including playgrounds) within the clear zone or a fixed distance; environmental concern such as a source of drinking water overpassed or within the clear zone or a fixed distance (e.g. 12 m in Italy). 3.3 Run Off Road model Structure of the Run Off Road Model The Run Off Road model implemented in the SAVeRS tool has been developed in WP2 (see D2.1 Analysing the Different Parameters which influence the need and selection of VRS for more details) with a structure allowing for the maximum flexibility and adaptability to local conditions. The crash prediction model has the following structure. where: N pred,i is the predicted average SVROR crash frequency for a specific year for a site i; 29
37 N SPF,i is the predicted average SVROR crash frequency determined for base conditions for site i (base model); CMF y,i are the Crash Modification factors specific to site i; C is the calibration coefficient to adjust the prediction for local conditions (national, regional, by network etc). This structure has the advantage to allow for a very high degree of flexibility and adaptability to different conditions. The SAVeRS tool user can: select one of the models already available in the SAVeRS tool; select one of the base models already available in the SAVeRS tool and perform an overall calibration to the local network as described in Annex 3 (for motorways) and Annex 4 (for two-lane two-ways rural roads); fit the base model functional form to local data as described in Annex 2 and perform an overall calibration to the local network as described in Annex 3 (for motorways) and Annex 4 (for two-lane two-ways rural roads); replace the number of crashes estimated by the SAVeRS SVROR model with locally derived crash values (typically based on an Empirical-Bayes evaluation). The statistical methods to derive local crash data are not discussed in this Guideline. More details can be found in the AASHTO Highway Safety Manual (AASHTO, 2010 and AASHTO, 2014). In the following sections the SAVeRS SVROR models for motorways and rural two-lane twoways roads are summarized. More details on the model development can be found in D2.1 Analysing the Different Parameters which influence the need and selection of VRS Motorways Base model The functional form used in SAVeRS for the prediction of the number of SVROR in base conditions is: where: Sec_Length is the section length (in m); AADT is the annual average daily traffic (vehicles/day). This functional form has been calibrated for the motorway networks of Austria, Ireland, Italy, Sweden, UK extracting from the accident database a set of sections with the following characteristics: Road type: median divided dual carriageway 30
38 Roadway type: segments (not including intersections, interchanges, driveways etc.) Area type: rural Terrain: level (between -2 and 2% longitudinal gradient) Alignment: straight roads Number of lanes: 2 Hard shoulder: yes lane width between 3.50 m and 3.75 m outside shoulder width between 2.51 m and 3.00 m inside shoulder width between 0.51 m and 0.75 m; no rumble strips. In Table 4 the models coefficients for the different countries are given together with a summary of the characteristics of the road networks used for fitting the base model. Table 4: parameters of the base models included in the SAVeRS tool and network characteristics for motorways Variables Austria Ireland UK Italy Sweden Type of roads Motorways Motorways Motorways Motorways Motorways Number of sections used Total number of km used Analysis period Total number of crashes AADT range 3300/ / / / Weighted average of AADT % HGV range (*) Weighted average of %HGV (*) few outliers with higher HGV percentages can be found in the UK database. These are not considered in the normal application range given in this table 31
39 Selection of Crash Modification Factors (CMFs) To account for the specific condition of a given project a set of Crash Modification Factors (CMF) are given for the following aspects: number of lanes; outside shoulder width (shoulder adjacent to the slow moving traffic); inside shoulder width (shoulder adjacent to the median); longitudinal gradient; shoulder rumble strips; lane width; horizontal curvature. To allow for a simpler use of the tool the CMF values are given by ranges allowing the user to define an average value within a given range without the need for a very narrow segmentation in homogenous sections. For the horizontal curvature CMF, a function is given and the user will have to describe the geometric layout in the tool (in terms of radius and length of each curve). The following tables show the CMF values implemented in the SAVeRS tool. More details on these CMF are given in D2.1 deliverable. The user can modify the CMF values in the tools after activating the Show CMF sheets to modify SAVeRS default CMF calculations option but in doing this it is important to remember that all the CMFs are referred to a specific set of base condition. A CMF derived with base conditions different from the ones listed above shall not be used. Table 5: CMF for increasing the number of lanes Base condition Specific design CMF L 2 lanes 3 lanes lanes 3 lanes lanes 4 lanes 1.31 Table 6: CMF for increasing the outside shoulder width Shoulder width [m] Median [m] Median [feet] CMF OSW < 1.00 not applicable
40 Table 7: CMF for increasing the inside shoulder width Shoulder width [m] Median [m] Median [feet] CMF ISW < 0.50 not applicable Table 8: CMF for gradient classes Gradient range [%] Median [%] CMF G x < x < x < x < x < x x > Table 9: CMFs for shoulder rumble strips Proportion of straight segment length (P OR ) CMF RS No rumble strips % of segment % of segment % of segment % of segment % of segment % of segment
41 70% of segment % of segment 0.92 > 90% of segment 0.91 Table 10: CMF for lane width Lane width [m] Median [m] Feet CMF LW < 3.00 Not applicable For the horizontal curvature effect a Crash Modification Function is given as shown below: where: CMF HC = Crash Modification Factor for horizontal curvature in a freeway segment with any cross section for fatal-and-injury single-vehicle crashes R i P c,i m = Radius of curve i (feet) = Proportion of segment length with curve i = Number of horizontal curves in the segment This function is already implemented in the SAVeRS tool and the user is only required to describe the geometry in terms of number of curves and their extension in the project length Calibration Coefficients for Run-Off-Road crashes on motorways In most cases, CMFs from the literature do not reflect the actual road and traffic situation in the respective countries. Hence, so called calibration factors (C-values) need to be calculated to account for differences in the jurisdiction and time period to which they are applied. 34
42 The calibration coefficient in the prediction model accounts for all the factors that lead to safety differences and are not already considered by the crash prediction model. The C-value is defined as the simple ratio between the total number of predicted (N pred ) and observed (N obs ) number of crashes defines the calibration factor (C): In Table 11, the C-values for Austria, Italy, Sweden and the UK are given together with a summary of the characteristics of the road network used for calibrating the overall ROR model. Due to lack of sample data, no calibration factor for Irish motorways can be provided. The guidelines for calibrating the SVROR model to a different network are given in Annex 3. Table 11: parameters of the full models included in the SAVeRS tool and network characteristics for motorways Variables Austria UK Italy Sweden C Type of roads Motorways Motorways Motorways Motorways Number of sections used Total number of km used Analysis period Total number of crashes AADT range 3300/ / / /21276 Weighted average of AADT % HGV range 3.2/ / / /18.5 Weighted average % HGV Number of lanes range Lane width range (m) Minimum curve radius (m) / / (*)
43 inside shoulder width range (m) outside shoulder width range (m) Longitudinal grade range / / / / / /+1.53 Rumble strips (Y/N) N N N Y The model is calibrated considering the total SVROR crashes while the SAVeRS tool requires to split the crashes in passenger car crashes and HGV (trucks and buses) crashes. A common assumption is that the accident risk is the same and therefore the number of crashes with HGV (N HGV ) would be given by: where %HGV is the percentage of HGVs in the traffic mix. Recent studies show that this assumption is not valid for ROR crashes. In the NCHRP project (Ray et al, 2012) a correction factor of 0.3 has been introduced to account for the reduced ROR risk of HGVs. Using the Italian, UK and Irish entire fatal+injury SVROR crash dataset the following statistics have been derived for motorways: in UK a 0.5 HGV risk correction factor was estimated; in Italy a 0.61 HGV risk correction factor is was estimated; in Ireland a 0.51 HGV risk correction factor is was estimated. This extensive evaluation confirms that there is a correction factor to HGV crash estimates and therefore for each country as well as for the user defined model a correction factor is allowed. For the counties for which the HGV crash risk correction factor is not yet available the value of 0.61 as been adopted being the highest of the values calculated Two-lane, two-ways rural roads Base model Smaller, non-motorway road types were modelled in a similar fashion as motorways. Only two partners, VTI (Sweden) and TCD (Ireland), had data available for conducting this analysis. The Irish data were constrained to state roads with speed limits of 100 km/h. 36
44 Swedish data was available for most road types but a lack of crash data and diversity of road configurations required that a pragmatic constraint to two-lane two-ways rural roads with carriageway widths between 9 and 10 m were used. More details on the respective country models are presented in the deliverable D2.1. The two base models are slightly different as the Swedish model includes also the posted speed as an explanatory variable in the base model. The base model for two-lane two-ways rural roads has therefore the following form: where: Sec_Length is the section length (in m); AADT is the annual average daily traffic (vehicles/day); speed is the local speed limit (km/h). This functional form has been calibrated extracting from the accident database a set of sections with the following characteristics: road type: two-lane two-ways single carriageway roadway type: segments (not including intersections, interchanges, driveways etc.) area type: rural terrain: level (between -3 and 3% longitudinal gradient) alignment: straight roads hard shoulder: yes lane width not below 3.50 m outside shoulder width between 1.50 m and 2.10 m In Table 12 the models coefficient for the different countries are given together with a summary of the characteristics of the road network used for fitting the base model. Table 12: parameters of the base models included in the SAVeRS tool and network characteristics for two-lanes two-ways rural roads Variables Ireland Sweden (not used in the model) 0.445x10⁻² Type of roads Rural two-lane two-ways Rural two-lane two-ways 37
45 Number of sections used Total number of km used Analysis period Total number of crashes AADT range Weighted average of AADT HGV Range / 7-24 Number of lanes range Selection of Crash Modification Factors (CMFs) The application of the crash prediction model to the specific condition of a given project requires a set of Crash Modification Factors (CMF). The CMFs for motorways cannot be applied to rural roads and a set of appropriately derived CMFs for rural roads were obtained from the AASHTO Highway Safety Manual (AASHTO, 2010). The following CMFs were identified and implemented into the model: outside shoulder width; longitudinal gradient; lane width; horizontal curvature. The CMF for the shoulder width is given in Table 13 which uses a 1.8 m (6 ft) paved shoulder as a reference. The CMFs in Table 13 are taken for AADT over 2000 which are the highest values. Table 13: CMF for the outside shoulder width Shoulder width [m] Median [m] Median [feet] CMF OSW x < x < x < x < x
46 The CMF to account for the grade of the road is given in Table 14 and is independent of AADT. The baseline condition is a road with gradient between -3% and 3%. Table 14: CMF for longitudinal gradient Gradient range [%] Median [%] CMF G x < x < x < x < x Lane width can be modified by the CMFs listed in Table 15. These values are based on AADTs greater than Table 15: CMF for Lane Width Lane width [m] Median [m] Median [feet] CMF OSW x < x < x < The CMF that accounts for horizontal curvature is given by the equation Where L c and R are the curve length (in feet) and curve radius (in miles) and S is the presence of a spiral transition (no transitions S=0, transition at one end S=0.5, transitions at both ends S=1.0). 39
47 Calibration Coefficients for Run-Off-Road crashes on two-lane, twoways rural roads The calibration coefficient for Ireland was not calculated since no data for road segments not complying to the baseline criteria were available but the tool allows to input a calibration coefficient. The Swedish model was calibrated with only with the inclusion of grade and only marginally increased the sample size. The Calibration constant for Sweden was C= The calibration coefficient can be derived from crash, traffic and infrastructural data with the same procedure described in Annex 4. For two-lane two-ways rural roads the evaluation of the HGV correction factor was not as extensive as for the motorways due to the fact that the overall crash data were available only from Ireland and the traffic data was not coupled with the detailed crash database. Considering an average HGV percentage in the mix a correction factor of 0.19 was estimated but this should be further investigated. 3.4 Impact energy distribution models The selection of a VRS has several components but one critical parameter to understand is the structural capacity, or containment level, of a VRS. To compare a specific crash with a given VRS containment level the Impact Kinetic Energy (IKE) is considered, as described in section 3.2. To identify the distribution of IKE values there are very limited datasets and mostly referred to passenger cars. For this type of vehicles the IKE distributions available in the SAVeRS tool are: the US RSAP3 distributions (NCHRP Project 22-27) for single carriageways and dual carriageways; the German GIDAS distributions (German In Depth Accident Survey) for Motorway - Dual carriageways, Highway - Dual carriageways and Rural - Single carriageway roads. For each distribution curve, the probability of having an IKE not higher than a given IKE* can be calculated as shown in Figure 13. In the SAVeRS tool the probability of having an IKE not higher than the IKE corresponding to the different VRSCL indicated in Table 3 is given for each of these curves. The user can add a user defined curve in the tool based on different datasets. 40
48 Probability of IKE IKE* (%) CEDR Call 2012: Safety: Use of Vehicle Restraint Systems US - Dual carriageways 40 US - Single carriageway Germany - Motorway - Dual carriageways 20 Germany - Highway - Dual carriageways Germany - Rural - Single carriageway IKE* (kj) Figure 13: comparison between passenger cars Impact Kinetic Energy in the SAVeRS tool To complete the understanding of applied loading on the VRS in real world conditions, the expected departure conditions for heavy trucks must be included. Unfortunately there are no databases with HGV crashes available to create similar exit condition plots as for passenger cars. Generally speaking the HGV impact angle distribution would be lower than the passenger car distribution and therefore in the RSAP3 model (RSAP3, 2013) the approach was to select all the trajectories that are compatible with the sliding conditions of a single unit truck or with a tractor-trailer/multiple units truck. A study conducted by the University of Florence with Cepav Uno in Italy (Domenichini L., La Torre F., Giordano G., 2004), developed a predictive model based on the handling performance of vehicles, position in a travel lane, observed vehicle speed distributions by vehicle type and vehicle type distribution in the mix. This model allows to estimate the distribution of the upper threshold of IKE values assuming that all the crashes will occur at the maximum sliding equilibrium condition for a given vehicle and speed. This assumption is extremely conservative and has been applied for very critical risk evaluations but for VRS design these distributions should be adjusted. Based on the trajectory data given by RSAP3 the following base distributions have been defined excluding from each subset any record where the combination of speed and angle was not compatible with the equilibrium of a single unit truck (or bus) or with a tractortrailer/multiple unit truck. The equilibrium evaluation criterion is defined in Annex 5 where the 41
49 original procedure has been adjusted to be applied to the SAVeRS procedure. Different limiting conditions are defined depending on the number of lanes (2 or 3), the position on the lane (lane 1 is the outer, lane 3 is the closest to the median) and the edge to be considered (roadside or median). In all the evaluations a 3 m wide outside shoulder has been considered and a 0.70 m wide inside shoulder has been considered. Figure 14 shows that majority of impact angles is between 5 and 10. The full procedure defined in Annex 5 has been applied using 2 different datasets from 2 sections on the Italian motorway network: one for a 3 lane section and one for a 2 lane section. Based on the observed mix, lane occupancy for the different vehicle types and speed distribution per lane and per vehicle type the probability of having a vehicle running off with a given combination of speed, mass and maximum impact angle is calculated. The probability distributions calculated with the procedure shown in Annex 5 have been adjusted weighing each impact angle class (0-5, 5-10, 10-15, 10-15, 15-20, above 20) according to the base distributions shown in Figure 14. In the SAVeRS tool the user can define a different distribution that can be derived from experimental data or by applying the Annex 5 procedure to local data. Tractor Trailers Single Unit Trucks/Buses lanes 3 lanes 2 lanes 3 lanes Figure 14: distribution of impact angle for a given travelling lane, HGV type and road configuration (number of lanes) The different HGV distribution curves are shown in Figure 15 (for roadsides) and in Figure 16 (for medians). The distribution curves calculated with the threshold values (physical upper limit of the impact angles) can be calculated based on the procedure in Annex 5 but, as indicated earlier, this should not be used for design purposes unless very critical conditions have to be analysed (e.g. possible impact with an extremely high risk structure close to the roadway). 42
50 Probability of IKE IKE* (%) Probability of IKE IKE* (%) CEDR Call 2012: Safety: Use of Vehicle Restraint Systems Motorway Roadside_2 lanes 30 Motorway Roadside_3 lanes IKE* (kj) Figure 15: distribution of HGV Impact Kinetic Energy for roadsides (outer edge) Motorway Median_2 lanes 30 Motorway Median_3 lanes IKE* (kj) Figure 16: distribution of HGV Impact Kinetic Energy for medians For rural two-lane two-way roads the experimental data to run the full model are not available and the RSAP3 distribution for single carriageway roads (Figure 17) has been implemented. More details on the mass, speed and angle distributions adopted in RSAP3 can be found at rsap.roadsafellc.com. The limitation is that this assumes the standard traffic mix of the RSAP3 tool. Specific curves can be developed with the full procedure in Annex 5 if speed and traffic mix distributions are made available also for this type of roads. 43
51 Probability of IKE IKE* (%) CEDR Call 2012: Safety: Use of Vehicle Restraint Systems RSAP3 undivided Figure 17: distribution of HGV Impact Kinetic Energy for two-lane two-way rural roads (based on RSAP3 distributions). IKE* (kj) 3.5 Severity distribution functions The Severity Distribution Functions are used in the SAVeRS tool to split the injury+fatal crashes in the KABC scale, as discussed in section 3.2. In the SAVeRS tool the following criteria have been applied for the definition of the severity distributions: when a vehicle potentially penetrates the VRS (IKE above VRSCL): in case of a median or a high risk bridge (tall bridges - with a drop of 10 m or more, important water streams, highly traffic roads, structures behind) a 100% fatality rate is assumed as a safe estimate; for other bridges the data from NCHRP 12-22(03) (Ray and Carrigan, 2014) have been applied showing that out of 38 fatal+injury crashes involving a VRS penetration: 5 were fatal (17.2%), 13 where A injuries (44.8%), 5 where B injuries (20.7%), and only 6 (20% resulted in C injuries); for verges the HSM freeway model distributions without a safety barrier have been applied (HSM, 2014). A correction factor to K, A, B crashes has then been applied based on the UK RRRAP model to account for the different risk related to the hazard that is shielded by the VRS ( Table 16 shows the default hazard risk factors included in the SAVeRS tool. The user can 44
52 adopt these or define a user defined hazard. C type crashes are derived as a difference between the total crashes and the K+A+B crashes; when a vehicle is potentially contained by the VRS (IKE below or equal to the VRSCL) the HSM freeway model SDF has been applied with a correction factor to account for the different VRS class in place. Due to a lack of experimental data the latter is based in the work conducted in 2010 by U. Ehlers, 2010 that compared the potential severity of impacts of N2, H1 and H2 barriers. The correction factors applied in the SAVeRS tools are shown in Table 18 where increasing the VRSCL leads to an increase of severe crashes (K and A) and, consequently, a reduction in the less severe (B and C). The values for H3 and H4 are extrapolated for the H2 to H1 ratio but a specific study to evaluate the severity of impacts with different classes of barriers (including H3 and H4) is deemed necessary. As no direct correlation has been found between the distribution of injury crashes and the EN1317 severity class (based on ASI and THIV indices) in the current version of the SAVeRS tool there are no correction coefficients to account for this. This differentiation could be added in future releases when different severity distributions will be available. Table 16: Default hazard correction factor for barriers penetrations in the SAVeRS tool Hazard type K/A/B No specific hazard 1 Brick/Masonry Wall 1.3 Bridge structure/abutment/rigid wall 1.7 Cabinets (communications/power/electricity supply) 2 Chain link/welded Mesh/Palisade 0.8 Close boarded fence 0.9 Culvert 1.8 Ditch 0.8 Environmental/noise Barrier (concrete/timber) 1.8 Environmental/noise Barrier (earth) 0.8 Lagoon/Water > 1.00 m depth 1.5 Rigid sign/lighting/electricity post/pole and similar (non passively safe) 1.8 Rock
53 Slope_Steep/high slope 1.5 Slope_Very steep/high slope 2 Slope_Extremely steep/high slope 2.5 Tree 2 For the definition of the slope configuration the criteria given in Table 17 could be used (based on the UK RRRAP) but different definitions could be applied adjusted lo different national standards. Table 17: slope risk based on the definitions used RRRAP (UK) Slope Height equal or above (m) Slope risk Falling 1:1 or steeper 1.0 Slope_Extremely steep/high slope Falling 1:1.5-1:1 1.5 Slope_Very steep/high slope Falling 1:2-1: Slope_Very steep/high slope Falling 1:2.5-1:2 2.5 Slope_Very steep/high slope Falling 1:2-1:3 5.0 Slope_Steep/high slope Rising 1:1.5 or steeper 0.5 Slope_Steep/high slope All other conditions, if a barrier is required, can be considered as no specific hazard. Table 18: Default VRSCL correction factor for barriers containments in the SAVeRS tool VRSCL K A B Passenger cars N N H H H H HGV (truck and buses) N N
54 H H H H Whole life cost model The economic impact of a VRS must be based on all costs and benefits that can be grouped into several categories. These different financial elements are defined by the construction and operational costs for the systems and the impact on traffic safety which is a result of the change in injury and societal costs. The following cost categories are considered in the SAVeRS tool: Societal costs (obtained multiplying the number of expected crashes per each category for the unit cost of accidents for a given severity). As the unit cost per crash severity can vary considerably amongst the different countries this value is included in the barriers worksheet for each country; Equipment cost. This is dependent on the specific VRS used and accounts for the following costs items: construction costs (only the first year of analysis) and is given per unit length (m); reconstruction cost that is calculated automatically after the expected design life (that needs to be defined for each specific barrier); maintenance cost (every year) and is given per unit length (m); repair cost: this is based in the repair cost per unit length (m) and estimated length of barrier (m) to be repaired after a crash that depends on the type of vehicle (passenger car or HGV) and the type of crash (contained or penetrated). If the traffic management cost (installing the work zone and manpower) is paid separately when a repair is executed then this should be added dividing the total cost per the average repair length). Even though the repair cost are typically at discrete years this is spread over the analysis period considering the potential annual crash frequency (that is typically below 1 and is not to be intended as a specific intervention). In the Barrier sheet of the SAVeRS tool a set of different VRS have been already included. The current version of the tool contains barrier cost information for the following countries: Austria; 47
55 Great Britain; Ireland; Italy; Slovenia; Sweden. Additional barriers from these countries can be added to the list as well as new countries can be included in the dataset in the barriers worksheet of the tool. If a new barrier is added the unit costs for construction, maintenance and repair have to be included as well as the repair length (that could also be based on similar barriers already in the list). If a new country dataset is defined by the user then a new set of societal costs have to be defined in the same worksheet. As indicated earlier the SAVeRS tool allows to compare directly in one single run different alternatives for the same VRS class. For comparing the WLC associated with different VRS classes for the same project different runs of the tool need to be performed and the results compared off-line. 48
56 4 RECOMMENDATION FOR THE IMPLEMENTATION OF THE GUIDELINE BY NATIONAL ROADS AUTHORITIES 4.1 Selection Procedure The SAVeRS tool can be applied at a national level in the definition of national standard allowing the different NRAs to identify: the minimum return time of a penetration per km that can be accepted in the design phase; the minimum return time of a fatal crash per km that can be accepted in the design phase; the default parameters that should be used in the design phase; the minimum VRS class for different traffic conditions and infrastructure layouts that to be included in the national standard. This would be used in preliminary design phases and in where a site specific analysis is not conducted; the situations where a maximum VRS class should be set unless special circumstances justify a higher VRS class. For high risk bridges a target per bridge could be considered instead than a target per km as it is unlikely that a bridge would have an extension of above one km. Different target values in terms of minimum return times of penetrations and of fatal crashes could be established for new designs and for existing roads. The tool could be used to assess the potential risk of existing situations considering the specific traffic, geometric layout and hazard characteristics in order to identify the need for a barrier replacement and a priority list of the replacements. This is extremely relevant where a new national standard is issued requiring a different VRS class as compared to the previous one. This activity is extremely important to make sure that the target values do not lead to unrealistic applications (e.g. a maximum number of fatal crashes that cannot be achieved even by using the H4 VRS class). This same approach is proposed in the RSAP procedure as described in the Ray and Carrigan, In this case a possible base condition for setting the return time of fatal crashes is defined as the number of ROR fatal crashes per edge-mile per year that have occurred in the previous observation period. In the same paper a target risk of less than a 1/100 severe or fatal crashes in 30 yrs/1000-ft of bridge rail is recommended. This is equivalent to a risk of less than 1/600 severe or fatal crash/edge-mi/yr on roadways (a return time of fatal + severe crashes of 375 years per edge-km). To define the number of fatal only 49
57 Number of equivalnet fat crashes per year per km CEDR Call 2012: Safety: Use of Vehicle Restraint Systems crashes the ratio of fatal Vs fatal + severe injury crashes (K/(K+A) ratio) can be calculated based on the figures applied in the SAVeRS tool (see section 3.5). Considering the base conditions, a K/(K+A) ratio has been estimated in section 3.5 with the Highway Safety Manual severity distribution functions but this ratio could be adapted to the severity distribution of any specific country. With the K/(K+A) ratio set to 0.3, the return time of one severe event every 375 years per km of road edge leads to a return time of 1 fatal crash every 110 years per km of road edge. As a preliminary estimate a minimum return time of 1 fatal crash every 100 year per km of road edge where a barrier is installed could be considered unless different considerations are provided. The minimum fatal crash return time is only applied to conditions where no risk to third parties occurs. If there is an additional risk to third parties the protection will have to be increased according to the risk chart given in section 3.2. In the UK the RRRAP approach uses the equivalent fatalities per 100 million vehicle km approach (1 fatal = 10 serious = 100 slight accidents). For each road type two thresholds are given to define the acceptable, tolerable and unacceptable risk. Given the fact that the risk is given per 100 million vehicle km, the thresholds in terms of number of equivalent fatal crashes per year per km is different for different AADT volumes as shown, as an example, in Figure 18 for 2 lane motorways (D2M) and in Figure 19 for 3 lane motorways (D3M) Unacceptable Tolerable Acceptable AADT Figure 18: risk thresholds in RRRAP (UK) for 2 lane motorways 50
58 Number of equivalnet fat crashes per year per km CEDR Call 2012: Safety: Use of Vehicle Restraint Systems Unacceptable Tolerable Acceptable AADT Figure 19: risk thresholds in RRRAP (UK) for 3 lane motorways The number of equivalent fatal crashes is obviously higher than the number of fatal crashes alone and therefore, to allow for an easier comparison with RRRAP, the SAVeRS Tool provides also an estimate the frequency and return time of the equivalent fatal crashes defined as: total injury costs/single fatal crash cost. In this phase the user should consider a set of reference conditions that could either be the most critical ones or the ones corresponding to different infrastructure and traffic conditions that are already considered in national standards. The process is described in Figure 20 and an application to two specific national standards (from Italy and UK) is then given as examples in section
59 layout 1, traffic 1, third party risk 1 layout 2, traffic 2, third party risk 2... ROR model Impact energy model Severity distribution model Apply the savers tool for the different scenario with N1 Return time of overrides per km Return time of fatalities per km Apply the savers tool for the different scenario with N2 Return time of overrides per km Return time of fatalities per km Apply the savers tool for the different scenario with H1 Return time of overrides per km Return time of fatalities per km Apply the savers tool for the different scenario with H2 Return time of overrides per km Return time of fatalities per km Apply the savers tool for the different scenario with H3 Return time of overrides per km Return time of fatalities per km Apply the savers tool for the different scenario with H4 Return time of overrides per km Return time of fatalities per km Likelihood Consequences Normal High (relevant risk to third parties) Very High (high risk to third parties) Low L M H Moderate L H H High L H VH Define minimum overrides and fatalities return time per km Define minimum VRS class per each scenario Figure 20: procedure implementation of the SAVeRS tool at the NRA level. 52
60 4.2 Application to selected EU Countries Italy The outcome of the SAVeRS model has been applied to the Italian motorway network considering a set of typical scenarios, as shown in Table 19 where the classes required by the new draft Italian standard have been highlighted (in orange the class required if the road passes over or adjacent to another infrastructure or a sensitive structure, in yellow the minimum class required without relevant third party risk, if different). Table 19: evaluation different roadside configurations in Italian motorways typical scenarios Scenario 1 Scenario 2 Scenario 3 Scenario 4 AADT (per direction) %HGV 20 % 25% 30 % 30 % AADT HGV Local conditions base base base base Length 1 km 1 km 1 km 1 km Penetration return times (roadside) N N H H H H Fatal crashes return times (verge with steep slope) N N
61 H H H H Fatal crashes return times (verge with rock) N N H H H H Fatal crashes return times (high risk bridge) N N H H H (*) H (*) Fatal crashes return times (other bridges) N N H H
62 H H Penetration return times (median) N N H H H H Fatal crashes return times (median) N N H H H H (*) for bridges shorter than 100 m H3 becomes H4 if the road passes over or adjacent to another infrastructure or a sensitive structure; for bridges longer than 100 m always H4 For the evaluation of high risk bridges an evaluation length of 200 m has also been considered to test the model, as shown in Table 20, but in this case the most severe conditions found in the calibration dataset, considering a standard section design have been considered (downhill slope -2.85% and average curvature 1/445 m). 55
63 Table 20: evaluation of a 200 m high risk bridge in Italian motorways typical scenarios AADT (per direction) %HGV 20 % 25% 30 % 30 % AADT HGV Local conditions Average curvature 1/445 1/445 1/445 1/445 grade -2.85% -2.85% -2.85% -2.85% lanes Length 0.2 km 0.2 km 0.2 km 0.2 km Fatal crashes return times (high risk bridge) N N H H H H This risk assessment shows that the VRS classes required by the Italian standard lead to extremely high return times of fatal crashes (in some cases above a 1000 years per km) much higher than typical return times of any civil engineering structure. This confirms the results of the study conducted by ERF in 2012 (ERF, 2012) that showed that the Italian requirements represented an outlier as compared with the other national standards. The draft revision of the standard tailored the different VRS requirements to the actual HGV traffic but still the requirements are extremely high. In a future revision of the standard a reduction of the VRS requirements should be considered using the SAVeRS tool to identify the minimum VRS class that allows to achieve a given risk level. 56
64 4.2.2 UK The outcome of the SAVeRS model has been applied to the motorway network of the UK considering a set of typical scenarios, as shown in Table 21 where the classes required by the UK standards have been highlighted (in orange, the class required if the road passes over or adjacent to another infrastructure or a sensitive structure, in yellow the minimum class required without relevant third party risk for the verge, and in cyan, the minimum class required for the median). Table 21: evaluation different roadside configurations on UK motorways typical scenarios Scenario 1 Scenario 2 Scenario 3 Scenario 4 AADT (per direction) %HGV 5 % 10% 15 % 15 % AADT HGV Local conditions base except for the number of lanes base except for the number of lanes base except for the number of lanes base except for the number of lanes lanes Length 1 km 1 km 1 km 1 km Penetration return times (roadside); N N H H H H Fatal crashes return times (verge with steep slope) N N
65 H H H H Fatal crashes return times (verge with rock) N N H H H H Fatal crashes return times (high risk bridge) N N H H H H Fatal crashes return times (other bridges) N N H H
66 H H Penetration return times (median) N N H H H H Fatal crashes return times (median) N N H H H H Application at the design stage Use of the tool at the design stage The designer has to identify that there is a requirement for VRS before using the selection tool and determine the length and containment level of the barrier. As a support for this preliminary activity the Barrier Placement section of the tool could be used unless specific national regulations are already available. For UK roads the VRS would be designed using the Road Restraints Risk Assessment Process (RRRAP). The selection tool can then be used to compare difference VRS types from an economic stance. 59
67 The length of road analysed by the selection tool equates to the length of the barrier. Information relating to the alignment, road profile and traffic characteristics at the site are required to be input along with the containment level required for the VRS. These are used in the tool to assess the predicted number of crashes over the period analysed. The tool then requires some basic information about the nature of the hazard that would be encountered should a vehicle penetrate the barrier to be selected in the Severity Distribution Function section. From this the severity of the predicted accidents and the resulting injury costs are calculated. Finally, in the Cost Benefit section of the selection tool the user selects the types of barriers to be compared for the containment class used for the analysis from the selections available in the tool and the costs associated with the barrier types for that site are displayed and compared. Only barrier types with the same containment level entered in to the first section of the selection tool are available in the drop down menu Worked examples To test the SAVeRS model a set of 6 pilot applications with different characteristics have been analysed in the UK. The summary of the characteristics are given in Table 25. For each of these pilot projects a worksheet has been produced that can also serve as a worked example for new users to guide them through the use of the tool. Six sections of road (pilot sites) in the UK have been analysed using the VRS selection tool to assess how it could be used by highway engineers for selecting a VRS type to use for a particular site. The pilot sites are listed in Table 22 at the end of this section of the report with key characteristics used by the VRS selection tool. All are located in the south east of England and, with the exception on the A325, are on the Strategic Road Network managed by the Highways Agency. The sites are a mixture of single carriageway, dual carriageway and motorway. The following scenarios are represented by the pilot sites: Single and dual carriageways Two and three lane dual carriageways Urban and semi-urban road environments Different horizontal and vertical alignments Different traffic flows (and densities) and HGV proportions A variety of hazards including those identified as high risk and lower risk in the selection tool. 60
68 Information on each of the pilot sites is recorded in the Pilot Site Reports. These contain site context, the parameters input for analysis in the selection tool and the Lifetime Cost result calculated by the selection tool. The selection tool can be used to indicate the most cost effective barrier type for the site taking into account construction and maintenance costs of a barrier and the cost of repairs following a crash for a variety of barrier types. Currently in highway design and maintenance the type of barrier selected is based on the designer s experience and professional judgement. 61
69 Table 22: Pilot Sites No. Owner (HA/TfL) Site Description Road Type (Motorway/ High status other) Status (Planned/ existing) Carriageway layout (Single/ Dual) Speed Limit (kph) Roadside configuration/ features Barrier type installed/ considered? 1 Local Authority A325 Road Farnham Non-strategic Existing Single 95 Single carriageway road with semi-rural characteristics. Segment is on tight radius bend on downhill section. There is little or no existing safety barrier provision. No VRS 2 HA 3 HA A282 - A1090 London Road overbridge to Stonehouse Lane A282 approach to Junction 31 High Status Existing Dual 80 High Status Existing Dual 80 The A282 forms part of the M25 and provides access to and from the Dartford Tunnel and Queen Elizabeth II bridge. The anticlockwise carriageway has just been installed with CSB, DROBB and SSOBB to provide protection on an overbridge and from adjacent quarry face and chalk bunds. There is TSB along the central reserve. The A282 forms part of the M25 and provides access to and from the Dartford Tunnel and Queen Elizabeth II bridge. The anticlockwise carriageway has DROBB and SSOBB to provide protection from adjacent quarry face and chalk bunds. CSB, DROBB, SSOBB and TSB CSB, DROBB, SSOBB and TSB 4 HA A21 Road Pembury High status Existing Single 95 The A21 along this section is a single carriageway with relatively straight profile. There is little or no existing safety barrier provision. No VRS 5 HA 6 HA M4 - Junction 4 to 4A Heathrow Spur road M4 - Junction 3 to Junction 4 Motorway Existing Dual 112 Motorway Existing Dual 112 The Heathrow Spur Road connects Heathrow Airport to the M4 motorway. There is SSOBB both sides within the central reserve and SSOBB to provide protection from large street furniture; traffic signs, gantries, airport communications equipment and bridge abutments. The majority of the carriageway verges are unprotected. The M4 motorway provides the primary access from the west to central London and, aside from the M25, is one of the most heavily used and congested motorways. There is SSOBB both sides within the central reserve and SSOBB to provide protection from large street furniture; traffic signs, gantries, airport communications equipment and bridge abutments. The majority of the carriageway verges are unprotected. SSOBB SSOBB 62
70 4.3.3 Conclusions from the Pilot Sites Analysis For the analysis the output used for evaluation was the Lifetime Cost of a barrier type. The number of run-off road accidents predicted by the analysis for each Pilot Site and their severity has also been summarised in Table 23 at the end of this section. All sites have been analysed for a 20 year period as being the expected life span of a barrier used in the RRRAP. Some sites were also analysed for a 50/60 year period to compare the cost effectiveness of barriers over a longer lifespan as concrete barriers have high installation costs but up to twice the lifespan of metal barriers with lower maintenance and repair costs. The selection tool considers barrier types from a monetary cost-benefit for the specified containment level and varying working widths. However, in selecting a barrier type consideration also needs to be given to the practical suitability of a barrier type for a site and the available working width of barriers or clearance from the safety hazard. In this situation practical issues need to be considered alongside the Lifetime Cost. For example, in the analysis of sites requiring barriers with N2 containment class, the N2W5 steel barrier always came out as the most economic steel barrier type due to largely to the lower installation and repair costs coupled with the relative eases of undertaking these tasks. However, on some of the pilot sites (particularly the single carriageway sites) the offset to the hazard is too narrow for a safety barrier requiring this amount of working width. Similarly, for the A325 site wire rope was included in the barrier selection and the analysis showed it to be the most cost effective solution even though it would not be suitable for this site as some trees would be within the working width. Currently the tool relies on the user s knowledge of the site and physical constraints to include suitable barrier types for comparison. It doesn t warn the designer of the practical limitations of certain barrier types. Future development of the selection tool could consider the offset to the hazard and the working width of the barrier to be input in the road details section and the selection of barrier types restricted to those that meet the working width criteria to avoid recommendation of a barrier type that is unsuitable for a particular location. Direct comparison can only be done for those barrier types having the same containment class specified by the user so multiple runs of the selection tool were carried out for each pilot site to compare the cost effectiveness of higher containment barriers. For the single carriageways sites with lower risk hazards in the verge, where a barrier with N2 containment is required, the most cost effective barriers is confirmed to be N2. For dual carriageways roads the selection tool indicated that a high containment barrier was the most cost effective solution (H2 for verges and H4 for medians). The difference in lifetime cost was particularly marked for sites with a high risk feature, for example tall bridges or medians. For medians with a lower traffic volume (Site 5) H2 and H4 solutions are comparable but still extremely more cost effective then the N2. It should be noted, in 63
71 analysing these results, that in the standard SAVeRS Severity Distribution Function (see paragraph 3.5) every penetration of the median barrier is considered as fatal. If different Severity Distributions are available for specific conditions these can be implemented in the tool. The pilot site analysis was carried out for UK roads and therefore only information on barriers for the UK has been considered in the analysis of barrier types. The selection tool was configured with examples of common barrier types encountered in the UK and typical costs associated with them. Data sets for other countries are available, and users can add further barrier types together with associated costs. This allows adjustment to more accurately reflect the cost of provision entailed for a particular site or region. Presently, there is a list of hazards that can be selected in the tool for analysis. However, the tool does contain the facility to add a user defined hazard to include a hazard type that is not included in the pre-configured list. Selection of the hazard determines the severity of predicted crashes if the barrier is penetrated and is not applicable in high risk situations where the assumption is that all barrier penetrations will result in a fatality. Table 24 below summarises the results of using the selection tool on the trial sites highlighting the type of hazard and containment level and the types of barrier considered for predicting the lifetime costs. 64
72 Table 23: Predicted Accident Summary for Sites Pilot Site 1 A325 (with N2 barrier) 2 A282 - A1090 Northbound (with H2 barrier) 3 A282 - Approach to J31 Northbound (with H1 barrier) 4 A21 - Pembury Road (with N2 barrier) 5 M4 Heathrow Spur (with N2 barrier) 6 M4 - J3-4 (with N2 barrier) Cars ROR crashes HGVs % of events: Contained Penetrated N. of events in design life Return time of a fatal crash (years) Return time of a fatal crash/km (years) Fatality (K) 3.85% 8.10% Incapacitating injury (A) 16.58% 33.64% Non incapacitating injury (B) 34.05% 58.26% Possible injury (C) 45.52% 0.00% Fatality (K) 1.93% % Incapacitating injury (A) 4.79% 0.00% Non incapacitating injury (B) 23.45% 0.00% Possible injury (C) 69.83% 0.00% Fatality (K) 1.93% 6.49% Incapacitating injury (A) 4.79% 15.14% Non incapacitating injury (B) 23.45% 68.81% Possible injury (C) 69.83% 9.56% Fatality (K) 3.85% 8.10% Incapacitating injury (A) 16.82% 33.64% Non incapacitating injury (B) 33.96% 58.26% Possible injury (C) 45.37% 0.00% Fatality (K) 1.83% % Incapacitating injury (A) 4.79% 0.00% Non incapacitating injury (B) 23.45% 0.00% Possible injury (C) 69.93% 0.00% Fatality (K) 1.83% % Incapacitating injury (A) 4.79% 0.00% Non incapacitating injury (B) 23.45% 0.00% Possible injury (C) 69.93% 0.00%
73 Table 24: Sites Analysed using the Selection Tool No. Site Description Road Type (Motorway/ High status other) Carriageway layout (Single/ Dual) Hazard considered in Analysis Containment Level Barrier Types selected in analysis (GB types only) Barrier type installed/ considered? 1 A325 Farnham Road High status Single Trees N2 N2W2 Steel, OBB, TCB, Concrete Step Barrier, H2W4 Steel, H4 Concrete No VRS A282 - A London Road overbridge to High Status Dual High bridge H2 Concrete Step Barrier, H2W4 Steel, H4 Concrete CSB, DROBB, SSOBB and TSB Stonehouse Lane 3 A282 - Approach to M25 Junction 31 High Status Dual Gantry foundation (rock) H1 DROBB, H1W4 Steel, Concrete Step Barrier, H2W4 Steel, H4 Concrete CSB, DROBB, SSOBB and TSB 4 A21 Pembury Road High status Single Tree N2 N2W2 Steel, N2W3 Steel, N2W4 Steel, N2W5 Steel, OBB, TCB, Wire rope, DROBB, H1W4 Steel, Concrete Step Barrier, H2W4 Steel, H4 Concrete No VRS 5 M4 - Junction 4 to 4A Heathrow Spur road Motorway Dual Median N2 N2W2 Steel, N2W3 Steel, N2W4 Steel, OBB, TCB, Wire rope, H2W4 Steel, H4 Concrete SSOBB 6 M4 - Junction 3 to Junction 4 Motorway Dual Median N2 N2W2 Steel, N2W3 Steel, N2W4 Steel, OBB, TCB, Wire rope, H2W4 Steel, H4 Concrete SSOBB 66


74


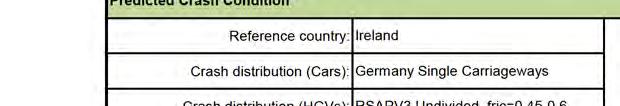


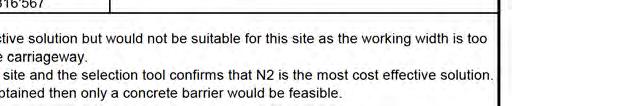

75
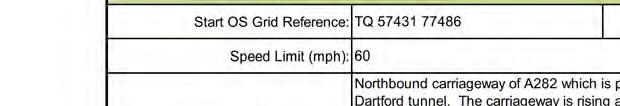
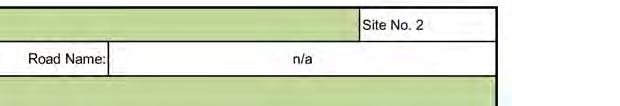


76
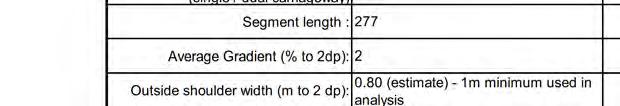
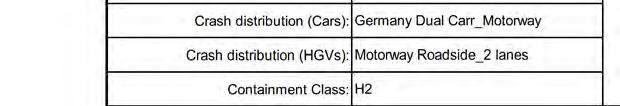
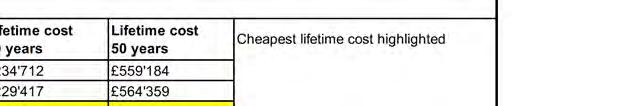

77


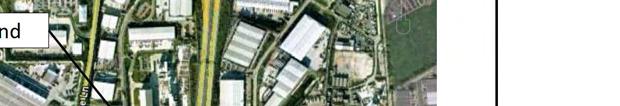


78
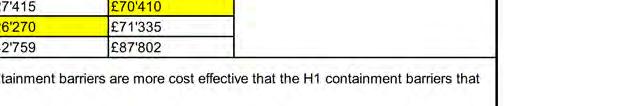

79


80


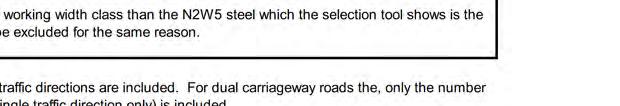
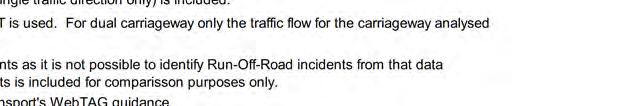
81


82


83


84


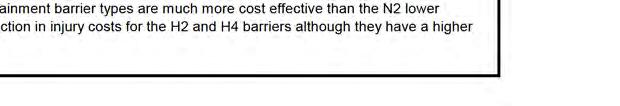
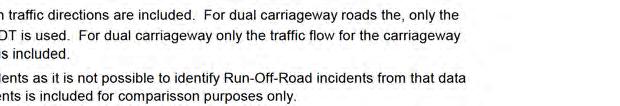
85
DISTRIBUTION: Electronic Recipients List TRANSMITTAL LETTER NO. (13-01) MINNESOTA DEPARTMENT OF TRANSPORTATION. MANUAL: Road Design English Manual
 MINNESOTA DEPARTMENT OF TRANSPORTATION. MANUAL: Road Design English Manual") DISTRIBUTION: Electronic Recipients List MINNESOTA DEPARTMENT OF TRANSPORTATION DEVELOPED BY: Design Standards Unit ISSUED BY: Office of Project Management and Technical Support TRANSMITTAL LETTER NO.
DISTRIBUTION: Electronic Recipients List MINNESOTA DEPARTMENT OF TRANSPORTATION DEVELOPED BY: Design Standards Unit ISSUED BY: Office of Project Management and Technical Support TRANSMITTAL LETTER NO.
Safer Verges and the Strategic Road Network
 Safer Verges and the Strategic Road Network Gavin Williams Senior Technical Advisor Vehicle Restraints Outline The Journey from Highways Agency to Highway England Overview of the Highways England Health
Road Side Design: When is a Barrier Required?
 Road Side Design: When is a Barrier Required? Jennifer Schmidt, Ph.D., P.E. University of Nebraska-Lincoln Department of Civil Engineering Guide Rail Safety Symposium Brampton, ON October 24, 2017 Research
Safety Barriers (including Erratum No. 1, dated June 2013, and Amendment No. 1, dated February 2014)
") Volume 2 Section 2 Part 8A NRA TD 19/13 Safety Barriers (including Erratum No. 1, dated June 2013, and Amendment No. 1, dated February 2014) March 2013 St. Martin s House, Waterloo Road, Dublin 4. Tel:+353
Volume 2 Section 2 Part 8A NRA TD 19/13 Safety Barriers (including Erratum No. 1, dated June 2013, and Amendment No. 1, dated February 2014) March 2013 St. Martin s House, Waterloo Road, Dublin 4. Tel:+353
Ireland: Implementing research outputs on safety management from CEDR (Conference of European Road Directors) research programme - Paper 3
 research programme - Paper 3") Ireland: Implementing research outputs on safety management from CEDR (Conference of European Road Directors) research programme - Paper 3 Alastair de Beer Transport Infrastructure Ireland Parkgate Business
Ireland: Implementing research outputs on safety management from CEDR (Conference of European Road Directors) research programme - Paper 3 Alastair de Beer Transport Infrastructure Ireland Parkgate Business
To position power poles a safe distance from the road to minimise the likelihood of being accidentally hit by vehicles.
 Policy Statement Subject Placement of Rigid Distribution Poles Along Roads With Speed Limits Exceeding 70KM/H Approved by Robert Rogerson Signature & Date Distribution Standards and Policy Manager Authorised
Policy Statement. Objective. Context. References and Supporting Documentation
 Policy Statement Subject Placement of Distribution Poles Along Roads With Speed Limits Not Exceeding 70km/h Approved by Robert Rogerson Signature & Date Distribution Standards and Policy Manager Authorised
Alberta Infrastructure HIGHWAY GEOMETRIC DESIGN GUIDE AUGUST 1999
 Alberta Infrastructure HIGHWAY GEOMETRIC DESIGN GUIDE AUGUST 1999,1'(; A ACCELERATION Data on acceleration from stop D-29 Effects of grade D-35 Intersections D-97, D-99 Lanes D-97, F-5, F-7, F-15, F-21,
Driveway Design Criteria
 Design Manual Chapter 5 - Roadway Design 5L - Access Management 5L-4 Driveway Design Criteria A. General For efficient and safe operations, access drives and minor public street intersections can be improved
Post impact trajectory of vehicles at rural intersections
 Post impact trajectory of vehicles at rural intersections Doecke SD., Woolley JE. and Mackenzie JR. Centre for Automotive Safety Research Abstract This report describes the path of vehicles after a collision
H3 Roadside Design Process
 H3 Roadside Design Process FIGURE H3.1 Roadside Design Process H3.1 Introduction This section summarizes the design process used to determine the most appropriate and costeffective design strategies for
H3 Roadside Design Process
 H3 Roadside Design Process FIGURE H3.1 Roadside Design Process H3.1 Introduction This section summarizes the design process used to determine the most appropriate and costeffective design strategies for
Road Safety Audit training course. Motorways - safety issues of the motorway design
 Road Safety Audit training course Motorways - safety issues of the motorway design Jesper Mertner, Road safety auditor, COWI A/S 1 ROAD SAFETY AUDITING COURSE Content 1. Safety 2. Cross sections 3. Horizontal
SPEED CONTROL AT ROUNDABOUTS USE OF MAXIMUM ENTRY PATH RADII
 23 rd ARRB Conference Research Partnering with Practitioners, Adelaide Australia, 2008 SPEED CONTROL AT ROUNDABOUTS USE OF MAXIMUM ENTRY PATH RADII Dr Owen Arndt, Queensland Department of Main Roads, Australia
Truck Climbing Lane Traffic Justification Report
 ROUTE 7 (HARRY BYRD HIGHWAY) WESTBOUND FROM WEST MARKET STREET TO ROUTE 9 (CHARLES TOWN PIKE) Truck Climbing Lane Traffic Justification Report Project No. 6007-053-133, P 101 Ι UPC No. 58599 Prepared by:
October 2004 REVISIONS (2) SUPERELEVATION DEVELOPMENT 11.3(2)
 SUPERELEVATION DEVELOPMENT 11.3(2)") October 2004 REVISIONS (2) Chapter 11 HORIZONTAL ALIGNMENT SUPERELEVATION DEVELOPMENT 11.3(2) Chapter 12 VERTICAL ALIGNMENT VERTICAL CURVES PASSING SIGHT DISTANCE 12.5(2) VERTICAL CURVES STOPPING SIGHT
October 2004 REVISIONS (2) Chapter 11 HORIZONTAL ALIGNMENT SUPERELEVATION DEVELOPMENT 11.3(2) Chapter 12 VERTICAL ALIGNMENT VERTICAL CURVES PASSING SIGHT DISTANCE 12.5(2) VERTICAL CURVES STOPPING SIGHT
Chapter 5 DATA COLLECTION FOR TRANSPORTATION SAFETY STUDIES
 Chapter 5 DATA COLLECTION FOR TRANSPORTATION SAFETY STUDIES 5.1 PURPOSE (1) The purpose of the Traffic Safety Studies chapter is to provide guidance on the data collection requirements for conducting a
PLACEMENT OF SIGNS RECOMMENDED PRACTICES SUB-SECTION
 Page 1 of 6 RECOMMENDED PRACTICES PART SECTION SUB-SECTION HIGHWAY SIGNS GENERAL General Proper positioning of signs is an important element in the overall control of traffic within a roadway network.
Chapter Twenty-eight SIGHT DISTANCE BUREAU OF LOCAL ROADS AND STREETS MANUAL
 Chapter Twenty-eight SIGHT DISTANCE BUREAU OF LOCAL ROADS AND STREETS MANUAL Jan 2006 SIGHT DISTANCE 28(i) Chapter Twenty-eight SIGHT DISTANCE Table of Contents Section Page 28-1 STOPPING SIGHT DISTANCE
7 DESIGN CRITER RIA 7.1 Design Space Requirements
 7 DESIGN CRITERIA 7.1 Design Space Requirements The Nebraskaa Department of Roads (NDOR) provided examples of intersections where an approved guardrail end terminal and Approach Guardrail Transition (AGT)
INDEX. Geometric Design Guide for Canadian Roads INDEX
 Acceleration lane, see Lanes, Acceleration Access, 8.1 Access Management and Functional Classification 8.2 Access Management by Design Classification 8.3 Access Configuration 8.4 Building Set-Back Guidelines
Review of Guidelines for Cycleway Safety Fencing
 Review of Guidelines for Cycleway 1.0 PURPOSE 1.1 This document is meant to provide a review of available reference documents for determining appropriate fencing requirements for cycleway paths and shared
CHECKLIST 2: PRELIMINARY DESIGN STAGE AUDIT
 CHECKLIST 2: PRELIMINARY DESIGN STAGE AUDIT 2.1 General topics 2.1.1 Changes since previous audit Do the conditions for which the scheme was originally designed still apply? (for example, no changes to
References General Definitions
 Chapter 700 700.01 General 700.02 References 700.03 Definitions 700.04 Clear Zone 700.05 Hazards to Be Considered for Mitigation 700.06 Median Considerations 700.07 Other Features 700.08 Documentation
Star Ratings for the Strategic Road Network. Richard Leonard - Highways England
 Star Ratings for the Strategic Road Network Richard Leonard - Highways England Strategic Direction for Road User Safety 2 Delivery Plan Star Rating - Commitments We will ensure that by the end of 2020
Auckland Transport Code of Practice 2013
 P age 234 9 Roadside Restraint Devices 9.1 Scope This chapter includes the following: Road Safety Barrier Systems Fences Railings Bollards Sight Rails It excludes: Fences and restraints required within
Geometric Design Tables
 Design Manual Chapter 5 - Roadway Design 5C - Geometric Design Criteria 5C-1 Geometric Design Tables A. General The following sections present two sets of design criteria tables - Preferred Roadway Elements
Road safety design standards and the Asian Highway Network. irap Asia Pacific Workshop Greg Smith 2016/05/26
 Road safety design standards and the Asian Highway Network irap Asia Pacific Workshop Greg Smith (greg.smith@irap.org) 2016/05/26 AH Standard Summary While developing the Asian Highway network, Parties
Interim Report on the Development of Road Safety Infrastructure Facility Design Standard for the Asian Highway Network
 Development of Road Infrastructure Safety Facility Standards Expert Group Meeting on Asian Highway United Nations Economic and Social Commission for Asia and the Pacific 3-4 October 2016 Interim Report
Roadway Departure Focus State Initiative Roadside Safety Systems Inspection, Maintenance & Designers Mentoring Program
 Roadway Departure Focus State Initiative Roadside Safety Systems Inspection, Maintenance & Designers Mentoring Program Why worry about the roadside? 18,586 deaths per year in the USA Annual U.S. Fatalities
H8 Signs, Supports and Poles
 Alberta Infrastructure and Transportation Roadside Design Guide November 2007 H8 Signs, Supports and Poles H8.1 Introduction This section identifies the appropriate roadside safety treatment for signs,
Guidance on the use of the Road Restraint Risk Assessment Process (RRRAP) associated with TD 19/06
 associated with TD 19/06") Guidance on the use of the Road Restraint Risk Assessment Process (RRRAP) Introduction This manual is intended to provide guidance and help to enable the Designer to navigate through the RRRAP in an efficient
Guidance on the use of the Road Restraint Risk Assessment Process (RRRAP) Introduction This manual is intended to provide guidance and help to enable the Designer to navigate through the RRRAP in an efficient
6. BREENS/GARDINERS/HAREWOOD INTERSECTION - SAFETY IMPROVEMENT PROJECT
 6. BREENS/GARDINERS/HAREWOOD INTERSECTION - SAFETY IMPROVEMENT PROJECT General Manager responsible: Officer responsible: Author: Jane Parfitt General Manager City Environment DDI 941 8656 Michael Aitken
AN INTRODUCTION TO ROADSIDE HAZARD MANAGEMENT
 AN INTRODUCTION TO ROADSIDE HAZARD MANAGEMENT In this session you will learn: About fixed roadside hazards, and clear zones Why roadside safety is important in road safety audit About forgiving roadsides
NRA New Divided Road Types: Type 2 and Type 3 Dual-carriageways
 NRA New Divided Road Types: Type 2 and Type 3 Dual-carriageways BENEFITS of the TYPE 2 and TYPE 3 DUAL CARRIAGEWAY ROAD TYPE There are significant safety and economic benefits associated with the Type
NRA New Divided Road Types: Type 2 and Type 3 Dual - Carriageways
 NRA New Divided Road Types: Type 2 and Type 3 Dual - Carriageways DN-GEO-03059 December 2007 DN Design Technical TRANSPORT INFRASTRUCTURE IRELAND (TII) PUBLICATIONS About TII Transport Infrastructure Ireland
1.3.4 CHARACTERISTICS OF CLASSIFICATIONS
 Geometric Design Guide for Canadian Roads 1.3.4 CHARACTERISTICS OF CLASSIFICATIONS The principal characteristics of each of the six groups of road classifications are described by the following figure
Owl Canyon Corridor Project Overview and Summary
 Owl Canyon Corridor Project Overview and Summary December 22, 2008 The Owl Canyon corridor (generally the connection between the I-25 / Larimer County Road 70 interchange and the US 287 / Larimer County
D1.2 REPORT ON MOTORCYCLISTS IMPACTS WITH ROAD INFRASTRUCTURE BASED OF AN INDEPTH INVESTIGATION OF MOTORCYCLE ACCIDENTS
 WP 1 D1.2 REPORT ON MOTORCYCLISTS IMPACTS WITH ROAD INFRASTRUCTURE BASED OF AN INDEPTH INVESTIGATION OF MOTORCYCLE ACCIDENTS Project Acronym: Smart RRS Project Full Title: Innovative Concepts for smart
THE FUTURE OF THE TxDOT ROADWAY DESIGN MANUAL
 THE FUTURE OF THE TXDOT ROADWAY DESIGN MANUAL Kenneth Mora, P.E. (Design Division) 10/10/2017 Table of contents 1 2 Reduction in FHWA design controlling criteria Innovative Intersection Guidance 3-7 8-42
SECTION 1A NEW JERSEY TURNPIKE GEOMETRIC DESIGN
 SECTION 1A NEW JERSEY TURNPIKE GEOMETRIC DESIGN Table of Contents Page No 1A.1 GENERAL...1 1A.1.1 DESIGN CONTROLS...1 1A.2 MAINLINE ROADWAYS...4 1A.2.1 ROADWAY DESIGNATION...4 1A.2.2 DESIGN SPEED...4 1A.2.3
3-13 UFC - GENERAL PROVISIONS AND GEOMETRIC DESIGN FOR ROADS, STREETS, WALKS, AND OPEN
 maintenance, and erosion. Stability is required to maintain the integrity of the pavement structure, and a slope stability analysis should be conducted for cuts and fills greater than 15 feet. For lower
MUTCD Part 6G: Type of Temporary Traffic Control Zone Activities
 MUTCD Part 6G: Type of Temporary Traffic Control Zone Activities 6G.01 Typical Applications Each temporary traffic control (TTC) zone is different. Many variables, such as location of work, highway type,
Engineering Countermeasures for Transportation Safety. Adam Larsen Safety Engineer Federal Highway Administration
 Engineering Countermeasures for Transportation Safety Adam Larsen Safety Engineer Federal Highway Administration 360-619-7751 Adam.Larsen@DOT.GOV Countermeasure Selection Resources Manual for Selecting
WYDOT DESIGN GUIDES. Guide for. NHS Arterial (Non-Interstate)
") WYDOT DESIGN GUIDES Guide for NHS Arterial (Non-Interstate) 2014 GUIDE FOR NATIONAL HIGHWAY SYSTEM (NHS) HIGHWAYS (NHS ARTERIALS, Non-Interstate) PRESERVATION REHABILITATION RECONSTRUCTION INTRODUCTION
WYDOT DESIGN GUIDES Guide for NHS Arterial (Non-Interstate) 2014 GUIDE FOR NATIONAL HIGHWAY SYSTEM (NHS) HIGHWAYS (NHS ARTERIALS, Non-Interstate) PRESERVATION REHABILITATION RECONSTRUCTION INTRODUCTION
Effectiveness of Roadside Safety Measures
 2014 European Workshop AFB20 (2) Roadside Safety Design International Research Activities Subcommittee Brussels, 05 November 2014 Effectiveness of Roadside Safety Measures George Yannis, Associate Professor
Roadside infrastructure for safer European roads: D05 Summary of European design - guidelines for roadside infrastructure
 Loughborough University Institutional Repository Roadside infrastructure for safer European roads: D05 Summary of European design - guidelines for roadside infrastructure This item was submitted to Loughborough
Access Management Standards
 Access Management Standards Section 1: Application of Access Standards This chapter describes the Department's access management standards for access connections on the county roadway system. The standards
Assessment of retaining levels of safety barriers
 Safety and Security Engineering V 319 Assessment of retaining levels of safety barriers K. Jung & J. Markova Department of Structural Reliability, Klokner Institute of the Czech Technical University in
2014 European Workshop AFB20 (2) Roadside Safety Design International Research Activities Subcommittee Wednesday, November 5, 2014
 Roadside Safety Design International Research Activities Subcommittee Wednesday, November 5, 2014") 2014 European Workshop AFB20 (2) Roadside Safety Design International Research Activities Subcommittee Wednesday, November 5, 2014 SESSION II: Innovation for Road side Safety Run-off accidents against
2014 European Workshop AFB20 (2) Roadside Safety Design International Research Activities Subcommittee Wednesday, November 5, 2014 SESSION II: Innovation for Road side Safety Run-off accidents against
LIST OF TABLES LIST OF FIGURES
 TABLE OF CONTENTS 8 ROADSIDE SAFETY........................................................... 8-1 8.1 INTRODUCTION...................................................... 8-1 8.1.1 General.........................................................
APPENDIX D Draft Chapter 10 for AASHTO Roadside Design Guide
 APPENDIX D Draft Chapter 10 for AASHTO Roadside Design Guide Chapter 10 Draft Roadside Safety in Urban or Restricted Environments 10.0 OVERVIEW Generally, the principles and guidelines for roadside design
DESIGN BULLETIN #66/2010
 DESIGN BULLETIN #66/2010 Highway Geometric Design Guide Chapter B, Climbing Lane Warrants for Two Lane Undivided and Four Lane Divided Highways - Revised Summary This Design Bulletin is being issued as
What Engineering Can Do for You! Low Cost Countermeasures for Transportation Safety
 What Engineering Can Do for You! Low Cost Countermeasures for Transportation Safety Adam Larsen Safety Engineer Federal Highway Administration 360-619-7751 Adam.Larsen@DOT.GOV Adam Larsen TTP Safety Engineer
Guidelines for Integrating Safety and Cost-Effectiveness into Resurfacing, Restoration, and Rehabilitation Projects
 Guidelines for Integrating Safety and Cost-Effectiveness into Resurfacing, Restoration, and Rehabilitation Projects NCHRP Project 15-50 July 2017 1 Research Objective Develop guidelines for safe and cost-effective
Cross Section Elements
 Chapter Four Cross Section Elements Many of the basic geometric criteria for design of the various cross section elements were described as design standards in Chapter Three. This chapter provides more
DRAFT INTERIM ADVICE NOTE 150/17
 DRAFT INTERIM ADVICE NOTE 150/17 Guidance on Alternative Temporary Traffic Management Techniques for Relaxation Works on Dual Carriageways Summary Guidance for temporary traffic management (TTM), on the
WYDOT DESIGN GUIDES. Guide for. Non-NHS State Highways
 WYDOT DESIGN GUIDES Guide for Non-NHS State Highways 2014 GUIDE FOR Non-NATIONAL HIGHWAY SYSTEM (Non-NHS) STATE HIGHWAYS PRESERVATION REHABILITATION RECONSTRUCTION INTRODUCTION This Guide is directed to
Chapter III Geometric design of Highways. Tewodros N.
 Chapter III Geometric design of Highways Tewodros N. www.tnigatu.wordpress.com tedynihe@gmail.com Introduction Appropriate Geometric Standards Design Controls and Criteria Design Class Sight Distance Design
Engineering Your Community Safe
 Engineering Your Community Safe Andi Bill Transportation Information Center thanks its partners for their support and assistance National Traffic Safety Goal Reasonable goal? Who s Involved? What can you
BUILDING CHINARAP. Zhang Tiejun Research Institute of Highway (RIOH) Beijing, China
 Beijing, China") BUILDING CHINARAP Zhang Tiejun Research Institute of Highway (RIOH) Beijing, China E-mail: tj.zhang@rioh.cn Greg Smith International Road Assessment Programme (irap) Beijing, China E-mail: greg.smith@irap.org
BUILDING CHINARAP Zhang Tiejun Research Institute of Highway (RIOH) Beijing, China E-mail: tj.zhang@rioh.cn Greg Smith International Road Assessment Programme (irap) Beijing, China E-mail: greg.smith@irap.org
SMART STEEL CRASH CUSHION
 APRIL 2015 DETAIL SHEET SMART STEEL CRASH CUSHION VicRoads Requirements Refer to Austroads - Safety Barrier System Acceptance Conditions for the SMART Steel Crash Cushion. All requirements listed by Austroads
Figure 1: Graphical definitions of superelevation in terms for a two lane roadway.
 Iowa Department of Transportation Office of Design Superelevation 2A-2 Design Manual Chapter 2 Alignments Originally Issued: 12-31-97 Revised: 12-10-10 Superelevation is the banking of the roadway along
Access Location, Spacing, Turn Lanes, and Medians
 Design Manual Chapter 5 - Roadway Design 5L - Access Management 5L-3 Access Location, Spacing, Turn Lanes, and Medians This section addresses access location, spacing, turn lane and median needs, including
Roadside Safety Proven Countermeasures. Emmett McDevitt Transportation Safety Engineer Federal Highway Administration
 Roadside Safety Proven Countermeasures Emmett McDevitt Transportation Safety Engineer Federal Highway Administration Safety Statistics On average each year 43,000 + people die in traffic related crashes.
Railroad-Highway Grade Crossing Analysis for Corridor Planning Projects
 Railroad-Highway Grade Crossing Analysis for Corridor Planning Projects Word Count: 4,305 Submission Date: August 1, 2015 Author: Adriana Rodriguez, E.I Assistant Engineer Parsons Brinckerhoff 1420 South
ADOPTION OF EU DIRECTIVE ON ROAD INFRASTRUCTURE SAFETY AND DEVELOPMENT OF ADDITIONAL STANDARDS TO MANAGE SAFETY ON IRELAND S ROADS
 ADOPTION OF EU DIRECTIVE ON ROAD INFRASTRUCTURE SAFETY AND DEVELOPMENT OF ADDITIONAL STANDARDS TO MANAGE SAFETY ON IRELAND S ROADS Desmond O Connor Transport Infrastructure Ireland Parkgate Business Centre,
At each type of conflict location, the risk is affected by certain parameters:
 TN001 April 2016 The separated cycleway options tool (SCOT) was developed to partially address some of the gaps identified in Stage 1 of the Cycling Network Guidance project relating to separated cycleways.
Glossary of Terms. ABANDONMENT The permanent cessation of rail activity on a given line of railroad.
 Glossary of Terms AAR/DOT CROSSING NUMBER A uniform numbering system in which a unique designation is assigned to every highway-rail grade crossing in the nation. It consists of a six digit number followed
CHECKLIST 6: EXISTING ROADS: ROAD SAFETY AUDIT
 CHECKLIST 6: EXISTING ROADS: ROAD SAFETY AUDIT 6.1 Road alignment and cross-section 6.1.1 Visibility; sight distance Is sight distance adequate for the speed of traffic using the route? Is adequate sight
Development of the Technical Standard on the Road Safety Facility For the Asian Highway Networks
 Development of the Technical Standard on the Road Safety Facility For the Asian Highway Networks 2016. 10. 03 UNESCAP 1. Introduction 2. Concept 3. Technical standard (initial version) 4. Amendment UNESCAP
FHWA Safety Performance for Intersection Control Evaluation (SPICE) Tool
 Tool") FHWA Safety Performance for Intersection Control Evaluation (SPICE) Tool Virginia Section ITE Annual Meeting Virginia Beach June 217 Pete Jenior Kittelson & Associates, Inc. 1 Intersection Control Evaluation
FHWA Safety Performance for Intersection Control Evaluation (SPICE) Tool Virginia Section ITE Annual Meeting Virginia Beach June 217 Pete Jenior Kittelson & Associates, Inc. 1 Intersection Control Evaluation
Recently Developed Intersection CMFs. Nancy Lefler, VHB ATSIP Traffic Records Forum, 2014
 Recently Developed Intersection CMFs Nancy Lefler, VHB ATSIP Traffic Records Forum, 2014 Overview General Methodology Treatments Installation of traffic signals - with and without left-turn lanes (NCDOT)
Safety Barrier System Acceptance Conditions SMART Steel Crash Cushion
 Safety Barrier System Acceptance Conditions SMART Steel Crash Cushion The SMART Steel Crash Cushion is accepted for use on the New South Wales classified road network. The acceptance is based on the determination
CHAPTER H ROADSIDE DESIGN GUIDE
 February 2012 ACKNOWLEDGEMENTS PREFACE PART I PRACTICES, GUIDELINES, AND PROCESSES H1 OVERVIEW... H1 1 H1.1 Introduction... H1 1 H1.2 Historical Perspective... H1 2 H1.3 Testing Procedures for Roadside
HSM Practitioners Guide to Urban and Suburban Streets. Prediction of Crash Frequency for Suburban/Urban Streets
 HSM Practitioners Guide to Urban and Suburban Streets Prediction of Crash Frequency for Suburban/Urban Streets Predicting Crash Frequency of Suburban/Urban Multilane Streets Learning Outcomes: Describe
Appendix T CCMP TRAIL TRAFFIC & TRANSPORTATION DESIGN STANDARD
 Appendix T CCMP 3.3.4 TRAIL TRAFFIC & TRANSPORTATION DESIGN STANDARD 3.3.4 Trail Traffic and Transportation Design Multi-use trails have certain design standards, which vary depending on the agency that
Memorandum. Exhibit 60 SSDP To: Jenny Bailey, Senior Planner. From: Bill Schultheiss, P.E. (WA. P.E. #46108) Date: June 20, 2017
 Date: June 20, 2017") Memorandum To: Jenny Bailey, Senior Planner From: Bill Schultheiss, P.E. (WA. P.E. #46108) Date: June 20, 2017 Re: East Lake Sammamish Trail, Segment 2B Review King County has asked Toole Design Group
Memorandum To: Jenny Bailey, Senior Planner From: Bill Schultheiss, P.E. (WA. P.E. #46108) Date: June 20, 2017 Re: East Lake Sammamish Trail, Segment 2B Review King County has asked Toole Design Group
Introduction to Roundabout Analysis Using ARCADY
 Introduction to Roundabout Analysis Using ARCADY Toronto SimCap User Group Technical Event and ITE Toronto Section Social Event July 22, 2014 Phil Weber, P.Eng. GHD Inc. (The Home of Ourston Roundabout
SCHOOL CROSSING PROTECTION CRITERIA
 CITY OF MADISON TRAFFIC ENGINEERING SCHOOL CROSSING PROTECTION CRITERIA January 2016 Adopted as Policy on August 31, 1976, by Common Council by Amended Resolution #29,540 Amended on September 14, 1976,
How passively safe street future is creating safer roads
 Page 17 How passively safe street future is creating safer roads David Milne, editor of Designing Safer Roadsides, a Handbook for Highway Engineers Specifying passively safe street furniture to the European
Performance-Based Approaches for Geometric Design of Roads. Douglas W. Harwood MRIGlobal 3 November 2014
 Performance-Based Approaches for Geometric Design of Roads Douglas W. Harwood MRIGlobal 3 November 2014 Traditional Approaches to Highway Geometric Design Based on established geometric design criteria
10 SHERFORD Town Code
 Key Fixes (Ref: Masterplan Book, section 4a. Land Use Budget and Key Fixes ) The Town Plan designs and allocates buildings, streets and spaces as accurately as possible in the understandable absence of
Road Safety Facilities Implemented in Japan
 Road Safety Facilities Implemented in Japan 1 Road Safety Facilities 1.Guard Fence 2.Road Lighting 3.Other Road Safety Facilities 2 Road Safety Facilities 1.Guard Fence 2.Road Lighting 3.Other Road Safety
D06: European Best Practice for Roadside Design: Guidelines for Roadside Infrastructure on New and Existing Roads
 D06: European Best Practice for Roadside Design: Guidelines for Roadside Infrastructure on New and Existing Roads Project ACRONYM: RISER TITLE: Roadside Infrastructure for Safer European Roads PROJECT
MAY, 2012 MnDOT ROAD DESIGN MANUAL 10-0(1)
") MAY, 2012 MnDOT ROAD DESIGN MANUAL 10-0(1) CHAPTER 10 TRAFFIC CONTROL DEVICES AND TRAFFIC BARRIERS 10-1.0 INTRODUCTION 10-1.01 Vehicle Path 10-1.02 Vehicle Speed 10-1.03 Vehicle Conflict 10-1.04 Operational
MAY, 2012 MnDOT ROAD DESIGN MANUAL 10-0(1) CHAPTER 10 TRAFFIC CONTROL DEVICES AND TRAFFIC BARRIERS 10-1.0 INTRODUCTION 10-1.01 Vehicle Path 10-1.02 Vehicle Speed 10-1.03 Vehicle Conflict 10-1.04 Operational
CHAPTER 1 STANDARD PRACTICES
 CHAPTER 1 STANDARD PRACTICES OBJECTIVES 1) Functions and Limitations 2) Standardization of Application 3) Materials 4) Colors 5) Widths and Patterns of Longitudinal Pavement Marking Lines 6) General Principles
Recommended Roadway Plan Section 2 - Land Development and Roadway Access
 Recommended Roadway Plan Section 2 - Land Development and Roadway Access SECTION 2 Land Development and Roadway Access 2.1 Land Use and Access Management The Federal Highway Administration (FHWA) defines
Country fact sheet South Korea
 ESRA results Country fact sheet South Korea The ESRA project is a joint initiative of research institutes in 25 countries aiming at collecting comparable national data on road users opinions, attitudes
PRACT Predicting Road ACcidents - a Transferable methodology across Europe
 CEDR Transnational Road Research Programme Call 2013: Safety funded by Germany, Ireland, UK and Netherlands PRACT Predicting Road ACcidents a Transferable methodology across Europe Inventory and Critical
TGSI Tactile Ground Surface Indicators
 TGSI Tactile Ground Surface Indicators Introduction: This Design Note, No 11, provides guidelines and requirements for the use and installation of Tactile Ground Surface Indicators (TGSI s). References
1 Monash University Accident Research Centre, Monash University, Victoria, RACV, 550 Princes Highway Noble Park, Victoria, 3174.
 Roadside Environment Safety: a statistical analysis of collisions with fixed roadside objects in Victoria Amanda Delaney 1, Stuart Newstead 1, Bruce Corben 1, Jim Langford 1 and Peter Daly 2 1 Monash University
INTERIM ADVICE NOTE 188/16
 INTERIM ADVICE NOTE 188/16 Guidance on Omission of Warning Lights (Road Danger Lamps) for Relaxation Works on Dual Carriageways Summary Guidance for omission of warning lights (road danger lamps) in temporary
South Carolina Department of Transportation. Engineering Directive
 South Carolina Department of Transportation Engineering Directive Directive Number: ED-22 Effective: December 16, 2009 Subject: References: Purpose: This Directive Applies to: Considerations for Bicycle
Off-Road Facilities Part 1: Shared Use Path Design
 Off-Road Facilities Part 1: Shared Use Path Design Presentation by: Eric Mongelli, P.E. Tom Huber October 9, 2012 FOLLOW THE CONVERSATION ON TWITTER Toole Design Group is live tweeting this webinar @tooledesign
A Traffic Operations Method for Assessing Automobile and Bicycle Shared Roadways
 A Traffic Operations Method for Assessing Automobile and Bicycle Shared Roadways A Thesis Proposal By James A. Robertson Submitted to the Office of Graduate Studies Texas A&M University in partial fulfillment
DEFINITIONS Activity Area - Advance Warning Area Advance Warning Sign Spacing Advisory Speed Approach Sight Distance Attended Work Space
 DEFINITIONS Activity Area - that part of a TTC zone activity area where the work actually takes place. It consists of the work space, traffic space and one or more buffer spaces. Advance Warning Area -
RAILWAY LEVEL CROSSING CHECKLIST Road Safety Review of Railway Crossings
 RAILWAY LEVEL CROSSING CHECKLIST Road Safety Review of Railway Crossings Location: Crossing No. Date of On-Site Inspection: (Day) / / (Night) / / Weather: CHECKLIST 5. - GENERAL TOPICS Level of control
RIGHT TURNS AT INTERSECTIONS: ARE THERE ALTERNATIVES?
 RIGHT TURNS AT INTERSECTIONS: ARE THERE ALTERNATIVES? R.C. Pyke, J.D. Sampson and K.G. Schmid Stewart Scott International, P O Box 784506, Sandton, 2146 TTT Africa, P.O.Box 109, Sunninghill, G.D.P.T.R.W,
2.0 LANE WIDTHS GUIDELINE
 2.0 LANE WIDTHS GUIDELINE Road Engineering Design Guidelines Version 2.0.1 May 2018 City of Toronto, Transportation Services City of Toronto Page 0 Background In early 2014, Transportation Services initiated